high copper selectively alters lipid metabolism … · high copper selectively alters lipid...
TRANSCRIPT
HIGH COPPER SELECTIVELY ALTERS LIPID METABOLISM AND CELL CYCLE MACHINERY IN THE MOUSE MODEL OF WILSON DISEASE
Dominik Huster1,2*, Tina D. Purnat1*, Jason L. Burkhead1, Martina Ralle1, Oliver Fiehn3, Fran-ziska Stuckert2, N. Erik Olson4, Daniel Teupser5, Svetlana Lutsenko1#
1-Department Biochemistry and Molecular Biology, Oregon Health & Science University, Portland, OR 97239; 2-Department of Medicine II and 5-Institute of Laboratory Medicine, Clinical Chemistry and Molecular Diagnostics, University of Leipzig, Leipzig, Germany, 04103; 3-UC Davis Genome
Center, Davis, CA, 95616; 4-VizX Labs, Seattle, WA, 98119 Running title: Metabolic and mRNA Changes in Atp7b-/- mice
Address correspondence to: Svetlana Lutsenko, OHSU, L224, Sam Jackson Park Road, Portland, OR 97239. Tel: 503-494-6953, Fax: 503-494-8393, e-mail: [email protected]. *These authors contrib-uted equally to work. Copper is essential for human physiology, yet in excess it causes severe metabolic disorder Wilson disease. Elevated copper is thought to induce pathological changes in tissues by stimulating the production of reactive oxygen species that damage multiple cell targets. To better understand molecular basis of the dis-ease, we performed genome-wide mRNA pro-filing as well as protein and metabolite analy-sis for Atp7b-/- mice, an animal model of Wil-son disease. We found that at the pre-symptomatic stages of the disease, copper-induced changes are inconsistent with wide-spread radical-mediated damage, likely due to the sequestration of cytosolic copper by metallothioneins that are markedly up-regulated in Atp7b-/- livers. Instead, copper selectively upregulates molecular machinery associated with cell cycle and chromatin structure, and down-regulates lipid metabo-lism, particularly cholesterol biosynthesis. Specific changes in the transcriptome are accompanied by distinct metabolic changes. Biochemical and mass-spectroscopy meas-urements revealed a 3.6-fold decrease of VLDL cholesterol in serum and 33% decrease of liver cholesterol, indicative of a marked decrease in cholesterol biosynthesis. Consis-tent with low cholesterol levels, the amount of activated SREBP-2 is increased in Atp7b-/- nuclei. However, the SREBP-2 target genes are disregulated suggesting that elevated cop-per alters SREBP-2 function rather than its processing or re-localization. Thus, in Atp7b-/- mice elevated copper affects specific cellular targets at the transcription and/or translation levels and has distinct effects on liver meta-bolic function, prior to appearance of histopa-thological changes. The identification of the network of specific copper-responsive targets facilitates further mechanistic analysis of hu-man disorders of copper misbalance.
Introduction Copper plays an essential role in human physi-ology. It serves as a cofactor of key metabolic enzymes and is required for embryonic devel-opment, neuronal myelination, radical detoxifi-cation, and numerous other physiological proc-esses. Mutations in copper-binding proteins have been linked to such devastating disorders as amyotrophic lateral sclerosis, Alzheimer’s disease, prion disease, and Menkes disease. In Wilson disease (WD), the direct link between elevated hepatic copper and development of liver pathology has been firmly established. The disease is caused by mutations of the copper-transporting ATPase ATP7B (Wilson disease protein) (1-3). ATP7B is expressed predomi-nantly in the liver, where it transports copper from the cytosol into the lumen of Golgi net-work for incorporation into ceruloplasmin, a copper-dependent ferroxidase. ATP7B is also required to export excess copper from the liver into the bile; this represents the major excretory route for copper in the body (4). In WD patients, both functions are disrupted, and copper accu-mulates to levels that are 10-20 fold higher than the norm (5). Gradual copper accumulation, most noticeable in the liver, induces marked changes in tissue structure and function. Liver injury is the most common manifestation of WD, although neurological and psychiatric symptoms are also frequently observed (2,4,6). WD patients may show progressive hepatic cir-rhosis, chronic active hepatitis, or rapidly devel-oping liver failure (7). None of these clinical features is specific to WD, complicating its di-agnosis. Remarkably, despite a long history (WD was described in 1912, (8)) and significant progress in characterization of its genetic basis (9-11), the molecular and metabolic changes that accompany initial stages of copper accumu-
1
http://www.jbc.org/cgi/doi/10.1074/jbc.M607496200The latest version is at JBC Papers in Press. Published on January 7, 2007 as Manuscript M607496200
Copyright 2007 by The American Society for Biochemistry and Molecular Biology, Inc.
by guest on April 3, 2019
http://ww
w.jbc.org/
Dow
nloaded from
lation (and may serve as markers of disease progression) remain poorly characterized. The effects of accumulated copper on lipid per-oxidation, enzyme activity, and DNA stability have been reported in both patients and in ani-mal models of WD (12-14), yet it is still unclear which of these manifestations are the primary effects of accumulated copper and which are the longer-term consequences of the disease. Under-standing the initial copper-specific changes is particularly important, not only because detect-ing such changes may serve as a useful diagnos-tic tool, but also because corrective or suppor-tive treatment can be implemented to overcome observed metabolic alterations and further im-prove and supplement copper-chelation therapy. To understand molecular events associated with the early stages of copper overload we have utilized Atp7b-/- mice, an animal model of WD. We have previously shown that these animals accumulate copper to high levels and have sev-eral phenotypic features resembling WD (15). We have also observed that in the 6-weeks-old Atp7b-/- mice, the hepatic copper is at its highest level, yet the pathology is still minimal (15). At this pre-symptomatic stage the changes in gene/protein expression as well as associated metabolic alterations in the liver are likely to represent specific responses to copper. In the present work, we characterize changes in the hepatic mRNAs, proteins, and metabolites in response to copper accumulation in 6-weeks-old Atp7b-/- mice. We demonstrate that the effect of copper is selective and involves distinct meta-bolic pathways, organized in the interconnected network, while oxidative stress is not apparent. The most significant and unexpected are the up-regulation of cell cycle machinery and the down-regulation of cholesterol metabolism; the latter is accompanied by marked decrease of cholesterol in the liver. These novel findings pave the way for detailed mechanistic analysis of WD and other copper-induced pathologies. Experimental Procedures Animals. The generation of the Atp7b mouse has been described previously (16). Mice were maintained on strain C57BL X 129S6/SvEv and female animals of 6 weeks of age were used for microarray and RT-PCR studies. The Atp7band control mice were housed at the OHSU animal facility according to the National Insti-tutes of Health guidelines on the use of labora-
tory and experimental animals. Food and water were provided ad libitum and no further treat-ment was carried out. Animals were euthanized at given time points and livers quickly removed for different tissue preparation.
-/-
-/-
RNA isolation for microarray. Immediately after removal, the liver pieces (~ 75 mg) were frozen in liquid nitrogen and stored until further use. The total RNA was isolated using TRIZOL reagent (Invitrogen) according to manufacturer’s protocol followed by a RNaesy cleanup proce-dure (Qiagen). The integrity of isolated RNA was electrophoretically verified by ethidium bromide staining and by optical densities (OD) ratio (OD260nm/280nm>1.8). A total of 6 liver RNA samples (3 biological replicates for WT and 3 for KO animals) were tested for RNA quality. Each of the 6 sample targets was hybridized to two different MOE430A Affymetrix GeneChip arrays (technical replicates). The Affymetrix chip contained 22691 spots corresponding to 13016 unique Unigene IDs (i.e. unique genes). Chip performance analysis Image processing and analysis were performed using Affymetrix MAS 5.0 software. The resulting intensities and coordinate information were saved in a CEL file format and then subjected to global scaling with an average target intensity of 350 to allow for direct comparison of hybridization values from different targets. Scaled results for each sample were saved as CHP files and these data were used to evaluate overall chip performance (Sup-plementary Table I). The analysis indicated that the parameters describing the quality of RNA, hybridization, and detection were all within ac-ceptable range. The data in CEL format were imported into GeneSifter.net, a microarray data analysis appli-cation, and subjected to RMA normalization using published algorithms (17). The RMA-normalized dataset was then used to identify changed genes and determine the statistical sig-nificance and magnitude of changes (fold change). The significance was established using Wilcoxon t-test with Benjamini and Hochberg adjustment for multiple comparisons. The data was annotated with NCBI Unigene IDs and with related Gene Ontology terms by using the Affy-metrics NetAffx tool (http://www.affymetrix. com/analysis/index.affx) and NIAID-NIH DAVID (http://apps1.niaid.nih.gov/david/). Of the 310 significantly differentially expressed
2
by guest on April 3, 2019
http://ww
w.jbc.org/
Dow
nloaded from
probesets, 304 had Unigene IDs and were anno-tated in mouse Gene Ontology (GO). In a num-ber of cases, when changes in the transcript were detected by more than one probeset, the se-quences of these probesets were manually com-pared to the sequence of the identified transcript to ensure that the probesets indeed mapped to the same gene. The GO analysis was carried out using Gen-Mapp on-line tool (18,19). For each identified GO term, Gene Map z-statistic was calculated. A positive z-statistic for any particular GO term indicated that there were more genes associated with this GO term than it would be expected by random chance. The GO terms with positive z-statistic were then ranked based on the percent of changed genes that belong to the correspond-ing GO compared to the total number of genes on a chip with the same GO. This analysis iden-tified those GO terms that were most strongly represented among the differentially expressed genes (probesets). The results were independ-ently confirmed by applying the GO Browser tool in NetAffx (http://www.affymetrix.com/ analysis/) to the same set of differentially ex-pressed genes. The gene expression data have been submitted to GEO database (GEO number GSE5348) The associations between altered genes or path-ways were further evaluated using the Ingenuity Pathways Analysis software (Ingenuity® Sys-tems, www.ingenuity.com). Affymetrix identifi-ers of the differentially expressed genes (the fold-change of 1.5 or higher) and their corre-sponding expression values were loaded into the software and mapped to its corresponding gene object (so-called focus genes) in the Ingenuity Pathways Knowledge Base. The significance of the associations between the data set and the canonical pathway and functional annotations was calculated in two ways. First, the number of genes from the data set that map to the pathway was divided by the number of all known genes ascribed to the pathway. Second, the left-tailed Fischer's exact test was used to calculate related p-values and distinguish those func-tional/pathway annotations which had more Fo-cus Genes than expected by chance. The net-works of the focus genes were algorithmically generated based on their connectivity. Real-time PCR (RT-PCR). Total RNA was ex-tracted from livers of 4-weeks-old, 6-weeks old
and 32-weeks-old WT and KO mice (n=6 per group) and checked for integrity as described above. One-step RT–PCR was performed with a
LightCycler instrument (Roche) in a total vol-ume of 20 µl containing 50 ng of total RNA, 0.5 µM each primer, LightCycler RT–PCR Reaction Mix SYBR Green I (1x) and LightCycler RT–PCR Enzyme Mix (Roche). Reverse transcrip-tion was performed at 50°C for 20 min. The denaturation and amplification conditions were 95°C for 15 sec followed by up to 35 cycles of PCR. Each cycle of PCR included denaturation at 95°C for 15 sec, then 10 sec of primer anneal-ing at 55°C and 20 sec of extension/synthesis at 72°C (20 sec). The temperature ramp was 20°C/sec, except when heating to 72°C, when it
was 2°C/sec. At the end of the extension step fluorescence of each sample was measured to allow quantification of the RNA. After amplifi-cation a melting curve was obtained by heating
at 20°C/s to 95°C, cooling at 20°C/sec to 60°C
and slowly heating at 0.1°C/sec to 90°C with fluorescence data collection at 0.1 °C intervals. RT-PCR primers for the internal standard glyceraldehyde-3-phosphate dehydrogenase gene (GAPDH) and the target genes were de-signed using OmigaTM software (Oxford Mo-lecular, Oxford, United Kingdom). Gene se-quences were taken from https://www. affy-metrix.com/analysis/netaffx/index.affx based on Affymetrix ID and Unigene number. Primer design followed standard criteria; the complete list of primers is given in the Supplementary Table II. For selected genes QuantiTect® Primer Assays (Qiagen) were used (Supplementary Table II). Product identity was confirmed by separation on agarose gel and ethidium bromide staining. The abundance of target mRNA was calculated in relation to the GAPDH mRNA in the same sample. The amount of target mRNA in Atp7b-/- mice relative to the wild-type mice was quantified using the 2∆∆ct method (20). Human liver samples were obtained from 8 Wil-son disease patients who underwent liver trans-plantation and 8 control livers from other pa-tients who underwent liver resection. The study was approved by the institutional ethics commit-tee of the University of Leipzig (registration number 236-2006) and followed ethical guide-lines. RNA from small liver samples was iso-lated as described above. cDNA was synthesized from 2 µg RNA by reverse transcription with SuperScript II Rnase H- reverse transcriptase
3
by guest on April 3, 2019
http://ww
w.jbc.org/
Dow
nloaded from
(Life Technologies) and random hexamer prim-ers. Gene expression was determined by quanti-tative fluorogenic RT-PCR (ABI PRISM SDS 7900, Applied Biosystems). Primers and probes were selected to span two exons in order to pre-vent amplification of genomic DNA (Supple-mentary Table II). The PCR was prepared in a final volume of 12.5 µl of a reaction mixture containing 2.5 µl cDNA (diluted 1:15), 5 mM MgCl2, 1.25 µl 10x AmpliTaq buffer A, 200 µM dNTP (each), 0.3 U AmpliTaq Gold (Applied Biosytems), 200 nM FAM labeled oligonucleo-tide probe, and 900 nM of each oligonucleotide primer. The cycling conditions were: 95°C, 10 min and 40 two-step cycles of 95°C, 15 sec; 60°C, 1 min. Standardization was performed using serial dilutions of linearized plasmid cDNA ranging from 10 to 107 copies. Data were analyzed with the ABI PRISM software. The mRNA expression results are given as the fold change of LDL-receptor compared to control and for HMG-CoA reductase as the copy num-ber normalized to 106 copies of beta actin. Analysis of soluble proteins by two-dimensional gel electrophoresis. The liver tissue (50-100 mg wet weight) from control and Atp7b-/- mice was homogenized in 800 µl buffer containing 10mM HEPES, 10 mM NaCl, 1 mM KH2PO4, 5 mM NaHCO3, 5 mM EDTA, 1 mM CaCl2, and 0.5 mM MgCl2 using a glass Dounce homogenizer with tight pestle. Soluble proteins were obtained by centrifuging samples at 100,000 x g for 30 min and collecting the supernatant. The lipids at the top of the supernatant were removed using a 0.22 µm centrifugal filter device (ultrafree-MC, Millipore). The soluble proteins were precipi-tated by adding 4 volumes of ice-cold acetone, 1 mM HCl. The mixture was vortexed, incubated at -20°C for 1 hour, proteins pelleted by cen-trifugation at 15,000g for 10 min, and the pellet air dried for 5 min. Pellets were then dissolved by vortexing in 8 M urea and protein content determined using a BCA assay (Pierce, Rock-ville, IL). 0.17 ml of this solution containing 2 mg of protein was mixed with 0.17 ml of 8M urea, 4% CHAPS, 100 mM DTT, 4% glycerol, and 4% pH 3-10NL IPG buffer (Amersham, Biosciences, Piscataway, NJ). This solution was used for overnight reswelling of 18 cm pH 3-10NL IPG strips (Amersham). The strips were focused using a Protean IEF Cell (Bio-Rad, Her-cules, CA) under the following conditions: 20°C, 0-500V for 6h (rapid), 500-3500V for 3h (lin-ear), 3500V for 8 h, with a 50 mA limit per gel.
Following isoelectric focusing the strips were reduced, alkylated, and the second dimension separation performed using 12% gels. Gels were stained with Coomassie G-250 as previously described (21). Protein identification by mass-spectrometry. The spots of interest were excised from Coomassie-stained gels, washed twice with doubly deion-ized water and then twice with 50% (v/v) 50 mM NH4CO3, 50% acetonitrile. The gel pieces were then incubated in 100% acetonitrile for 2 min after which the liquid was removed and the pieces air dried until white in appearance. Rehy-dration of the gel pieces was performed with digestion buffer containing 0.01 µg/µl trypsin (Princeton), 50 mM NH4CO3 and 50 mM CaCl2 followed by the addition of 60 µl of the same buffer without trypsin and incubation at 37ºC overnight. The reaction was stopped by adding 3 µl of 98% formic acid (Aldrich) to ~60 µl of digest. A 45 µl aliquot was analyzed by liquid chromatography electrospray ionization tandem mass spectroscopy (LC-MS) using an ion trap mass spectrometer (LCQ Deca XP Plus, Thermo Electron Corporation). The analysis by LC-MS was performed using a capillary 180 µm x 12 cm column packed in house with stable-bond C18 packing material (5 µm, ZORBAX, Agilent Technologies). The samples were applied to the column through a trap column (180 µm x 2.5 cm, packed in house with the same packing ma-terial as above) and the peptides separated using a linear gradient changing the solvent composi-tion from 2% acetonitrile to 30% acetonitrile over a 30 min period with a constant flow rate of 1.5 µl/min. MS data were acquired in data de-pendent mode in which a single survey scan (MS) was followed by up to 4 sequential data-dependent MS/MS scans on the 4 most intense peptide ions. A dynamic exclusion feature was used to extend the analysis to less abundant ions. The peptides were identified using SEQUEST (22), from within the Trans Proteomic Pipeline (TPP, V2.71) (23). Scaffold (Proteome Software, Portland, Oregon, USA) was used to analyze protein identifications derived from MS/MS sequencing results. Scaffold validates peptide identifications using PeptideProphet (24) and derives corresponding protein probabilities using ProteinProphet (25). Proteins were considered as “identified” when probability scores were ≥0.99 (protein) and ≥0.90 (peptide) with a minimum of 2 peptides identified.
4
by guest on April 3, 2019
http://ww
w.jbc.org/
Dow
nloaded from
Serum analysis. Blood was collected by cardiac puncture and serum was separated by centrifuga-tion after blood coagulation and used immedi-ately for analysis. Serum lipids were quantified after isolation by sequential centrifugation as previously described (26). Metabolic profiling of liver tissue. 2 mg of fro-zen tissue was homogenized for 30 sec in a MM301 ball mill (Retsch, Germany). Extraction was carried using 1 ml of a one phasic mixture of isopropanol:acetonitrile:water (3:3:2, v/v/v) at -20ºC for 5 min. After centrifugation, the super-natant was completely dried in a SpeedVac con-centrator and then derivatized in two steps. First, carbonyl functions were protected by methoxi-mation using 20 µl of a 40 mg/ml solution of methoxyamine.hydrochloride in pyridine at 28ºC for 30 min. Then, samples were derivatized us-ing 180 µl N-methyl-N-trimethylsilyltrifluoro-acetamide (MSTFA, Macherey-Nagel, Dueren, Germany) at 37ºC for 30 min to increase the volatility. 0.5 µl of this solution was injected into an automatic liner exchange system unit (ALEX, Gerstel, Germany) at a 1:5 split ratio. For every sample, a fresh liner was used to avoid sample carryover. Each liner was deactivated and cleaned using a blank MSTFA injection followed by a flash heat ramp. The sample was introduced at 50ºC using a MPS injector (Ger-stel, Germany) and heated to 250ºC using a 5ºC/min ramp. An Agilent 6890 gas chromatography oven (Hewlett-Packard, Atlanta, GA, USA) was cou-pled to a Pegasus IV time of flight (TOF) mass spectrometer from Leco (St Joseph, MI, USA). A rtx5-SilMS fused silica capillary column (Restek, USA) of 30 m length, 0.25 mm I.D. and 0.25 µm film thickness was used for separation with the 0.25 mm I.D. 10 m IntegraGuard col-umn without film. For the analysis the gas chro-matography oven was set to 85°C with duration of 210 seconds and a following ramp of 20°C/min. The target time was 330°C with dura-tion of 5 minutes. The transfer line temperature was set to 250°C. Mass spectra were acquired with a scan range of 83-500 m/z and an acquisi-tion rate of 20 spectra/sec. The ionization mode was electron impact at 70 eV. The temperature for the ion source was set to 250°C. Chroma-togram acquisition, data handling, automated peak deconvolution, library search and retention index calculation was done by the Leco Chro-maTOF software (v2.32) using an in-house cus-
tom mass spectral library for compound identifi-cation. Analysis of mature SREBP-2 in nuclear extracts. Nuclear extracts were prepared essentially as described by Sheng et al (27). Mouse livers (~0.7 to 1.0 g) were homogenized in 3 volumes of Buffer 1 (10 mM HEPES pH 7.6, 25 mM KCl, 0.15 mM spermine, 0.5 mM spermidine, 1.0 mM EDTA, 2.0 M sucrose, 10% glycerol, 1.0 mM DTT and Complete Protease Inhibitor Cocktail (Roche, Nutley, New Jersey)) by six passes of a motor-driven Potter-Elvejiem ho-mogenizer. Homogenate was layered over 1.0 ml Buffer 1 and centrifuged for 45 minutes at 30,000 RPM in a Beckman SW50 rotor. The supernatant was removed and pelleted nuclei were resuspended in 10 mM HEPES pH 7.6, 25 mM KCl, 0.15 mM spermine, 0.5 mM sper-midine, 1.0 mM EDTA, 1.0 mM EGTA, 20% glycerol, 1.0 mM DTT, Complete Protease In-hibitor Cocktail. The suspension was centri-fuged for 5 minutes at 2000g, 4°C. Pelleted nu-clei were resuspended in 10 mM HEPES pH 7.6, 100 mM KCl, 2.0 mM MgCl2, 1.0 mM EDTA, 10% glycerol, 1.0 mM DTT, Complete Protease Inhibitor Cocktail. The one-tenth volume of 4.0 M ammonium sulfate (pH 7.9) was added and the mixture was placed on a rocking shaker at 4°C for 45 minutes. The samples were then cen-trifuged at 20,000g at 4°C for 15 minutes. The supernatant contained nuclear extract. 10.0 µg of nuclear extract was then separated on a 7.5% gel Laemmli gel. Proteins were transferred to nitro-cellulose in 10 mM CAPS pH 11.0, 10% metha-nol. The membrane was blocked overnight in 50% Aquablock (EastCoastBio, North Berwick, Maine). Anti-SREBP2 (Affinity Bioreagents, Golden, CO) was used at 1:5,000 dilution and IRDye800-conjugated goat-anti-rabbit (Rock-land Immunochemicals, Gilbertsville, Pennsyl-vania) was used at 1:20,000 dilution. Washes after both primary and secondary antibodies were in PBS supplemented with 0.1% (wt/vol) SDS, 1% (vol/vol) Nonidet P-40, and 0.5% so-dium deoxycholate as described in Sheng, et al (27). Immunodetection was visualized with an Odyssey infrared scanner (LI-COR, Lincoln, Nebraska). Results Evaluation of the quality of the array data. To characterize molecular consequences of hepatic copper accumulation in the Atp7b-/- (KO) mice, we initially performed a comparative genome-
5
by guest on April 3, 2019
http://ww
w.jbc.org/
Dow
nloaded from
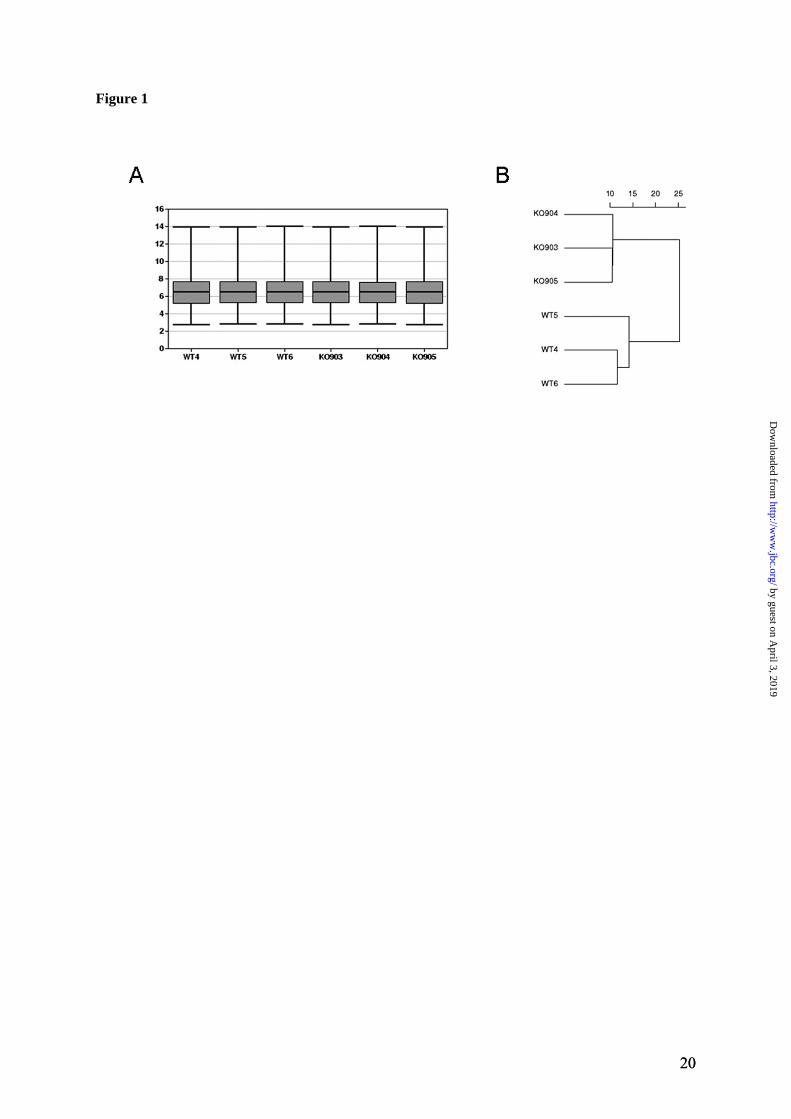
wide analysis of transcripts isolated from livers of 6-weeks-old animals. At this age, the copper concentration in livers was elevated approx-mately 18-fold compared to control, but little if any pathology could be detected histologically (data not shown, see also (15)). The mRNA was isolated from three of each control (WT) and Atp7b-/- livers (biological replicates), and for each of these samples two technical replicates were run. (Thus, the total number of samples used for hybridization with the Affymetrix ar-rays was 12). The quality of generated data was initially verified by scatter plots, in which the overall distribution of normalized signal intensi-ties was plotted for each pair of the biological replicates (Supplementary Figure 1). The signal intensities in all scatter-plots fell along a 45-degree straight line in a symmetrical fashion, indicating that the data sets were appropriate for further analysis. More detailed pair-wise com-parison revealed larger difference in signal dis-tribution between the WT and KO samples com-pared to replicate samples (WT versus WT or KO versus KO) (Supplementary Fig.1, insert). This result provided first indication that there is a difference in gene expression between the con-trol and Atp7b-/- livers even at the presympto-matic stage of disease. This conclusion was con-firmed by quantitative evaluation of the data. The mean values, the range of signal intensities, and the patterns of mRNA signal distribution were compared for all WT and KO samples. These studies demonstrated that the mean and the range of signal amplitudes were very similar for all samples (Figure 1A). However, the indi-vidual patterns of mRNA signal intensities fell into two distinct groups (WT and KO) corre-sponding to the sample genotype; the similarity between the members within each group was higher than between the groups (Figure 1B). Altogether, the results in Figure 1 and Supple-mentary Figure 1 demonstrated that the differ-ence in the distribution of mRNA intensities between the WT and KO samples could be relia-bly attributed to the actual change in the individ-ual gene expression rather than be caused by non-specific variations between samples. Copper accumulation alters the abundance of the limited number of transcripts. To identify significantly changed genes, a pair-wise analysis of the data sets was performed using Wilcoxon t-test. The resulting p-value was adjusted for mul-tiple comparisons by the method of Benjamini
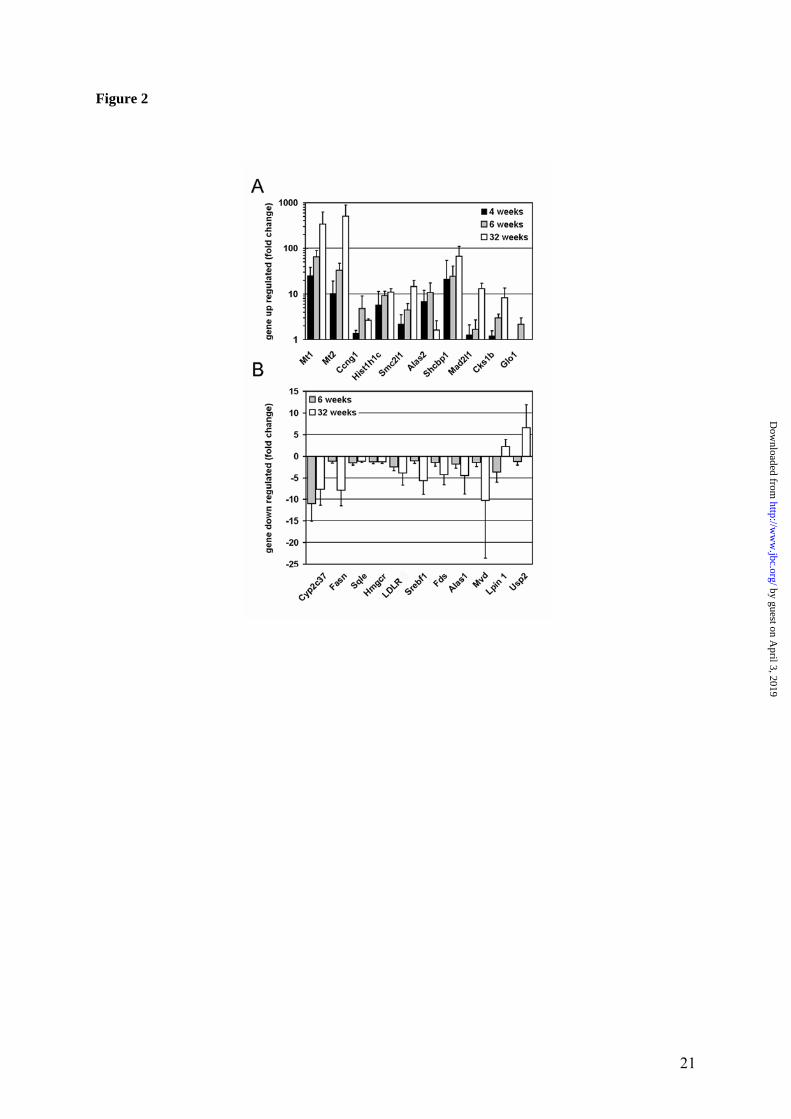
and Hochberg and then used to determine the significance of changes. Using the 2 fold-change cut-off and the adjusted p-value <0.05, 31 unique transcripts were found to be up-regulated (Table 1) and 45 down-regulated (Table 2). Among those, 15 transcripts were identified repeatedly as they were represented on the chip by more than one probe set (Tables 1, 2). Re-peated identification and similar fold-change for these mRNAs provided an additional internal control and increased confidence in the results. The magnitude of changes as detected by the arrays was not very large. The H19 fetal liver mRNA was the most highly up-regulated (5.7 fold), and the cytochrome P450 and putative acireductone dioxygenase 1 were the most down-regulated (both about 5.4 fold). Several significantly changed mRNA were found to encode proteins with unknown function (Sup-plementary Table III). For example, mRNA for the hypothetical protein LOC381280 was up-regulated more than 3 fold, suggesting a role for this protein in cell’s response to copper accumu-lation. BLAST analysis revealed limited homol-ogy between LOC381280 and proto-oncogene tyrosine-protein kinase Fes/Fps (C-Fes), an im-portant regulator of cell growth and differentia-tion. Other up-regulated uncharacterized tran-scripts included those encoding selenoprotein H, which may have red/ox activity (28) and protein C6orf139, a homologue of non-muscle myosin (both increased more than 2 fold). Two novel transcripts were down-regulated. The product of cDNA clone MGC:118117 has an unusual pI of 11.23 and could be a nuclear protein. Another down-regulated transcript (more than 5 fold decrease) encodes product with similarity to the hypothetical mouse protein XP_918805. Verification of the array data using quantitative real-time PCR (RT-PCR). To verify the results of oligonucleotide arrays, the RT-PCR analysis was performed for 21 transcripts encoding pro-tein with known function (10 up-regulated and 11 down-regulated; for the list of RT-PCR prim-ers see Supplementary Table II). The transcripts were selected to represent different metabolic pathways (proteins involved in cell cycle, meta-bolic enzymes, metalloproteins) and different fold change. Altogether, we observed good cor-relation with respect to the direction of the change (up or down) (Figure 2). For example, 9 out of 10 tested transcripts, which were pre-dicted to be up-regulated by the arrays, showed
6
by guest on April 3, 2019
http://ww
w.jbc.org/
Dow
nloaded from
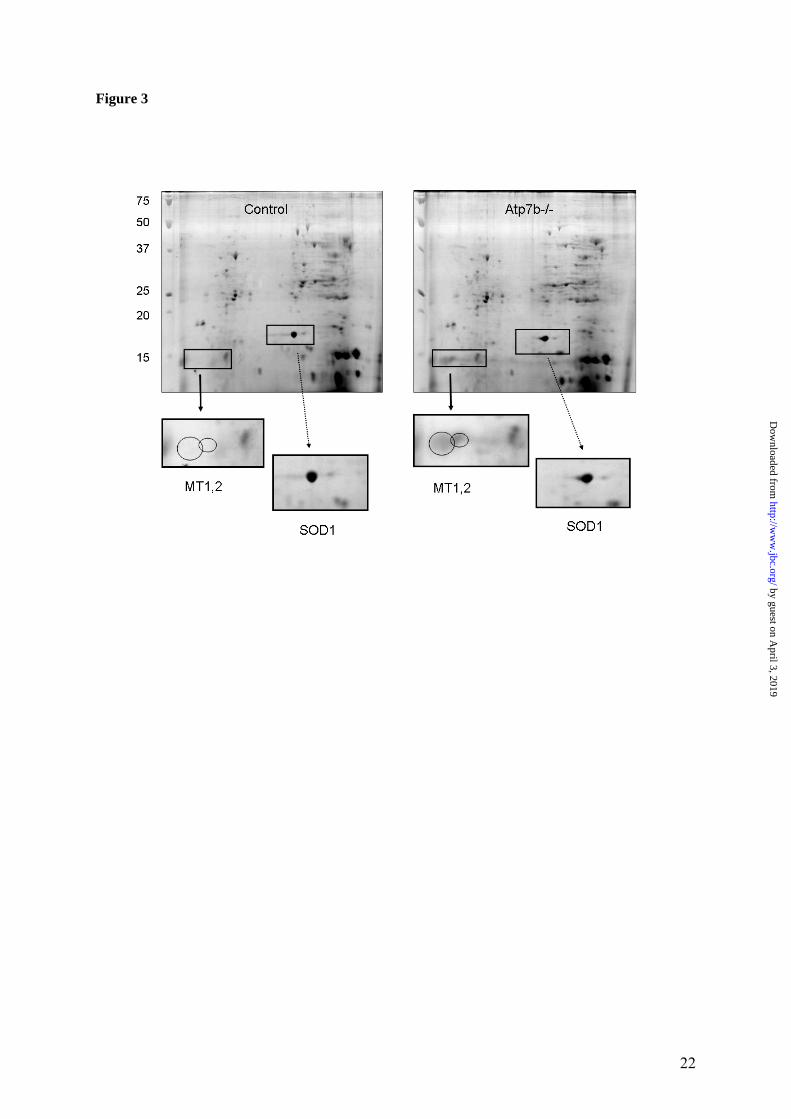
significant increase by RT-PCR, with the 10th transcript also showing increase, but less signifi-cant (Figure 2A). Down-regulated transcripts also consistently showed decrease in the RT-PCR analysis, although for 4 out of 11 examined transcripts, the change was small and/or not statistically significant (Figure 2B). Weaker agreement between the array and RT-PCR data for the down-regulated transcripts could be due to metabolic nature of their products and possi-ble nutritional influences (see discussion). In general, the magnitude of changes for all signifi-cantly altered transcripts (up or down) was larger in RT-PCR analysis compared to the oligonu-cleotide array, which is commonly observed in such type of experiments. To further verify the physiological significance of the observed changes, the RT-PCR measure-ments were performed using samples from younger (4-weeks-old) and older (32-weeks old) animals. As shown in Figure 2A, for the up-regulated transcripts the increase in the mRNA levels was also observed at the earlier time point and, for 7 out of 10 samples, even higher in-crease in the amount of transcript was detected in older animals. Similarly, comparable or larger change at older age was observed for 5 out of 7 down-regulated genes (the younger animals for this group of transcripts have not been ana-lyzed). Importantly, for 3 out of 4 down-regulated transcripts that showed small or non-significant change at 6 weeks, very significant change was detected at the later time point points (Figure 2B) confirming the involvement of the corresponding genes in hepatic response to copper. Correlation between the extent of changes in the transcriptome and proteome The relatively small number of transcripts that was changed in response to copper accumulation pointed to specific effects of copper on gene expression/mRNA stability and presumably on liver proteins. To independently evaluate the magnitude of copper-induced changes in the liver proteome, the patterns of soluble proteins from control and Atp7b-/- livers were compared using 2-dimensional gel (2D-gel) electrophore-sis. The overall protein patterns for control and Atp7b-/- samples were very similar (Figure 3), consistent with the limited effect of copper on liver transcriptome. Several changes, however, were detected. The most obvious change was a marked increase in the amount of small proteins
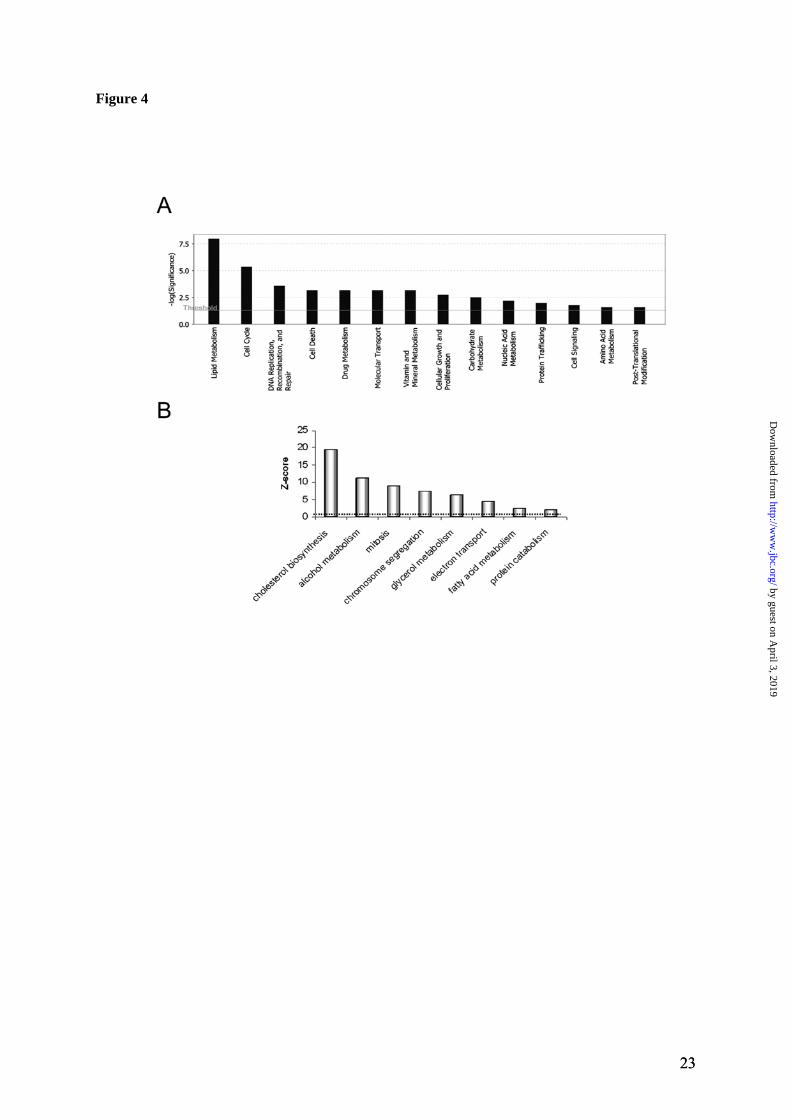
with the apparent molecular mass of 15 kDa in the KO samples (Figure 3). Mass-spectrometry analysis identified these proteins as metal-lothioneins 1 and 2. This finding was in full agreement with the results of arrays and RT-PCR, both of which showed significant up-regulation of metallothioneins 1 and 2 (Table 1 and Figure 2). Copper-induced formation of reactive oxygen species and resultant oxidative stress have been discussed in the literature as major factors in the development of WD pathology. Therefore, one of the unexpected outcomes of our gene array experiments was the apparent lack of significant changes in protein machinery associated with oxidative stress. No change in mRNA level was detected for either catalase or copper zinc-dependent superoxide dismutase (SOD1), the key enzymes involved in peroxide and superox-ide detoxification. Also, no up-regulation was detected for the heat shock proteins. Similar lack of changes was observed at the protein level, when SOD1 was examined. SOD1 is an abun-dant liver protein with known behavior on 2D gels (http://us.expasy.org/cgi-bin/map2/def? LIVER_MOUSE). It was easily detectable in our soluble samples (Figure 3) and we confirmed the identity of SOD1 by mass-spectrometry. No change in the amount of SOD1 in the Atp7b-/- liver was observed, supporting the results of the array experiments. The significantly changed genes belong to spe-cific metabolic pathways. While none of the utilized methods provides exhaustive coverage of either mRNA or proteins, altogether the gene array, RT-PCR, and protein analysis were con-sistent in showing that the effects of copper were restricted to a rather small population of mRNA/proteins. These limited changes sug-gested that specific metabolic pathways could be altered. To test this hypothesis, the gene ontol-ogy analysis was carried out initially for genes changed more than 2 fold (Tables 1 and 2) and subsequently, for genes with more than 1.5 fold change (total 310 significantly changed probes; 137 up and 173 down-regulated, see Supplemen-tary Table IV). This second analysis was per-formed to account for the possibility that the actual fold change in mRNA abundance could have been significantly higher than that meas-ured by the oligonucleotide arrays (see RT-PCR data). In both cases, the analysis of changed genes using different software packages (Gen-
7
by guest on April 3, 2019
http://ww
w.jbc.org/
Dow
nloaded from
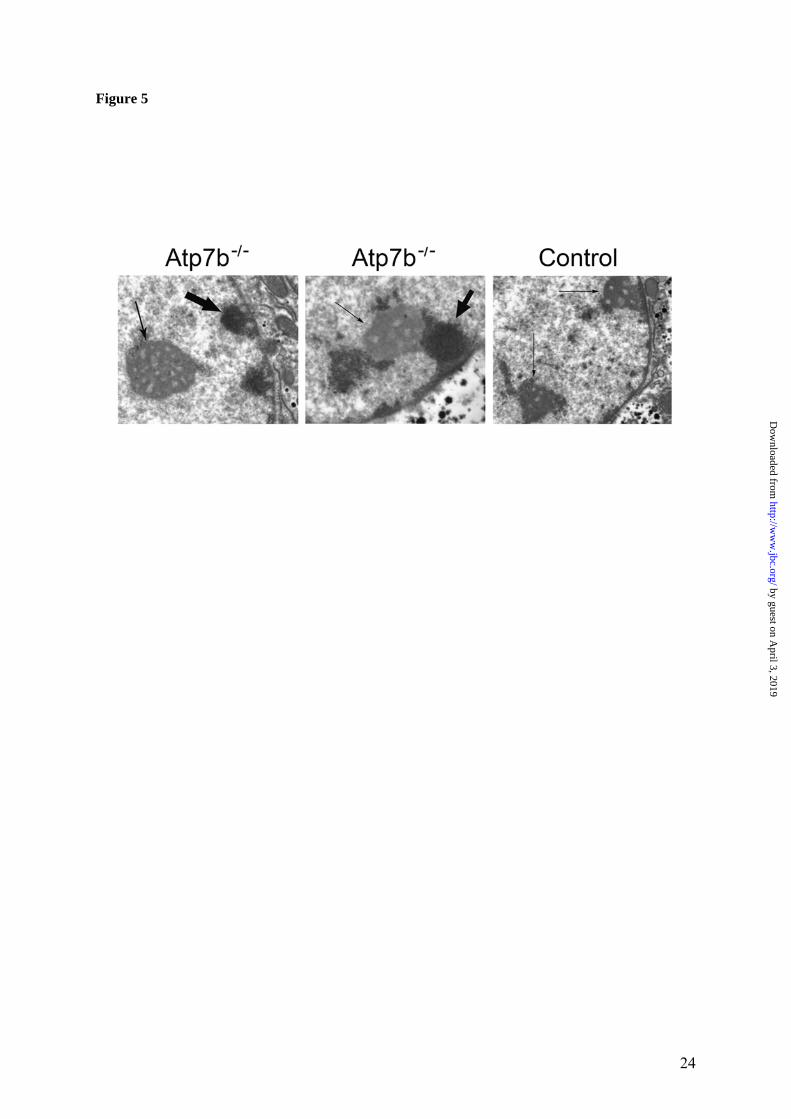
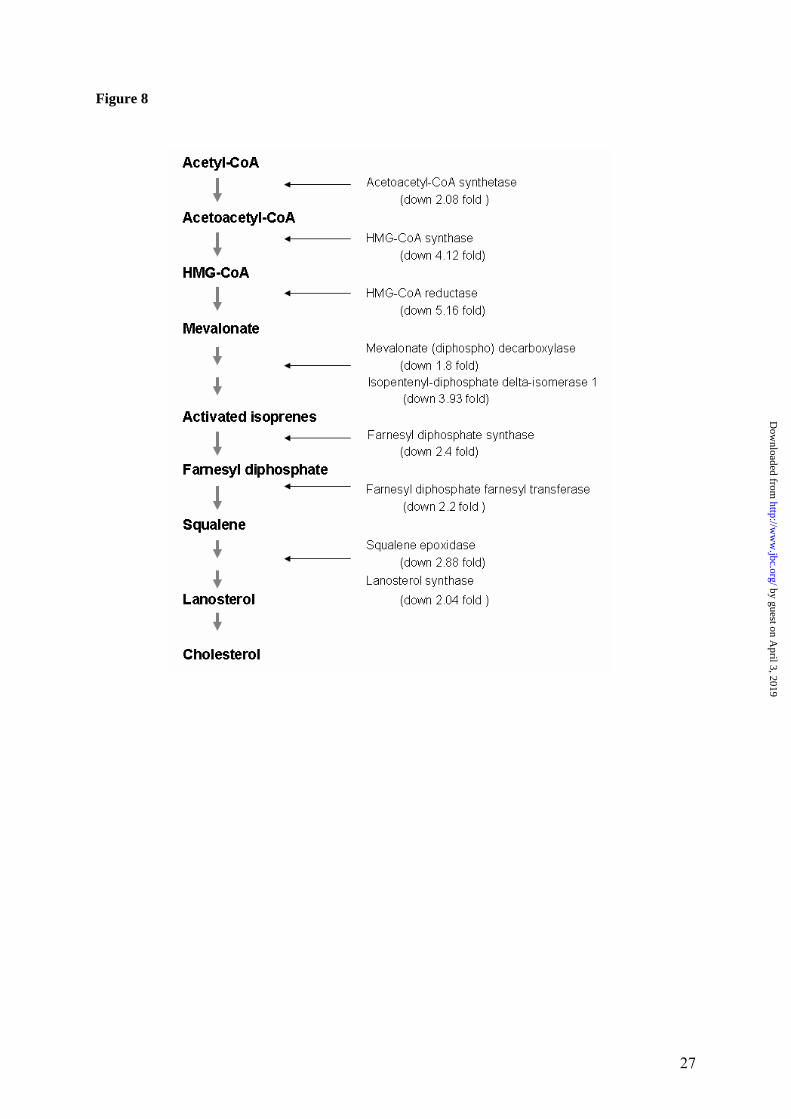
Mapp, GeneSifter, NetAffx, or Ingenuity Path-way Analysis) identified the same gene ontology terms as mostly affected by copper accumulation (Figure 4). Consistently, the genes associated with mitotic cell cycle and lipid metabolism, particularly cholesterol biosynthesis, were among the most changed (Figure 4). Steroids, glycerol and alco-hol metabolism as well as electron transport were also altered, while the transcripts encoding proteins involved in nucleic acid metabolism, amino-acid or carbohydrates metabolism were much less, if at all, affected. (The complete list of the significantly changed GO terms is shown in Supplementary Table V). The detailed hierar-chical analysis of significantly changed GO terms also demonstrated that the up-regulated pathways were distinct from the down-regulated pathways and largely non-overlapping. By far, the largest fraction of up-regulated tran-scripts is associated with cell cycle; more spe-cifically, with the regulation of mitosis, includ-ing chromosome segregation (Figure 4, Supple-mentary Table VI). These include SMC2 and SMC4 (structure chromosome maintenance), cyclins G1 and G2, CDC20 and CDC28 protein kinases (for complete list see Supplementary Table VI). The examination of hepatic nuclei from two pairs of WT and KO animals using electron microscopy showed that Atp7b-/- nuclei frequently contain electron-dense material that is less apparent in control nuclei (Figure 5). This result pointed to structural and possibly func-tional changes in nuclear components of Atp7b-/- hepatocytes. By contrast, the down-regulated transcripts were mostly associated with lipid metabolism and particularly cholesterol biosynthesis (Figure 4, Table 2, Supplementary Table VI). These in-clude both the biosynthetic enzymes, as well as regulatory proteins. For example, mRNA for 9 proteins involved in cholesterol biosynthesis were all significantly down-regulated; these include cholesterol 7-alpha-monooxygenase, farnesyl-diphosphate farnesyltransferase, HMG-CoA-reductase, lanosterol synthase and others. The mRNA levels for main transcription factors controlling lipid and fatty acid synthesis and oxidation, such as sterol regulatory element binding protein-1c and peroxisome proliferator-activated receptor-alpha (PPARalpha) were de-creased, although less strongly. Similarly, the
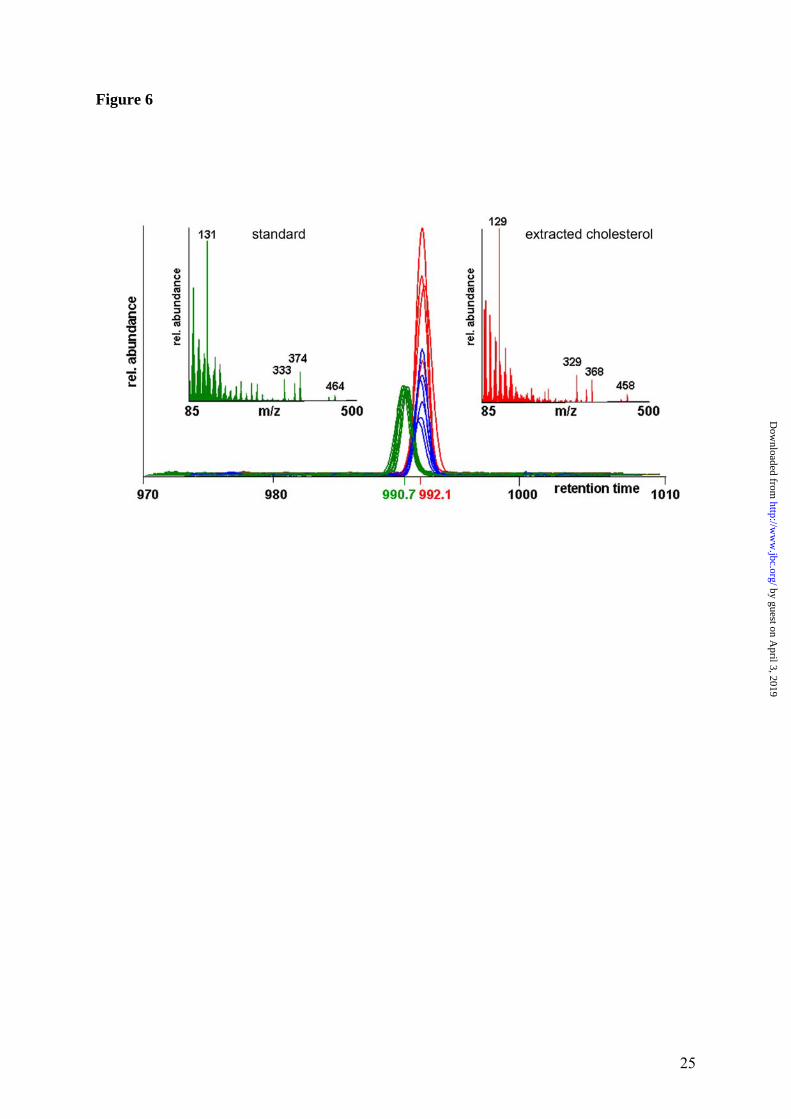
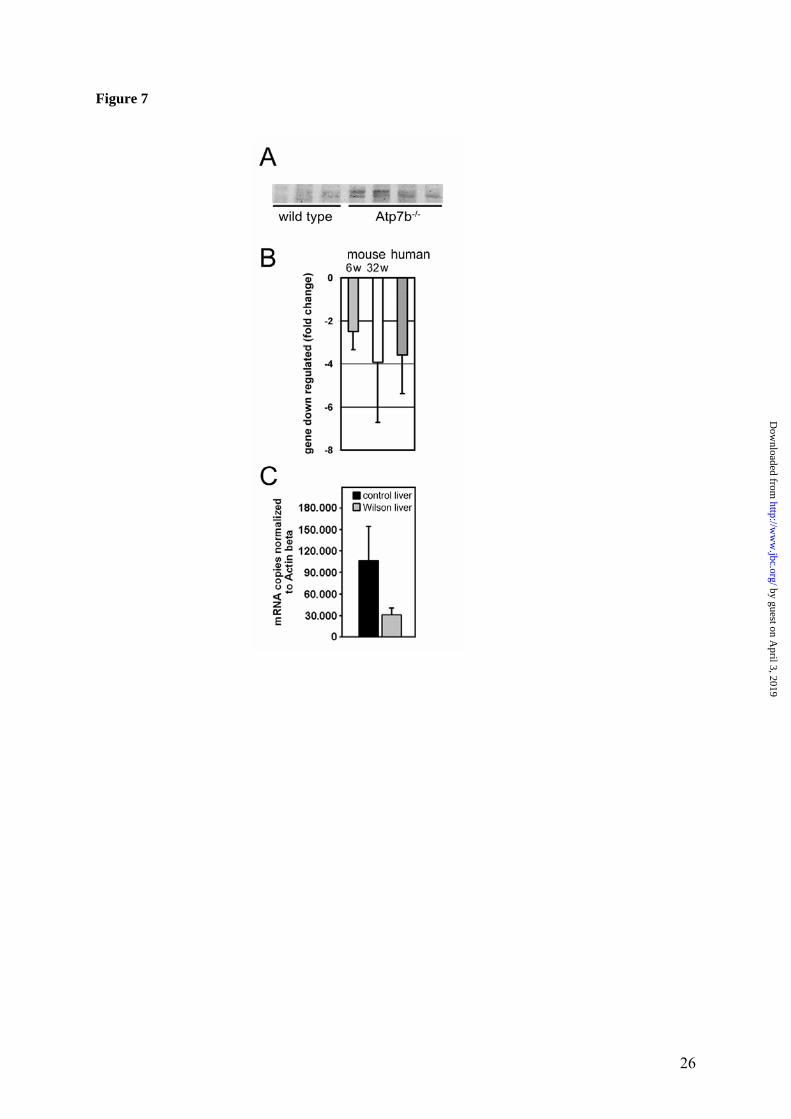
mRNA for SPOT14 homologue (which can be involved in regulating the triglyceride pool and overall efficiency of de novo lipid synthesis (29) was down-regulated. The concentration and distribution of cholesterol are markedly changed in Atp7b-/- mice. The notable disregulation of genes associated with lipid metabolism strongly suggested significant changes in the levels of metabolites and particu-larly cholesterol in Atp7b-/- mice. This was con-firmed by measurements of metabolite concen-trations in the serum (Table 3). Significant de-crease in the amount of triglycerides and choles-terol was detected; the latter was due to a de-crease of HDL- and VLDL-cholesterol, while LDL-cholesterol remained unchanged. The VLDL fraction was the most affected showing a 3.6-fold reduction in cholesterol concentration. This marked change of VLDL fraction suggested decreased cholesterol synthesis in the Atp7b-/- liver. Analysis of cholesterol in tissues using mass-spectrometry demonstrated that liver cho-lesterol was indeed markedly decreased (by 33%, p value = 0.014) in all Atp7b knockout samples (Figure 6). Copper does not inhibit maturation or nuclear re-localization of SREBP-2. To better under-stand how elevated copper induces such marked down-regulation of cholesterol metabolism, we compared the amount of activated sterol regula-tory binding-protein 2 (SREBP-2) in hepatic nuclei of control and Atp7b-/- mice. SREBP-2 is a transcription factor that plays a key role in regulation of cholesterol biosynthesis. It is pre-sent in the inactive form in the endoplasmic reticulum; activation of SREBP-2 is controlled by the intracellular levels of cholesterol. When cholesterol is low, SREBP-2 is escorted to Golgi and then proteolitically cleaved. The mature 50 kDa product is released from the membrane, translocates to the nucleus and binds to the sterol regulatory elements, stimulating cholesterol biosynthesis and restoring intracellular levels of cholesterol. We have reasoned that elevated copper may inhibit SREBP-2 maturation or re-localization of activated SREBP-2 into the nuclei, thus blocking cholesterol biosynthesis. However, Western blot analysis of SREPB-2 in nuclear extracts from control and Atp7b-/- livers indicate that mature SREBP-2 is produced and present at higher lev-els in the nuclei of Atp7b-/- mice (Figure 7A).
8
by guest on April 3, 2019
http://ww
w.jbc.org/
Dow
nloaded from
The SREBP-2 target genes are misregulated in Atp7b-/- mice and in human Wilson disease liv-ers. To evaluate SREBP-2 activity we measured the amount of mRNA for low density lipoprotein receptor (LDLR). The transcription of LDLR gene is directly controlled by SREBP-2 via sterol binding element 1 and is expected to be up-regulated in response to increased nuclear SREBP-2 (30,31). Figure 7B illustrates that de-spite high levels of mature SREBP-2 in Atp7b-/- nuclei, the amount of LDLR mRNA was signifi-cantly lower in KO samples compared to con-trol. These data suggested that elevated copper inhibits SREBP-2 function in Atp7b-/- livers. To verify the relevance of these observations to human disease we compared the LDLR mRNA levels in liver samples from Wilson disease pa-tients and control patients. The LDLR mRNA was significantly down-regulated (3.6 fold) in Wilson disease liver in agreement with observa-tion in Atp7b-/- livers (Figure 7B). HMG-CoA reductase, which plays a central role in cholesterol biosynthesis, is another important target of SREBP-2 that was down-regulated in Atp7b-/- mice (Table 2). Analysis of human HMG-CoA reductase mRNA by real-time PCR demonstrated that HMG-CoA reductase tran-script levels were markedly down-regulated (3.4 fold) in Wilson disease livers compared to con-trol (Figure 7C). Discussion In this work, we have utilized the Atp7b-/- mice, an animal model for Wilson disease, and charac-terized changes in the transcriptome, proteome, and important metabolites associated with cop-per accumulation in the liver. We show that prior to development of obvious histopathology ac-cumulated copper has a distinct and selective effect on liver gene expression and metabolism. We conclude that the disregulation of lipid me-tabolism and changes in the cell cycle machinery characterize presymptomatic stages of WD, while oxidative stress plays a minor role. Com-parison of copper-induced mRNA changes with published mRNA profiles of liver responses to various stresses (32-35) illustrates that the over-all pattern of changes in response to copper ac-cumulation (i.e. the combination of most altered pathways) is distinct.
The up-regulated pathways. While a large in-crease in the amount of metallothionein in re-sponse to copper accumulation was anticipated, the up-regulation of genes associated with cell cycle and chromosome structure was unexpected and very interesting. The up-regulated SMC2 and SMC4 mRNAs encode key components of the condensin complex, which is required for conversion of interphase chromatin into mitotic-like condensed chromosomes. Significantly, the level of up-regulation for SMC2 and SMC4 is similar, as would be expected for proteins that form heterodimers. The condensins association with chromosome and chromosome condensa-tion is regulated via phosphorylation by CDC2 (36); the mRNA for mouse homologue of CDC2 is elevated in the Atp7b-/- liver (Table 1). Alto-gether, these transcriptional and presumably protein changes have subtle but noticeable effect on nuclear structure. The Atp7b-/- nuclei show larger variation in size than control nuclei (our data, and (15)) and frequently show electron-dense material the exact nature of which remains to be established (Figure 5). In addition to these structural changes, up-regulation of cyclins G1 and G2, CDC28 kinase as well as elevated levels of the fetal liver anti-gen and securin, are all suggestive of increased cell proliferation. This conclusion is consistent with our earlier observation of increased nuclear staining with the proliferative marker Ki-67 in the KO livers (15). Up-regulation of cyclin G1 was also observed previously in the presympto-matic LEC rats, another animal model of WD (37), suggesting that the copper-dependent al-teration of a cell-cycle machinery is species-independent phenomenon. Pathways down-regulated in Atp7b-/- liver. The most significant effect of accumulated copper is on genes involved in cholesterol metabolism, although fatty acid and bile acid biosynthesis are also affected. The extent of these changes is illustrated in Figure 8, which demonstrates that the enzymes involved in key steps of cholesterol biosynthesis are all affected (down-regulated) by copper overload. Indeed, direct metabolite meas-urements revealed a marked decrease of liver cholesterol. The impaired cholesterol biosynthe-sis is also clearly reflected in the reduction of the VLDL fraction of serum cholesterol, while the observed decrease in triglyceride levels can be attributed to increased expression of lipoprotein lipase. It is interesting that recent clinical chem-
9
by guest on April 3, 2019
http://ww
w.jbc.org/
Dow
nloaded from
istry measurements in a group of 45 WD patients found that in these patients total cholesterol, LDL cholesterol and α-tocopherol levels were significantly lower compared to the control group (38) indicating that copper-induced altera-tions of cholesterols homeostasis are shared by WD patients and Atp7b-/- mice. It would be im-portant to establish whether or not the observed changes in the serum lipid levels can serve as additional biochemical markers facilitating de-tection of the early stages of WD. Inhibition of SREBP-2 function is likely to con-tribute to the Atp7b-/- phenotype. The metabolic control of genes for the cholesterol, fatty acid, and lipid biosynthesis is well described. Low levels of metabolites up-regulate the rate-limiting biosynthetic enzymes through activation of specific transcription factors. For example, decrease in intracellular cholesterol induces acti-vation of SREBP-2, which in turn up-regulates genes involved in cholesterol metabolism. Our data indicate that this metabolic control is not disrupted by accumulated copper. Lower levels of cholesterol in Atp7b-/- livers are associated with increased levels of activated SREBP-2 in the Atp7b-/- nuclei, illustrating that neither proc-essing of SREBP-2 nor its trafficking to nucleus are inhibited by copper overload. However, the target genes of SREBP-2 do not show expected up-regulation; in fact they are markedly down-regulated. These results suggest that accumu-lated copper is likely to inhibit the SREBP-2 function either by directly binding and causing structural changes in SREBP-2 or by modulating SREBP-2 activity via other proteins. The pre-cise mechanism copper-dependent inhibition remains to be established; it may involve the known property of copper to compete with Zn and disrupt zinc-fingers and/or copper-induced oxidation of Cys residues required for structure and function of transcription factors. In addition to SREBP-2 other factors may con-tribute to the observed phenotype. The role of metallothioneins, greatly up-regulated in the Atp7b-/- livers, in cell differentiation and prolif-eration has been reported (39). Changes in he-patic glutathione levels were shown to alter the fatty acid synthase expression, suggesting that lipogenesis may depend on thiol redox state, which in turn could be greatly affected by cop-per overload (40). Increased levels of polyun-saturated fatty acids were previously linked to the in vivo inhibition of expression of hepatic
genes related to lipogenesis (41). Therefore, the detailed characterization of liver metabolites would provide important insight into copper-dependent regulation of lipid metabolism. It is particularly significant that the effects on transcription/RNA stability that we observed in response to copper overload are opposite to the previously reported response to dietary copper deficiency. Specifically, in rats fed a copper-deficient diet the fatty acid synthesis and assem-bly into triacylglycerols and phospholipids were up-regulated (42) in contrast to the down-regulation of fatty acid biosynthesis detected in our studies. These observations point to a tight connection between copper and lipid homeosta-sis, which is likely to be mediated through cop-per-dependent transcriptional control or modula-tion of RNA stability. A link between lipid metabolism and cell cycle. The effect of copper on limited number of meta-bolic pathways suggests that corresponding pathways could be functionally linked. Indeed, analysis of relationships between the signifi-cantly changed genes using the Ingenuity Path-ways Analysis software reveals a highly-scored network of 36 up- and down-regulated tran-scripts (Figure 9). In this network, the connec-tion is observed between lipid metabolism via SREBF1 (sterol regulatory element binding fac-tor 1) and cell cycle via CDKNA1 (cyclin-dependent kinase inhibitor 1). Search for this link in the literature uncovered recent work in which lipid deprivation was shown to activate SREBF1 and induce CDKNA1 mRNA and pro-tein (43). In our studies, the decrease in liver lipids also coincided with the elevated amount of CDKNA1 mRNA. Implications for understanding the WD pathol-ogy. The relationship between copper and spe-cific metabolic pathways revealed in our study has important implications for understanding the pathology of WD. The toxic role of copper has been commonly associated with the ability of the metal to induce formation of reactive oxygen species (ROS). We demonstrate that at the pre-symptomatic stage of copper accumulation oxi-dative stress does not appear to play the major role, as no significant up-regulation of transcript and/or proteins involved in oxidative stress re-sponse is observed. This observation is reminis-cent of findings by Armendariz and coworkers (44). These investigators performed gene ex-
10
by guest on April 3, 2019
http://ww
w.jbc.org/
Dow
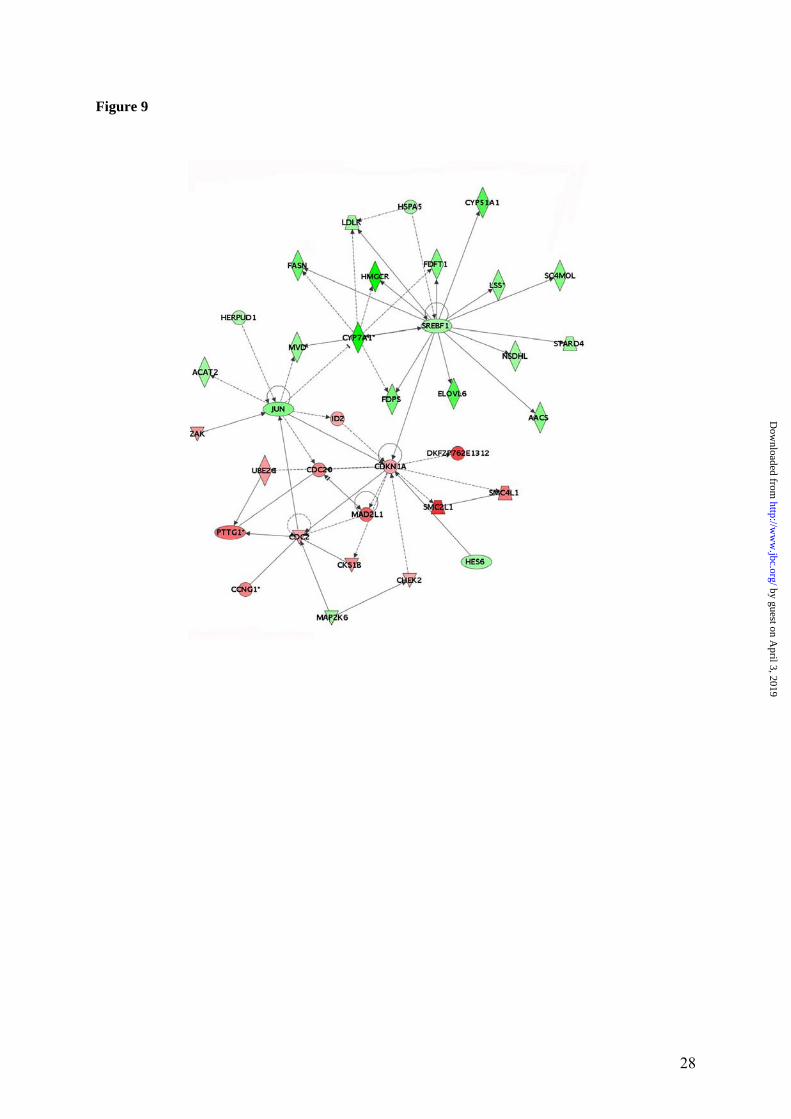
nloaded from
pression profiling of fibroblasts chronically ac-cumulating copper due to ATP7A inactivation and found no evidence of oxidative stress-related gene expression despite significant copper ac-cumulation. Thus, copper-induced radical forma-tion, if occurs, is unlikely to be central to the early stages of WD pathogenesis. At the same time, some level of oxidative stress cannot be excluded. The expression of Rad51, which is cell cycle dependent (45), can also be increased as a result of DNA damage, suggesting that accumulated copper may have some effect on DNA structure. Similarly, the up-regulation of glutathione S-tranferase alpha was noticeable and was also reported in LEC rat (37). This en-zyme metabolizes bilirubin and exhibits glu-tathione peroxidase activity thereby protecting cells from ROS and the products of peroxidation (46). The upregulated selenoprotein H may also have an antioxidant function (28). Lastly, up-regulation of transcripts for proteosome subunit (macropain), ubiquitin-conjugating enzyme E2C, and glyoxalase 1 suggested the need for re-moval/detoxification of metabolic by-products, which may play a larger pathogenic role at later stages of the disease. Previously, in the Atp7b-/- animals nursed by homozygous knock-out dams we observed mi-crosteatosis at 6 weeks, which progressed to focal steatosis and lipid droplets in the nuclei of 12-20-weeks-old mice (15). In the 6-weeks-old Atp7b-/- mice nursed by heterozygous dams, the steatosis is less severe and varies from apparent to non-detectable (our data, not shown). It ap-pears that disregulation of lipid biosynthesis is accompanied by accumulation of certain (per-haps intermediate) lipid metabolites and that the degree of accumulation may depend on the nutri-tional status of the animal. If variation in nutri-tion does play a role in the severity of hepatic response to copper overload, this may explain larger variation between the RT-PCR and gene array data for metabolic genes compared to the cell-cycle genes, measured at 6 weeks when the
homeostatic capacity of liver is still significant. A better understanding of the effect of nutrition on pathology development in Atp7b-/- liver may provide important insights into significant varia-tion of WD phenotype in humans. Proliferation of bile ductules is commonly ob-served at the intermediate stage of disease in WD patients (47). Similarly, the bile duct ab-normalities are very apparent at the later stages of disease in the Atp7b-/- mice (15). Thus, it was interesting to see abnormalities of enzymes in-volved in bile acid biosynthesis. 7-alpha-hydroxylase (CYP7A) involved in the classic neutral pathway was down-regulated, while mi-crosomal oxysterol 7-alpha-hydroxylase (CYP7B1) was up. Bile acid synthesis defects may cause progressive cholestatic liver disease due to accumulation of potentially toxic inter-mediates (48). It is tempting to speculate that the disregulation of bile acid biosynthesis may trig-ger pathological changes in the bile ducts ob-served in the Atp7b-/- livers. In summary, our data provide insight into the initial stages of pathology induced by copper overload in livers lacking functional Atp7b. We demonstrate that the effect of copper is selective and involves specific metabolic pathways. This observation may have important practical impli-cations, because specific cellular responses, par-ticularly those involving metabolites, are more amenable to detection and possibly correction. We have also discovered that oxidative stress is not the major effect of copper at the early stages of the disease. Instead, lipid metabolism and cell cycle machinery are selectively affected by cop-per overload. The marked effect of copper on specific metabolic pathways suggest that the extent of pathology may depend on the ability of tissue to correct/sustain these metabolic insults and thus be altered by "modifier" genes and nu-tritional status, which are different in different individuals.
11
by guest on April 3, 2019
http://ww
w.jbc.org/
Dow
nloaded from
Acknowledgements This work was supported by the National Institute of Health grant PO1 GM 067166-01 to S.L. and OHSU Medical Research Foundation Grant to SL. D.H. is a recipient of a postdoctoral fellowship from the Deutsche Forschungsgemeinschaft (HU 932/1-1). The authors thank Mrs. Ines Sommerer and Wolfgang Wilfert for valuable technical help, Dr. Robert J Keyton for help with electron micros-copy, Drs. Milton Finegold and Jack H. Kaplan for the critical reading of the manuscript and helpful comments, and Dr. Dennis Winge for useful suggestions during the course of this work. Microarray assays were performed in the Affymetrix Microarray Core of the OHSU Gene Microarray Shared Resource. References 1. Cox, D., and Roberts, E. (2006) Wilson Disease. In: Feldman, M., Friedman, L., and MH, S.
(eds). Gastrointestinal and Liver Disease, 8th Ed., Saunders, Philadelphia 2. Ferenci, P. (2004) Metab Brain Dis 19(3-4), 229-239 3. Gitlin, J. D. (2003) Gastroenterology 125(6), 1868-1877 4. Loudianos, G., and Gitlin, J. D. (2000) Semin.Liver Dis. 20(3), 353-364 5. Brewer, G. J. (1998) Am J Clin Nutr 67(5 Suppl), 1087S-1090S 6. Stremmel, W., Meyerrose, K. W., Niederau, C., Hefter, H., Kreuzpaintner, G., and Stroh-
meyer, G. (1991) Ann Intern Med 115(9), 720-726 7. Riordan, S. M., and Williams, R. (2001) J.Hepatol. 34(1), 165-171 8. Wilson, S. A. K. (1912) Brain 34, 295-507 9. Tanzi, R. E., Petrukhin, K., Chernov, I., Pellequer, J. L., Wasco, W., Ross, B., Romano, D.
M., Parano, E., Pavone, L., Brzustowicz, L. M., and et al. (1993) Nat Genet 5(4), 344-350 10. Bull, P. C., Thomas, G. R., Rommens, J. M., Forbes, J. R., and Cox, D. W. (1993) Nat Genet
5(4), 327-337 11. Yamaguchi, Y., Heiny, M. E., and Gitlin, J. D. (1993) Biochem Biophys Res Commun
197(1), 271-277 12. Britton, R. S. (1996) Semin Liver Dis 16(1), 3-12 13. Gaetke, L. M., and Chow, C. K. (2003) Toxicology 189(1-2), 147-163 14. Linder, M. C. (2001) Mutat Res 475(1-2), 141-152 15. Huster, D., Finegold, M. J., Morgan, C. T., Burkhead, J. L., Nixon, R., Vanderwerf, S. M.,
Gilliam, C. T., and Lutsenko, S. (2006) Am J Pathol 168(2), 423-434 16. Buiakova, O. I., Xu, J., Lutsenko, S., Zeitlin, S., Das, K., Das, S., Ross, B. M., Mekios, C.,
Scheinberg, I. H., and Gilliam, T. C. (1999) Hum.Mol.Genet. 8(9), 1665-1671 17. Irizarry, R. A., Hobbs, B., Collin, F., Beazer-Barclay, Y. D., Antonellis, K. J., Scherf, U., and
Speed, T. P. (2003) Biostatistics 4(2), 249-264 18. Dahlquist, K. D., Salomonis, N., Vranizan, K., Lawlor, S. C., and Conklin, B. R. (2002) Nat
Genet 31(1), 19-20 19. Doniger, S. W., Salomonis, N., Dahlquist, K. D., Vranizan, K., Lawlor, S. C., and Conklin, B.
R. (2003) Genome Biol 4(1), R7 20. Livak, K. J., and Schmittgen, T. D. (2001) Methods 25(4), 402-408 21. Lampi, K. J., Shih, M., Ueda, Y., Shearer, T. R., and David, L. L. (2002) Invest Ophthalmol
Vis Sci 43(1), 216-224 22. Eng JK, M. A., Yates JRI. . (1994) Journal of the American Society for Mass Spectrometry
5(11), 976-989 23. Keller A, E. J., Zhang N, Xiao-jun L, Aebersold R. . (2005) Molecular Systems Biology 1,
MSB4100024-E4100021 - MSB4100024-E4100028 24. Nesvizhskii, A. I., Keller, A., Kolker, E., and Aebersold, R. (2003) Anal Chem 75(17), 4646-
4658 25. Keller, A., Nesvizhskii, A. I., Kolker, E., and Aebersold, R. (2002) Anal Chem 74(20), 5383-
5392 26. Teupser, D., Pavlides, S., Tan, M., Gutierrez-Ramos, J. C., Kolbeck, R., and Breslow, J. L.
(2004) Proc Natl Acad Sci U S A 101(51), 17795-17800
12
by guest on April 3, 2019
http://ww
w.jbc.org/
Dow
nloaded from
27. Sheng, Z., Otani, H., Brown, M. S., and Goldstein, J. L. (1995) Proc Natl Acad Sci U S A 92(4), 935-938
28. Morozova, N., Forry, E. P., Shahid, E., Zavacki, A. M., Harney, J. W., Kraytsberg, Y., and Berry, M. J. (2003) Genes Cells 8(12), 963-971
29. Zhu, Q., Anderson, G. W., Mucha, G. T., Parks, E. J., Metkowski, J. K., and Mariash, C. N. (2005) Endocrinology 146(8), 3343-3350
30. Hua, X., Yokoyama, C., Wu, J., Briggs, M. R., Brown, M. S., Goldstein, J. L., and Wang, X. (1993) Proc Natl Acad Sci U S A 90(24), 11603-11607
31. Horton, J. D., Shimomura, I., Brown, M. S., Hammer, R. E., Goldstein, J. L., and Shimano, H. (1998) J Clin Invest 101(11), 2331-2339
32. Leong, H. X., Simkevich, C., Lesieur-Brooks, A., Lau, B. W., Fugere, C., Sabo, E., and Thompson, N. L. (2006) Nutr Metab (Lond) 3, 37
33. Hu, R., Xu, C., Shen, G., Jain, M. R., Khor, T. O., Gopalkrishnan, A., Lin, W., Reddy, B., Chan, J. Y., and Kong, A. N. (2006) Life Sci 79(20), 1944-1955
34. Mutlib, A., Jiang, P., Atherton, J., Obert, L., Kostrubsky, S., Madore, S., and Nelson, S. (2006) Chem Res Toxicol 19(10), 1270-1283
35. Ng, H. H., Frantz, C. E., Rausch, L., Fairchild, D. C., Shimon, J., Riccio, E., Smith, S., and Mirsalis, J. C. (2005) Genomics 86(6), 657-667
36. Kimura, K., Cuvier, O., and Hirano, T. (2001) J Biol Chem 276(8), 5417-5420 37. Klein, D., Lichtmannegger, J., Finckh, M., and Summer, K. H. (2003) Arch Toxicol 77(10),
568-575 38. Rodo, M., Czonkowska, A., Pulawska, M., Swiderska, M., Tarnacka, B., and Wehr, H. (2000)
Eur J Neurol 7(5), 491-494 39. Cherian, M. G., and Kang, Y. J. (2006) Exp Biol Med (Maywood) 231(2), 138-144 40. Wilson, J., Kim, S., Allen, K. G., Baillie, R., and Clarke, S. D. (1997) Am J Physiol 272(6 Pt
1), E1124-1129 41. Foretz, M., Foufelle, F., and Ferre, P. (1999) Biochem J 341 ( Pt 2), 371-376 42. al-Othman, A. A., Rosenstein, F., and Lei, K. Y. (1992) J Nutr 122(6), 1199-1204 43. Inoue, N., Shimano, H., Nakakuki, M., Matsuzaka, T., Nakagawa, Y., Yamamoto, T., Sato,
R., Takahashi, A., Sone, H., Yahagi, N., Suzuki, H., Toyoshima, H., and Yamada, N. (2005) Mol Cell Biol 25(20), 8938-8947
44. Armendariz, A. D., Gonzalez, M., Loguinov, A. V., and Vulpe, C. D. (2004) Physiol Genom-ics 20(1), 45-54
45. Yamamoto, A., Taki, T., Yagi, H., Habu, T., Yoshida, K., Yoshimura, Y., Yamamoto, K., Matsushiro, A., Nishimune, Y., and Morita, T. (1996) Mol Gen Genet 251(1), 1-12
46. Prabhu, K. S., Reddy, P. V., Liken, A. D., Jones, E. C., Yennawar, H. P., and Reddy, C. C. (2003) Adv Exp Med Biol 525, 189-192
47. Scheinberg I.H. , S. I. (1984) Wilson's disease, W.B. Saunders Company 48. Bove, K. E., Heubi, J. E., Balistreri, W. F., and Setchell, K. D. (2004) Pediatr Dev Pathol
7(4), 315-334
13
by guest on April 3, 2019
http://ww
w.jbc.org/
Dow
nloaded from
Figure legends
Figure 1. Quality metrics for the control (WT) and Atp7b-/- (KO) datasets. (A) Distribution of RMA-normalized data for the WT and KO groups. The boxes depict the mean values of intensities, while the height of the boxes shows the range of signal amplitudes for 50% of data in each sample. The vertical bars illustrate the magnitude of variation within each group (WT and KO) for remaining 50% of the data. (B) Hierarchical clustering of six samples showing good agreement between repli-cates and difference between the WT and KO groups. Figure 2. Validation of the mRNA changes observed in oligonucleotide arrays using real-time PCR. (A) Up-regulated genes (B) Down-regulated genes. The analysis included 4-weeks-old mice (up-regulated genes only), 6-weeks-old and 32-weeks-old-mice (up- and down-regulated genes). The mean of fold changes and standard deviation are shown (n=6 per group). Figure 3. Comparison of the electrophoresis patterns for the soluble control and Atp7b-/- pro-teins using 2-dimentional gel-electrophoresis. Top panels show the entire gel. Boxed regions point to the proteins spots that were subsequently analyzed by mass-spectrometry. Lower panels show magnified view of spots corresponding to metallothioneins 1 and 2 (MT1,2) and copper zinc depend-ent superoxide dismutase (SOD1). Similar results were obtained in three independent experiments. Figure 4. Gene ontology analysis for significantly changed transcripts. (A) The most significantly changed GO terms/pathways identified by canonical pathways analysis using the Ingenuity Pathways Knowledge Base. (B) The changes in various pathways as predicted by GeneSifter software. The dot-ted line indicates z-score of 2, which is a threshold for significant changes. Figure 5. Electron microscopy of Atp7b-/- and control nuclei. The images of the sections of the nuclei show nucleoli (thin arrow) clearly visible in both the Atp7b-/- and control samples and the elec-tron-dense material (thick arrow) detected in the Atp7b-/- nuclei (magnification x 8,000). Figure 6. Mass-spectrometry analysis of liver cholesterol. Overlay of chromatograms from 10 different samples, normalized to the intensity of the internal standard δ6-cholesterol (mass spectrum left insert in green) at extracted ion trace m/z 374. Endogenous cholesterol is shown at extracted ion trace m/z 368 (mass spectrum right insert in red). WT animals (red lines; n=4) had significantly higher levels of cholesterol than KO animals (blue lines, n=6, p=0.003). Figure 7. Elevated copper does not inhibit metabolic regulation of SREBP-2, but affects SREBP-2 function (A) Immuno-detection of SREBP2 in nuclear extracts from control and Atp7b-/- livers. (B) LDL recep-tor mRNA is down-regulated in livers of Atp7b-/- (mice) and Wilson disease patients (human) com-pared to corresponding controls. Comparison of HMG-CoA reductase transcripts in Wilson disease patients (n=8) compared to control (n=8), t-test: p<0.001 Figure 8. The general scheme of cholesterol biosynthesis illustrating steps that can be affected by down-regulated enzymes. Figure 9. The molecular relationships between significantly changed transcripts. The identified network has a highly significant score of 64. Genes or gene products are represented as nodes, the connection between genes are supported by information in the Ingenuity Pathways Knowledge Base. The color indicates the up- (red) or down- (green) regulation. Different shapes of nodes represent different functional classes of gene products (rhomboid-enzymes, ovals-transcription factors, trian-gles-kinases, trapeziums –transport proteins, and circles - others).
14
by guest on April 3, 2019
http://ww
w.jbc.org/
Dow
nloaded from
Table 1
The transcripts significantly up-regulated in Atp7b-/- livers (fold change > 2, adjusted p-value < 0.05). For the transcripts identified by different probesets, all relevant Affymetrix probeset IDs and the
highest of the found ratios are shown. Unigene Ratio Gene or Protein Name Affymetrix ID Cluster
Cell cycle and proliferation Mm.14802 5.68 H19 fetal liver mRNA 1448194_a_at Mm.290830 2.62 MAD2 (mitotic arrest deficient, homolog)-like 1 1422460_at Mm.6856 2.48 Pituitary tumor-transforming 1 (securin) 1424105_a_at Mm.231 2.16 RAD51 homolog 1418281_at Mm.2103 2.1 Cyclin G1 1450016_at Mm.37801 2.13 Shc SH2-domain binding protein 1 1416299_at Mm.289747 2.04 Cell division cycle 20 homolog 1439377_x_at 1420827_a_at Mm.275095 2.03 Valosin containing protein 1429295_s_at 1450017_at Mm.3049 2.01 CDC28 protein kinase 1b 1416698_a_at
Chromatin structure Mm.193539 3.64 Histone 1, H1c 1436994_a_at 1416101_a_at Mm.2999 3.55 SMC2, structural maintenance of chromosomes 2 1448635_at Mm.206841 2.28 SMC4, structural maintenance of chromosomes 4 1452197_at Mm.9870 2.28 Centromere protein Q 1423620_at
Metabolism Mm.246881 4.76 Glycerophosphodiester phosphodiesterase domain containing 3 1449526_a_at Mm.338425 2.54 Ectonucleotide pyrophosphatase/phosphodiesterase 3 1427302_at Mm.371562 2.01 Glutathione S-transferase, alpha 1 (Ya) 1421041_s_at 1439260_a_at
Metal ion binding Mm.147226 2.52 Metallothionein 2 1428942_at Mm.192991 2.22 Metallothionein 1 1422557_s_at
Transport Mm.197518 2.05 Lysosomal-associated protein transmembrane 4B 1436915_x_at Mm.325350 2.04 Solute carrier family 37, member 2 1452492_a_at
Regulation of translation Mm.132584 3.73 Polyadenylate binding protein-interacting protein 11425521_at
Proteolysis Mm.291569 2.85 Serine/cysteine proteinase inhibitor clade A, member 3M 1423867_at
Cell Redox homeostasis Mm.259293 2.82 RIKEN cDNA 2700094K13 gene (Selenoprotein H) 1436349_at 1454686_at
15
by guest on April 3, 2019
http://ww
w.jbc.org/
Dow
nloaded from
Table 1 (continued)
The transcripts significantly up-regulated in Atp7b-/- livers (fold change > 2, adjusted p-value < 0.05). For the transcripts identified by different probesets, all relevant Affymetrix probeset IDs and the
highest of the found ratios are shown. Unigene Ratio Gene or Protein Name Affymetrix ID Cluster
Cholesterol metabolism Mm.316000 2.36 Cytochrome P450, family 7, subfamily b, polypeptide 1 1421074_at 1421075_s_at
Cell adhesion Mm.289441 2.23 Claudin 1 1450014_at 1437932_a_at
mRNA export and processing Mm.28478 2.18 Transmembrane protein 48 1460353_at 1424173_at
Heme biosynthesis Mm.302724 2.17 Aminolevulinic acid synthase 2, erythroid 1451675_a_at
Unknown Mm.317041 3.15 RIKEN cDNA 6430706D22 gene 1433685_a_at Mm.30837 2.06 N-myc downstream regulated gene 1 1456174_x_at Mm.355125 2.00 Mus musculus, clone IMAGE:3983821, partial mRNA 1427820_at 1454686_at
16
by guest on April 3, 2019
http://ww
w.jbc.org/
Dow
nloaded from
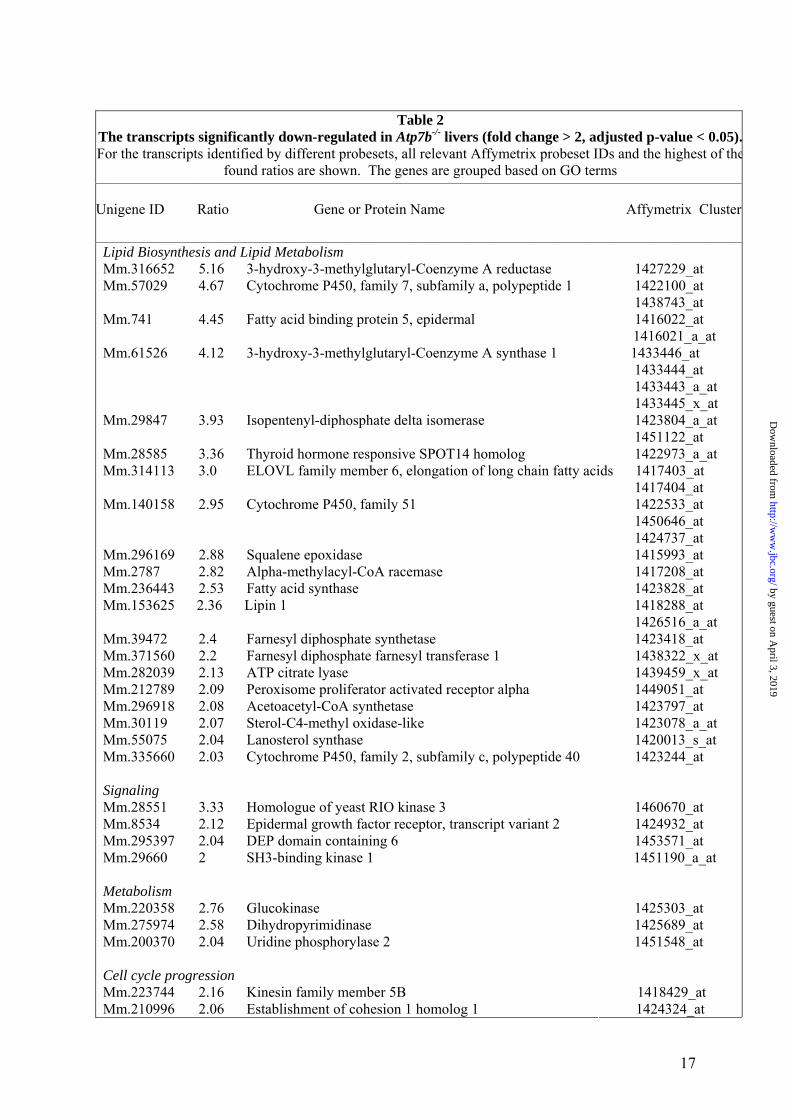
Table 2
The transcripts significantly down-regulated in Atp7b-/- livers (fold change > 2, adjusted p-value < 0.05).For the transcripts identified by different probesets, all relevant Affymetrix probeset IDs and the highest of the
found ratios are shown. The genes are grouped based on GO terms
Unigene ID Ratio Gene or Protein Name Affymetrix Cluster
Lipid Biosynthesis and Lipid Metabolism Mm.316652 5.16 3-hydroxy-3-methylglutaryl-Coenzyme A reductase 1427229_at Mm.57029 4.67 Cytochrome P450, family 7, subfamily a, polypeptide 1 1422100_at 1438743_at Mm.741 4.45 Fatty acid binding protein 5, epidermal 1416022_at 1416021_a_at Mm.61526 4.12 3-hydroxy-3-methylglutaryl-Coenzyme A synthase 1 1433446_at 1433444_at 1433443_a_at 1433445_x_at Mm.29847 3.93 Isopentenyl-diphosphate delta isomerase 1423804_a_at 1451122_at Mm.28585 3.36 Thyroid hormone responsive SPOT14 homolog 1422973_a_at Mm.314113 3.0 ELOVL family member 6, elongation of long chain fatty acids 1417403_at 1417404_at Mm.140158 2.95 Cytochrome P450, family 51 1422533_at 1450646_at 1424737_at Mm.296169 2.88 Squalene epoxidase 1415993_at Mm.2787 2.82 Alpha-methylacyl-CoA racemase 1417208_at Mm.236443 2.53 Fatty acid synthase 1423828_at Mm.153625 2.36 Lipin 1 1418288_at 1426516_a_at Mm.39472 2.4 Farnesyl diphosphate synthetase 1423418_at Mm.371560 2.2 Farnesyl diphosphate farnesyl transferase 1 1438322_x_at Mm.282039 2.13 ATP citrate lyase 1439459_x_at Mm.212789 2.09 Peroxisome proliferator activated receptor alpha 1449051_at Mm.296918 2.08 Acetoacetyl-CoA synthetase 1423797_at Mm.30119 2.07 Sterol-C4-methyl oxidase-like 1423078_a_at Mm.55075 2.04 Lanosterol synthase 1420013_s_at Mm.335660 2.03 Cytochrome P450, family 2, subfamily c, polypeptide 40 1423244_at Signaling Mm.28551 3.33 Homologue of yeast RIO kinase 3 1460670_at Mm.8534 2.12 Epidermal growth factor receptor, transcript variant 2 1424932_at Mm.295397 2.04 DEP domain containing 6 1453571_at Mm.29660 2 SH3-binding kinase 1 1451190_a_at Metabolism Mm.220358 2.76 Glucokinase 1425303_at Mm.275974 2.58 Dihydropyrimidinase 1425689_at Mm.200370 2.04 Uridine phosphorylase 2 1451548_at Cell cycle progression Mm.223744 2.16 Kinesin family member 5B 1418429_at Mm.210996 2.06 Establishment of cohesion 1 homolog 1 1424324_at
17
by guest on April 3, 2019
http://ww
w.jbc.org/
Dow
nloaded from
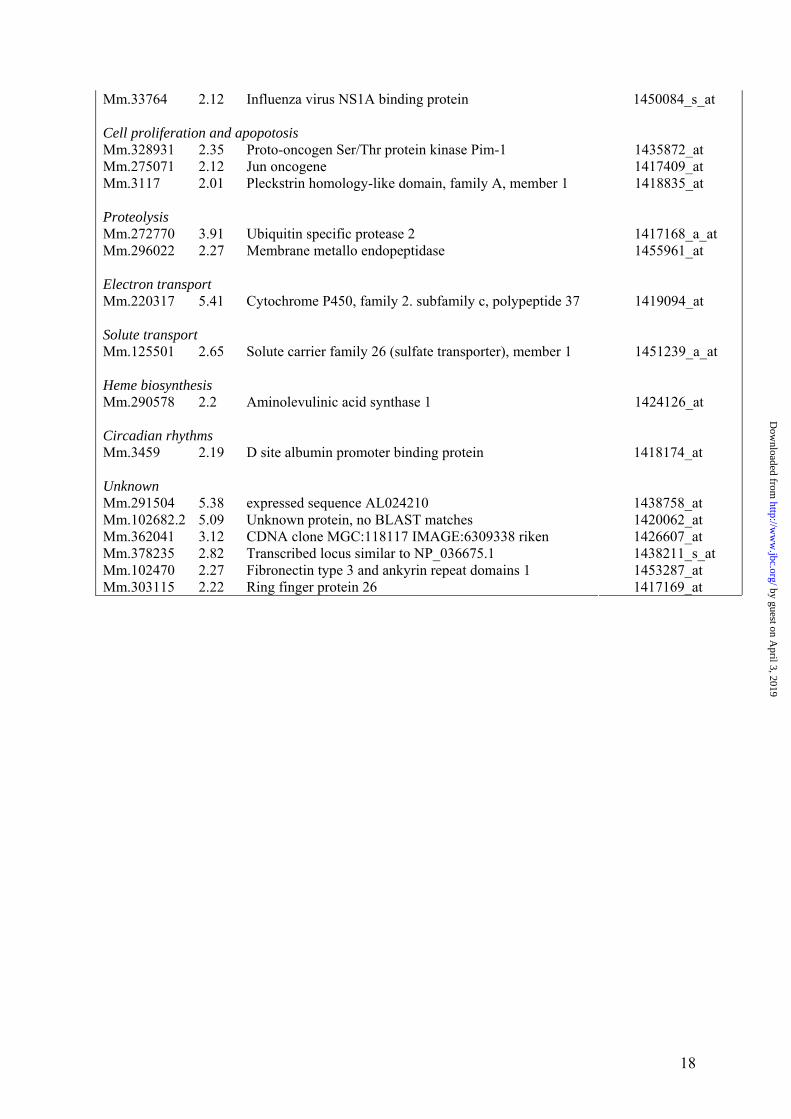
Mm.33764 2.12 Influenza virus NS1A binding protein 1450084_s_at Cell proliferation and apopotosis Mm.328931 2.35 Proto-oncogen Ser/Thr protein kinase Pim-1 1435872_at Mm.275071 2.12 Jun oncogene 1417409_at Mm.3117 2.01 Pleckstrin homology-like domain, family A, member 1 1418835_at Proteolysis Mm.272770 3.91 Ubiquitin specific protease 2 1417168_a_at Mm.296022 2.27 Membrane metallo endopeptidase 1455961_at Electron transport Mm.220317 5.41 Cytochrome P450, family 2. subfamily c, polypeptide 37 1419094_at Solute transport Mm.125501 2.65 Solute carrier family 26 (sulfate transporter), member 1 1451239_a_at Heme biosynthesis Mm.290578 2.2 Aminolevulinic acid synthase 1 1424126_at Circadian rhythms Mm.3459 2.19 D site albumin promoter binding protein 1418174_at Unknown Mm.291504 5.38 expressed sequence AL024210 1438758_at Mm.102682.2 5.09 Unknown protein, no BLAST matches 1420062_at Mm.362041 3.12 CDNA clone MGC:118117 IMAGE:6309338 riken 1426607_at Mm.378235 2.82 Transcribed locus similar to NP_036675.1 1438211_s_at Mm.102470 2.27 Fibronectin type 3 and ankyrin repeat domains 1 1453287_at Mm.303115 2.22 Ring finger protein 26 1417169_at
18
by guest on April 3, 2019
http://ww
w.jbc.org/
Dow
nloaded from
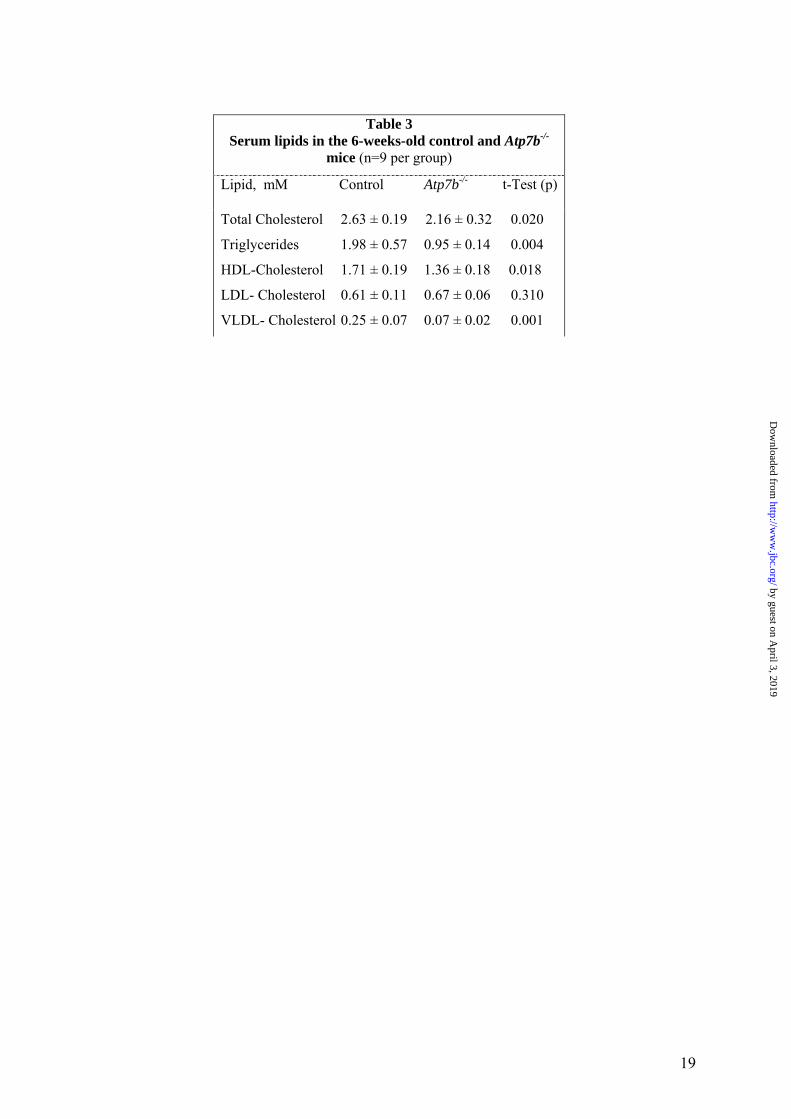
Table 3
Serum lipids in the 6-weeks-old control and Atp7b-/- mice (n=9 per group)
Lipid, mM Control Atp7b-/- t-Test (p)
Total Cholesterol 2.63 ± 0.19 2.16 ± 0.32 0.020
Triglycerides 1.98 ± 0.57 0.95 ± 0.14 0.004
HDL-Cholesterol 1.71 ± 0.19 1.36 ± 0.18 0.018
LDL- Cholesterol 0.61 ± 0.11 0.67 ± 0.06 0.310
VLDL- Cholesterol 0.25 ± 0.07 0.07 ± 0.02 0.001
19
by guest on April 3, 2019
http://ww
w.jbc.org/
Dow
nloaded from
Franziska Stuckert, N. Erik Olson, Daniel Teupser and Svetlana LutsenkoDominik Huster, Tina D. Purnat, Jason L. Burkhead, Martina Ralle, Oliver Fiehn,
mouse model of Wilson diseaseHigh copper selectively alters lipid metabolism and cell cycle machinery in the
published online January 7, 2007J. Biol. Chem.
10.1074/jbc.M607496200Access the most updated version of this article at doi:
Alerts:
When a correction for this article is posted•
When this article is cited•
to choose from all of JBC's e-mail alertsClick here
Supplemental material:
http://www.jbc.org/content/suppl/2007/01/08/M607496200.DC1
by guest on April 3, 2019
http://ww
w.jbc.org/
Dow
nloaded from