high-level politically connected firms, corruption, and analyst forecast accuracy around the world
TRANSCRIPT
High-level politically connected firms,
corruption, and analyst forecast accuracy
around the world
Charles JP Chen1,Yuan Ding1 andChansog (Francis) Kim2
1China Europe International Business School,
Shanghai, P. R. China; 2City University of Hong
Kong, Hong Kong, P. R. China
Correspondence:CJP Chen, China Europe InternationalBusiness School (CEIBS), 699 HongfengRoad, Pudong, Shanghai 201206, P. R.China.Tel: þ86 21 2890 5617;Fax: þ86 21 2890 5620;E-mail: [email protected]
Received: 15 July 2008Revised: 8 January 2010Accepted: 12 February 2010Online publication date: 24 June 2010
AbstractThe international business (IB) literature has widely recognized political forces
as major factors that complicate the strategic decisions of multinationalenterprises (MNEs). Analyses by financial intermediaries can help to reduce the
risk of information asymmetry caused by such factors. Using firm-level data
from 17 jurisdictions between 1997 and 2001, this study investigates theassociation between a firm’s high-level political connections and earnings
forecasts made by financial analysts, an important group of financial
intermediaries. We find that, after controlling for other determinants offorecast accuracy, analysts experience greater difficulty in predicting the
earnings of firms with political connections than those of firms with no such
connections. However, in jurisdictions in which corruption level is relativelyhigh, earnings forecast accuracy is influenced more by a firm’s political
connections. Our findings contribute to the IB literature by demonstrating that
political connections exacerbate the information asymmetry between investors
and managers, and also that anti-corruption measures can curb the adverseeffect of political connections on the corporate information environment.
These findings bear the practical implication that MNEs must consider political
issues when making resource allocation decisions.Journal of International Business Studies (2010) 41, 1505–1524.
doi:10.1057/jibs.2010.27
Keywords: political relationships; corruption; primary data source; accounting
INTRODUCTIONCorporate political connections play an important role in many ofthe world’s largest and most important economies (Fisman, 2001).Anecdotal evidence suggests that political connections substan-tially affect corporate performance not only in emerging markets,but also in developed economies. For example, in 2002 Shin Satellite(Sattel), a Thai telecom company, 53% owned by the family of thethen Thai prime minister Thaksin, obtained government assistanceto expand utilization of its massive capacity: The Indian govern-ment renewed its contracts with Sattel after Thaksin’s whirlwindtrip; Sattel made a $12 million deal with Burma right after anofficial visit to Thailand by a Burmese leader (Crispin, 2002).Political connections also played a role in the Enron scandal. WhenPresident Bush’s advisers debated a new energy policy in the springof 2001, Kenneth Lay (President of Enron) was the only energyexecutive to be invited for a one-on-one session with Vice President
Journal of International Business Studies (2010) 41, 1505–1524& 2010 Academy of International Business All rights reserved 0047-2506
www.jibs.net
Cheney, who led the effort. Mr. Lay also workedwith Karl Rove and others to successfully push fortheir appointments to the Federal Energy Regula-tory Commission (FERC), which oversaw muchof Enron’s business. According to Curtis Hebert Jr.,ex-chairman of the FERC, President Bush replacedhim with an old Enron ally from Texas soon after herefused to change his views on electricity deregula-tion to concur with those of Mr. Lay (Davis, 2001;Hunt, 2002).
The international business (IB) literature hasshown that political connections not only affectfirm-level performance and transparency, but alsowork hand in hand with corruption, which ‘‘pro-duces bottle necks, heightens uncertainty, andraises costs’’ for cross-border business transactions(Habib & Zurawicki, 2002). Further, the IB literaturehas established the effects of political forces onthe strategic choices of multinational enterprises(MNEs) (Smith-Hillman & Omar, 2005), and hasshown that politics in general – and corporatepolitical connections specifically – systematicallyinfluence business practices around the world(Faccio, Masulis, & McConnell, 2006; Habib &Zurawicki, 2002; Simon, 1984).
Though corporate political connections are a wide-spread phenomenon around the world (Faccio,2006), and the IB literature has recognized thecomplex relationship between MNEs and society,research on the interactions between MNEs andpolitics, corruption, and corporate social responsi-bility is still relatively embryonic (Rodriguez, Siegel,Hillman, & Eden, 2006). We explore this relativelynew research area in the IB literature by providingevidence about the effects of:
(1) high-level corporate political connections;1
(2) host-country corruption levels; and(3) their interaction on the ability of financial
analysts to forecast the earnings of corporationsaround the world.
Scholars know that ‘‘institutions matter’’, butdo not know exactly how they matter to MNEs(Jackson & Deeg, 2008). Understanding the rela-tionship between political connections and analystforecasts brings us a step closer to this end, as itsheds light on the dynamic relationship betweenhost-country politics and MNEs. Hence this is notonly a less traveled path but also a relativelypromising research direction.
The accuracy of earnings forecasts reflects thelevel of information asymmetry between (sophisti-cated) investors and managers (Duru & Reeb, 2002;
Krishnaswami & Subramaniam, 1999), which is animportant issue for both MNEs and IB scholars(Jackson & Deeg, 2008). Researchers have identi-fied both firm-level and institutional factors thataffect analyst forecasts (Brown, 1993; Clarke &Subramanian, 2006). We propose that in additionto the inherent uncertainty of earnings, politicalconnections complicate the analyst’s task, becausepolitical favoritism is usually granted covertly, andoften comes in a windfall fashion that distortsthe time-series pattern of reported earnings. Thisconjecture, which we refer to as the analyst taskdifficulty hypothesis, predicts that analyst earningsforecasts should be less accurate for firms withpolitical connections than for firms without suchconnections. Alternatively, one may contend thatpoliticians can use their influence to help con-nected firms smooth their earnings by transferringpolitical favors when earnings are low, thus makingtheir earnings more predictable. This supposition,which we refer to as the income-smoothing hypoth-esis, predicts that analyst earnings forecasts shouldbe more accurate for firms with political connec-tions than for firms without such connections.2 Wefind that corporate political connections adverselyaffect financial analyst forecast accuracy, whichimplies that the effects from analyst task difficultydominate those from income-smoothing.
We also propose that corruption can exacerbatethe impact of political connections on analystforecasts by aiding politicians in transferring ben-efits to connected firms (Faccio, 2009), obscuringthe disclosures of politically connected firmsabout the impact of their connections on financialperformance, and subjecting analysts to unduepressure from connected firms and politicians. Thisconjecture, which we refer to as the corruptioneffect hypothesis, predicts that the effect of politicalconnections on analyst forecast error is morepronounced in jurisdictions with higher levels ofcorruption. Our empirical results support thishypothesis.
It is important to consider the two-way interac-tion between a host country’s political system andMNE strategies, as corruption is more widespreadin countries with opaque legal systems and exces-sive administrative discretion (Boddewyn, 1988;LaPalombara, 1994; Tanzi, 1998), and politicsaffects an MNE’s strategic choices (Smith-Hillman& Omar, 2005). Analyzing political connections inisolation from the host country’s corruption levelmay limit the ability of IB scholars to understandthe complex nature of the relationship between
Political forces, corruption, and analyst forecast accuracy Charles JP Chen et al
1506
Journal of International Business Studies
corporate political connections and analyst fore-casts. Our focus on the interaction between poli-tical connections and the effect of corruptionexplicitly considers the possibility of a two-wayinteraction between these two factors, as the extentof corporate political connections may alter ahost country’s incentives and/or ability to controlcorruption, and the effectiveness of a government’santi-corruption measures may in turn affect theincentives for corporations to seek political bene-fits. Our results suggest that political connectionsmask financial transparency around the world, andthat the level of host-country corruption affects thediscretion that politicians have in granting politicalfavors.
The remainder of this paper proceeds as follows.The next section develops the hypotheses. Thethird section presents the variable measurementsand empirical models. The fourth section identifiesthe data sources, and reports the descriptivestatistics. The fifth section discusses the results ofthe empirical analyses. The sixth section sum-marizes the results of the robustness checks. Thefinal section presents our conclusion.
HYPOTHESIS DEVELOPMENTThere are four primary tools with which the statecan influence the economic performance of a firm(Stigler, 1971): direct capital subsidies, controlover the entry of new rivals, the regulation ofsubstitutes and complements, and price fixing.Each of these tools can be expected to complicatethe earnings forecast task. However, political forcescan also affect MNEs in a broader way. In additionto home-country political risks, MNEs may alsobe exposed to differential tax policies, indigeniza-tion or even nationalization, technology transferrequirements, equity ownership restrictions, andindustry entry barriers.3 Financial analysts possessexpertise in forecasting the financial prospectsof a firm primarily because of their understan-ding of the market in which the firm operates.However, analysts are less equipped to predictthe outcomes of political decisions, and much lesstheir expected effect on the future cash flow of afirm.4
We argue that political connections add a dimen-sion to the task of forecasting corporate earnings.This aspect of complexity is not reflected in thehistorical information derived from a firm’s earn-ings attributes, such as the time-series patterns ofearnings or the characteristics of past accountingaccruals, mainly because the effects of political
connections are not normally recurring, nor arethey cyclical. The ability of politicians to influencecorporate performance is much less predictablethan normal business cycles, as changes in thepolitical landscape are not affected only by formalinstitutional arrangements, such as elections orappointments. Many random factors can easily andunexpectedly overwhelm the political equilibrium,including the physical health of connected politi-cians. For example, Fisman (2001) finds that theshare prices of companies connected to Indonesia’sPresident Suharto dropped upon news of hisdeclining health, which indicates that, althoughseemingly non-financial in nature, the news of apolitician’s personal well-being can substantiallyaffect the financial performance of the firms withwhich that politician is connected.
In addition, the impact of political connectionsinteracts with business cycles to obscure the latter’seffect on the reported accounting profits of con-nected firms. In times of business downturn inparticular, politicians may extend assistance toprop up the reported earnings of connected firms.For example, in 2003, Silvio Berlusconi, the Italianprime minister and owner of AC Milan footballclub, passed the ‘‘football savior’’ law that ‘‘permitsclubs to amortize the massive costs of playercontracts over 10 years rather than the shorterlifespan of the contracts’’ (Kapner, 2003: 26). At atime when most clubs in Italy were faced withfinancial problems without increasing sales reven-ue, the ratification of this law interrupted the time-series patterns of earnings for AC Milan by halvingits reported loss for the third quarter of 2003 to$33.8 million, which substantially altered thefinancial reporting outcome and created unex-pected complications for financial analysts.
Political Connections and Forecast AccuracyDuru and Reeb (2002) argue that earnings forecasterror depends on the difficulty or complexity of theforecasting task, and show that analyst earningsforecasts are less accurate for MNEs than fordomestic firms. We propose five non-mutuallyexclusive explanations for why political connec-tions increase information asymmetry betweenanalysts and managers and hence make analystforecasting more difficult.
First, political connections add a new dimensionto the earnings generation process. Krueger (1974)suggests that entrepreneurs expend resources onpoliticians to compete for the economic rentsthat may be granted by the government. The
Political forces, corruption, and analyst forecast accuracy Charles JP Chen et al
1507
Journal of International Business Studies
payback from political connections often comesunexpectedly, which inevitably disrupts the time-series pattern of the reported earnings of connectedfirms, thus making the analyst forecasting taskmore complex.5 These possible impacts on earningsmay be either direct (favorable tax treatment,profitable projects, preferential access to markets,cheap financing, and government subsidies)6 orindirect (injections of cash or non-cash assets thatincrease the future profitability of the connectedfirm). Either way, the increased uncertainty com-plicates the forecasting task of analysts. Further-more, there is additional uncertainty about whenand how much government aid the connected firmmight receive. Although political forces tend toremain stable between scheduled changes in thepolitical landscape, uncertain election outcomesand the eruption of scandals often swing the powerpendulum unexpectedly, leading to erratic award-ing or disruption of political favors that adverselyaffects the accuracy of analyst forecasts.
Second, political connections are often linked togreater opacity at the firm level (Bhattacharya,Daouk, & Welker, 2003). Government-providedshielding from market monitoring mechanisms(e.g., regulatory disclosure requirements and inves-tor demands for transparency) may allow managersof politically connected firms to enjoy morediscretion over financial disclosure. This increasesthe information asymmetry between analysts andmanagers, which in turn makes the analyst fore-casting task more difficult.
Third, variation in investor demand for informa-tion can affect the properties of analyst forecasts(Barth, Kasznik, & McNichols, 2001). Politicallyconnected firms have less need to raise capital fromthe public, because they can obtain privileged loansfrom banks that are influenced by politicians(Claessens, Feijen, & Laeven, 2008; Faccio et al.,2006). A firm’s need to access equity financingaffects the level of investor demand for its earningsforecast information, which in turn affects theexpected benefit of providing accurate earningsforecasts. Analysts may thus have less incentive todevelop expertise in forecasting the earnings ofconnected firms, which may adversely affect theirforecast accuracy.
Fourth, Chaney, Faccio, and Parsley (2007) showthat the quality of accounting information issignificantly worse for politically connected firmsthan for their non-connected counterparts, andthat firms with stronger political connections havethe worst-quality accounting information. Their
evidence supports the notion that politicallyconnected firms attempt to obscure their gainsfrom politicians in their reported accounting infor-mation. Previous studies have found that account-ing information quality is positively correlatedwith analyst forecast accuracy (Hope, 2003). Hencewe can expect the earnings forecasts of connectedfirms to be less accurate than those of non-connected firms.
Finally, our proposal that political decisionsincrease the error in the earnings forecasts ofconnected firms is consistent with previous studiesrecording that the equity value of politically con-nected firms can be easily affected by politicalevents (Faccio, 2006; Fisman, 2001; Roberts, 1990).Fisman (2001) argues that ‘‘in Southeast Asia,political connectedness, rather than fundamentalssuch as productivity, [is] the primary determinantof profitability and this had led to distorted invest-ment decisions.’’ In addition, when governmentofficials lose their political influence, cash flow intothe firms with which they were connected willdwindle, and so too will firm value, as is indicatedby the findings of Fisman (2001) and Faccio andParsley (2006). Using a series of US cases, Hillman,Zardkoohi, and Bierman (1999) also show thatpolitical links positively affect firm value. Theunpredictable nature of the adverse effect of fallingout of political favor further complicates the earn-ings forecasting task.
These non-mutually exclusive explanations forwhy corporate political connections make the taskof earnings forecasting more difficult collectivelypredict that analysts are less likely to forecastthe future earnings of politically connected firmsaccurately.7
Hypothesis 1: Firms with political connectionsare associated with less accurate analyst earningsforecasts, ceteris paribus.
Political Connections, Corruption, and AnalystEarnings Forecast AccuracyCorruption as a social and economic phenomenonhas attracted much academic attention, includingthat from IB scholars. It can exist either explicitlyin the form of bribery or implicitly as ‘‘commission’’or exchange of favors. Though some early studiesconsider it a necessary facilitator for executingbusiness transactions in societies where corrup-tion is ubiquitous, more recent findings in themanagement and IB literature generally supportthe view that condemns corruption as a social
Political forces, corruption, and analyst forecast accuracy Charles JP Chen et al
1508
Journal of International Business Studies
evil, as it increases transaction costs and createssocial-cultural barriers to foreign direct inves-tment (FDI) (Cuervo-Cazurra, 2006; Zhao, Kim, &Du, 2003).
Faccio (2009) argues that politicians do not haveequal influence in all countries. She finds thatleverage is significantly higher for connected firmsin Malaysia, Russia, and Thailand; that connectedfirms are subject to lower tax rates in most coun-tries, but especially low rates only in Russia, whereconnected firms enjoy an extraordinary 73.27%lower tax rate; and that connected firms exhibit alower return on equity in all countries, but that thisdifference is significant only in Russia and Thai-land. Interestingly, the countries in which con-nected firms enjoy the most significant politicalbenefits are often those that are regarded ashaving less effective legal systems and higherlevels of corruption (La Porta, Lopez-de-Silanes,Shleifer, & Vishny, 1998). In a theoretical paper,Boddewyn (1988: 357) argues that ‘‘countrieswith poorly differentiated economic, political andsocial structures, without fairly independent insti-tutions and/or condoning the political enrichmentof leaders are more amenable to corruption byMNEs.’’
Corruption creates injustice in the legal systemand depreciates the value of public scrutiny. Incountries with high levels of corruption, financialmedia may be reduced to mimicking the voices ofpowerful politicians or corporations connected tothem. Financial analysts who publish forecaststhat are not preferred by connected firms or theirpolitical attache may be subject to undue pressureor harassment. As a result, analysts may beencouraged or even forced to forecast earnings toplease the connected firms and their politicians,even though such forecasts may not be consistentwith their professional judgment. Moreover, theresults of DiRienzo, Das, Cort, and Burbridge(2007) suggest that in countries with high levelsof corruption, the lack of transparency increasesinformation asymmetry and results in fewer trans-gressions by individuals, businesses, and the gov-ernment. Hence we propose that the benefits andcosts of acquiring political favor may vary acrossjurisdictions. Specifically, as the level of corruptionindicates how easy it is to reap the benefits ofpolitical connections, it can be expected that thefinancial results of connected firms will be moreinfluenced by the payoffs they receive from politi-cians in jurisdictions where a high level of corrup-tion creates more opportunities for distributing
political favors. Our second hypothesis is statedas follows:
Hypothesis 2: The effect of political connectionson analyst forecast error is stronger in jurisdic-tions with higher levels of corruption, ceterisparibus.
MEASUREMENT OF VARIABLES ANDEMPIRICAL MODELS
Measuring Political Connections and CorruptionLevelThis study focuses on high-level corporate politicalconnections by following Faccio’s (2006: 369)definition whereby
a company is identified as being connected with a politician
if at least one of its large shareholders (anyone controlling
at least 10% of voting shares) or one of its top officers (CEO,
president, vice-president, chairman, or secretary) is a
member of parliament, a minister, or is closely related to a
top politician or party.8
This variable takes the value of 1 for connectedfirms and 0 otherwise.
As discussed, the impact of political connectionson the analyst forecasting task is influenced by theexpected net benefit of political favoritism, whichin turn is jointly determined by the level ofcorruption in the country. To measure the level ofcorruption, we employ the Corruption PerceptionsIndex (CPI) provided by Transparency Interna-tional. It reflects the annual ranking of 180countries around the world, produced by expertassessments and opinion surveys from multiplesources (e.g., 11 independent institutions in 2008).The CPI captures the overall extent of corruption(frequency and/or size of bribes) in the public andpolitical sectors. The valuation of corruption incountries is conducted by country experts, bothnon-resident and resident. In determining themean value for a country, the ranks reported byeach individual source are aggregated and standar-dized. Countries with relatively low levels ofperceived corruption achieve high CPI scores,which could also be viewed as the effectiveness ofcountry-level anti-corruption efforts.9 We constructa corruption measure (Corrupt) which is CPI scaledby its maximum value and multiplied by a negativeone to facilitate discussion of the empirical results.Therefore high Corrupt values indicate high levelsof corruption hereafter.
Political forces, corruption, and analyst forecast accuracy Charles JP Chen et al
1509
Journal of International Business Studies
Measuring Forecast ErrorIn the literature on financial analyst forecasting,the absolute value of forecast error has beenemployed as a proxy for analyst ability to accu-rately forecast earnings, signed forecast error hasbeen used as a proxy for forecast optimism, andthe dispersion of forecasted earnings has beenemployed as a proxy for the disagreement amonganalysts. To make this study more focused, weconcentrate on forecast error in testing our hypoth-eses.10 Following previous studies (Duru & Reeb,2002; Hope, 2003), we define forecast error as theabsolute value of the difference between forecastedand actual earnings, scaled by the stock price attime t�1 (the beginning of year t).11
Fcst Errort ¼FORECASTt�1
t � EARNt
�� ��PRICEt�1
ð1Þ
where Fcst_Errort is the analyst consensus forecasterror in period t, FORECASTt
t�1 is the 3-monthaverage consensus forecast of earnings per share forperiod t compiled by IBES during the 3-monthperiod from 8 months to 6 months before the fiscalyear-end, EARNt is the actual earnings per sharebefore extraordinary items for period t, andPRICEt�1 is the stock price at the end of the fiscalyear (t�1).12
Control VariablesTo make an incremental contribution to theliterature by testing our hypotheses, it is necessaryto control for factors that have already beenidentified by prior studies as systematically affect-ing analyst forecast accuracy. Table 1 summarizesthe definitions of and data sources for the test andcontrol variables. Our choice of control variables isguided by Francis, LaFond, Olsson, and Schipper(2004), Hope (2003), and Duru and Reeb (2002). Weinclude the number of analysts following a firm(Num_Fcst) as a proxy for analyst incentive toreduce forecast error in the ongoing competitionfor reputation. Disclose represents the Center forInternational Financial Analysis and Research(CIFAR) firm-level disclosure index (Hope, 2003),which proxies for the firm-level transparency offinancial information disclosures. Leverage is com-puted as the ratio of long-term debt to shareholderequity. Acc_Quality is the standard deviation of afirm’s residuals from the annual cross-sectionalestimations of the modified Dechow–Dichev modelover the preceding 5 years (Chaney et al., 2007).Thus higher Acc_Quality values indicate lowerlevels of firm’s accrual quality.
Following Francis et al. (2004), we control for theinnate sources of earnings attributes, including firmsize13 (Size), variation in cash flow from operations
Table 1 Main variables used in this study
Variable Definition Data source(s)
Fcst_Error Absolute value of the difference between the mean forecast and actual EPS scaled by
the stock price at the beginning of the fiscal year.
I/B/E/S
Polit_Conn An indicator variable for politically connected firms. Faccio (2006)
Corrupt Corruption index. The CPI value provided by Transparency International is higher for
countries with lower levels of perceived corruption. We scale it by the maximum value
of this variable, and multiply it by a negative 1 in all regression analysis to facilitate
discussion of the empirical results.
Transparency
International
Num_Fcst Number of analyst forecasts. I/B/E/S
Disclose Firm-level total annual report disclosure scores. Hope (2003), CIFAR
Leverage Ratio of long-term debt to shareholder equity. Global Vantage
Acc_Quality Standard deviation of a firm’s residuals from year t�4 to t taken from time-series
cross-sectional estimations of fitted values that regress total current accruals on change in
sales, GPPE, and industry and time dummies. Refer to Chaney et al. (2007) for details.
Global Vantage
Size Log of total assets. Global Vantage
s(CFO) Standard deviation of a firm’s rolling 10-year cash flow from operations, deflated by the
average of the beginning and end balances of total assets.
Global Vantage
s(Sales) Standard deviation of a firm’s rolling 10-year sales revenue, deflated by the average of
the beginning and end balances of total assets.
Global Vantage
Neg_Earn Proportion of losses over the preceding 10 years. Global Vantage
OperCycle Log of the sum of a firm’s days of accounts receivable and days of inventory. Global Vantage
Political forces, corruption, and analyst forecast accuracy Charles JP Chen et al
1510
Journal of International Business Studies
(s(CFO)), variation in sales revenue (s(Sales)), lossfrequency (Neg_Earn), and length of operatingcycle (OperCycle). We also control for the industryin which the firm operates using the Fama–French48-industry classification (Fama & French, 1997).14
To ensure brevity, readers are directed to the citedreferences for a detailed discussion of these controlvariables.
This gives us a model with which to test ouranalyst task difficulty hypothesis (Hypothesis 1).
Fcst Errorit ¼ a0 þ a1Polit Connit þ a2Num Fcstit
þ a3Discloseit þ a4Leverageit
þ a5Acc Qualityit þ a6Sizeit
þ a7s CFOð Þit þ a8s Salesð Þitþ a9Neg Earnit þ a10OperCycleit
þ SatYearDummyt
þ SajIndustryDummyj þ eit
ð2Þ
The following model is used to test our corruptioneffect hypotheses (Hypothesis 2).
Fcst Errorit ¼ b0 þ b1Polit Connit þ b2Corruptit
þ b3Politit�Corrupt Cit
þ b4Num Fcstit þ b5Discloseit
þ b6Leverageit þ b7Acc Qualityit
þ b8Sizeit þ b9sðCFOÞit þ b10sðSalesÞitþ b11Neg Earnit þ b12OperCycleit
þX
btYearDummyt
þX
bjIndustryDummyj þ nit
ð3Þ
where the variable on the left-hand side is analystforecast error (Fcst_Error), and Polit_Conn is anindicator variable that takes the value 1 forpolitically connected firms and 0 otherwise. Cor-rupt is the CPI index scaled by its maximum valueand multiplied by a negative one. The variablePolit�Corrupt_C is the interaction term betweenPolit_Conn and Corrupt_C, which is Corruptminus its mean value. This centering process isa common econometric technique for avoidingcollinearity between Corrupt and its interactionwith Polit_Conn. Smith and Sasaki (1979) suggestthat this process will yield low correlations bet-ween the product term and the component vari-ables of the term. This transformation will leaveunchanged the values of coefficients of Corrupt and
the multiplicative term of political connection andCorrupt, but will alter the values of the coefficientof political connection (Polit_Conn) and the inter-cept (Jaccard, Wan, & Turrisi, 1990).
DATA SOURCES AND SAMPLE DESCRIPTION
Sample SelectionWe have constructed a one-to-all, by-year, by-country, and by-industry matched sample for ourempirical tests.15 The sample excludes industries inwhich there were no politically connected obser-vations in the country, year, or industry. Thissampling approach minimizes the probability thatour findings are caused by year, country, or industrydifferences between connected and non-connectedfirms. The Global Vantage and International I/B/E/Sdatabases are used to construct the sample. We startwith a list of politically connected firms, generouslyprovided by Mara Faccio, which includes 541companies in 35 jurisdictions. We identify 344 ofthese companies using Global Vantage informationfrom the period 1997–2001. Companies without aGlobal Vantage identifier (GVKEY) are not inclu-ded in the sample. We further exclude 14 utilitycompanies and financial institutions, and also com-panies without sufficient information to computethe analyst forecast attributes (121 firms), firm-leveldisclosure scores (60 firms), innate accountingquality measures (8 firms), or matched firms (27firms). Our final sample consists of 114 politicallyconnected firms with 349 firm–year observations in17 jurisdictions between 1997 and 2001.
Table 2 shows 5368 firm–year observations for1895 non-connected firms in the same period,which indicates that there are far more non-connected firms than connected firms. As discussedin the section on the robustness checks, a boot-strapping procedure and one-to-one, one-to-three,and one-to-five matched samples are employed toaddress the concern that the number of politicallyconnected observations may not be sufficient. Itis possible that some connected firms have beenmisclassified as non-connected, because our defini-tion focuses on high-level corporate political con-nections. However, neither the small sample sizenor misclassification errors of this type wouldcreate a bias toward finding significant results;therefore we do not consider them to be a signi-ficant threat to the internal validity of our study,unless our results are not statistically significantin the expected direction. Panel A of Table 216
also shows that the UK sample represents almost
Political forces, corruption, and analyst forecast accuracy Charles JP Chen et al
1511
Journal of International Business Studies
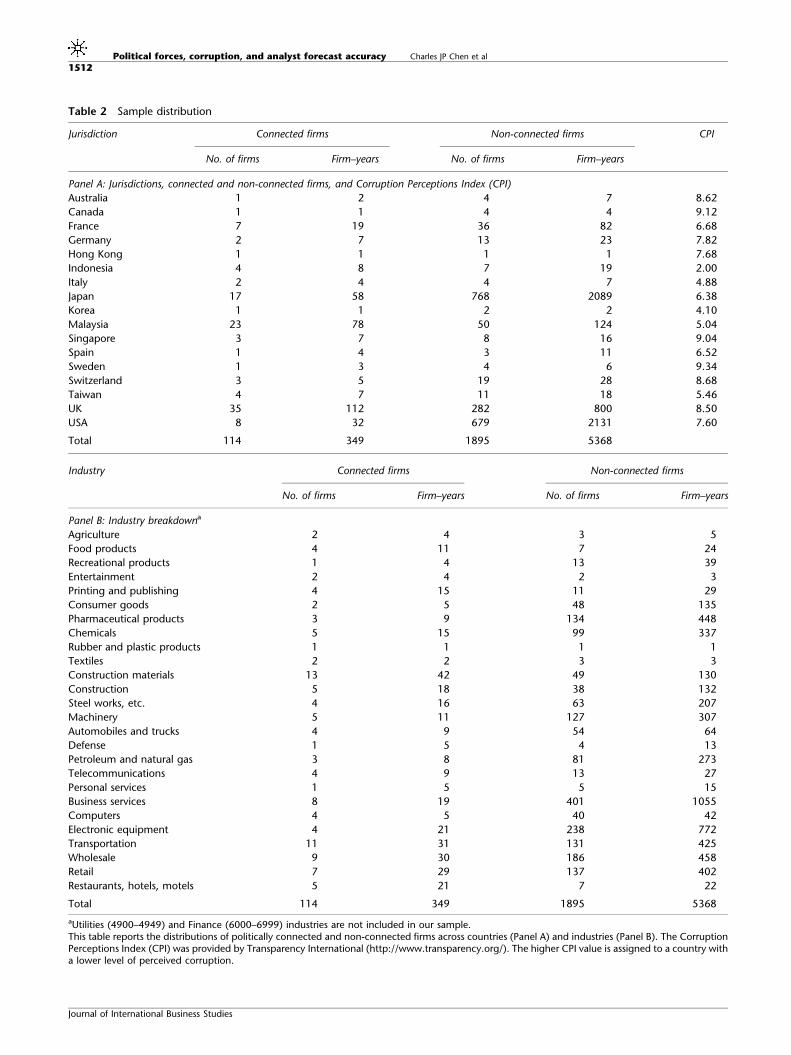
Table 2 Sample distribution
Jurisdiction Connected firms Non-connected firms CPI
No. of firms Firm–years No. of firms Firm–years
Panel A: Jurisdictions, connected and non-connected firms, and Corruption Perceptions Index (CPI)
Australia 1 2 4 7 8.62
Canada 1 1 4 4 9.12
France 7 19 36 82 6.68
Germany 2 7 13 23 7.82
Hong Kong 1 1 1 1 7.68
Indonesia 4 8 7 19 2.00
Italy 2 4 4 7 4.88
Japan 17 58 768 2089 6.38
Korea 1 1 2 2 4.10
Malaysia 23 78 50 124 5.04
Singapore 3 7 8 16 9.04
Spain 1 4 3 11 6.52
Sweden 1 3 4 6 9.34
Switzerland 3 5 19 28 8.68
Taiwan 4 7 11 18 5.46
UK 35 112 282 800 8.50
USA 8 32 679 2131 7.60
Total 114 349 1895 5368
Industry Connected firms Non-connected firms
No. of firms Firm–years No. of firms Firm–years
Panel B: Industry breakdowna
Agriculture 2 4 3 5
Food products 4 11 7 24
Recreational products 1 4 13 39
Entertainment 2 4 2 3
Printing and publishing 4 15 11 29
Consumer goods 2 5 48 135
Pharmaceutical products 3 9 134 448
Chemicals 5 15 99 337
Rubber and plastic products 1 1 1 1
Textiles 2 2 3 3
Construction materials 13 42 49 130
Construction 5 18 38 132
Steel works, etc. 4 16 63 207
Machinery 5 11 127 307
Automobiles and trucks 4 9 54 64
Defense 1 5 4 13
Petroleum and natural gas 3 8 81 273
Telecommunications 4 9 13 27
Personal services 1 5 5 15
Business services 8 19 401 1055
Computers 4 5 40 42
Electronic equipment 4 21 238 772
Transportation 11 31 131 425
Wholesale 9 30 186 458
Retail 7 29 137 402
Restaurants, hotels, motels 5 21 7 22
Total 114 349 1895 5368
aUtilities (4900–4949) and Finance (6000–6999) industries are not included in our sample.This table reports the distributions of politically connected and non-connected firms across countries (Panel A) and industries (Panel B). The CorruptionPerceptions Index (CPI) was provided by Transparency International (http://www.transparency.org/). The higher CPI value is assigned to a country witha lower level of perceived corruption.
Political forces, corruption, and analyst forecast accuracy Charles JP Chen et al
1512
Journal of International Business Studies
one-third of all of the politically connected firms inour study, and that less than 0.1% of the firms inthe US sample have political connections, a figurethat is substantially lower than the sample averageof more than 4%. We address the issue of a possiblesampling bias effect by testing our hypotheses on asample without UK or US firms in the robustnesschecks.
Panel B of Table 2 indicates that our sample iswell distributed across industries. A large numberof them are in the traditional industries such asconstruction materials, construction, steelworks,machinery, electronic equipment, transportation,wholesale, and retail. However, the industry thathas the largest number of observations amongthe non-traditional industries is business services,which can be explained by two factors. First, therecent growth in the service industry has addedmany new members to it. Second, Global Vantage,the database used for this study, tends to covermature companies in the developed economieswhile under-representing developing economies.In contrast to common belief, high-level politicalconnections do not cluster in the pharmaceuticals,petroleum and defense industries in our sample.A possible explanation may be that these arevery sensitive industries that attract increasedmedia attention and public scrutiny: consequentlycorporate political connections may be concealed,making them more difficult to track though publicinformation.17
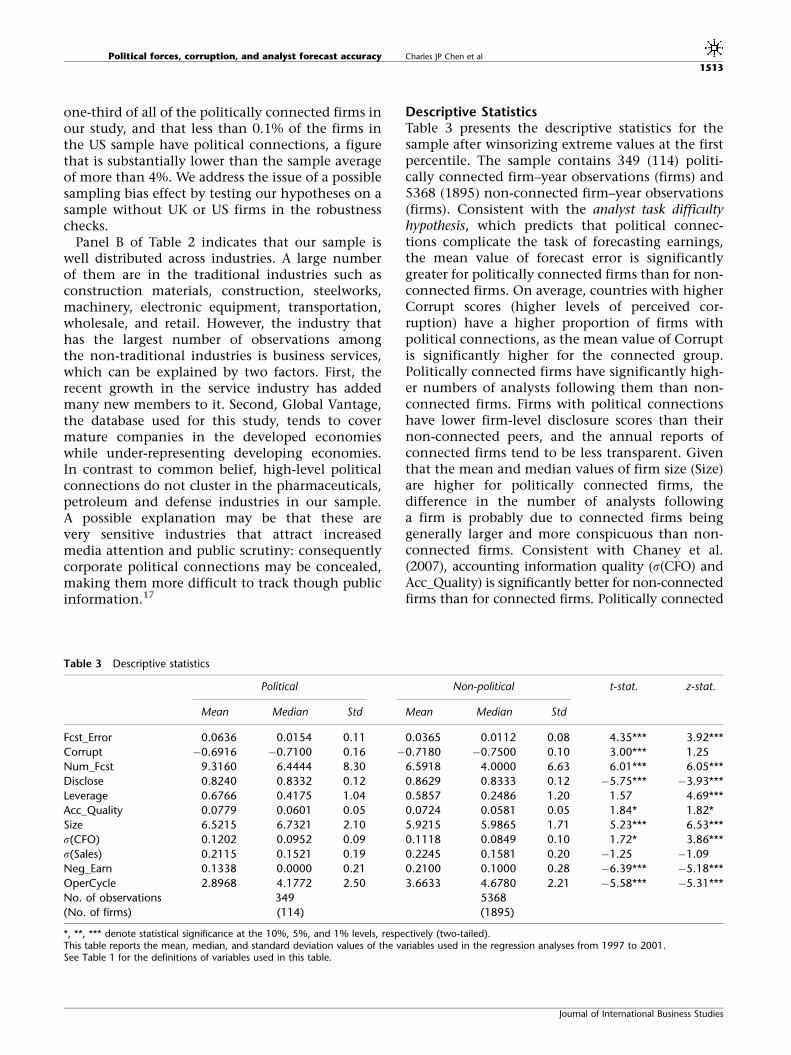
Descriptive StatisticsTable 3 presents the descriptive statistics for thesample after winsorizing extreme values at the firstpercentile. The sample contains 349 (114) politi-cally connected firm–year observations (firms) and5368 (1895) non-connected firm–year observations(firms). Consistent with the analyst task difficultyhypothesis, which predicts that political connec-tions complicate the task of forecasting earnings,the mean value of forecast error is significantlygreater for politically connected firms than for non-connected firms. On average, countries with higherCorrupt scores (higher levels of perceived cor-ruption) have a higher proportion of firms withpolitical connections, as the mean value of Corruptis significantly higher for the connected group.Politically connected firms have significantly high-er numbers of analysts following them than non-connected firms. Firms with political connectionshave lower firm-level disclosure scores than theirnon-connected peers, and the annual reports ofconnected firms tend to be less transparent. Giventhat the mean and median values of firm size (Size)are higher for politically connected firms, thedifference in the number of analysts followinga firm is probably due to connected firms beinggenerally larger and more conspicuous than non-connected firms. Consistent with Chaney et al.(2007), accounting information quality (s(CFO) andAcc_Quality) is significantly better for non-connectedfirms than for connected firms. Politically connected
Table 3 Descriptive statistics
Political Non-political t-stat. z-stat.
Mean Median Std Mean Median Std
Fcst_Error 0.0636 0.0154 0.11 0.0365 0.0112 0.08 4.35*** 3.92***
Corrupt �0.6916 �0.7100 0.16 �0.7180 �0.7500 0.10 3.00*** 1.25
Num_Fcst 9.3160 6.4444 8.30 6.5918 4.0000 6.63 6.01*** 6.05***
Disclose 0.8240 0.8332 0.12 0.8629 0.8333 0.12 �5.75*** �3.93***
Leverage 0.6766 0.4175 1.04 0.5857 0.2486 1.20 1.57 4.69***
Acc_Quality 0.0779 0.0601 0.05 0.0724 0.0581 0.05 1.84* 1.82*
Size 6.5215 6.7321 2.10 5.9215 5.9865 1.71 5.23*** 6.53***
s(CFO) 0.1202 0.0952 0.09 0.1118 0.0849 0.10 1.72* 3.86***
s(Sales) 0.2115 0.1521 0.19 0.2245 0.1581 0.20 �1.25 �1.09
Neg_Earn 0.1338 0.0000 0.21 0.2100 0.1000 0.28 �6.39*** �5.18***
OperCycle 2.8968 4.1772 2.50 3.6633 4.6780 2.21 �5.58*** �5.31***
No. of observations 349 5368
(No. of firms) (114) (1895)
*, **, *** denote statistical significance at the 10%, 5%, and 1% levels, respectively (two-tailed).This table reports the mean, median, and standard deviation values of the variables used in the regression analyses from 1997 to 2001.See Table 1 for the definitions of variables used in this table.
Political forces, corruption, and analyst forecast accuracy Charles JP Chen et al
1513
Journal of International Business Studies
firms report losses less frequently, as the mean andmedian values of the proportion of years withreported negative earnings (Neg_Earn) are signifi-cantly smaller for the connected group. Firms withpolitical connections also have a shorter averageoperating cycle. These results are generally consistentwith our argument that connected firms enjoypolitical benefits that complicate the earnings gen-eration process and are inconsistent with the income-smoothing argument. We next discuss the results ofthe correlation analysis.
EMPIRICAL ANALYSIS
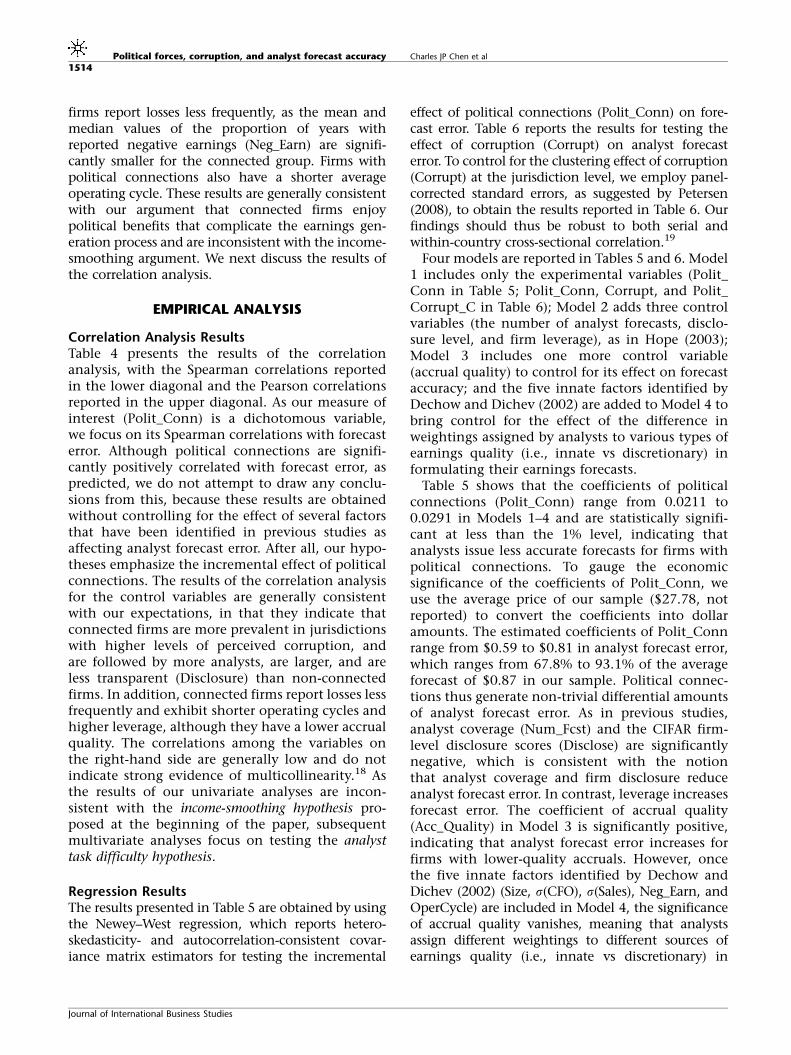
Correlation Analysis ResultsTable 4 presents the results of the correlationanalysis, with the Spearman correlations reportedin the lower diagonal and the Pearson correlationsreported in the upper diagonal. As our measure ofinterest (Polit_Conn) is a dichotomous variable,we focus on its Spearman correlations with forecasterror. Although political connections are signifi-cantly positively correlated with forecast error, aspredicted, we do not attempt to draw any conclu-sions from this, because these results are obtainedwithout controlling for the effect of several factorsthat have been identified in previous studies asaffecting analyst forecast error. After all, our hypo-theses emphasize the incremental effect of politicalconnections. The results of the correlation analysisfor the control variables are generally consistentwith our expectations, in that they indicate thatconnected firms are more prevalent in jurisdictionswith higher levels of perceived corruption, andare followed by more analysts, are larger, and areless transparent (Disclosure) than non-connectedfirms. In addition, connected firms report losses lessfrequently and exhibit shorter operating cycles andhigher leverage, although they have a lower accrualquality. The correlations among the variables onthe right-hand side are generally low and do notindicate strong evidence of multicollinearity.18 Asthe results of our univariate analyses are incon-sistent with the income-smoothing hypothesis pro-posed at the beginning of the paper, subsequentmultivariate analyses focus on testing the analysttask difficulty hypothesis.
Regression ResultsThe results presented in Table 5 are obtained by usingthe Newey–West regression, which reports hetero-skedasticity- and autocorrelation-consistent covar-iance matrix estimators for testing the incremental
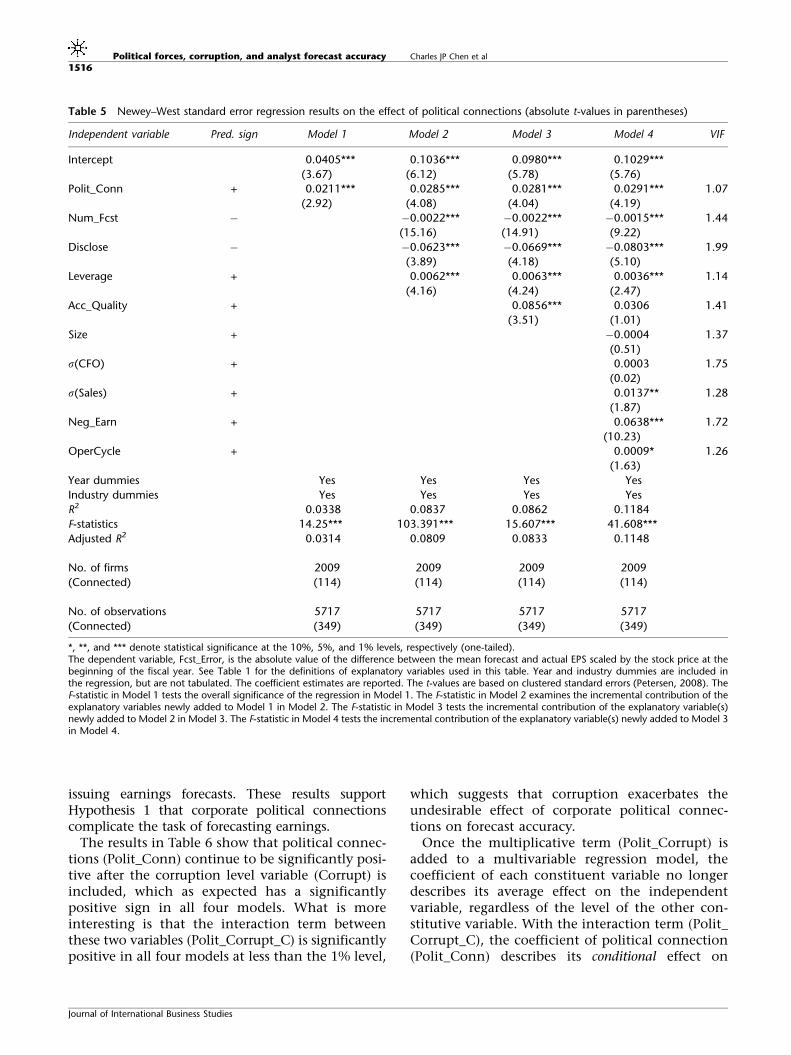
effect of political connections (Polit_Conn) on fore-cast error. Table 6 reports the results for testing theeffect of corruption (Corrupt) on analyst forecasterror. To control for the clustering effect of corruption(Corrupt) at the jurisdiction level, we employ panel-corrected standard errors, as suggested by Petersen(2008), to obtain the results reported in Table 6. Ourfindings should thus be robust to both serial andwithin-country cross-sectional correlation.19
Four models are reported in Tables 5 and 6. Model1 includes only the experimental variables (Polit_Conn in Table 5; Polit_Conn, Corrupt, and Polit_Corrupt_C in Table 6); Model 2 adds three controlvariables (the number of analyst forecasts, disclo-sure level, and firm leverage), as in Hope (2003);Model 3 includes one more control variable(accrual quality) to control for its effect on forecastaccuracy; and the five innate factors identified byDechow and Dichev (2002) are added to Model 4 tobring control for the effect of the difference inweightings assigned by analysts to various types ofearnings quality (i.e., innate vs discretionary) informulating their earnings forecasts.
Table 5 shows that the coefficients of politicalconnections (Polit_Conn) range from 0.0211 to0.0291 in Models 1–4 and are statistically signifi-cant at less than the 1% level, indicating thatanalysts issue less accurate forecasts for firms withpolitical connections. To gauge the economicsignificance of the coefficients of Polit_Conn, weuse the average price of our sample ($27.78, notreported) to convert the coefficients into dollaramounts. The estimated coefficients of Polit_Connrange from $0.59 to $0.81 in analyst forecast error,which ranges from 67.8% to 93.1% of the averageforecast of $0.87 in our sample. Political connec-tions thus generate non-trivial differential amountsof analyst forecast error. As in previous studies,analyst coverage (Num_Fcst) and the CIFAR firm-level disclosure scores (Disclose) are significantlynegative, which is consistent with the notionthat analyst coverage and firm disclosure reduceanalyst forecast error. In contrast, leverage increasesforecast error. The coefficient of accrual quality(Acc_Quality) in Model 3 is significantly positive,indicating that analyst forecast error increases forfirms with lower-quality accruals. However, oncethe five innate factors identified by Dechow andDichev (2002) (Size, s(CFO), s(Sales), Neg_Earn, andOperCycle) are included in Model 4, the significanceof accrual quality vanishes, meaning that analystsassign different weightings to different sources ofearnings quality (i.e., innate vs discretionary) in
Political forces, corruption, and analyst forecast accuracy Charles JP Chen et al
1514
Journal of International Business Studies
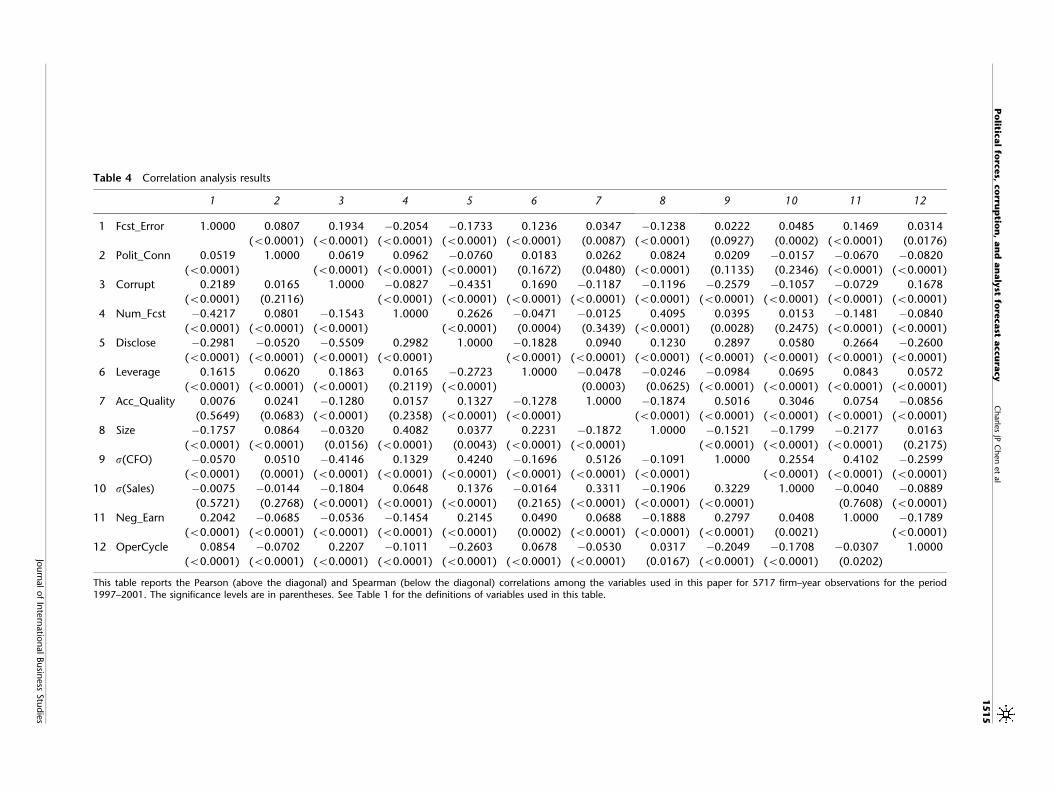
Table 4 Correlation analysis results
1 2 3 4 5 6 7 8 9 10 11 12
1 Fcst_Error 1.0000 0.0807 0.1934 �0.2054 �0.1733 0.1236 0.0347 �0.1238 0.0222 0.0485 0.1469 0.0314
(o0.0001) (o0.0001) (o0.0001) (o0.0001) (o0.0001) (0.0087) (o0.0001) (0.0927) (0.0002) (o0.0001) (0.0176)
2 Polit_Conn 0.0519 1.0000 0.0619 0.0962 �0.0760 0.0183 0.0262 0.0824 0.0209 �0.0157 �0.0670 �0.0820
(o0.0001) (o0.0001) (o0.0001) (o0.0001) (0.1672) (0.0480) (o0.0001) (0.1135) (0.2346) (o0.0001) (o0.0001)
3 Corrupt 0.2189 0.0165 1.0000 �0.0827 �0.4351 0.1690 �0.1187 �0.1196 �0.2579 �0.1057 �0.0729 0.1678
(o0.0001) (0.2116) (o0.0001) (o0.0001) (o0.0001) (o0.0001) (o0.0001) (o0.0001) (o0.0001) (o0.0001) (o0.0001)
4 Num_Fcst �0.4217 0.0801 �0.1543 1.0000 0.2626 �0.0471 �0.0125 0.4095 0.0395 0.0153 �0.1481 �0.0840
(o0.0001) (o0.0001) (o0.0001) (o0.0001) (0.0004) (0.3439) (o0.0001) (0.0028) (0.2475) (o0.0001) (o0.0001)
5 Disclose �0.2981 �0.0520 �0.5509 0.2982 1.0000 �0.1828 0.0940 0.1230 0.2897 0.0580 0.2664 �0.2600
(o0.0001) (o0.0001) (o0.0001) (o0.0001) (o0.0001) (o0.0001) (o0.0001) (o0.0001) (o0.0001) (o0.0001) (o0.0001)
6 Leverage 0.1615 0.0620 0.1863 0.0165 �0.2723 1.0000 �0.0478 �0.0246 �0.0984 0.0695 0.0843 0.0572
(o0.0001) (o0.0001) (o0.0001) (0.2119) (o0.0001) (0.0003) (0.0625) (o0.0001) (o0.0001) (o0.0001) (o0.0001)
7 Acc_Quality 0.0076 0.0241 �0.1280 0.0157 0.1327 �0.1278 1.0000 �0.1874 0.5016 0.3046 0.0754 �0.0856
(0.5649) (0.0683) (o0.0001) (0.2358) (o0.0001) (o0.0001) (o0.0001) (o0.0001) (o0.0001) (o0.0001) (o0.0001)
8 Size �0.1757 0.0864 �0.0320 0.4082 0.0377 0.2231 �0.1872 1.0000 �0.1521 �0.1799 �0.2177 0.0163
(o0.0001) (o0.0001) (0.0156) (o0.0001) (0.0043) (o0.0001) (o0.0001) (o0.0001) (o0.0001) (o0.0001) (0.2175)
9 s(CFO) �0.0570 0.0510 �0.4146 0.1329 0.4240 �0.1696 0.5126 �0.1091 1.0000 0.2554 0.4102 �0.2599
(o0.0001) (0.0001) (o0.0001) (o0.0001) (o0.0001) (o0.0001) (o0.0001) (o0.0001) (o0.0001) (o0.0001) (o0.0001)
10 s(Sales) �0.0075 �0.0144 �0.1804 0.0648 0.1376 �0.0164 0.3311 �0.1906 0.3229 1.0000 �0.0040 �0.0889
(0.5721) (0.2768) (o0.0001) (o0.0001) (o0.0001) (0.2165) (o0.0001) (o0.0001) (o0.0001) (0.7608) (o0.0001)
11 Neg_Earn 0.2042 �0.0685 �0.0536 �0.1454 0.2145 0.0490 0.0688 �0.1888 0.2797 0.0408 1.0000 �0.1789
(o0.0001) (o0.0001) (o0.0001) (o0.0001) (o0.0001) (0.0002) (o0.0001) (o0.0001) (o0.0001) (0.0021) (o0.0001)
12 OperCycle 0.0854 �0.0702 0.2207 �0.1011 �0.2603 0.0678 �0.0530 0.0317 �0.2049 �0.1708 �0.0307 1.0000
(o0.0001) (o0.0001) (o0.0001) (o0.0001) (o0.0001) (o0.0001) (o0.0001) (0.0167) (o0.0001) (o0.0001) (0.0202)
This table reports the Pearson (above the diagonal) and Spearman (below the diagonal) correlations among the variables used in this paper for 5717 firm–year observations for the period1997–2001. The significance levels are in parentheses. See Table 1 for the definitions of variables used in this table.
Po
litical
forc
es,
co
rrup
tion
,an
dan
aly
stfo
recast
accu
racy
Ch
arle
sJP
Ch
en
et
al
15
15
Journ
al
of
Inte
rnatio
nalBusin
ess
Stu
die
s
issuing earnings forecasts. These results supportHypothesis 1 that corporate political connectionscomplicate the task of forecasting earnings.
The results in Table 6 show that political connec-tions (Polit_Conn) continue to be significantly posi-tive after the corruption level variable (Corrupt) isincluded, which as expected has a significantlypositive sign in all four models. What is moreinteresting is that the interaction term betweenthese two variables (Polit_Corrupt_C) is significantlypositive in all four models at less than the 1% level,
which suggests that corruption exacerbates theundesirable effect of corporate political connec-tions on forecast accuracy.
Once the multiplicative term (Polit_Corrupt) isadded to a multivariable regression model, thecoefficient of each constituent variable no longerdescribes its average effect on the independentvariable, regardless of the level of the other con-stitutive variable. With the interaction term (Polit_Corrupt_C), the coefficient of political connection(Polit_Conn) describes its conditional effect on
Table 5 Newey–West standard error regression results on the effect of political connections (absolute t-values in parentheses)
Independent variable Pred. sign Model 1 Model 2 Model 3 Model 4 VIF
Intercept 0.0405*** 0.1036*** 0.0980*** 0.1029***
(3.67) (6.12) (5.78) (5.76)
Polit_Conn + 0.0211*** 0.0285*** 0.0281*** 0.0291*** 1.07
(2.92) (4.08) (4.04) (4.19)
Num_Fcst � �0.0022*** �0.0022*** �0.0015*** 1.44
(15.16) (14.91) (9.22)
Disclose � �0.0623*** �0.0669*** �0.0803*** 1.99
(3.89) (4.18) (5.10)
Leverage + 0.0062*** 0.0063*** 0.0036*** 1.14
(4.16) (4.24) (2.47)
Acc_Quality + 0.0856*** 0.0306 1.41
(3.51) (1.01)
Size + �0.0004 1.37
(0.51)
s(CFO) + 0.0003 1.75
(0.02)
s(Sales) + 0.0137** 1.28
(1.87)
Neg_Earn + 0.0638*** 1.72
(10.23)
OperCycle + 0.0009* 1.26
(1.63)
Year dummies Yes Yes Yes Yes
Industry dummies Yes Yes Yes Yes
R2 0.0338 0.0837 0.0862 0.1184
F-statistics 14.25*** 103.391*** 15.607*** 41.608***
Adjusted R2 0.0314 0.0809 0.0833 0.1148
No. of firms 2009 2009 2009 2009
(Connected) (114) (114) (114) (114)
No. of observations 5717 5717 5717 5717
(Connected) (349) (349) (349) (349)
*, **, and *** denote statistical significance at the 10%, 5%, and 1% levels, respectively (one-tailed).The dependent variable, Fcst_Error, is the absolute value of the difference between the mean forecast and actual EPS scaled by the stock price at thebeginning of the fiscal year. See Table 1 for the definitions of explanatory variables used in this table. Year and industry dummies are included inthe regression, but are not tabulated. The coefficient estimates are reported. The t-values are based on clustered standard errors (Petersen, 2008). TheF-statistic in Model 1 tests the overall significance of the regression in Model 1. The F-statistic in Model 2 examines the incremental contribution of theexplanatory variables newly added to Model 1 in Model 2. The F-statistic in Model 3 tests the incremental contribution of the explanatory variable(s)newly added to Model 2 in Model 3. The F-statistic in Model 4 tests the incremental contribution of the explanatory variable(s) newly added to Model 3in Model 4.
Political forces, corruption, and analyst forecast accuracy Charles JP Chen et al
1516
Journal of International Business Studies
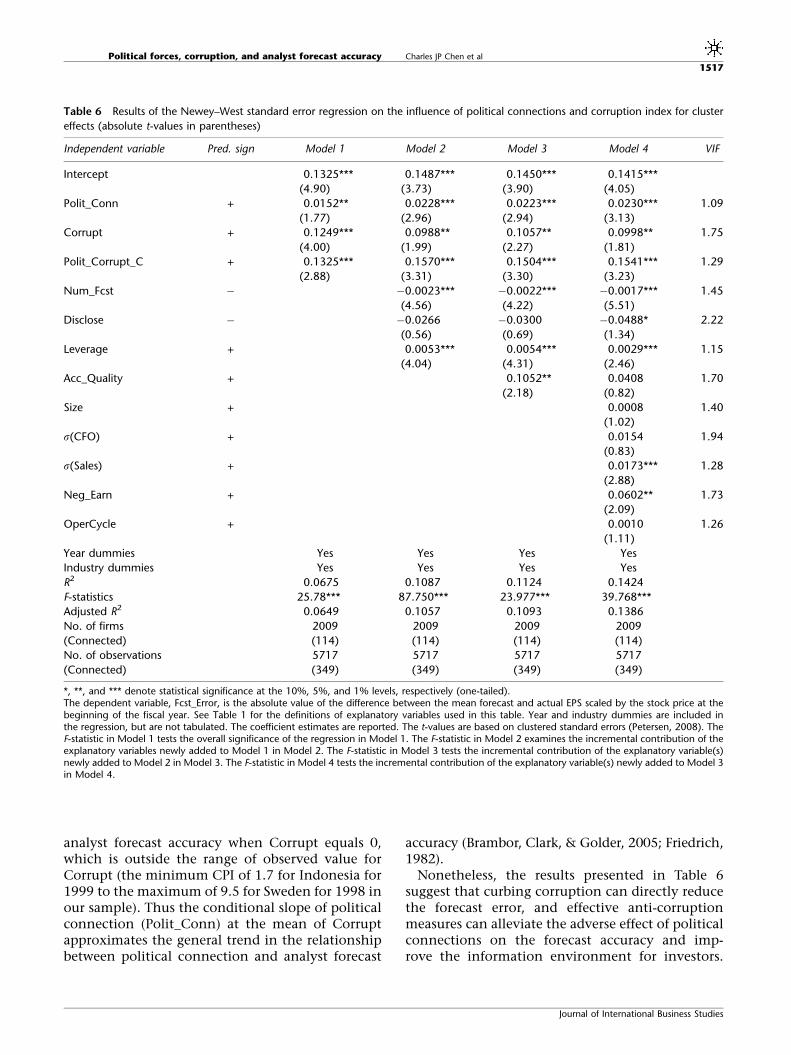
analyst forecast accuracy when Corrupt equals 0,which is outside the range of observed value forCorrupt (the minimum CPI of 1.7 for Indonesia for1999 to the maximum of 9.5 for Sweden for 1998 inour sample). Thus the conditional slope of politicalconnection (Polit_Conn) at the mean of Corruptapproximates the general trend in the relationshipbetween political connection and analyst forecast
accuracy (Brambor, Clark, & Golder, 2005; Friedrich,1982).
Nonetheless, the results presented in Table 6suggest that curbing corruption can directly reducethe forecast error, and effective anti-corruptionmeasures can alleviate the adverse effect of politicalconnections on the forecast accuracy and imp-rove the information environment for investors.
Table 6 Results of the Newey–West standard error regression on the influence of political connections and corruption index for cluster
effects (absolute t-values in parentheses)
Independent variable Pred. sign Model 1 Model 2 Model 3 Model 4 VIF
Intercept 0.1325*** 0.1487*** 0.1450*** 0.1415***
(4.90) (3.73) (3.90) (4.05)
Polit_Conn + 0.0152** 0.0228*** 0.0223*** 0.0230*** 1.09
(1.77) (2.96) (2.94) (3.13)
Corrupt + 0.1249*** 0.0988** 0.1057** 0.0998** 1.75
(4.00) (1.99) (2.27) (1.81)
Polit_Corrupt_C + 0.1325*** 0.1570*** 0.1504*** 0.1541*** 1.29
(2.88) (3.31) (3.30) (3.23)
Num_Fcst � �0.0023*** �0.0022*** �0.0017*** 1.45
(4.56) (4.22) (5.51)
Disclose � �0.0266 �0.0300 �0.0488* 2.22
(0.56) (0.69) (1.34)
Leverage + 0.0053*** 0.0054*** 0.0029*** 1.15
(4.04) (4.31) (2.46)
Acc_Quality + 0.1052** 0.0408 1.70
(2.18) (0.82)
Size + 0.0008 1.40
(1.02)
s(CFO) + 0.0154 1.94
(0.83)
s(Sales) + 0.0173*** 1.28
(2.88)
Neg_Earn + 0.0602** 1.73
(2.09)
OperCycle + 0.0010 1.26
(1.11)
Year dummies Yes Yes Yes Yes
Industry dummies Yes Yes Yes Yes
R2 0.0675 0.1087 0.1124 0.1424
F-statistics 25.78*** 87.750*** 23.977*** 39.768***
Adjusted R2 0.0649 0.1057 0.1093 0.1386
No. of firms 2009 2009 2009 2009
(Connected) (114) (114) (114) (114)
No. of observations 5717 5717 5717 5717
(Connected) (349) (349) (349) (349)
*, **, and *** denote statistical significance at the 10%, 5%, and 1% levels, respectively (one-tailed).The dependent variable, Fcst_Error, is the absolute value of the difference between the mean forecast and actual EPS scaled by the stock price at thebeginning of the fiscal year. See Table 1 for the definitions of explanatory variables used in this table. Year and industry dummies are included inthe regression, but are not tabulated. The coefficient estimates are reported. The t-values are based on clustered standard errors (Petersen, 2008). TheF-statistic in Model 1 tests the overall significance of the regression in Model 1. The F-statistic in Model 2 examines the incremental contribution of theexplanatory variables newly added to Model 1 in Model 2. The F-statistic in Model 3 tests the incremental contribution of the explanatory variable(s)newly added to Model 2 in Model 3. The F-statistic in Model 4 tests the incremental contribution of the explanatory variable(s) newly added to Model 3in Model 4.
Political forces, corruption, and analyst forecast accuracy Charles JP Chen et al
1517
Journal of International Business Studies
These results provide supporting evidence for ourHypothesis 2 that the impact of political connec-tions is more pronounced in jurisdictions withhigher levels of corruption. Collectively they pointto the important role that political connections andcorruption play in the examination of financialanalyst forecast accuracy.
ROBUSTNESS CHECKSIn this section we discuss the results of therobustness tests. To mitigate concerns about thesampling bias effect, we replicate the tests thatare reported in Table 6 but exclude all of the UK andUS firms, as a disproportionately large number ofthe connected firms in our sample are from the UK,and a disproportionately small number are fromthe US. The results (not tabulated, for brevity) forpolitical connection and corruption remain quali-tatively similar to those reported in Table 6. Theestimated coefficient on the interaction termbetween these two variables is positive in all fourmodels, but significant only in Models 1, 2, and 3,providing only partial support for Hypothesis 2,which could be due to the substantial reduction inthe sample size of connected firms. However, thisshould not be interpreted as contradictory to ourmain results, because the findings of subsequentbootstrapping regression analysis, which is adoptedspecifically for addressing the small sample con-cern, lend support to all of our hypotheses.
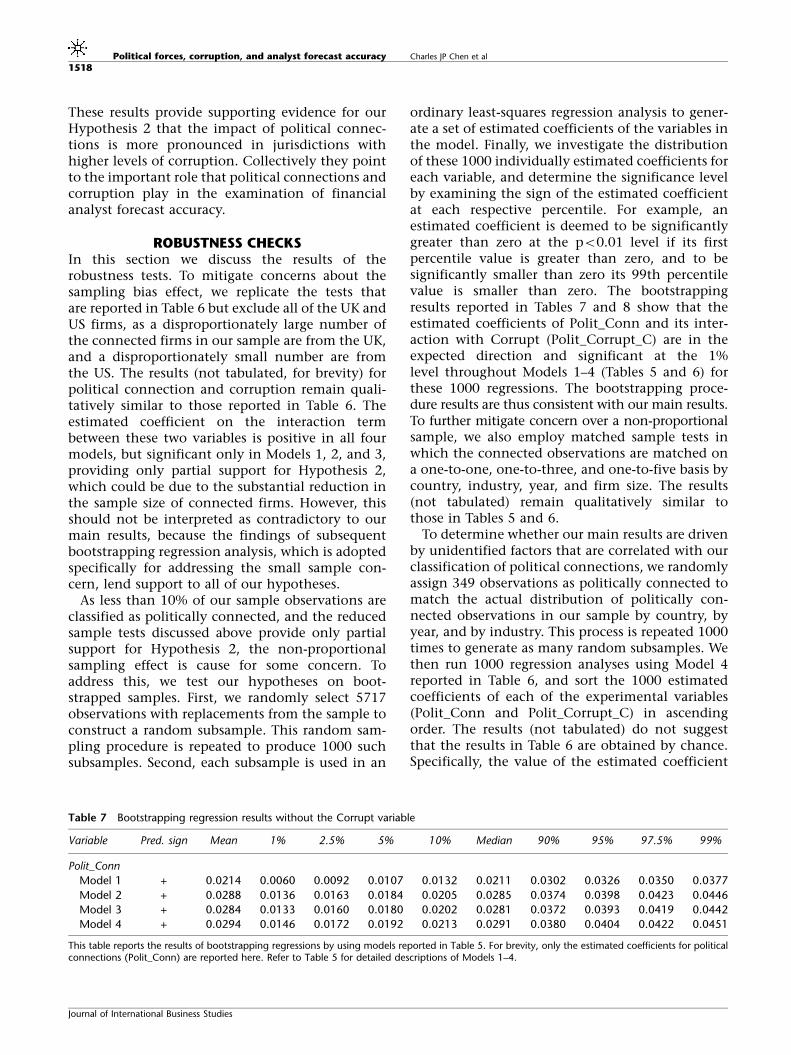
As less than 10% of our sample observations areclassified as politically connected, and the reducedsample tests discussed above provide only partialsupport for Hypothesis 2, the non-proportionalsampling effect is cause for some concern. Toaddress this, we test our hypotheses on boot-strapped samples. First, we randomly select 5717observations with replacements from the sample toconstruct a random subsample. This random sam-pling procedure is repeated to produce 1000 suchsubsamples. Second, each subsample is used in an
ordinary least-squares regression analysis to gener-ate a set of estimated coefficients of the variables inthe model. Finally, we investigate the distributionof these 1000 individually estimated coefficients foreach variable, and determine the significance levelby examining the sign of the estimated coefficientat each respective percentile. For example, anestimated coefficient is deemed to be significantlygreater than zero at the po0.01 level if its firstpercentile value is greater than zero, and to besignificantly smaller than zero its 99th percentilevalue is smaller than zero. The bootstrappingresults reported in Tables 7 and 8 show that theestimated coefficients of Polit_Conn and its inter-action with Corrupt (Polit_Corrupt_C) are in theexpected direction and significant at the 1%level throughout Models 1–4 (Tables 5 and 6) forthese 1000 regressions. The bootstrapping proce-dure results are thus consistent with our main results.To further mitigate concern over a non-proportionalsample, we also employ matched sample tests inwhich the connected observations are matched ona one-to-one, one-to-three, and one-to-five basis bycountry, industry, year, and firm size. The results(not tabulated) remain qualitatively similar tothose in Tables 5 and 6.
To determine whether our main results are drivenby unidentified factors that are correlated with ourclassification of political connections, we randomlyassign 349 observations as politically connected tomatch the actual distribution of politically con-nected observations in our sample by country, byyear, and by industry. This process is repeated 1000times to generate as many random subsamples. Wethen run 1000 regression analyses using Model 4reported in Table 6, and sort the 1000 estimatedcoefficients of each of the experimental variables(Polit_Conn and Polit_Corrupt_C) in ascendingorder. The results (not tabulated) do not suggestthat the results in Table 6 are obtained by chance.Specifically, the value of the estimated coefficient
Table 7 Bootstrapping regression results without the Corrupt variable
Variable Pred. sign Mean 1% 2.5% 5% 10% Median 90% 95% 97.5% 99%
Polit_Conn
Model 1 + 0.0214 0.0060 0.0092 0.0107 0.0132 0.0211 0.0302 0.0326 0.0350 0.0377
Model 2 + 0.0288 0.0136 0.0163 0.0184 0.0205 0.0285 0.0374 0.0398 0.0423 0.0446
Model 3 + 0.0284 0.0133 0.0160 0.0180 0.0202 0.0281 0.0372 0.0393 0.0419 0.0442
Model 4 + 0.0294 0.0146 0.0172 0.0192 0.0213 0.0291 0.0380 0.0404 0.0422 0.0451
This table reports the results of bootstrapping regressions by using models reported in Table 5. For brevity, only the estimated coefficients for politicalconnections (Polit_Conn) are reported here. Refer to Table 5 for detailed descriptions of Models 1–4.
Political forces, corruption, and analyst forecast accuracy Charles JP Chen et al
1518
Journal of International Business Studies
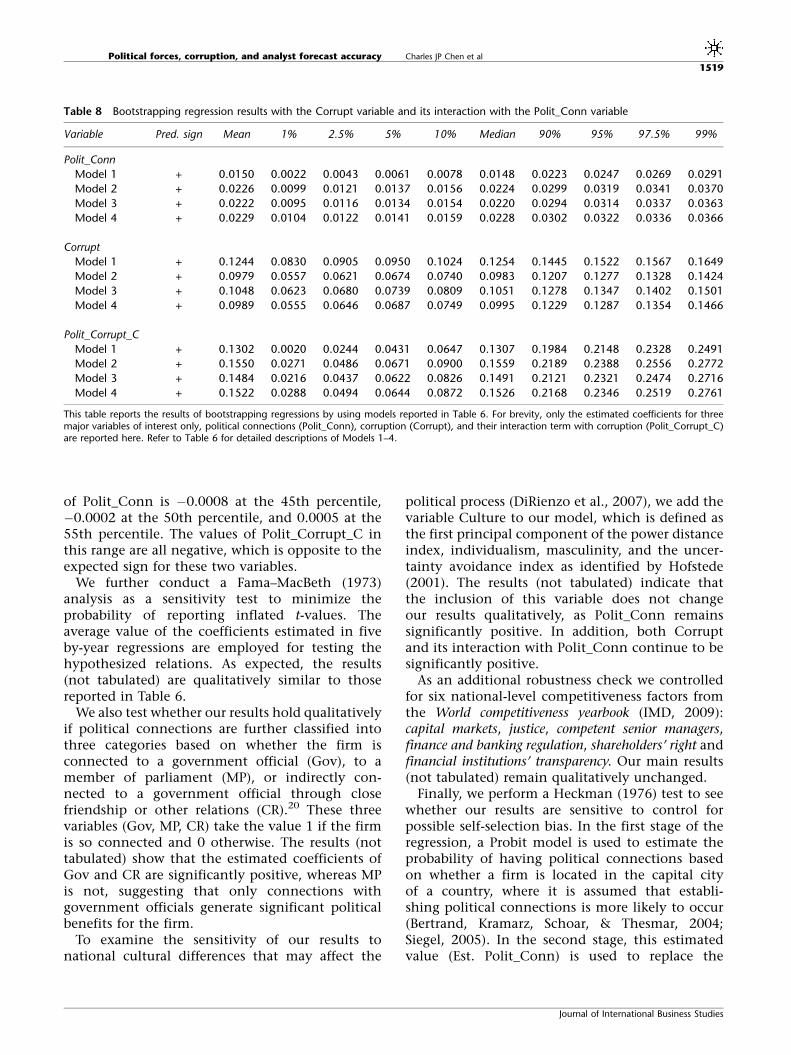
of Polit_Conn is �0.0008 at the 45th percentile,�0.0002 at the 50th percentile, and 0.0005 at the55th percentile. The values of Polit_Corrupt_C inthis range are all negative, which is opposite to theexpected sign for these two variables.
We further conduct a Fama–MacBeth (1973)analysis as a sensitivity test to minimize theprobability of reporting inflated t-values. Theaverage value of the coefficients estimated in fiveby-year regressions are employed for testing thehypothesized relations. As expected, the results(not tabulated) are qualitatively similar to thosereported in Table 6.
We also test whether our results hold qualitativelyif political connections are further classified intothree categories based on whether the firm isconnected to a government official (Gov), to amember of parliament (MP), or indirectly con-nected to a government official through closefriendship or other relations (CR).20 These threevariables (Gov, MP, CR) take the value 1 if the firmis so connected and 0 otherwise. The results (nottabulated) show that the estimated coefficients ofGov and CR are significantly positive, whereas MPis not, suggesting that only connections withgovernment officials generate significant politicalbenefits for the firm.
To examine the sensitivity of our results tonational cultural differences that may affect the
political process (DiRienzo et al., 2007), we add thevariable Culture to our model, which is defined asthe first principal component of the power distanceindex, individualism, masculinity, and the uncer-tainty avoidance index as identified by Hofstede(2001). The results (not tabulated) indicate thatthe inclusion of this variable does not changeour results qualitatively, as Polit_Conn remainssignificantly positive. In addition, both Corruptand its interaction with Polit_Conn continue to besignificantly positive.
As an additional robustness check we controlledfor six national-level competitiveness factors fromthe World competitiveness yearbook (IMD, 2009):capital markets, justice, competent senior managers,finance and banking regulation, shareholders’ right andfinancial institutions’ transparency. Our main results(not tabulated) remain qualitatively unchanged.
Finally, we perform a Heckman (1976) test to seewhether our results are sensitive to control forpossible self-selection bias. In the first stage of theregression, a Probit model is used to estimate theprobability of having political connections basedon whether a firm is located in the capital cityof a country, where it is assumed that establi-shing political connections is more likely to occur(Bertrand, Kramarz, Schoar, & Thesmar, 2004;Siegel, 2005). In the second stage, this estimatedvalue (Est. Polit_Conn) is used to replace the
Table 8 Bootstrapping regression results with the Corrupt variable and its interaction with the Polit_Conn variable
Variable Pred. sign Mean 1% 2.5% 5% 10% Median 90% 95% 97.5% 99%
Polit_Conn
Model 1 + 0.0150 0.0022 0.0043 0.0061 0.0078 0.0148 0.0223 0.0247 0.0269 0.0291
Model 2 + 0.0226 0.0099 0.0121 0.0137 0.0156 0.0224 0.0299 0.0319 0.0341 0.0370
Model 3 + 0.0222 0.0095 0.0116 0.0134 0.0154 0.0220 0.0294 0.0314 0.0337 0.0363
Model 4 + 0.0229 0.0104 0.0122 0.0141 0.0159 0.0228 0.0302 0.0322 0.0336 0.0366
Corrupt
Model 1 + 0.1244 0.0830 0.0905 0.0950 0.1024 0.1254 0.1445 0.1522 0.1567 0.1649
Model 2 + 0.0979 0.0557 0.0621 0.0674 0.0740 0.0983 0.1207 0.1277 0.1328 0.1424
Model 3 + 0.1048 0.0623 0.0680 0.0739 0.0809 0.1051 0.1278 0.1347 0.1402 0.1501
Model 4 + 0.0989 0.0555 0.0646 0.0687 0.0749 0.0995 0.1229 0.1287 0.1354 0.1466
Polit_Corrupt_C
Model 1 + 0.1302 0.0020 0.0244 0.0431 0.0647 0.1307 0.1984 0.2148 0.2328 0.2491
Model 2 + 0.1550 0.0271 0.0486 0.0671 0.0900 0.1559 0.2189 0.2388 0.2556 0.2772
Model 3 + 0.1484 0.0216 0.0437 0.0622 0.0826 0.1491 0.2121 0.2321 0.2474 0.2716
Model 4 + 0.1522 0.0288 0.0494 0.0644 0.0872 0.1526 0.2168 0.2346 0.2519 0.2761
This table reports the results of bootstrapping regressions by using models reported in Table 6. For brevity, only the estimated coefficients for threemajor variables of interest only, political connections (Polit_Conn), corruption (Corrupt), and their interaction term with corruption (Polit_Corrupt_C)are reported here. Refer to Table 6 for detailed descriptions of Models 1–4.
Political forces, corruption, and analyst forecast accuracy Charles JP Chen et al
1519
Journal of International Business Studies
variable Polit_Conn, and an additional controlvariable Lamda is added to the model to correctany self-selection bias. The value of Lamda iscalculated by using the probability densitiesderived from the first-stage Probit model.21 Again,our main results remain qualitatively unchanged inthe Heckman model (not tabulated). These sensi-tivity test results thus indicate that our mainfindings are not likely to be driven by sampling orstatistical bias.
SUMMARY AND CONCLUSIONCorporate political connections have been a topicalresearch issue since the recent publication ofseveral important studies on the matter (Faccio,2006, 2009; Faccio & Masulis, 2005; Faccio & Parsley,2006; Leuz & Oberholzer-Gee, 2006). We argue thatthe often unexpected benefits of political connec-tions complicate the earnings generation process,which makes the task of forecasting earnings moredifficult. Forecast accuracy is thus predicted to benegatively associated with political connections.After controlling for factors identified by previousstudies as affecting forecast accuracy, we find thatanalyst forecasts are less accurate for politicallyconnected firms than for non-connected firms.These results suggest that future IB research inthis area should view political connections as animportant source of influence for analyst forecastoutcomes.
The more interesting result of our study is thathost-country corruption level largely explains theadverse effect of political connections on analystforecast accuracy. This explanation is consistentwith our argument that the net benefit of politicalconnections is reduced by anti-corruption efforts,which are accompanied by more effective enforce-ment of law and more developed marketmechanisms that serve to set boundaries for thenepotism of politicians. However, we believe thatthe adverse effect of political connections onanalyst forecast accuracy in regimes where corrup-tion is common remains a vital issue for interna-tional investors, as capital has increasingly flowedinto emerging markets where corruption createsmore opportunities for politicians to expropriatebusiness transactions.
Shaffer (1995) and Hillman, Keim, and Schuler(2004) review recent developments in politicalscience, political economy, sociology, economics,finance and management that are relevant to IBstudies, and find that more research efforts areneeded to understand the effect of politics and
corruption in the context of IB. This study is atimely response to the call, and its findings providefresh evidence that serves as a stepping stone forfurther investigation in this area.
First, by studying the relationship between poli-tical connections and analyst forecasts, this studyoffers insights into how politics may affect theinformation environment, as the literature showsthat factors related to the informational environ-ment affect investor decisions (Agarwal & Feils,2007; Davis, Desai, & Francis, 2000; Globerman &Shapiro, 2003). Hillman and Wan (2005) find thatMNE subsidiaries adopt political strategies toachieve both internal legitimacy (pressures fromthe parent company) and external legitimacy(social and political pressures from the host coun-try). Attributes of financial analyst forecasts areoften employed to proxy for the informationalenvironment. Our findings shed light on therelationship between the forecast errors of financialanalysts and corporate political connections – animportant and hitherto unresolved research issuefor IB scholars.
Second, our study demonstrates how host-coun-try corruption level can affect the impacts ofpolitical influence in an international setting,which adds to a large body of related IB literature.Habib and Zurawicki (2002) find that both theabsolute level of corruption in the host country andthe difference in corruption level between thehome and the host country deter FDI. They arguethat investors tend to avoid corruption not onlybecause it is considered morally unacceptable, butalso because it reduces operational efficiency. In thesame vein, Zhao, Kim, and Du (2003) show that thepresence of high corruption and low transparencysignificantly hinders the inflow of FDI to hostcountries. In a reversed direction, Robertson andWatson (2004) find that a large increase in FDIflowing into a country results in a higher level ofcorruption, because the new FDI inflow representseagerness on the part of foreign firms and soexpands the opportunities for bribery. However,DiRienzo et al. (2007) show that the greater theaccess to information, the lower the level of cor-ruption. Although portfolio diversification hasbeen identified as a major factor in determiningthe cross-border flow of funds (Zhao, 2008),distance in space or culture heightens internationalinvestors’ need for information. Our findingsextend this strand of MNE literature by improvingthe understanding of the effect of interactionbetween corporate political connections and
Political forces, corruption, and analyst forecast accuracy Charles JP Chen et al
1520
Journal of International Business Studies
corruption on the information environment in thehost country.
The findings of this study pose practical andchallenging tasks for IB practitioners. First, at thefirm level, knowledge of earnings properties andtheir variation due to political connections shouldhelp investors to improve their portfolio manage-ment. The difficulty in forecasting earnings ofpolitically connected firms implies that, beforemaking foreign investment decisions, investorsmust examine whether the target firm is politicallyconnected, and if it is, they should be aware of theadditional information asymmetry about the targetfirm and carefully evaluate the government appa-ratus and operations resulting from politicalconnections and their direct and indirect impactson the firm’s future performance and risk. Second,at the country level, the exacerbating effect of cor-ruption on the adverse impacts of political influ-ence implies that investors should differentiatetarget firms with political connections in countrieswith higher levels of corruption from those incountries with more developed institutions thatcan counter corruptive forces. Investors can expectto benefit from their extra efforts in gathering andanalyzing such information before investing in apolitically connected firm.
Nevertheless, despite its merits, this study is notwithout limitations. Our sample of politicallyconnected firms is relatively small, although wedo make extensive efforts, including matchedsample tests and bootstrapping estimations, tocounter concerns on this front. As politicallyconnected firms represent the minority of firms inall parts of the world, this sampling issue shouldnot distract from our main findings. Anotherlimitation, and one that points to possible futureresearch directions, is that this study focuses on thedifferential effect of corruption on corporate poli-tical connections across countries, yet there are ahost of other institutional factors that could alsoaffect the costs and benefits of maintaining rela-tions with politicians. Future research that exploresthe effect of alternative institutional factors andcompares them with the influence of corruption isthus warranted to fine-tune our understanding inthis field.
ACKNOWLEDGEMENTSThe authors thank Mara Faccio for providing the dataon political connections for this study. We are deeplyindebted to the editor, Lee Radebaugh, and to two
anonymous reviewers for their insightful commentsand suggestions. We also thank T. J. Wong, JosephFan, Joe Weintrop, Bin Ke, Steven Lim, and workshopparticipants at the Chinese University of Hong Kong,Seoul National University, the 13th Annual Mid-YearConference of the International Accounting Section ofthe American Accounting Association, research semi-nars at the Turku School of Economics, Finland, theChina Europe International Business School, China,the University Montesquieu Bordeaux 4, France, andthe HEC School of Management, Paris, France, fortheir helpful comments and advice. Charles Chen andYuan Ding acknowledge the financial support ofProcore-France and the Hong Kong Joint ResearchScheme. Yuan Ding gratefully acknowledges thegenerous support of Jiangsu Jinsheng Industry Co.,Ltd. Francis Kim acknowledges the financial supportfrom City University of Hong Kong (Project No.7002256). We thank Ching-Tung Yu for extensiveresearch assistance.
NOTES1Focusing on high-profile politicians may under-
estimate the effect of political connections, becauseless visible connections may be overlooked. Weaddress this issue in the section on robustness checks.
2One may maintain that managers of connectedfirms are unlikely to have strong incentives to smoothearnings, because their jobs are better secured by theirconnections, and they are less likely to raise capitalfrom the public (Chaney et al., 2007).
3Kobrin (1979) provides a detailed review of earlystudies on this issue.
4One may contend that investor demand forinformation motivates analysts to compete in learningto forecast the effect of political outcomes on futureearnings, and thus that some analysts may forecast theearnings of connected firms better than others.However, the inherently complex nature of politicalmaneuvers renders their efforts less fruitful, and onaverage, analysts can be expected to be less capable offorecasting the earnings of politically connected firms.
5See the Italian ‘‘football savior’’ law example above.6For example, under the Nazi regime, German
armament producers worked through the NationalSocialist German Workers’ Party to expand their accessto the domestic market (Ferguson & Voth, 2008).Brazilian firms that had contributed substantially topolitical campaigns increased their bank leverage aftereach election, indicating that access to bank finance isan important channel through which political connec-tions operate (Claessens et al., 2008). In Indonesia,
Political forces, corruption, and analyst forecast accuracy Charles JP Chen et al
1521
Journal of International Business Studies
during the Suharto era, the London-based ThamesWater Overseas Ltd formed an alliance with Suharto’sson, Sigit Harjojudanto, who had no previous experiencein the water business. In exchange for the businessaccess that Sigit brought to the firm, Thames grantedhim 20% ownership of the joint business venture(Purbasari & Mobarak, 2007).
7It may be contended that firms with politicalconnections are associated with more accurate analystearnings forecasts. This is more common in countrieswith transparent economies (Faccio, 2006). Faccio(2006) suggests that transparent economies are betterable to tolerate corporate political connections,because any misuse would be more likely to bedetected. However, whether country-level variationin the transparency of the economic system leads tofirm-level transparency is an empirical question.
8‘‘Connections of this type occur when a personwho was a head of state or prime minister between1997 and 2001 (or one of their relatives) was also a topexecutive or a large shareholder of the companyduring 1997 or 2001 (except for the cases that fall intothe paragraph directly above); when a governmentminister or a member of parliament as of 2001 was atop executive or a large shareholder of the companyduring 1997; when a large shareholder or a top officeris a friend of a minister or MP; when a largeshareholder or a top officer is a politician in anothercountry; or when a large shareholder or a top officer isknown to be associated with a political party’’ (Faccio,2006: 371).
9For details of the CPI, please refer to the Trans-parency International Website: www.transparency.org.
10Forecast optimism and forecast dispersion werealso examined in an early version of this study, andthe results indicated that political connections areassociated with more optimistic and more dispersedforecasts.
11We also use the squared difference between theforecast and actual earnings, scaled by the stock priceat time t�1, assuming that analysts face a quadraticloss function, and the results (not tabulated) remainqualitatively similar. Using the absolute value of thedifference assumes that analysts face a linear lossfunction, and hence try to minimize their absoluteforecast error.
12We also use analyst forecasts separately compiledby IBES 8 months, 7 months, and 6 months beforethe fiscal year-end to obtain similar cut-off dates forforecasts. The results using forecasts issued by indivi-dual months maintain the same tenor as thosereported in this paper.
13Firm size also controls for differences in theinformation environment, as large firms tend to attractmore public attention and media coverage. In ourstudy, size is measured as the natural log of totalassets, but our results are qualitatively equivalent whenother measures of size, such as net sales and themarket value of equity capital, are used.
14We assume that each analyst has a similarforecasting ability, and consequently do not controlfor analyst experience, the size of the employer, or thenumber of firms and industries covered. We acknowl-edge that analyst characteristics may affect forecastingperformance (Clement & Tse, 2005; Hong & Kubik,2003). However, the differential forecasting abilities ofanalysts should be biased against finding significantresults in this study, because our sample indicates thatconnected firms are larger and attract more analystcoverage.
15We use the Fama–French 48-industry classification(Fama & French, 1997).
16In Panel A of Table 2, Indonesia, Italy, and Koreaappear as outliers in their CPI levels. In anunreported robustness check, our results remainunchanged after dropping the observations fromthese countries.
17As a result of our focus on high-level politicalconnections, there is only one connected firm in thedefense industry in our sample, which is consistentwith the results reported by Faccio (2006). For arobustness check we broaden the definition of politicalconnection by following Goldman, Rocholl, and So(2009), which includes an examination of all membersof the board of directors, and classifies a firm as con-nected if any one member of the board is politicallyconnected. However, we ended up with only one firm(Lockheed Martin) with political connection in theUS defense industry. Since hand-collecting relatedinformation may result in a less verifiable sample thatwould require attestation of its reliability and dataintegrity from an independent source, we limit thistest to only pharmaceutical and petroleum indus-tries in the US. Our results remain qualitativelyunchanged.
18The VIF values are reported in all regression tables,and none of them exceeds the value of 2.
19We also conduct Fama–MacBeth regression in therobustness check section to correct the cross-sectionalcorrelation problems.
20The classification is based on additional informa-tion generously provided by Mara Faccio during therevision process for this paper.
21See Heckman (1976) for a detailed discussion ofthis procedure.
Political forces, corruption, and analyst forecast accuracy Charles JP Chen et al
1522
Journal of International Business Studies

REFERENCESAgarwal, J., & Feils, D. 2007. Political risk and the internationalization
of firms: An empirical study of Canadian-based export and FDIfirms. Canadian Journal of Administrative Sciences, 24(3): 165–181.
Barth, M. E., Kasznik, R., & McNichols, M. F. 2001. Analystcoverage and intangible assets. Journal of Accounting Research,39(1): 1–34.
Bertrand, M., Kramarz, F., Schoar, A., & Thesmar, D. 2004.Politically connected CEOs and corporate outcomes: Evidencefrom France, Working Paper, University of Chicago and MIT.
Bhattacharya, U., Daouk, H., & Welker, M. 2003. The worldprice of earning opacity. Accounting Review, 78(3): 641–678.
Boddewyn, J. J. 1988. Political aspects of MNE theory. Journal ofInternational Business Studies, 19(3): 341–363.
Brambor, T., Clark, W. R., & Golder, M. 2005. Understandinginteraction models: Improving empirical analyses. PoliticalAnalysis, 14(1): 63–82.
Brown, L. D. 1993. Earnings forecasting research: Its implicationsfor capital markets research. International Journal of Forecast-ing, 9(3): 295–320.
Chaney, P. K., Faccio, M., & Parsley, D. C. 2007. The quality ofaccounting information in politically connected firms, SSRNWorking Paper, http://ssrn.com/abstract¼966379.
Claessens, S., Feijen, E., & Laeven, L. 2008. Political connectionsand preferential access to finance: The role of campaigncontributions. Journal of Financial Economics, 88(3): 554–580.
Clarke, J., & Subramanian, A. 2006. Dynamic forecastingbehavior by analysts: Theory and evidence. Journal of FinancialEconomics, 80(1): 81–113.
Clement, M. B., & Tse, S. Y. 2005. Financial analyst character-istics and herding behavior in forecasting. Journal of Finance,60(1): 307–341.
Crispin, S. W. 2002. Political connections. Far Eastern EconomicReview, 165(21): 33.
Cuervo-Cazurra, A. 2006. Who cares about corruption? Journalof International Business Studies, 37(6): 807–822.
Davis, B. 2001. Chairman’s deep political connections run silent.Wall Street Journal Eastern Edition, 238: A10.
Davis, P. S., Desai, A. B., & Francis, J. D. 2000. Mode ofinternational entry: An isomorphism perspective. Journal ofInternational Business Studies, 31(2): 239–258.
Dechow, P. M., & Dichev, I. D. 2002. The quality of accruals andearnings: The role of accrual estimation errors. AccountingReview, 77(Supplement): 35–59.
DiRienzo, C. E., Das, J., Cort, K. T., & Burbridge Jr., J. 2007.Corruption and the role of information. Journal of InternationalBusiness Studies, 38(2): 320–332.
Duru, A., & Reeb, D. M. 2002. International diversification andanalysts’ forecast accuracy and bias. Accounting Review, 77(2):415–433.
Faccio, M. 2006. Politically connected firms. American EconomicReview, 96(1): 369–386.
Faccio, M. 2009. Differences between politically connected andnon-connected firms: A cross country analysis, SSRN WorkingPaper, http://ssrn.com/abstract¼918244.
Faccio, M., & Masulis, R. W. 2005. The choice of paymentmethod in European mergers and acquisitions. Journal ofFinance, 60(3): 1345–1388.
Faccio, M., & Parsley, D. C. 2006. Sudden deaths: Taking stock ofgeographic ties, ECGI – Finance Working Paper No. 113/2006,http://ssrn.com/abstract¼875808.
Faccio, M., Masulis, R. W., & McConnell, J. J. 2006. Politicalconnections and corporate bailouts. Journal of Finance, 61(6):2597–2635.
Fama, E. F., & French, K. R. 1997. Industry costs of equity.Journal of Financial Economics, 43(2): 153–193.
Fama, E. F., & MacBeth, J. D. 1973. Risk, return, and equilibrium:Empirical tests. Journal of Political Economy, 81(3): 607–636.
Ferguson, T., & Voth, H. 2008. Betting on Hitler: The value ofpolitical connections in Nazi Germany. Quarterly Journal ofEconomics, 33(1): 101–137.
Fisman, R. 2001. Estimating the value of political connections.American Economic Review, 91(4): 1095–1102.
Francis, J., LaFond, R., Olsson, P. M., & Schipper, K. 2004. Costsof equity and earnings attributes. Accounting Review, 79(4):967–1010.
Friedrich, R. J. 1982. In defense of multiplicative terms inmultiple regression equations. American Journal of PoliticalScience, 26(4): 797–833.
Globerman, S., & Shapiro, D. 2003. Governance infrastructureand US foreign direct investment. Journal of InternationalBusiness Studies, 34(1): 19–39.
Goldman, E., Rocholl, J., & So, J. 2009. Do politically connectedboards affect firm value? Review of Financial Studies, 22(6):2331–2360.
Habib, M., & Zurawicki, L. 2002. Corruption and foreign directinvestment. Journal of International Business Studies, 33(2):291–307.
Heckman, J. 1976. The common structure of statistical models oftruncation, sample selection, and limited dependent variablesand a simple estimator for such models. Annals of Economicand Social Measurement, 5: 475–492.
Hillman, A., Keim, G., & Schuler, D. 2004. Corporate politicalactivity: A review and research agenda. Journal of Manage-ment, 30(6): 837–857.
Hillman, A., & Wan, W. 2005. The determinants of MNEsubsidiaries’ political strategies: Evidence of institutionalduality. Journal of International Business Studies, 36(3):322–340.
Hillman, A., Zardkoohi, A., & Bierman, L. 1999. Corporatepolitical strategies and firm performance: Indications of firm-specific benefits from personal service in the US government.Strategic Management Journal, 20(1): 67–81.
Hofstede, G. 2001. Culture’s consequences: Comparing values,behaviors, institutions and organizations across nations, (2nded.) London: Sage Publications.
Hong, H., & Kubik, J. D. 2003. Analyzing the analysts: Careerconcerns and biased earnings forecasts. Journal of Finance,58(1): 313–351.
Hope, O. 2003. Disclosure practices, enforcement ofaccounting standards, and analysts’ forecast accuracy: Aninternational study. Journal of Accounting Research, 41(2):235–272.
Hunt, A. R. 2002. A scandal centerpiece: Enron’s politicalconnections. Wall Street Journal Eastern Edition, 239: A15.
IMD. 2009. World competitiveness yearbook. www.imd.ch/wcy/.Jackson, G., & Deeg, R. 2008. Comparing capitalisms: Under-
standing institutional diversity and its implications for inter-national business. Journal of International Business Studies,39(4): 540–561.
Jaccard, J., Wan, C. W., & Turrisi, R. 1990. The detection andinterpretation of interaction effects between continuousvariables in multiple regression. Multivariate Behavior Research,25(4): 467–478.
Kapner, F. 2003. Italy’s ‘‘savior’’ laws face probes. FinancialTimes, 4 November: 26.
Kobrin, S. J. 1979. Political risk: A review and reconsideration.Journal of International Business Studies, 10(1): 67–80.
Krishnaswami, S., & Subramaniam, V. 1999. Informationasymmetry, valuation, and the corporate spin-off decision.Journal of Financial Economics, 53(1): 73–112.
Krueger, A. O. 1974. The political economy of the rent-seekingsociety. American Economic Review, 64(3): 291–303.
LaPalombara, J. 1994. Structural and institutional aspects ofcorruption. Social Research, 61(2): 325–350.
La Porta, R., Lopez-de-Silanes, F., Shleifer, A., & Vishny, R.1998. Law and finance. Journal of Political Economy, 106(6):1113–1155.
Leuz, C., & Oberholzer-Gee, F. 2006. Political relationships,global financing, and corporate transparency: Evidence fromIndonesia. Journal of Financial Economics, 81(2): 411–439.
Political forces, corruption, and analyst forecast accuracy Charles JP Chen et al
1523
Journal of International Business Studies
Petersen, M. A. 2008. Estimating standard errors in financepanel data sets: Comparing approaches. Review of FinancialStudies, 22(1): 435–480.
Purbasari, D. P., & Mobarak, A. M. 2007. Do multinationalcorporations seek out politically connected firms? Evidence onlocal partner search by MNCs in Indonesia, Working Paper,University of Colorado at Boulder.
Roberts, B. E. 1990. A dead senator tells no lies: Seniority and thedistribution of federal benefits. American Journal of PoliticalScience, 34(1): 31–58.
Robertson, C., & Watson, A. 2004. Corruption and change: Theimpact of foreign direct investment. Strategic ManagementJournal, 25(4): 385–396.
Rodriguez, P., Siegel, D. S., Hillman, A., & Eden, L. 2006. Threelenses on the multinational enterprise: Politics, corruption, andcorporate social responsibility. Journal of International BusinessStudies, 37(6): 733–746.
Shaffer, B. 1995. Firm-level responses to government regulation:Theoretical and research approaches. Journal of Management,21(3): 495–514.
Siegel, J. 2005. Contingent political capital and internationalalliances: Evidence from South Korea, Working Paper, HarvardBusiness School.
Simon, J. A. 1984. A theoretical perspective on politicalrisk. Journal of International Business Studies, 15(3):123–143.
Smith, K. W., & Sasaki, M. S. 1979. Decreasing multicollinearity:A method for models with multiplicative functions. SociologicalMethods & Research, 8(1): 35–56.
Smith-Hillman, A. V., & Omar, M. 2005. FDI, internationalbusiness and regulation: The behaviour of UK multinationalcorporations. European Business Review, 17(1): 69–82.
Stigler, G. J. 1971. The theory of economic regulation. BellJournal of Economics and Management Science, 2(1): 3–21.
Tanzi, V. 1998. Corruption around the world: Causes, conse-quences, scope, and cures, IMF Working Paper WP/98/63,International Monetary Fund, Washington, DC.
Zhao, H., Kim, S., & Du, J. 2003. Corruption, transparency andforeign direct investment: A cross-country analysis. Manage-ment International Review, 43(1): 41–63.
Zhao, X. 2008. Determinants of flows into retail internationalequity funds. Journal of International Business Studies, 39(7):1169–1177.
ABOUT THE AUTHORSCharles JP Chen is a professor of Accounting at theChina Europe International Business School(CEIBS). He received his PhD in accounting fromUniversity of Houston (University Park). His cur-rent research interests include issues related tointernational accounting harmonization, financialanalyst forecasts, auditing, accounting issues inChina, and corporate governance. Born in China,he is a citizen of the People’s Republic of China. Hise-mail address is [email protected].
Yuan Ding is a professor of Accounting at theChina Europe International Business School(CEIBS). He received his PhD in accounting fromthe University Montesquieu Bordeaux IV, France.His current research is focused on intangibles,international accounting harmonization, earningsmanagement, analyst forecasts, corporate govern-ance issues, and accounting reform in China. YuanDing was born in China and is a French citizen. Hise-mail address is [email protected].
Chansog (Francis) Kim is an associate professor inthe Department of Accountancy, College of Busi-ness, City University of Hong Kong. He received hisPhD from Baruch College of City University of NewYork. His current research interests include securityanalyst forecasting behaviors, capital market-basedaccounting research, and auditing. He was born inKorea and is a Korean citizen. His e-mail address [email protected].
Accepted by Lee Radebaugh, Area Editor, 12 February 2010. This paper has been with the authors for three revisions.
Political forces, corruption, and analyst forecast accuracy Charles JP Chen et al
1524
Journal of International Business Studies