high performance fibre reinforced concrete - core.ac.uk · se ha evaluado también la influencia de...
TRANSCRIPT
_________________________________________________________________________
The Bending and Shear Behaviour of Laminar Structures of
High Performance Fibre Reinforced Concrete
Simão Pedro Fonseca Santos
School of Engineering
Dept. of Civil Engineering
University of Minho
Guimarães, Portugal
_________________________________________________________________________
Supervisor: Joaquim António Oliveira de Barros

ii
“THE BENDING AND SHEAR BEHAVIOUR OF LAMINAR STRUCTURES OF HIGH
PERFORMANCE STEEL FIBRE REINFORCED CONCRETE”
Prégaia – Sociedade de Pré-Fabricação, S.A.
CiviTest - Pesquisa de novos materiais para a Engenharia Civil, L.da
Departamento de Engenharia Civil
da Escola de Engenharia
Universidade
do Minho
Índice GEraç

iii
The author would like to thank the following institutions:
FCT – Fundação para a Ciência e a Tecnologia; ADI – Agência de Inovação; BEKAERT; Degussa
Chemicals Portugal; COMITAL – Companhia Mineira de Talcos, SA; SECIL – Companhia geral de cal e
cimento, SA; DuroEuropa – Produtos Endurecedores, Lda; Marques e Cruz, Lda and FibreSensing.

iv
To my Grandfathers memory
To you, Mara

v
ACKNOWLEDGEMENTS
Ao Professor Doutor Joaquim Barros, orientador científico deste trabalho: pelo empenho e rigor
com que abraça os seus projectos, pela motivação que incute em quem com ele colabora; pelo
inconformismo em relação ao medíocre, pela exigência presente em cada minuto; por ter sido,
sempre, incansável demonstrador do valor do trabalho no enriquecimento profissional e pessoal;
pela oportunidade que tenho tido de privar com ele como amigo. Um grande bem-haja!
Aos amigos da Universidade do Minho, colegas, professores, funcionários do laboratório: pela
forma como me receberam e me ajudaram desde o primeiro dia; pela partilha de muitos momentos,
pelos debates de ideias em ambiente de tertúlia.
Às empresas Civitest, Duro-Europa, Maprel, Pisonort e Prégaia, e respectivos funcionários, pela
disponibilidade das instalações e meios necessários à realização dos programas experimentais.
À Hilti Española S.A., nas pessoas do Responsável do Departamento de Engenharia, Alejandro
Alvarez e do Director Geral em fiunções até Dezembro de 2007, Juan Zaballos: pela confiança que
tiveram em mim ao contratar-me, sabendo que estava a braços com a presente Tese apoiando-me
em todos os sentidos; pela amizade.
Aos meus Amigos de sempre, pela confiança que me transmitem ao acreditarem em mim.
À minha família e à família da Mara (que também é minha): por toda a estabilidade emocional que
me têm proporcionado., factor preponderante para poder estar sempre à altura dos desafios que se
me colocam.
À Mara: companheira de absolutamente todos os momentos, os bons e os menos bons; pela partilha
de todas as etapas que temos vindo a atravessar ao longo dos anos; pela inteligência que aplica em
todos os actos, pela força e ambição que transmite; por saber sempre maximizar o tempo em que
estamos juntos, minimizando os efeitos da distância física que nos separa.

vi
ABSTRACT
The concrete precasting industry is frequently requested to produce structural elements of
reinforced concrete with high geometric complexity. These geometric conditions introduce
difficulties on the placement of reinforcement, resulting in a large consuming time phase of the
industrial process, causing delays in the construction schedule. Moreover, when high percentage of
reinforcement is used, there are difficulties on assuring the desired concrete pouring quality, once
the compaction process may be very difficult to execute, although all the great advances in
compaction techniques and equipments. Most of the times, in these conditions and in the absence of
rigorous quality control and specialized workers, the elements present deficiencies that can
compromise the mechanical behaviour and the visual appearance of the final structure.
Self-compacting concrete (SCC) can be defined as concrete that is able to flow in the interior
of the formwork, passing through the reinforcement and filling it in a natural manner, being
consolidated under the action of its own weight. Adding the benefits of SCC to those resulting from
the addition of discrete fibres to cement based materials, a high performance material, designated by
steel fibre reinforced self-compacting concrete (SFRSCC), is obtained. Steel fibre reinforcement
greatly increases ductility of concrete, retards crack coalescence and propagation, increases
pronouncedly the after-cracking energy absorption and decreases the width of the cracks.
Although all the advantages already known and recognized, the technology of Steel Fibre
Reinforced Concrete (SFRC) still deserving a certain rejection from structural engineers solutions:
not only to applications that involve safety considerations but also where the fibres are used as
secondary reinforcement.
In the present work, an evaluation of the bending and shear behaviour of laminar structures
in high performance steel fibre reinforced concrete (HPSFRC) will be carried out. Two wide
research programs were developed in order to find out the influence of steel fibres reinforcement in
the mechanical behaviour of these structures. The influence of the strength class, fck, in the load
carrying capacity and its influence in the reinforcing mechanisms that steel fibres can develop within
a composition of HPSFRC were also studied. The performance of the analytical approach for the
prediction of the fibre reinforcement contribution in terms of shear resistance of concrete beams

vii
recommended by RILEM TC 162 TDF was assessed. A numerical simulation of the tests carried out
with HSSFRC beams failing in shear was done, under the framework of the material nonlinear finite
element analysis, in order to evince the influence of using a softening constitutive law for modeling
the crack shear sliding.
The experimental programs and the numerical research are described, and the main results
are presented and discussed.

viii
RESUMO
A indústria de pré-fabricados de betão depara-se, frequentemente, com a necessidade de produzir
elementos estruturais de elevada complexidade geométrica. Essa complexidade geométrica dificulta
significativamente a introdução das armaduras de reforço nas cofragens, o que aumenta
consideravelmente o tempo de produção das peças podendo, inclusivamente, ser causadora de
atrasos no processo de fabricação. Ademais, quando a percentagem de armadura é elevada, existe
uma maior dificuldade em garantir a qualidade de betonagem desejada, uma vez que a operação de
vibração pode tornar-se numa tarefa árdua ou mesmo impossível, apesar de todos os avanços que
vêm conhecendo a tecnologia e os equipamentos de vibração ao longo dos últimos anos. Na maior
parte das vezes, nestas condições, e na falta de um controlo de qualidade rigoroso, bem como de
mão-de-obra especializada, os elementos pré-fabricados apresentam deficiências que podem
comprometer o comportamento mecânico e a aparência da estrutura final.
O betão auto-compactável (BAC) pode ser definido como sendo um material capaz de fluir
no interior da cofragem e de passar através da armadura, unicamente sob acção do seu peso próprio,
ou seja, sem vibração. Conjugando as vantagens do betão auto-compactável com as que advêm da
adição de fibras a materiais de matriz cimentícia, obtém-se um material com desempenho elevado,
designado de betão auto-compactável reforçado com fibras de aço (BACRFA). A utilização de fibras
de aço aumenta a ductilidade do betão, retarda ao aparecimento e a propagação de fendas, aumenta
significativamente a absorção de energia na fase pós-fendilhada e reduz a largura de fendas.
Apesar de todas as vantagens já reconhecidas, a tecnologia do Betão Reforçado com Fibras
de Aço continua a ser alvo de alguma rejeição por parte dos engenheiros de estruturas, à hora de a
eleger como solução estrutural: não apenas em aplicações de alta responsabilidade do ponto de vista
estrutural mas também em aplicações em que as fibras de aço são usadas como reforço secundário.
No presente trabalho é feita uma avaliação do comportamento à flexão e ao corte de
estruturas laminares de betão de elevado desempenho reforçado com fibras de aço (BEDRFA).

ix
Foram realizados dois extensos programas de investigação para avaliar a influência do
reforço proporcionado pelas fibras de aço no comportamento destas estruturas. Foram também
avaliadas a influência da classe de resistência do betão, fck, na capacidade de carga dos elementos,
bem como a sua influência nos mecanismos que as fibras podem desenvolver dentro de uma
composição de BEDRFA. Foi avaliado o modelo analítico para a previsão da contribuição das fibras
de aço no reforço ao corte de vigas de betão proposto pelo RILEM TC 162 TDF. Foi levada a cabo
a simulação numérica dos ensaios realizados com vigas de betão de alta resistência reforçado com
fibras de aço (BARRFA), simulação esta realizada através de uma análise não-linear material com o
método dos elementos finitos, utilizando uma lei de amolecimento para modelar o desenvolvimento
das fendas de corte.
No presente trabalho é feita uma descrição dos programas experimentais realizados; os
principais resultados serão apresentados e discutidos.
x
RESUMEN
La industria del la prefabricación se depara, muchas veces, con la necesidad de producir elementos
estructurales de elevada complejidad geométrica. Esa complejidad dificulta significativamente la
introducción de las armaduras de refuerzo en los encofrados, aumentando considerablemente el
tiempo de producción de las piezas pudendo, incluso, ser la causa de retrasos en el proceso de
fabricación. Además, cuando el porcentaje de armadura es elevado, existe una mayor dificultad en
garantizar la calidad del hormigonado, ya que la vibración puede ser una tarea complicada o hasta
imposible, a pesar de todos los avances en la tecnología y los equipos de vibración a lo largo de los
últimos años. En la mayor parte de las veces, en estas circunstancias y, en la falta de un control de
calidad riguroso bien como de mano de obra especializada, los elementos prefabricados presentan
defectos que pueden comprometer su comportamiento mecánico y la apariencia de la estructura
final.
El hormigón auto compactante (HAC) puede definirse como un material con la capacidad de
fluir en el interior del encofrado y de pasar a través de las armaduras, únicamente bajo la acción de
su peso propio, es decir, sin vibración. Conjugando las ventajas del hormigón auto compactante con
las ventajas de la adición de fibras a materiales de matriz cementicia, se obtiene un material con
elevado desempeño, que se designa de hormigón auto compactante reforzado con fibras de acero
(HACRFA). La utilización de fibras de acero aumenta la ductilidad del hormigón, retrasa el
aparecimiento y la propagación de grietas, aumenta de forma significativa la absorción de energía en
la fase pos fisurada y reduce el ancho de las grietas.
No obstante todas las ventajas ya conocidas, la tecnología del hormigón reforzado con fibras
de acero sigue sin gran aceptación por parte de los ingenieros de estructuras, a la hora de elegirla
como solución estructural: no solo en aplicaciones de alta responsabilidad del punto de vista
estructural sino en aplicaciones en las cuales las fibras de acero se usan como refuerzo secundario.
En el presente trabajo se hace una evaluación del comportamiento en flexión y a cortante de
estructuras laminares de hormigones de elevado desempeño reforzados con fibras de acero

xi
(HEDRFA). Dos extensos programas de investigación se han llevado a cabo para evaluar la
influencia del refuerzo proporcionado por las fibras de acero en el comportamiento de estas
estructuras. Se ha evaluado también la influencia de la clase de resistencia del hormigón, fck, en la
capacidad de carga de los elementos, bien como su influencia en los mecanismos que las fibras
pueden desarrollar dentro de una composición de HEDRFA. Se hizo la evaluación del modelo
analítico propuesto por el RILEM TC 162 TDF para la previsión de la contribución de las fibras de
acero en el refuerzo a cortante de vigas de hormigón. Se ha llevado a cabo la simulación numérica de
los ensayos realizados con vigas de hormigón de alta resistencia reforzado con fibras de acero,
simulación hecha con recurso a un análisis no-lineal material con el método de los elementos finitos,
utilizando una ley de softening para modelizar la propagación de las grietas de cortante.
En el presente trabajo se hace una descripción de los programas experimentales realizados;
los principales resultados serán presentados y discutidos.

xii
CONTENTS Acknowledgements ............................................................................................................................................ v
ABSTRACT ....................................................................................................................................................... vi
RESUMO ......................................................................................................................................................... viii
1.Introduction ..................................................................................................................................................... 1
1.1. Background, aim and scope ........................................................................................................... 1
1.2. Outline of contents .......................................................................................................................... 3
2.Steel Fibre Self Compacting Concrete technology .................................................................................... 5
2.1. Definition of Self Compacting Concrete ..................................................................................... 5
2.2. Tests to assess self-compacting requirements ............................................................................. 7
2.2.1. Slump Flow Test ..................................................................................................................... 7
2.2.2. L-Box Test ............................................................................................................................... 9
2.2.3. U-Box Test ............................................................................................................................ 11
2.2.4. V-Funnel Test ....................................................................................................................... 12
2.2.5. Orimet Test ........................................................................................................................... 13
2.3. The possibilities of steel-fibre reinforced concrete: an overview ........................................... 14
2.4. Conclusions .................................................................................................................................... 15
3.Façade panels in steel fibre self-compacting concrete............................................................................. 17
3.1. Introduction .................................................................................................................................... 17
3.2. Material constituents ..................................................................................................................... 19
3.3. Mix design method for self-compacting concrete admixtures ................................................ 20
3.4. Material Properties ......................................................................................................................... 21
3.4.1. Compression .......................................................................................................................... 21
3.4.2. Bending .................................................................................................................................. 26
3.4.3. Conclusions ........................................................................................................................... 31
3.5. Development of a composition of SFRSCC with 45kg/m3 of steel fibres ........................... 32
3.6. Structural Properties ...................................................................................................................... 40
3.6.1. Flexural Behavior of Panel Prototypes .............................................................................. 40
3.6.2. Punching behaviour of panel prototypes .......................................................................... 44
3.7. Manufacture and testing a real scale façade panel ..................................................................... 48
3.8. Conclusions .................................................................................................................................... 55

xiii
4. Steel fibre reinforced self-compacting concrete failing in bending ...................................................... 57
4.1. Introduction .................................................................................................................................... 57
4.2. Experimental program .................................................................................................................. 60
4.2.1. Test series ............................................................................................................................... 60
4.2.2. Mix compositions ................................................................................................................. 61
4.2.3. Test set up and monitoring system .................................................................................... 62
4.3. Results and analysis ....................................................................................................................... 63
4.4. Fibre Distribution .......................................................................................................................... 67
4.5. Design Strategy Approach ............................................................................................................ 68
4.6. Numerical Simulation .................................................................................................................... 70
4.7. Conclusions .................................................................................................................................... 72
5.High performance fibre reinforced concrete elements failing in shear ................................................ 74
5.1. Motivation ....................................................................................................................................... 74
5.2. Fibrous reinforcing systems for the shear resistance of concrete elements: an overview .. 76
5.3. Experimental program .................................................................................................................. 78
5.3.1. Test series ............................................................................................................................... 79
5.3.2. Mix Compositions ................................................................................................................ 80
5.3.3. Test set up and monitoring system .................................................................................... 82
5.4. Results and analysis ....................................................................................................................... 84
5.5. Failure modes ................................................................................................................................. 88
5.6. Influence of Steel Fibres in Shear Reinforcement .................................................................... 88
5.7. Numerical Strategy ........................................................................................................................ 92
5.7.1. Introduction ........................................................................................................................... 92
5.7.2. Inverse Analysis .................................................................................................................... 94
5.7.3. Simulations of the slabs’ tests ............................................................................................. 96
5.8. Conclusions .................................................................................................................................... 98
6.Conclusions and future work ...................................................................................................................... 99
6.1. Introduction .................................................................................................................................... 99
6.2. Main conclusions ........................................................................................................................... 99
6.2.1. Steel fibre reinforced self-compacting concrete for façade elements ........................... 99
6.2.2. Steel fibre reinforced self-compacting concrete for elements failing in bending ..... 100
6.2.3. Fibre reinforced concrete for elements failing in shear ............................................... 100
6.2.4. Numerical strategies .......................................................................................................... 101
6.3. Reccommendations for future work ........................................................................................ 102

xiv
References ...................................................................................................................................................... 104
APPENDIX .................................................................................................................................................. 110

xv
LIST OF FIGURES Figure 2.1: Flow Test Apparatus: a) representation; b) real apparatus ....................................................... 8
Figure 2.2: Measuring the final diameter of SFRSCC in one direction ...................................................... 8
Figure 2.3: Abrams Cone with J-Ring Slump Flow Test Apparatus: a) representation; b) real
apparatus ............................................................................................................................................................. 9
Figure 2.4: L-Box test apparatus: a) representation; b) real apparatus ..................................................... 10
Figure 2.5: End of test ..................................................................................................................................... 11
Figure 2.6: Measuring H2 ............................................................................................................................... 11
Figure 2.7: Measuring H1 ............................................................................................................................... 11
Figure 2.8: U-Box test apparatus ................................................................................................................... 12
Figure 2.9: V-Funnel test apparatus: a) representation; b) real apparatus ............................................... 13
Figure 2.10: Orimet Test Apparatus with J-Ring ........................................................................................ 14
Figure 3.1: Test setup to evaluate the concrete Young’s Modulus, Ec .................................................... 22
Figure 3.2: Representation of load cycles to determine Ec ....................................................................... 22
Figure 3.3: Configuration of compression test and position of the LVDT’s .......................................... 23
Figure 3.4: Stress-strain curves of SFRCSCC of different ages. ............................................................... 24
Figure 3.5: Evaluation of the applicability of CEB-FIP 1993 expressions to simulate the behaviour
of SFRSCC ........................................................................................................................................................ 24
Figure 3.6: Variation of fcm with age. .............................................................................................................. 25
Figure 3.7: Variation of Ecm with age. ............................................................................................................ 25
Figure 3.8: Bending Test Setup ...................................................................................................................... 27
Figure 3.9: Normal Load-Displacement relation in a bending test .......................................................... 28
Figure 3.10: Assumed stress distribution in the beam cross section ........................................................ 29
Figure 3.11: Load-deflection curves for SFRSCC of different ages ......................................................... 30
Figure 3.12: Influence of the age in FL ........................................................................................................ 31
Figure 3.13: Influence of the age in equivalent and residual flexural strength parameters. .................. 31
Figure 3.14: Variation of Ecm with age ........................................................................................................... 34
Figure 3.15: Influence of the age on the stress-strain response of SFRSCC_30 and SFRSCC_45 ..... 35
Figure 3.16: Influence of the age on the fcm of SFRSCC_30 and SFRSCC_45 ...................................... 35
Figure 3.17: Typical failure mode of compression tests ............................................................................. 36
Figure 3.18: Load-displacement curves of SFRSCC_45 specimens of different ages ........................... 37

xvi
Figure 3.19: Influence of SFRSCC age in FL .............................................................................................. 37
Figure 3.20: Influence of SFRSCC age in fR,1 and fR,4 .................................................................................. 38
Figure 3.21: Influence of the SFRSCC age in feq,2 and feq,3 .......................................................................... 39
Figure 3.22: Geometry of panel prototype ................................................................................................... 40
Figure 3.23: Metallic formwork to build the panel and disposition of the lightweight elements ......... 41
Figure 3.24: Formwork detail ......................................................................................................................... 41
Figure 3.25: Filling the panel .......................................................................................................................... 41
Figure 3.26: Panel after have been cast ......................................................................................................... 41
Figure 3.27: Test setup .................................................................................................................................... 42
Figure 3.28: Supports of the panel prototype .............................................................................................. 42
Figure 3.29: Position of the loading points .................................................................................................. 42
Figure 3.30: Position of the LVDTs to measure the panel deflection ..................................................... 42
Figure 3.31: Panel prototype being tested in bending ................................................................................ 43
Figure 3.32: Load-deflection curve for each LVDTs of the SFRSCC_30 panel .................................... 43
Figure 3.33: Load-deflection curve for each LVDTs of the SFRSCC_45 panel .................................... 43
Figure 3.34: Crack pattern in SFRSCC_30, at the end of the bending test ............................................. 44
Figure 3.35: Crack pattern in SFRSCC_45, at the end of the bending test ............................................. 44
Figure 3.36: Punching test apparatus: a) General view representation; b) Detail view of the real test
............................................................................................................................................................................ 44
Figure 3.37: Punching test specimens (all measures in mm): a) Overview representation; b) Cut view
............................................................................................................................................................................ 45
Figure 3.38: Load-displacement relationship up to of about a) 20 mm and b) 4 mm, from punching
test in a SFRSCC_30 panel ............................................................................................................................. 45
Figure 3.39: Load-displacement relationship up to of about a) 20 mm and b) 4 mm, from punching
test in a SFRSCC_45 panel ............................................................................................................................. 46
Figure 3.40: a) Punching critical contour and yield line due to negative moments (exterior contour);
b) Failure surface in a punching test ............................................................................................................. 46
Figure 3.41: Panel Geometry (dimensions in mm) ..................................................................................... 49
Figure 3.42: Placing the lightweight elements .............................................................................................. 50
Figure 3.43: Heavy beam to assure stability of the lightweight elements during concrete casting ...... 50
Figure 3.44: Casting operations of the panel ............................................................................................... 50
Figure 3.45: Demoulding panel operations .................................................................................................. 51
Figura 3.46: Panel stockage ............................................................................................................................. 51

xvii
Figure 3.47: Setup of the loading test: a) general view; b) section P-P’; c) section Q-Q’(dimensions in
mm) .................................................................................................................................................................... 52
Figure 3.48: Data acquisition system ............................................................................................................. 53
Figure 3.49: LVDT for measuring the panel deflection at its center ....................................................... 53
Figure 3.50: Placing the concrete plates to simulate the panel live load .................................................. 53
Figure 3.51: Final view of the panel, loaded with 33 concrete plates ....................................................... 54
Figure 3.52: Crack opening profile of the critical crack ............................................................................. 54
Figure 4.1: Longitudinal and transversal cross sections of the tested slab strips ................................... 60
Figure 4.2: Apparatus of 4 point loading tests in slab strips including monitoring system: a) Scheme;
b) Real test performing ................................................................................................................................... 63
Figure 4.3: Load-central deflection curves of series L_6. .......................................................................... 66
Figure 4.4: Load-central deflection curves of series L_8. .......................................................................... 66
Figure 4.5: Load-central deflection curves of series L_10. ........................................................................ 66
Figure 4.6: Relationship between the midspan deflection and the relative increment of the slab load
carrying capacity for all series. ........................................................................................................................ 66
Figure 4.7: Locations of the core samples extracted. .................................................................................. 67
Figure 4.8 - Fibre distribution along the depth of the slab. ....................................................................... 68
Figure 4.9: Stress-Strain diagram used in the numerical strategy .............................................................. 71
Figure 5.1: Materials used in HPSFRC compositions: a) Coarse Aggregate 2 (14/20); b) Coarse
Aggregate 1 (6/14); c) Fine Aggregate (2/6); d) Fine Sand; e) Limestone Filler (máx: 10µm); f) Type
II, 42.5R Cement; ............................................................................................................................................. 81
Figure 5.2: Ordinary reinforcement: a) longitudinal view; b) transversal view ....................................... 83
Figure 5.3: Three point loading tests in slab strips: a) general view; b) monitoring system .................. 83
Figure 5.4: Stress-strain curves of HPSFRC: a) fcm50 series; b) fcm70 series ........................................... 84
Figure 5.5: Notch in a specimen to evaluate bending parameters of HPSFRC: depth = 74mm ......... 85
Figure 5.6: Load-displacement curves of bending in the tested series of HPSFRC: a) fcm50 series; b)
fcm70 series ........................................................................................................................................................ 86
Figure 5.7: Load-displacement curves series with ordinary longitudinal reinforcement ....................... 87
Figure 5.8: Crack Pattern in fcm50 series: a) without fibres, b) 60 kg/m3 and c) 75 kg/m3 of fibres . 88
Figure 5.9: Tri-linear normal stress - normal strain diagram to simulate the fracture mode I crack
propagation ....................................................................................................................................................... 92
Figure 5.10: Bi-linear shear stress-shear strain diagram to simulate the fracture mode II crack sliding.
............................................................................................................................................................................ 93
Figure 5.11: Fracture Modes I, II and III ..................................................................................................... 94

xviii
Figure 5.12: Stress-crack opening diagram ................................................................................................... 94
Figure 5.13: Finite element mesh adopted in the inverse analysis ............................................................ 95
Figure 5.14: Force-deflection curves of the nothced beam bending tests: comparison between
experimental and inverse analysis results ...................................................................................................... 95
Figure 5.15: Relationships between the load and the displacement at the midspan .............................. 97
Figure 6.1: Prestressed Delta beam in HSSFRC ...................................................................................... 102
Figure 6.2: Box-culvert. ................................................................................................................................ 103

xix
LIST OF TABLES Table 2.1: Times of execution and implication of worker ......................................................................... 15
Table 3.1: Final Composition for 1 m3 of SFRSCC 30 kg of fibres ......................................................... 21
Table 3.2: Final composition to 1 m3 of SFRSCC_30 compared with SFRSCC_45 ............................. 33
Table 4.1: Adopted composition (per m3 of concrete) ............................................................................... 62
Table 4.2: Main characteristics of the tested slab strips. ............................................................................ 64
Table 4.3: Force values of the tested slabs. .................................................................................................. 65
Table 4.4: Increase provided by fibre reinforcement in terms of load carrying capacity at
serviceability (IF(ELUt)) and ultimate limit states (IF(Max)). ............................................................................... 67
Table 4.5: Influence of the content of fibres on the flexural resistance. ................................................. 69
Table 4.6: Equivalence between a cross section area of a fictitious conventional reinforcement and a
content of steel fibres. ..................................................................................................................................... 70
Table 4.7: Concrete properties.‰ ................................................................................................................. 71
Table 5.1: Compositions of HSC designed to the experimental program. .............................................. 79
Table 5.2: Compositions of HPC designed to the experimental program (per m3 of concrete) .......... 82
Table 5.3: Relation of the slab strips built and tested ................................................................................. 82
Table 5.4: Mechanical characterization of the tested series: compression tests ...................................... 84
Table 5.5: Values for the FELUt and Fmax ........................................................................................................ 87
Table 5.6: Fibre reinforcement effectiveness indexes for serviceability (IF(ELUt)) and ultimate (IF(Max))
limit state analysis ............................................................................................................................................. 88
Table 5.7: Contribution of steel fibres to the concrete shear resistance .................................................. 91
Table 5.8: Values of the parameters derived from inverse analysis .......................................................... 96
Table 5.9: Values of the parameters used in the first intent of simulation…………………………97
Table 5.10: Values of the parameters of the Tri-linear tension softening diagram……………… 98
The Bending and Shear Behaviour of Laminar Structures of High Performance Steel Fibre Reinforced Concrete
Simão Pedro Fonseca Santos – University of Minho, Portugal 1-119
1. INTRODUCTION
1.1. Background, aim and scope
Since every time, the idea of excellent performance and constant superseding of the limits moves all
society agents, enhancing all types of technology, developing all variants of knowledge.
The concrete issues and all the industries related are not an exception. Concrete has been in
existence in changing forms for thousands of years (Pereira, 2006) (to a detailed description of
concrete history, see Smeaton (1813), le Châtelier (1904), Vitruvius (1931), Gimpel (1967),
Efstathiadis (1978), Stanley (1979) and Idorn (1997)). However, the real development of concrete
technology started in the early 19th century, when Joseph Aspdin made a new, improved cement by
heating chalk and clay together, and then grinding it down to fine powder. It was the naissance of
the Portland cement, a material that would revolutionize the modern world, allowing the
construction of cities, countries, civilizations. It was a clear example of superseding.
The development of concrete compositions designed to set special requirements (ductility,
ease of placement, compaction without segregation, early age strength, long-term mechanical
properties, permeability, density, heat of hydration, toughness, volume stability, long life in severe
environments, etc.) started much later. Only in 1970, the first fibre reinforced concrete building was
constructed; five years later the highest reinforced concrete building was constructed: the CN Tower
in Toronto, Canada (555 meters), the tallest slip-form building to date. The fundamental benefit of
incorporating fibres in concrete is the increase in toughness which, in the context of fibre reinforced
concrete (FRC), is a broad term that is used to represent the increase in the energy dissipation during
the loading process. This is reflected by the ability of the material to ensure cracking without
disintegrating completely, as in plain unreinforced concrete. In structural applications, such

The Bending and Shear Behaviour of Laminar Structures of High Performance Steel Fibre Reinforced Concrete
Simão Pedro Fonseca Santos – University of Minho, Portugal 2-119
behaviour could result in significant advantages against impact loads, seismic actions, shrinkage and
splitting and shear forces (Oliveira e Sousa and Gettu, 2004).
The development of self-compacting concrete started even later, in 1988, in Japan (Okamura
and Ozawa, 1994). The problem of the durability and applicability of concrete in structures was a
major topic of interest in this country. The durability of concrete is intimately related to the level of
compaction achieved while concreting, and the gradual reduction of skilled workers in Japan´s
construction industry led to a reduction in the quality of construction work. Consequently, the
development of a self-compacting concrete (SCC), able to be compacted purely by means of its own
weight and without the need of any external vibration system, independently from the quality of the
construction work, started to seem a good alternative to be developed.
The adventure of the so called High Performance Concretes (HPC) is a new concept, with
around 40 years. Since then, researchers and society agents related with construction industry have
done an effort to go deeper in the comprehension of these technologies, trying to understand the
chemical and physical phenomena acting in structures built with such materials. Great efforts have
been done, resulting in great achievements.
Although all the knowledge that already exists in the field of the HPC, the utilization of
these kinds of compositions did not spread as it was expected by the most optimists. The lack of
specific design codes and construction practices leads to a still insufficient development of this
technology: designers do not have official normative to defend their calculations. This fact is
appointed as the main reason for the present situation, but it is not the only reason.
In order to provide the designers with these kinds of tools, a great effort in recognizing all
the possible phenomena related with HPC technology is needed. This means experimental results in
a quantity that can justify the execution of normative; numerical models able to simulate these
phenomena must be also developed. These data must be absorbed by the designers. The promoters
must understand the great benefits and lower costs of this technology. A real change in the
manufacturing processes using a new generation of concretes, means that all this parameters must be
aligned in the same direction.
Beside all the non-technical reasons, there are also the technical ones. The bending and shear
behaviour of laminar structures of High Performance Fibre Reinforced Concrete (HPFRC) is not
The Bending and Shear Behaviour of Laminar Structures of High Performance Steel Fibre Reinforced Concrete
Simão Pedro Fonseca Santos – University of Minho, Portugal 3-119
already known in some very important aspects. The aim of the present work, based on an extensive
experimental work and numerical simulations, is to understand the behaviour of HPFRC structural
elements under bending and shear load conditions. An evaluation of some formulations to predict
the failure of these elements is presented and discussed. A numerical strategy with a program based
on the Finite Element Method (Femix) is carried out and an evaluation of its level of accuracy is
done and discussed.
The work aims also to be a contribution to the development and the spread of the HPC
technologies, serving as a tool to all the technical agents related with the construction industry areas
where the utilization of these kinds of materials can be extremely useful. One final objective is to
show that it is possible to design cost competitive compositions of HPC, discarding the idea that
this kind of technology is very onerous.
1.2. Outline of contents
The different chapters of the thesis are briefly described in the following. The thesis consists in 6
chapters and an extensive bibliography.
In Chapter 2, a detailed review of the relevant aspects of steel fibre reinforced
self-compacting concrete (SFRSCC) technology is given, including the principal properties, materials
and mixture proportions, test methods for characterizing the material and an overview of some
special applications.
In Chapter 3, a real scale application is presented. This work was part of a research project
developed in a prefabrication industry whose interests are mainly related with the conception of
façade panels for buildings. Specific compositions of SFRSCC were conceived and tested in
laboratory. The structural behaviour of the material was characterized with resource to laboratory
tests in panel prototypes. In order to assess the applicability of the conceived compositions, a real
scale panel was fabricated and tested in industrial environment.
In Chapter 4, an experimental program to understand the behaviour of laminar structures of
HPSFRC for laminar structures failing in bending is presented. The main target is to assess if and
how can ordinary reinforcement be replaced by steel fibres.

The Bending and Shear Behaviour of Laminar Structures of High Performance Steel Fibre Reinforced Concrete
Simão Pedro Fonseca Santos – University of Minho, Portugal 4-119
In Chapter 5, an introduction to High Strength Concrete (HSC) technology is presented.
Several compositions of HPSFRC were developed. An experimental program was carried out to
determine the contribution of steel fibres in HPSFRC elements failing in shear.
The general and specific conclusions of the Thesis are presented in Chapter 6, along with
some recommendations for future research.

The Bending and Shear Behaviour of Laminar Structures of High Performance Steel Fibre Reinforced Concrete
Simão Pedro Fonseca Santos – University of Minho, Portugal 5-119
2. STEEL FIBRE SELF COMPACTING CONCRETE
TECHNOLOGY
2.1. Definition of Self Compacting Concrete
Self-compacting concrete (SCC) can be defined as concrete that is able to flow in the interior of the
formwork, passing through the reinforcement and filling it in a natural manner, being consolidated
under the action of its own weight (Okamura, 1997). Besides the requirement of being consolidated
without the use of any vibration equipment, segregation should not occur during the application of
SCC.
Self Compacting Concrete represents one of the most important advances in concrete
technology in the last decade for the increase of quality of structures, for the increase of productivity
and the better production process, for the simplification of executing elements of complex
geometry, to avoid the vibration process and to improve work conditions (Choulli et al, 2005).
The first steps in the self compacting concrete technology were given in Tokio University,
Japan, in 1986. The first application of SCC in a prototype was made in 1988 (Okamura and Ouchi,
1999). Since then, a great effort has been done in the improvement of the SCC technology and in
the characterization of its properties by experimental research.
To assure self-compacting requirements to a concrete, the mixture should have the right
values for its fluidity, viscosity and cohesion, in order to assure that the mixture flows
homogeneously without the occurrence of segregation. This type of exigencies is not required for
The Bending and Shear Behaviour of Laminar Structures of High Performance Steel Fibre Reinforced Concrete
Simão Pedro Fonseca Santos – University of Minho, Portugal 6-119
conventional concretes. In consequence, specific tests should be carried out to check
self-compacting requirements.
The high fluidity of SCC gives it the capacity of flowing within the formwork, filling it only
under its own weight. SCC has also the capacity to evolve the spaces between any obstacles.
Segregation of the SCC components can be avoided controlling the viscosity and the cohesion of
the mixture.
The microstructure and the “inert-binder paste” interface of SCC are more compact than the
ones of conventional concrete of same water/binder ratio. In consequence, if compared to
conventional concrete, SCC has high resistance to clorets and gases penetration and has also higher
adherence to the reinforcement. However, in general, SCC has higher content of cement than
conventional concrete, which requires extra cautions during its curing procedure to avoid crack
formation, mainly in elements that have some restrictions to its deformation.
The use of discrete steel fibres as a reinforcement system for cement based materials is now
a current practice for several applications (Di Prisco et al, 2004). The resulting material is designated
Steel Fibre Reinforced Concrete (SFRC). The post cracking residual stress is much higher in SFRC
than in plain concrete (PC), due to fibre reinforcement mechanisms provided by fibres bridging the
cracks (Barros et al, 2005). In consequence, SFRC allows high level of stress redistribution,
providing a significant deformability capacity of a structure between crack initiation and its failure,
which increases the structural safety. This is especially relevant in structures of a redundant number
of supports (Barros, 1995). The level of the post cracking residual stress depends of several factors,
namely: fibre geometric characteristics, fibre material properties, concrete properties, method of
SFRC application.
The benefits provided by concrete fibre addition are also visible in structures submitted to
cyclic and fatigue loads, since this material can be engineered to have very high energy absorption
capacity (Barros et al, 2000). When well conceived, fibre reinforcement can replace totally or partially
conventional steel reinforcement for the flexural and shear resistance of concrete elements
(Casanova (1995), Casanova (2002), Roshani (1996)). The percentage of this replacement depends
on the type of element, and support and loading conditions.

The Bending and Shear Behaviour of Laminar Structures of High Performance Steel Fibre Reinforced Concrete
Simão Pedro Fonseca Santos – University of Minho, Portugal 7-119
Adding the benefits that fibre reinforcement can provide to those resulting from the
characteristics of self-compacting, a high performance material can be obtained, designated Steel
Fibre Reinforced Self-Compacting Concrete (SFRSCC).
SFRSCC can be seen as a material constituted of a solid and a fluid phase. The solid phase is
composed by the solid skeleton of the mixture, being constituted by the aggregates of an equivalent
diameter larger than 150 μm. The research involving the solid skeleton should have the purpose of
obtaining the highest compact skeleton. The fluid phase (binder paste) is composed by water,
adjuvants and a solid part of particles of an equivalent diameter smaller than 150 μm. This phase is
the most complex of the mixture, due to the diversity and the nature of its components.
Superplasticizers (adjuvants) have the function of dispersing the particles and avoid flocculation:
these flakes appeared in the sequence of the aggregation of particles in suspension, resulting greater
spaces between particles and a reduction on the paste fluidity. To fulfill the space in-between
particles the content of the water should increase.
2.2. Tests to assess self-compacting requirements
The most common tests to assess the self compacting requirements are V-Funnel test, L-Box test
and Slump Flow test, with or without a J-Ring. These tests, providing values in length and time
unities, can decide about considering, or not, a concrete as a SCC. They are easily executed and do
not require to build sophisticate and expensive apparatus. The values provided by these tests have,
however, empirical basis.
2.2.1. Slump Flow Test
The slump flow test is used to assess the horizontal free flow of SCC in the absence of obstructions
as well as its filling ability under its own weight. It was first developed and standardized in Japan
(JSCE-F503, 1990) for use in assessment of underwater concrete. The test method is based on the
Abrams Cone test, which is the most used to assess the workability and fluidity of fresh concrete. It
can also detect, by visualization, the occurrence of segregation and bleeding, which is manifested by
the separation of the paste around the perimeter, presence of coarse aggregate without mortar and
irregularity in the distribution of coarse aggregate (Bartos, 2000) . The diameter of the concrete circle
is a measure for the filling ability of the concrete.

The Bending and Shear Behaviour of Laminar Structures of High Performance Steel Fibre Reinforced Concrete
Simão Pedro Fonseca Santos – University of Minho, Portugal 8-119
The characteristics of the instruments are specified in EN 12350-2 (2000) and ISO 1920-2
(2005) standards. The inferior and superior bases of the Abrams Cone have 200 mm and 100 mm
diameter, respectively, while its height is 300 mm. In a steel base plate, two concentric
circumferences are marked; one with 200 mm of diameter and the other with 500 mm of diameter
(see Figure 2.1).
a) b)
Figure 2.1: Flow Test Apparatus: a) representation; b) real apparatus
The diameter of the final spread (df) is measured as the average of two perpendicular
diameters, along with the time (T50) taken to reach a diameter of 50cm (d50), as shown in Figure 2.2.
The higher the slump flow (df) value, the greater is its ability to fill formwork under its own weight.
A value of at least 650mm is required for SCC. There is no generally accepted advice on what are
reasonable tolerances about a specified value, though ± 50mm, depending on the flow table test,
might be appropriate. The T50 time is a secondary indication of flow. A lower time indicates greater
flowability. The Brite EuRam (1996) research suggested that a time of 3-7 seconds is acceptable for
civil engineering applications, and 2-5 seconds for housing applications.
Figure 2.2: Measuring the final diameter of SFRSCC in one direction

The Bending and Shear Behaviour of Laminar Structures of High Performance Steel Fibre Reinforced Concrete
Simão Pedro Fonseca Santos – University of Minho, Portugal 9-119
In case of severe segregation high percentage of coarse aggregate remains in the centre of
the pool of concrete and mortar and cement paste at the concrete periphery. In case of minor
segregation a border of mortar without coarse aggregate can occur at the edge of the pool of
concrete.
Abrams Cone with J-Ring
Slump Flow test does not provide a direct measure of the passing ability of the concrete. To assess
the fluidity of SCC, when it should be passed through steel bars in RC elements, a combination of
Abrams Cone and J-Ring is used to study the blockage (Groth and Nemegeer, 1999), placing the
Abrams Cone inside the J-Ring (see Figure 2.3). The equipment consists of an open steel ring,
drilled vertically with holes to accept threaded sections of reinforcement bar. These bars can have
different diameters and can be spaced at different intervals: in accordance with normal
reinforcement considerations, 3 times the maximum aggregate size might be appropriate. The
diameter of the ring of vertical bars is 300mm, and the height 100 mm.
a) b)
Figure 2.3: Abrams Cone with J-Ring Slump Flow Test Apparatus: a) representation; b) real apparatus
2.2.2. L-Box Test
This test is based on a Japanese design for underwater concrete (Petersson et al (1996), Bartos and
Grauers (1999) and Sedran and De Larrard (1999)). The test assesses the flow of the concrete, and
also the extent to which it is subject to blocking by reinforcement. The apparatus is shown in Figure
2.4 and consists of a rectangular-section box in the shape of an ‘L’, with a vertical and horizontal

The Bending and Shear Behaviour of Laminar Structures of High Performance Steel Fibre Reinforced Concrete
Simão Pedro Fonseca Santos – University of Minho, Portugal 10-119
channel, separated by a moveable gate made of steel bar. The vertical section, with a capacity of
approximately 12 dm3, is filled with concrete; than the gate is lifted to let the concrete to flow into
the horizontal channel that has the same dimension of the cross section of the channel.
a) b)
Figure 2.4: L-Box test apparatus: a) representation; b) real apparatus
When the flow has stopped, the heights of the concrete at the end of the vertical (H1) and
horizontal (H2) channels are measured, and the H2/H1 ratio is determined (see Figures 2.4 to 2.7).
This ratio represents the passing ability, or the degree to which the passage of concrete through the
bars is restricted. The horizontal channel of the box can be marked at 200mm and 400mm from the
gate and the times taken to go through these distances are measured and attributed to T20 and T40
variables that give an indication of the concrete filling ability. The steel bars of the gate can be of
different diameters and spaced at different intervals: in accordance with normal reinforcement
considerations, 3 times the maximum aggregate size might be appropriate. The bars can principally
be set at any spacing to impose a more or less severe test of the passing ability of the concrete.

The Bending and Shear Behaviour of Laminar Structures of High Performance Steel Fibre Reinforced Concrete
Simão Pedro Fonseca Santos – University of Minho, Portugal 11-119
Figure 2.5: End of test Figure 2.6: Measuring H2 Figure 2.7: Measuring H1
If the concrete flows as freely as water, at rest it will be horizontal, so H2/H1 = 1.
Therefore the nearer this test value, the ‘blocking ratio’ (Cbl), is to unity, the better the flow of the
concrete. The EU research team (Brite Euram, 2002) suggested a minimum acceptable value of 0.8.
T20 and T40 times can give some indication of how ease concrete flows, but no general consensus
was still found for the values to attribute to these parameters. Blocking of coarse aggregate behind
the reinforcing bars of the gate can be detected visually. Occurrence of segregation can also be
visualized in qualitative manner.
2.2.3. U-Box Test
The test was developed by the Technology Research Centre of the Taisei Corporation in Japan
(Rooney and Bartos, 2001). Sometimes the apparatus is called as “box-shaped” test. The test is used
to measure the filling ability of self-compacting concrete. The apparatus consists of a vessel that is
divided into two compartments by a middle wall (see Figure 2.10). An opening with a sliding gate is
fitted between the two compartments. Steel bars with nominal diameter of 12 mm are installed at
the gate with centre-to-centre spacing of 47 mm. This creates a clear spacing of 35 mm between the
bars. The left hand channel is filled with about 20 dm3 of concrete then the gate lifted and concrete
flows upwards into the other channel. When flowing is stabilized, the height of the concrete in both
sections is measured.

The Bending and Shear Behaviour of Laminar Structures of High Performance Steel Fibre Reinforced Concrete
Simão Pedro Fonseca Santos – University of Minho, Portugal 12-119
Figure 2.8: U-Box test apparatus
If the concrete flows as freely as water, at rest it will be horizontal, so H2-H1 = 0.
Therefore the nearer this test value, the ‘filling height’, is to zero, the better the flow and passing
ability of the concrete. When the filling height is greater than 300mm, it is considered that the
concrete has good filling ability.
2.2.4. V-Funnel Test
The test was developed in Japan and used by Ozawa et al in the University of Tokyo (Gomes, 2002).
The equipment consists of a V-shaped funnel, shown in Figure 2.9. An alternative type of V-funnel,
the O-funnel, with a circular section is also used in Japan. The described V-funnel test is used to
determine the filling ability (flowability) of the concrete with a maximum aggregate size of 20mm.
The funnel is filled with about 12 dm3 of concrete and the time taken to flow through the
apparatus is measured for first time. After this, the funnel can be refilled with concrete and left for
5 minutes to settle, in order to make another measure of the flowing time. If the concrete shows
segregation then the value of the second flow time will increase significantly.
The Bending and Shear Behaviour of Laminar Structures of High Performance Steel Fibre Reinforced Concrete
Simão Pedro Fonseca Santos – University of Minho, Portugal 13-119
a) b)
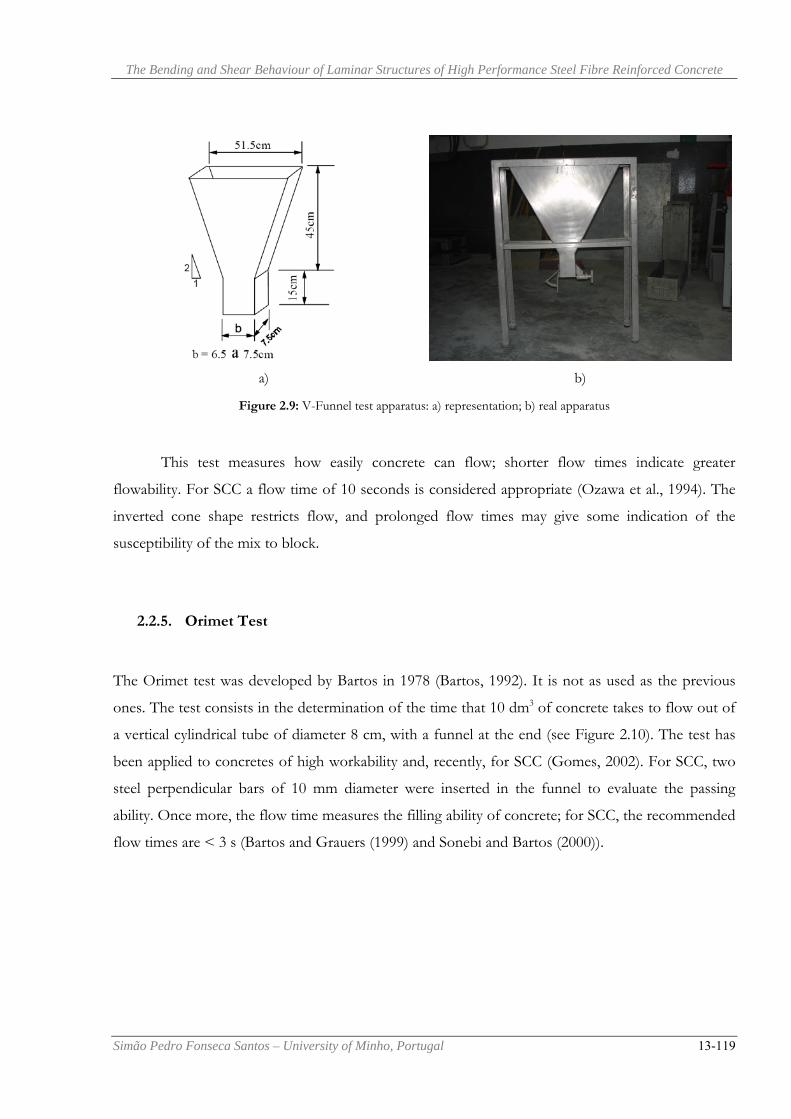
Figure 2.9: V-Funnel test apparatus: a) representation; b) real apparatus
This test measures how easily concrete can flow; shorter flow times indicate greater
flowability. For SCC a flow time of 10 seconds is considered appropriate (Ozawa et al., 1994). The
inverted cone shape restricts flow, and prolonged flow times may give some indication of the
susceptibility of the mix to block.
2.2.5. Orimet Test
The Orimet test was developed by Bartos in 1978 (Bartos, 1992). It is not as used as the previous
ones. The test consists in the determination of the time that 10 dm3 of concrete takes to flow out of
a vertical cylindrical tube of diameter 8 cm, with a funnel at the end (see Figure 2.10). The test has
been applied to concretes of high workability and, recently, for SCC (Gomes, 2002). For SCC, two
steel perpendicular bars of 10 mm diameter were inserted in the funnel to evaluate the passing
ability. Once more, the flow time measures the filling ability of concrete; for SCC, the recommended
flow times are < 3 s (Bartos and Grauers (1999) and Sonebi and Bartos (2000)).

The Bending and Shear Behaviour of Laminar Structures of High Performance Steel Fibre Reinforced Concrete
Simão Pedro Fonseca Santos – University of Minho, Portugal 14-119
Figure 2.10: Orimet Test Apparatus with J-Ring
2.3. The possibilities of steel-fibre reinforced concrete: an overview
Mostly of the authors consider unanimously Self Compacting Concrete as a great and a promising
material within the construction industry. SCC is treated like an extraordinary material, with
extraordinary characteristics that allows the development of structures with high complex geometry,
almost impossible to be made with traditional concretes. The same happens with High Strength
Concretes, High Performance Concretes as well as with Steel Fibre Reinforced Concretes, where,
due to of all the I&D already done, is possible to asseverate the behaviour in many real conditions.
The consolidation of SCC as a construction material in conventional applications increases
every day (Mas, 2005). In Europe, countries like France, Italy and Holand have already great
percentages of applications of this material. Portugal and Spain, where traditionally, this sector is
very different from the others, SCC is starting to give its first steps, although the lack of normative
related. In Spain, the first Spanish Congress on Self-Compacting Concrete happened in 2007 (HAC
2008), which shows that, although this theme is giving the first steps in this country, this technology
is getting more and more attention from enterprises and academic community.
The present wok will board, especially, the application of SFRSCC in the precasting industry.
The concrete precasting industry is where SCC technology is growing up faster, since the evaluation
of cost production is much simpler and where all the economical advantages of this material can be
better appreciated. There are also all the advantages from the quality environment point of view,
with the elimination of constant noises of vibrators and the reduction of labour risks in long term.

The Bending and Shear Behaviour of Laminar Structures of High Performance Steel Fibre Reinforced Concrete
Simão Pedro Fonseca Santos – University of Minho, Portugal 15-119
In addition, the final quality of the products can be much better, which is a relevant characteristic in
several precasting elements.
The following table shows the evaluation of times of execution and implication of worker in
a common unity of prefabrication.
Table 2.1: Times of execution and implication of worker
3,5 m3 Slab 5,5 m3 Doble Slab in T
Conventional Concrete
Self-Compacting Concrete
Conventional Concrete
Self-Compacting Concrete
Implicated Worker 6 workers 3 workers 7 workers 3 workers
Time of Execution 3 hours 1 hour 3.5 hours 1 hour
As can be seen in Table 2.1, the additional costs associated to the production of SCC can be
easily amortized by the savings in implicated worker and time of execution. Besides, the increasing
life cycle of moulds turns the technology of SFRSCC in a cheaper way to produce precasted
elements.
But the advantages are not only visible in the precasting industry. Mas (2005) shows the
great advantages of the utilization of SCC in conventional edifications like filling slabs, pavements,
support walls and other elements.
To a detailed description of SFRSCC’s and SCC’s possibilities, see (Pereira, 2005) and
(Domone, 2006).
2.4. Conclusions
The main properties and the principal test procedures of SCC have been reviewed. The study shows
that the characterization of the behaviour of SFRSCC in fresh state needs new test methods since
the traditional tests are not applicable. From all these tests, only the Slump Flow test, Slump Flow
with J-Ring test and L-Box test were used in the experimental programs carried out within the ambit
of the present dissertation. The other tests were not used, since their applicability is too questionable

The Bending and Shear Behaviour of Laminar Structures of High Performance Steel Fibre Reinforced Concrete
Simão Pedro Fonseca Santos – University of Minho, Portugal 16-119
due to the fact that the dosages of steel fibres on the manufactured elements were relatively high.
No specific tests are available for SFRSCC: so, in this work, an adaptation of the tests to SCC was
made, in order to characterize the concrete compositions in fresh state. New methods must be
developed with this purpose.

The Bending and Shear Behaviour of Laminar Structures of High Performance Steel Fibre Reinforced Concrete
Simão Pedro Fonseca Santos – University of Minho, Portugal 17-119
3. FAÇADE PANELS IN STEEL FIBRE
SELF-COMPACTING CONCRETE
3.1. Introduction
The Precast Industry is the Civil Construction related industry where the usage of SCC can conduce
to greater advantages, since the reduction of time and efforts to provide manual finishing to the cast
elements - derived from the improvement of quality of surfaces - the increase of the life cycle of
moulds or the usage of lighter moulds. For these reasons, since its introduction, the concept of SCC
caught the attentions of researchers and professionals of construction industry, thanks to its
advantages and attractive properties in fresh and hardened state.
The quality of produced elements depends directly of the technology within the factory;
many efforts are taken to develop new technology in materials, equipment and production processes
in order to improve the quality and competitiveness of concrete elements. Besides, there are all the
obligations related with the environment consciousness, which imposes more and more restrictive
conditions to the design and construction practices, turning very tight the obtaining of construction
approvals under the inspection of competent entities.
SCC technology can be very useful in this kind of industry. The perfection of the elements is
reached with no necessity of extra-qualified worker; this perfection does not depend on the
vibration (principal responsible for the refusal of the pieces by the Quality Control Departments);
with no vibration directly applied to the moulds, they have a bigger useful life; and, as it was already
mentioned in Chapter 2, the absence of vibration creates a better environment within the industrial
naves, without noise and much cleaner.

The Bending and Shear Behaviour of Laminar Structures of High Performance Steel Fibre Reinforced Concrete
Simão Pedro Fonseca Santos – University of Minho, Portugal 18-119
For the other hand, in concrete precast industry, the complexity of forms and geometries
obligates many times the adoption of great percentages of reinforcement which, no rarely, turn the
filling process a very difficult task. These problems are being investigated since longer. The partial or
total replacement of the concrete reinforcement by discrete steel fibres is being pursued from long
years ago (ACI, 1996), since there are several examples of concrete elements only requiring
reinforcement to control cracking phenomena.
In this type of elements SFRSCC is an effective alternative since the benefits of SCC and
fibre reinforcement can be combined to obtain a material of great ductility high energy absorption
capacity.
To evaluate how effective can be this alternative, an experimental program was carried out
to characterize an SFRSCC to be used in façade panels for buildings. Several requirements were
defined so the production of this kind of elements can be presented as an alternative.
.
In the precast concrete industry, besides the perfect finishing, the ability to demould the
elements as soon as possible is an extremely important requirement. To assure a safe demoulding
process, the influence of the concrete age on the flexural and compression behaviour of the
SFRSCC must be known. During the process of demoulding and stocking, the elements are
submitted to relatively high stress levels that can produce damages in an irreversible way. This
conducts to the refuse of these elements by the Quality Control process, with the inherent costs that
it imposes. So, one of the establishments for a secure demoulding process is to guarantee that a
minimum level of resistance have already been achieved before the start of this process. This level of
resistance is evaluated by the concrete compressive strength. In the present case, a minimum
compressive strength of 20 MPa, 24 hours after the casting operations, must be reached.
In order to start the demoulding process as soon as possible, the precast industry tries to
accelerate the cure of the concrete elements. One of the most common processes to accelerate the
process of cure of concrete is to provide external fonts of heat directly applied to the moulds and
the elements, especially in the winter, when the air temperatures are lower. This practice results very
expensive, due to the enormous energy consumption, which, obviously, increases the final price of
the manufactured products. As the SCC compositions have less water dosage than a current
concrete, its cure process is, in general, faster than for a normal water dosage concrete.

The Bending and Shear Behaviour of Laminar Structures of High Performance Steel Fibre Reinforced Concrete
Simão Pedro Fonseca Santos – University of Minho, Portugal 19-119
The panels can’t be too heavy, since its weight can generate difficult application in the
building’s façades. In the present experimental program, a laminar (4100×2200×110) mm2 (current
dimensions in these kind of elements) façade panel should be built; considering a massive panel it
would have a weight of approximately 24.81 kN, which would be too much for a façade panel. In
order to decrease the weight of the panels, (300×300×80) mm3 polystyrene plates were used in order
to create a mesh with massive (100×110) mm2 perpendicular lines and zones that with a SFRSCC
layer with a thickness of 30mm (see Figures 3.41 to 3.47). This will permit the construction of a
panel with an approximate weight of 13.05 kN.
So, when installed in building façades, the panel’s flexural strength is the principal design
property, since significant bending moments result from wind loading, which has the greatest impact
on the most unfavorable load combination. Representative elements of the SFRSCC panel system
were tested to assess its flexural behaviour. Since the SFRSCC layer at the lightweight parts of the
panel is only 30 mm thick, its resistance to punching was also determined, based on experimental
research.
The research program ended with the fabrication of a real size panel in industrial
environment. This panel was loaded up to failure in order to evaluate its load carrying capacity.
3.2. Material constituents
The used materials were cement (C) CEM I 42.5R, limestone filler (LF), superplasticizer (SP) of
third generation based on polycarboxilates (Glenium® 77 SCC), water (W), three types of aggregates
(fine river sand, coarse river sand and crushed granite 5-12 mm) and DRAMIX® RC-80/60-BN
hooked end steel fibres. This fibre has a length (lf) of 60 mm, a diameter (df) of 0.75 mm, an aspect
ratio (lf/df) of 80 and a yield stress of 1100 MPa.
The Bending and Shear Behaviour of Laminar Structures of High Performance Steel Fibre Reinforced Concrete
Simão Pedro Fonseca Santos – University of Minho, Portugal 20-119
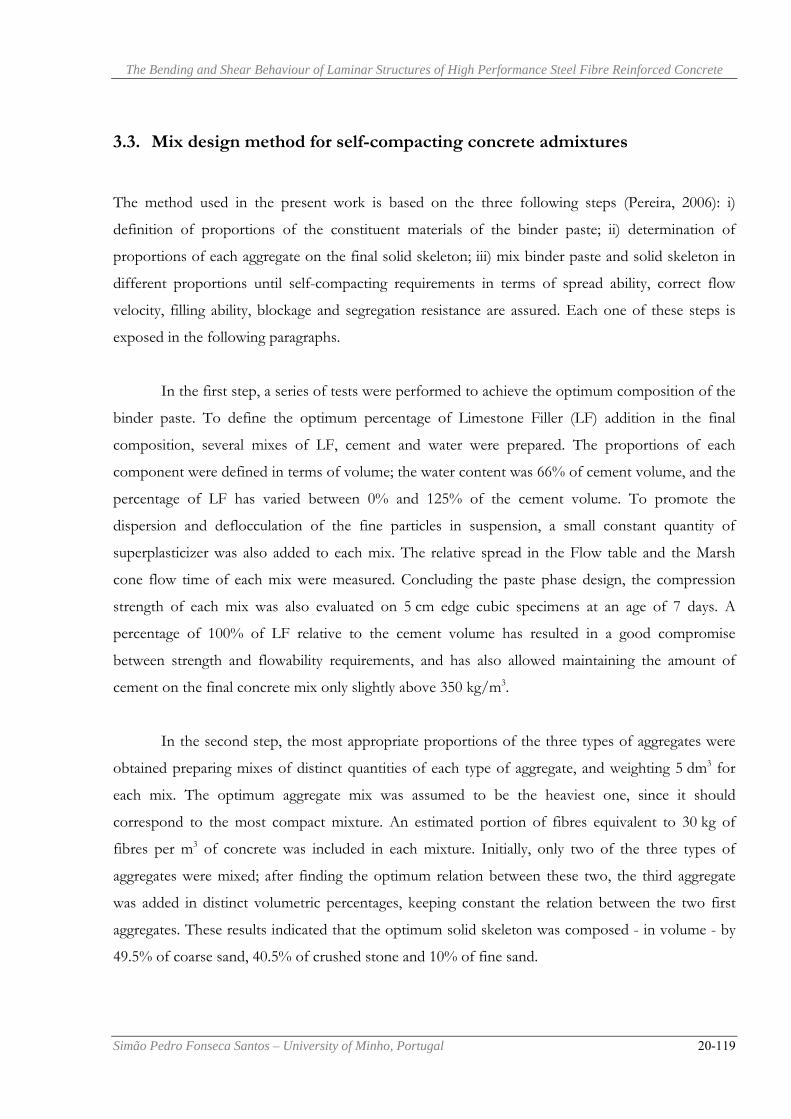
3.3. Mix design method for self-compacting concrete admixtures
The method used in the present work is based on the three following steps (Pereira, 2006): i)
definition of proportions of the constituent materials of the binder paste; ii) determination of
proportions of each aggregate on the final solid skeleton; iii) mix binder paste and solid skeleton in
different proportions until self-compacting requirements in terms of spread ability, correct flow
velocity, filling ability, blockage and segregation resistance are assured. Each one of these steps is
exposed in the following paragraphs.
In the first step, a series of tests were performed to achieve the optimum composition of the
binder paste. To define the optimum percentage of Limestone Filler (LF) addition in the final
composition, several mixes of LF, cement and water were prepared. The proportions of each
component were defined in terms of volume; the water content was 66% of cement volume, and the
percentage of LF has varied between 0% and 125% of the cement volume. To promote the
dispersion and deflocculation of the fine particles in suspension, a small constant quantity of
superplasticizer was also added to each mix. The relative spread in the Flow table and the Marsh
cone flow time of each mix were measured. Concluding the paste phase design, the compression
strength of each mix was also evaluated on 5 cm edge cubic specimens at an age of 7 days. A
percentage of 100% of LF relative to the cement volume has resulted in a good compromise
between strength and flowability requirements, and has also allowed maintaining the amount of
cement on the final concrete mix only slightly above 350 kg/m3.
In the second step, the most appropriate proportions of the three types of aggregates were
obtained preparing mixes of distinct quantities of each type of aggregate, and weighting 5 dm3 for
each mix. The optimum aggregate mix was assumed to be the heaviest one, since it should
correspond to the most compact mixture. An estimated portion of fibres equivalent to 30 kg of
fibres per m3 of concrete was included in each mixture. Initially, only two of the three types of
aggregates were mixed; after finding the optimum relation between these two, the third aggregate
was added in distinct volumetric percentages, keeping constant the relation between the two first
aggregates. These results indicated that the optimum solid skeleton was composed - in volume - by
49.5% of coarse sand, 40.5% of crushed stone and 10% of fine sand.

The Bending and Shear Behaviour of Laminar Structures of High Performance Steel Fibre Reinforced Concrete
Simão Pedro Fonseca Santos – University of Minho, Portugal 21-119
The third phase was dedicated to the evaluation of the paste content in the concrete volume.
The optimum composition should accomplish an upper limit of around 350 kg of cement per m3 of
concrete. To achieve the optimum paste content, some mixes of concrete were prepared, varying the
paste percentage. For each mix, the added water was evaluated taking into account the aggregate’s
saturation degree. The mix process was always the same, and for each mix the slump flow test was
performed. Total spread, df, and time to reach a spread diameter of 50 cm, T50, were measured. Table
3.1 includes the composition that has best fitted self-compacting requirements (the amount of water
referred includes the aggregate’s saturation water). No sign of segregation was detected, a total
spread of 725 mm was measured and the mixture showed good homogeneity and cohesion, even
when flowing trough the small orifice of the Abrams cone (when testing, Abrams cone was always
used in the inverted position). A T50 of 4.6 seconds was measured.
Table 3.1: Final Composition for 1 m3 of SFRSCC 30 kg of fibres
3.4. Material Properties
3.4.1. Compression
The experimental program was composed by uniaxial compression tests with cylinders of 150 mm
diameter and 300 mm height, and flexural tests with prismatic (600×150×150) mm3 specimens. Both
types of specimens were molded without any external compaction. To assess the influence of the
age of SFRSCC on the compression and on the flexural behaviour, series of tests with specimens of
12 and 24 hours, and 3, 7 and 28 days were carried out.
The Young Modulus (Ec) is determined according to the recommendations of the
LNEC E397-1993 standard, using the test setup represented in Figure 3.1. This test setup is
composed by two rings at 100mm from each other. In the superior ring three Linear Variation
Displacement Transducers (LVDT) are placed, making an angle of 120º between them. These
LVDT’s read the deformation of the concrete specimen between the two parallel rings. This
proceeding avoids the LVDT’s to register extraneous deformations due to equipment.
Composition Paste/ Total volume (%) Cement (kg) LF
(kg) Water (dm3)
SP (dm3)
Fine sand (kg)
Coarse sand (kg)
Crushed stone (kg)
SFRSCC_30 0.34 364.28 312.24 139.12 6.94 108.59 723.96 669.28

The Bending and Shear Behaviour of Laminar Structures of High Performance Steel Fibre Reinforced Concrete
Simão Pedro Fonseca Santos – University of Minho, Portugal 22-119
Figure 3.1: Test setup to evaluate the concrete Young’s Modulus, Ec
To start the test, a stress of 0.5 to 1.0 MPa (σb) is applied and the corresponding strain is
measured (εb). The stress is than increased at a velocity of 0.5 ± 0.1 MPa/s until a stress level σa = fc
/ 3 is reached, where fc is the compressive strength, previously obtained in direct compression tests
with concrete cylinder specimens. The stress σa is maintained during 90 seconds, and in the last 30
seconds of this period, the strains are recorded (εa1). After this period, the load is decreased at a
stress ratio of 0.5 ± 0.1 MPa/s until a stress level σb. This stress level is maintained during a period
of 90 seconds, and in the last 30 seconds of this period, the strains are recorded. The loading
configuration of this test is composed of 10 cycles of this type (see Figure 3.2).
Figure 3.2: Representation of load cycles to determine Ec
The Young’s Modulus, Ec, is the average of the Ec,n values obtained in each cycle (see Equation 3.1):
, ,
,, ,
a n b nnc n
n a n b n
Eσ σσ
ε ε ε−Δ
= =Δ −
(3.1)
where σa,n and σb,n are the average stress of the nth cyclic, and εa,n and εb,n are the corresponding strains.

The Bending and Shear Behaviour of Laminar Structures of High Performance Steel Fibre Reinforced Concrete
Simão Pedro Fonseca Santos – University of Minho, Portugal 23-119
Compression tests were carried out in a servo-controlled equipment of 3000 kN maximum
load carrying capacity. Each test was controlled by the internal displacement transducer of this
equipment, at a displacement rate of 5 µm/s. Three displacement transducers were positioned at 120
degrees around the specimen to record the displacements between the load steel plates of the
equipment (see Figure 3.3). Once more, this arrangement of the LVDTs avoids that extraneous
deformation - such as the deformation of the reaction frame - can be added to the values recorded
by the LVDTs.
Taking the values recorded in these transducers, the displacement at the specimen axis was
determined for each scan reading, and the corresponding strain was obtained dividing this
displacement by the measured specimen’s height
Figure 3.3: Configuration of compression test and position of the LVDT’s
3.4.1.1.1 Results
The compression stress-strain relationship, c cσ ε− , for each testing age of SFRSCC is represented in
Figure 3.4. Each curve is the average of three specimens. As it was expected, the decay of the
post-peak residual compression strength has increased with the SFRSCC age, since the material
becomes more brittle with the increase of the compressive strength. However, this decay is not as
pronounced as it will be expected for plain concrete.

The Bending and Shear Behaviour of Laminar Structures of High Performance Steel Fibre Reinforced Concrete
Simão Pedro Fonseca Santos – University of Minho, Portugal 24-119
Figure 3.5 checks if the c cσ ε− expressions proposed by Model Code CEB-FIP 1993 to
simulate the uniaxial compression behaviour of plain concrete can be applicable to the developed
SFRSCC. This figure shows that those expressions simulate with high accuracy the uniaxial
compression behaviour of the designed SFRSCC up to its peak stress, but in the softening phase
(post-peak) they predict stress decay higher than the one observed experimentally.
0
10
20
30
40
50
60
70
0 2.5 5 7.5 10 12.5 15 17.5Strain (‰)
Stre
ss (M
Pa)
12 hours
24 hours
28 days
3 days
7 days
Figure 3.4: Stress-strain curves of SFRCSCC of different ages.
12 hours
24 hours3 days
7 days
28 days
0
10
20
30
40
50
60
70
0 2 4 6 8 10Strain (‰)
Stre
ss (M
Pa)
experimentalCEB-FIP 1993
Figure 3.5: Evaluation of the applicability of CEB-FIP 1993 expressions to simulate the behaviour of SFRSCC
in uniaxial compression.

The Bending and Shear Behaviour of Laminar Structures of High Performance Steel Fibre Reinforced Concrete
Simão Pedro Fonseca Santos – University of Minho, Portugal 25-119
Figures 3.6 and 3.7 show the influence of the age on the average compressive strength, fcm,
and on the average initial Young’s Modulus, Ecm. From the analysis of these figures, the following
observations can be pointed out: at 12 hours the pre-established minimum limit of 20 MPa for the
compressive strength at 24 hours had already been exceeded; at this age the fcm was about 25 MPa
while the Ecm was around 24 GPa. These properties increased with the SFRSCC age, reaching
fcm = 62 MPa and Ecm = 36 GPa at 28 days. The evolution of the compressive strength with time
indicates that, above 28 days the increase of fcm is marginal. This can be justified by the use of
relatively high percentage of a material (LF) without pozolanic activity in the binder paste
composition. The evolution of the Young’s Modulus with the age indicates that above 28 days the
increase of the Ecm is marginal. This can be justified by the low value of the water/cement (w/c)
ratio (approximately 0.28 in weight), since a high compact matrix has resulted. At 24 hours the fcm
and the Ecm were about 61% and 79% of the corresponding values at 28 days. In the first hours,
there was a more pronounced increase in Ecm than in fcm.
0
10
20
30
40
50
60
70
0 5 10 15 20 25 30
Age (days)
fcm
(MPa
)
Figure 3.6: Variation of fcm with age.
20
22
24
26
28
30
32
34
36
38
40
0 5 10 15 20 25 30
Age (days)
Ecm
(GPa
)
Figure 3.7: Variation of Ecm with age.

The Bending and Shear Behaviour of Laminar Structures of High Performance Steel Fibre Reinforced Concrete
Simão Pedro Fonseca Santos – University of Minho, Portugal 26-119
3.4.2. Bending
In the bending tests, the curing procedures, the position and dimensions of the notch sawn into the
specimen, the load and specimen support conditions, the characteristics for both the equipment and
measuring devices and the test procedures recommended by RILEM TC 162-TDF (Vandewalle,
2002) were adopted. The method for casting the beam specimens proposed by
RILEM TC 162-TDF was adapted for the case of SFRSCC since these specimens were cast without
any external compaction energy.
RILEM TC 162-TDF recommends the use of (600×150×150) mm3 beams, with a notch of
2-3 mm thick and 25±1 mm depth at the specimen middle surface. The test setup is represented in
Figure 3.8. At the notch mouth a “clip gauge” can be applied to measure the crack opening.
The LVDT is attached to a bar that is supported in two fixed points of the specimen. The
bar may rotate in turn of one of these points and slide along the other one (Figure 3.8d). This
arrangement for the support of the LVDT is designated by “Yoke system” (Gopalaratnam et al.
1991) and avoids extraneous deflections to be read by the LVDT. The reaction frame must have
enough stiffness to avoid the occurrence of unstable tests (Van Mier, 1984).

The Bending and Shear Behaviour of Laminar Structures of High Performance Steel Fibre Reinforced Concrete
Simão Pedro Fonseca Santos – University of Minho, Portugal 27-119
a)
b)
c)
d)
Figure 3.8: Bending Test Setup
The quality of the controller equipment and the stiffness of the reaction structure used in
this project, allow performing stable tests under displacement control. The load cell, with maximum
load capacity of 50 kN, has a linearity class of 0.03% of full scale. The LVDT presents a linearity
class of 0.1% of full scale (5 mm) and a repeatability of 0.01% of full scale.
The crack must start in the notch; otherwise the test must be rejected. The test is carried out
at a deflection ratio of 0.2 mm/min. The test ends when a displacement of 3.1 mm is reached.
Figure 3.9 represents a typical force-deflection (F-δ) relationship obtained in a bending test.
Using these relationships, RILEM TC 162-TDF proposed the evaluation of the load at the limit of
proportionality (FL), the equivalent (feq,2 and feq,3) and the residual (fR,1 and fR,4) flexural tensile strength
Support with 1 degree of freedom
Support with 3 degrees of freedom
Loading system
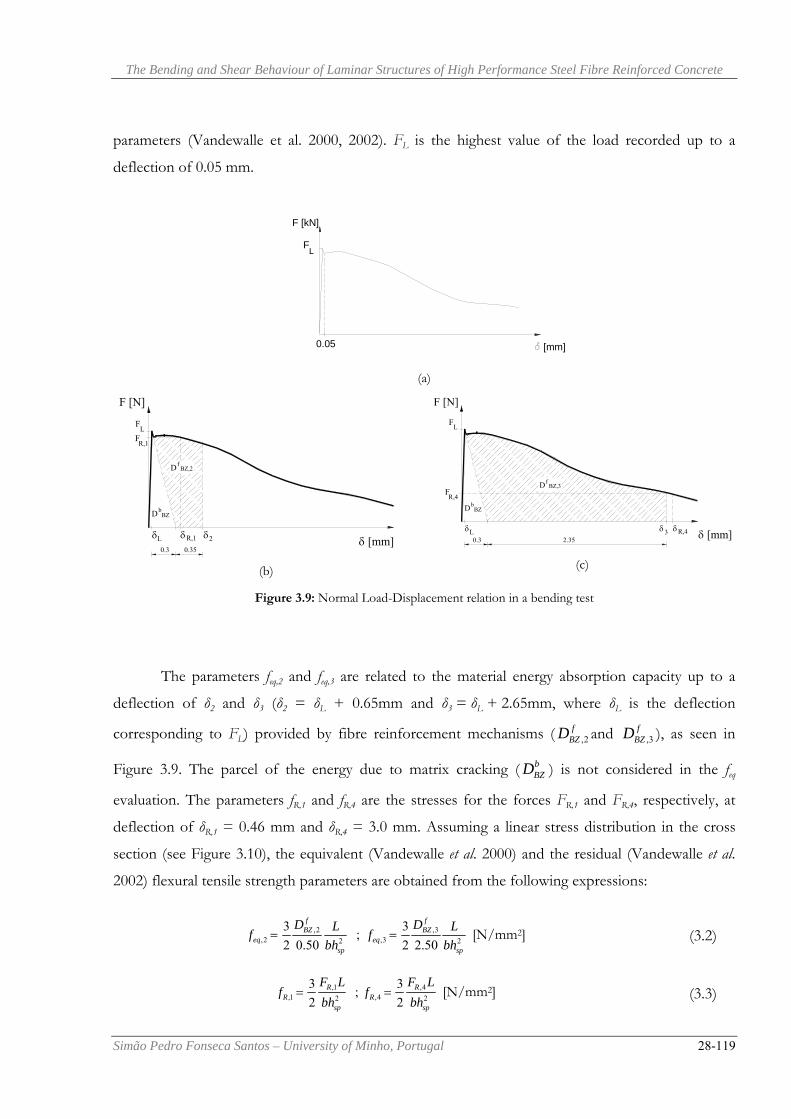
The Bending and Shear Behaviour of Laminar Structures of High Performance Steel Fibre Reinforced Concrete
Simão Pedro Fonseca Santos – University of Minho, Portugal 28-119
parameters (Vandewalle et al. 2000, 2002). FL is the highest value of the load recorded up to a
deflection of 0.05 mm.
0.05
F [kN]
LF
[mm]
(a)
0.35
F [N]
LF
δ [mm]0.3
Lδ
BZbD
δ2
FR,1
R,1δ
BZ,2fD
(b)
F [N]
2.35L
0.3δ
δ [mm]δ3
R,4F
δR,4
FL
DbBZ
fBZ,3D
(c)
Figure 3.9: Normal Load-Displacement relation in a bending test
The parameters feq,2 and feq,3 are related to the material energy absorption capacity up to a
deflection of δ2 and δ3 (δ2 = δL + 0.65mm and δ3 = δL + 2.65mm, where δL is the deflection
corresponding to FL) provided by fibre reinforcement mechanisms ( ,2f
BZD and ,3f
BZD ), as seen in
Figure 3.9. The parcel of the energy due to matrix cracking ( bBZD ) is not considered in the feq
evaluation. The parameters fR,1 and fR,4 are the stresses for the forces FR,1 and FR,4, respectively, at
deflection of δR,1 = 0.46 mm and δR,4 = 3.0 mm. Assuming a linear stress distribution in the cross
section (see Figure 3.10), the equivalent (Vandewalle et al. 2000) and the residual (Vandewalle et al.
2002) flexural tensile strength parameters are obtained from the following expressions:
,2 ,3,2 ,32 2
3 3 ; 2 0.50 2 2.50
f fBZ BZ
eq eqsp sp
D DL Lf fbh bh
= = [N/mm2] (3.2)
,1 ,4
,1 ,42 2
3 3 ; 2 2
R RR R
sp sp
F L F Lf f
bh bh= = [N/mm2] (3.3)

The Bending and Shear Behaviour of Laminar Structures of High Performance Steel Fibre Reinforced Concrete
Simão Pedro Fonseca Santos – University of Minho, Portugal 29-119
where b (=150 mm) and L (=500 mm) are the width and the span of the specimen, and hsp (=125
mm) is the distance between the tip of the notch and the top of the cross section.
The tensile stress at the limit of proportionality, ffct,fl, is obtained from the following expression:
2, 23
sp
Lftfct h
Lb
Ff = (3.4)
Figure 3.10: Assumed stress distribution in the beam cross section
The parameters feq,2 and fR,1 are used on the design at serviceability limit states, while feq,3 and
fR,4 are used on the design at ultimate limit states (Vandewalle et al. 2000).
3.4.2.1.1 Results
The force-deflection curves, F-δ, obtained in the tested series are depicted in Figure 3.11. Each
curve is the average of the F-δ relationship recorded in three specimens. The influence of the
SFRSCC age in the force corresponding to the limit of proportionality, FL, is graphically represented
in Figure 3.12. As shown in this figure, FL increased with the SFRSCC age, but this increase became
marginal after 7 days.
Just after deflection at midspan value reach δL, a load decay occurred with an amplitude that
increased with the SFRSCC age (see Figure 3.11), since a higher load should be sustained by the
fibres bridging mechanism at the specimen’s fracture surface. This load decay was followed by a

The Bending and Shear Behaviour of Laminar Structures of High Performance Steel Fibre Reinforced Concrete
Simão Pedro Fonseca Santos – University of Minho, Portugal 30-119
hardening phase up to a deflection level that has decreased with the SFRSCC age. Except for
specimens of 28 days, the maximum load was larger than FL. Apart series of 12 hours, in the
remaining series, the hardening phase was followed by a softening branch. The decrease of residual
strength in the softening branch was much more significant in series of specimens with 28 days. The
larger amplitude of load decay just after reaching δL in these series would have adversely affected the
fibre-concrete bond properties and the fibre anchorage efficacy, leading to a decrease in the force
necessary to pullout the fibres crossing the specimen fracture surface. As a result, the equivalent (feq)
and the residual (fR) flexural tensile strength parameters have only decreased between 7 and 28 days,
as seen in Figure 3.13. This decrease was more pronounced in the fR,4 since this parameter is directly
dependent on the shape of the force-deflection curve, and is evaluated for a deflection of 3.0 mm.
As feq,2 and fR,1 had similar variation with the age, this means that, for low values of deflection (δ2 and
δR,1), the energy and the force based concepts provide identical results.
12 hours
24 hours3 days
7 days28 days
0
2
4
6
8
10
12
14
16
18
20
0 0.5 1 1.5 2 2.5 3 3.5Deflection (mm)
Forc
e (k
N)
Figure 3.11: Load-deflection curves for SFRSCC of different ages
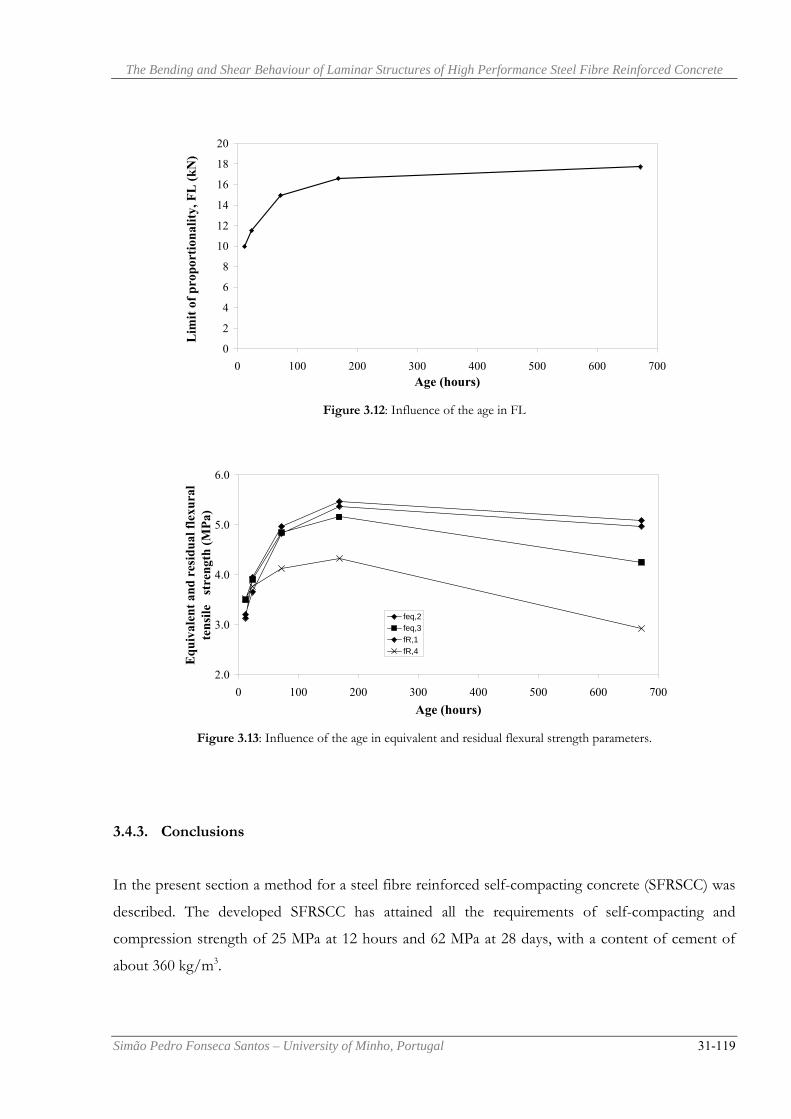
The Bending and Shear Behaviour of Laminar Structures of High Performance Steel Fibre Reinforced Concrete
Simão Pedro Fonseca Santos – University of Minho, Portugal 31-119
0
2
4
6
8
10
12
14
16
18
20
0 100 200 300 400 500 600 700Age (hours)
Lim
it of
pro
port
iona
lity,
FL
(kN
)
Figure 3.12: Influence of the age in FL
2.0
3.0
4.0
5.0
6.0
0 100 200 300 400 500 600 700Age (hours)
Equ
ival
ent a
nd r
esid
ual f
lexu
ral
tens
ile
stre
ngth
(MPa
)
feq,2feq,3fR,1fR,4
Figure 3.13: Influence of the age in equivalent and residual flexural strength parameters.
3.4.3. Conclusions
In the present section a method for a steel fibre reinforced self-compacting concrete (SFRSCC) was
described. The developed SFRSCC has attained all the requirements of self-compacting and
compression strength of 25 MPa at 12 hours and 62 MPa at 28 days, with a content of cement of
about 360 kg/m3.

The Bending and Shear Behaviour of Laminar Structures of High Performance Steel Fibre Reinforced Concrete
Simão Pedro Fonseca Santos – University of Minho, Portugal 32-119
The strength and ductility levels required by precasting industry for the application in which
the designed SFRSCC will be used, were exceeded.
The obtained F δ− relationships show that, to maintain the post-cracking residual force up
to a deflection of 3 mm, a higher content of steel fibres should be used (45 kg/m3 seems to be an
adequate fibre content for this purpose). The influence of the SFRSCC age on the σi, wi values
defining the wσ − diagram was analyzed, as well as, on the corresponding fracture energy. A
correspondence between the σi values of the wσ − diagram and the equivalent and residual flexural
tensile strength parameters (feq and fR, respectively) proposed by RILEM TC 162-TDF was obtained
in order to check the applicability of the post-cracking diagram proposed by this committee for the
design of SFRC. A good correlation was obtained between the σi and feq but the constants of this
correlation were not equal to those recommended by RILEM TC 162-TDF for the current SFRC.
3.5. Development of a composition of SFRSCC with 45kg/m3 of steel fibres
As concluded in the previous point, to maintain the post-cracking residual force up to a deflection
of 3 mm, a higher content of steel fibres should be used. So, a new research program was carried out
to assess the behaviour of a SFRSCC with 45 kg/m3, a dosage that, as already indicated, seems to be
appropriate from the structural point of view and does not increase too much the final cost of
concrete.
From now on, the analysis will be made comparing the behaviour of the specimens made
with both compositions, in order to turn the comparison easier, since SFRSCC with 30 kg/m3 (from
now on called simply SFRSCC_30) will serve of reference.
The materials used in the experimental program for the development of SCC reinforced with
45 kg/m3 of steel fibres (SRFSCC_45 from now on) were the same of SFRSCC_30. The SFRSCC
conception method was the one described in Section 3.2. However, since a higher content of fibres
is now adopted, the solid skeleton composition (aggregates) should be redesigned to avoid an
increase of void content in the solid skeleton structure. The solid skeleton composition was
evaluated according to the procedures followed for SRFSCC_30. The final composition of the solid
skeleton for SRFSCC_45 was (in percentage of volume): 46.75% of coarse sand, 38.25% of crushed
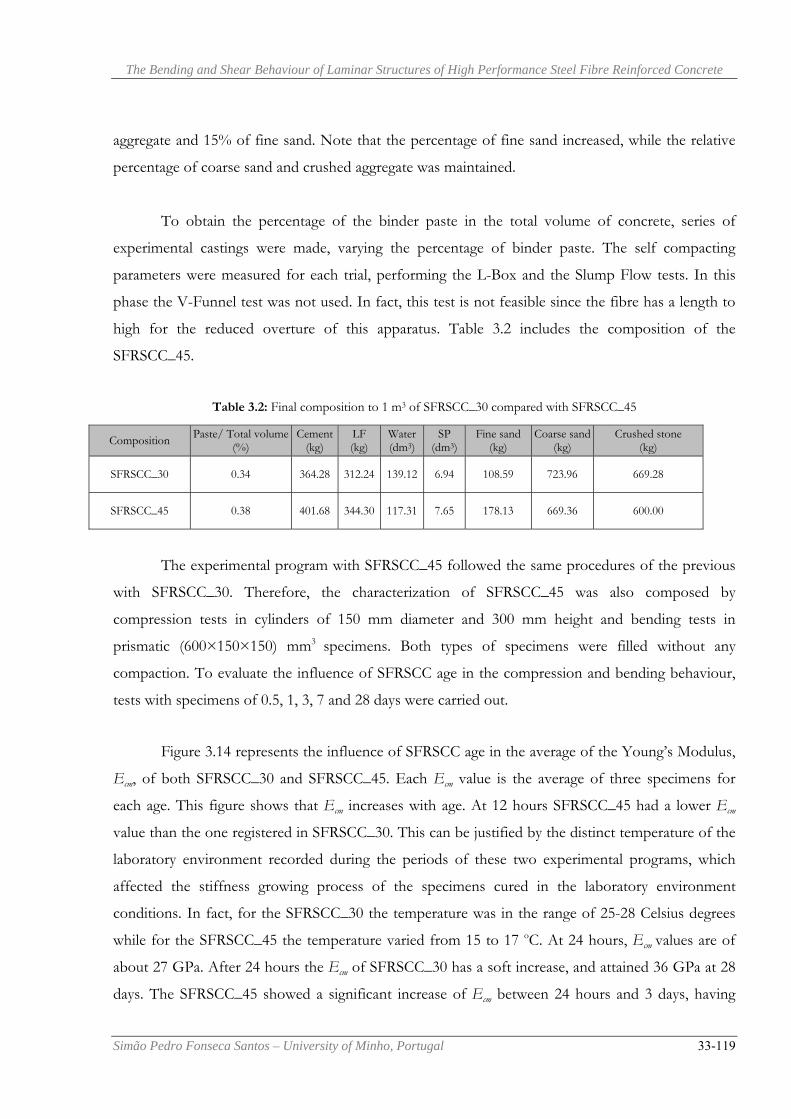
The Bending and Shear Behaviour of Laminar Structures of High Performance Steel Fibre Reinforced Concrete
Simão Pedro Fonseca Santos – University of Minho, Portugal 33-119
aggregate and 15% of fine sand. Note that the percentage of fine sand increased, while the relative
percentage of coarse sand and crushed aggregate was maintained.
To obtain the percentage of the binder paste in the total volume of concrete, series of
experimental castings were made, varying the percentage of binder paste. The self compacting
parameters were measured for each trial, performing the L-Box and the Slump Flow tests. In this
phase the V-Funnel test was not used. In fact, this test is not feasible since the fibre has a length to
high for the reduced overture of this apparatus. Table 3.2 includes the composition of the
SFRSCC_45.
Table 3.2: Final composition to 1 m3 of SFRSCC_30 compared with SFRSCC_45
The experimental program with SFRSCC_45 followed the same procedures of the previous
with SFRSCC_30. Therefore, the characterization of SFRSCC_45 was also composed by
compression tests in cylinders of 150 mm diameter and 300 mm height and bending tests in
prismatic (600×150×150) mm3 specimens. Both types of specimens were filled without any
compaction. To evaluate the influence of SFRSCC age in the compression and bending behaviour,
tests with specimens of 0.5, 1, 3, 7 and 28 days were carried out.
Figure 3.14 represents the influence of SFRSCC age in the average of the Young’s Modulus,
Ecm, of both SFRSCC_30 and SFRSCC_45. Each Ecm value is the average of three specimens for
each age. This figure shows that Ecm increases with age. At 12 hours SFRSCC_45 had a lower Ecm
value than the one registered in SFRSCC_30. This can be justified by the distinct temperature of the
laboratory environment recorded during the periods of these two experimental programs, which
affected the stiffness growing process of the specimens cured in the laboratory environment
conditions. In fact, for the SFRSCC_30 the temperature was in the range of 25-28 Celsius degrees
while for the SFRSCC_45 the temperature varied from 15 to 17 oC. At 24 hours, Ecm values are of
about 27 GPa. After 24 hours the Ecm of SFRSCC_30 has a soft increase, and attained 36 GPa at 28
days. The SFRSCC_45 showed a significant increase of Ecm between 24 hours and 3 days, having
Composition Paste/ Total volume (%)
Cement (kg)
LF (kg)
Water (dm3)
SP (dm3)
Fine sand (kg)
Coarse sand (kg)
Crushed stone (kg)
SFRSCC_30 0.34 364.28 312.24 139.12 6.94 108.59 723.96 669.28
SFRSCC_45 0.38 401.68 344.30 117.31 7.65 178.13 669.36 600.00

The Bending and Shear Behaviour of Laminar Structures of High Performance Steel Fibre Reinforced Concrete
Simão Pedro Fonseca Santos – University of Minho, Portugal 34-119
reached 38 GPa at 3 days. After this age, the Ecm of SFRSCC_45 increased smoothly, having attained
40 GPa at 28 days.
10
15
20
25
30
35
40
45
0 5 10 15 20 25 30
Age (days)
Ecm
(GPa
)
SFRSCC_30
SFRSCC_45
Figure 3.14: Variation of Ecm with age
The stress-strain (σc-εc) curves obtained for SFRSCC_30 (thinner lines) and SFRSCC_45
(thicker lines) are depicted in Figure 3.15. Apart the ages of 12 h and 24 h, in the remaining testing
ages, the compressive strength and the post-peak energy absorption capacity of SFRSCC_45 were
larger than the values obtained in the SFRSCC_30. The exceptions are justified by the
aforementioned distinct laboratory environmental conditions when the two experimental programs
were carried out.

The Bending and Shear Behaviour of Laminar Structures of High Performance Steel Fibre Reinforced Concrete
Simão Pedro Fonseca Santos – University of Minho, Portugal 35-119
0
10
20
30
40
50
60
70
0 2 4 6 8 10Strain (‰)
Stre
ss (M
Pa)
12h_SFRSCC_45
12h_SFRSCC_30
24h_SFRSCC_45
24h_SFRSCC_30
7d_SFRSCC_30
7d_SFRSCC_45
3d_SFRSCC_30
3d_SFRSCC_45
28d_SFRSCC_30
28d_SFRSCC_45
Figure 3.15: Influence of the age on the stress-strain response of SFRSCC_30 and SFRSCC_45
Figure 3.16 represents the influence of SFRSCC age in the values of the average compressive
strength, fcm. Due to the reasons already mentioned, at 12 hours the SFRSCC_45 had an unexpected
low fcm value. At 24 hours, however, the fcm exceeded the required value of compressive strength
(20 MPa). At 28 days, the fcm of SFRSCC_45 was 66 MPa, while SFRSCC_30 presented a value of
62 MPa.
10
20
30
40
50
60
70
0 5 10 15 20 25 30Age (hours)
fcm
(MPa
)
SFRSCC_30
SFRSCC_45
Figure 3.16: Influence of the age on the fcm of SFRSCC_30 and SFRSCC_45

The Bending and Shear Behaviour of Laminar Structures of High Performance Steel Fibre Reinforced Concrete
Simão Pedro Fonseca Santos – University of Minho, Portugal 36-119
Figure 3.17 shows the typical failure mode occurred in the compression tests, where the
confinement provided by the fibres is well evidenced, as well as a good fibre distribution into the
concrete.
Figure 3.17: Typical failure mode of compression tests
Figure 3.18 represents the load-deflection curves obtained in SFRSCC_45 specimens
of different ages. Figure 3.19 shows the influence of the age in FL, for both SFRSCC_30 and
SFRSCC_45. As expected, apart for 12 hours, due to the reasons already exposed, the
differences in the FL values are not significant, since FL concept intends to represent the
crack initiation of the matrix, which is not too influenced by the presence of the fibres.
Analyzing figures 3.11 and 3.18 it is verified that the difference between the maximum force
and FL is much more pronounced in the SFRSCC_45 than in SFRSCC_30, due to the higher
fibre content of the former one.

The Bending and Shear Behaviour of Laminar Structures of High Performance Steel Fibre Reinforced Concrete
Simão Pedro Fonseca Santos – University of Minho, Portugal 37-119
0
5
10
15
20
25
30
0.0 0.5 1.0 1.5 2.0 2.5 3.0 3.5
Deflection (mm)
Forc
e (k
N)
12 hours
24 hours
72 hours
168 hours
672 hours
Figure 3.18: Load-displacement curves of SFRSCC_45 specimens of different ages
4
6
8
10
12
14
16
18
20
0 100 200 300 400 500 600 700Age (hours)
Lim
it of
pro
port
iona
lity,
FL
(kN
)
SFRSCC_30
SFRSCC_45
Figure 3.19: Influence of SFRSCC age in FL
Figures 3.20 and 3.21 represent the influence of age in the equivalent and residual flexural
strength parameters. As it was expected, the values of these parameters for the SFRSCC_45 are
always greater than the values for the SFRSCC_30, except at 12 hours due to the reasons already
pointed out. Figure 3.20 show that, the high feq values attained in the SFRSCC_45 at 7 days, were
maintained up to 28 days, do not having been affected by the influence of the increase of the
strength of the material between this two ages, which indicates that 45 kg/m3 of fibres is an adjusted
amount for this purpose.

The Bending and Shear Behaviour of Laminar Structures of High Performance Steel Fibre Reinforced Concrete
Simão Pedro Fonseca Santos – University of Minho, Portugal 38-119
2
3
4
5
6
7
8
9
0 100 200 300 400 500 600 700Age (hours)
fR,1
(Mpa
)
SFRSCC_30
SFRSCC_45
2
3
4
5
6
7
8
9
0 100 200 300 400 500 600 700Age (hours)
fR,4
(Mpa
)
SFRSCC_30
SFRSCC_45
Figure 3.20: Influence of SFRSCC age in fR,1 and fR,4

The Bending and Shear Behaviour of Laminar Structures of High Performance Steel Fibre Reinforced Concrete
Simão Pedro Fonseca Santos – University of Minho, Portugal 39-119
2
3
4
5
6
7
8
9
0 100 200 300 400 500 600 700Age (hours)
feq
,2 (M
Pa)
SFRSCC_30
SFRSCC_45
2
3
4
5
6
7
8
9
0 100 200 300 400 500 600 700Age (hours)
feq
,3 (M
Pa)
SFRSCC_30
SFRSCC_45
Figure 3.21: Influence of the SFRSCC age in feq,2 and feq,3
Although the fcm values of SFRSCC_45 of 12 h and 24 h were inferior to the ones registered
in SFRSCC_30 the values of fcm obtained for the other ages exceeded those of SFRSCC_30. At 28
days, SFRSCC_45 attained an average compressive strength of 66 MPa, with a cement content of
about 400 Kg/m3.
The SFRSCC_45 flexural behaviour, evaluated from three point bending notched beam tests
carried out according to the RILEM TC 162-TDF recommendations, was significantly more ductile
than the behaviour of SFRSCC_30. These tests showed that an amount of 45kg/m3 of fibres is
capable of maintaining feq values grater than 7.5 MPa when the strength of the material is almost
attained.
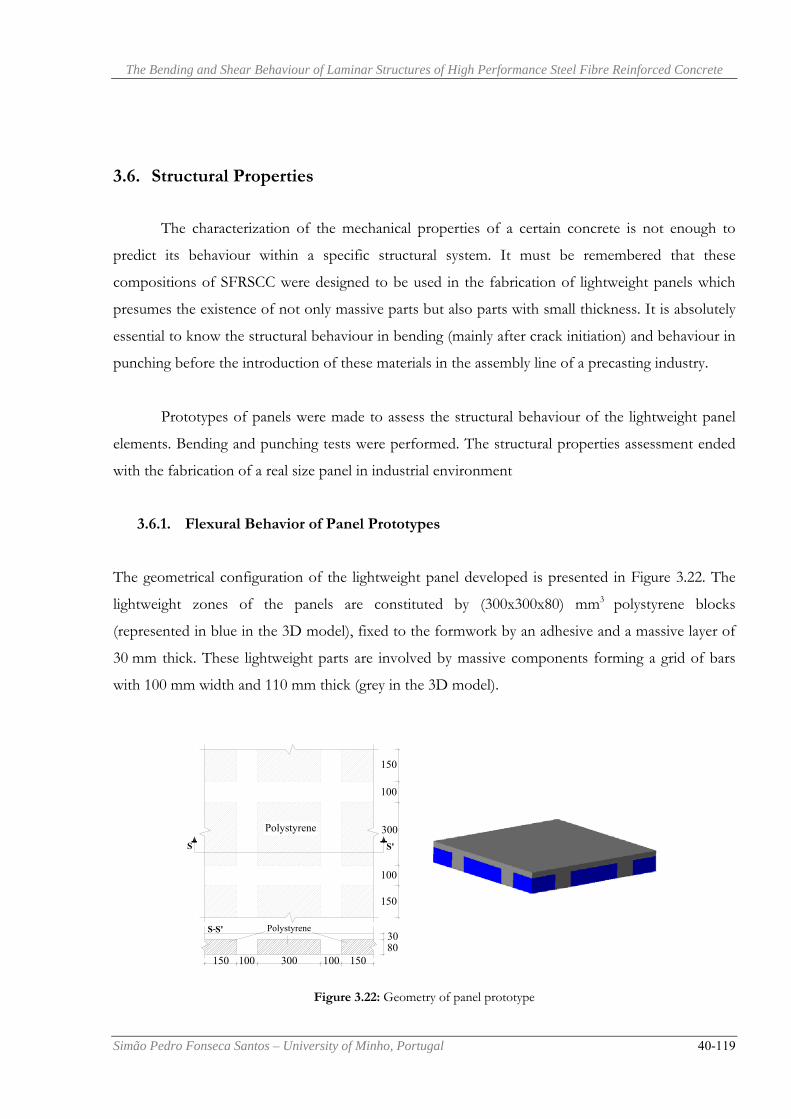
The Bending and Shear Behaviour of Laminar Structures of High Performance Steel Fibre Reinforced Concrete
Simão Pedro Fonseca Santos – University of Minho, Portugal 40-119
3.6. Structural Properties
The characterization of the mechanical properties of a certain concrete is not enough to
predict its behaviour within a specific structural system. It must be remembered that these
compositions of SFRSCC were designed to be used in the fabrication of lightweight panels which
presumes the existence of not only massive parts but also parts with small thickness. It is absolutely
essential to know the structural behaviour in bending (mainly after crack initiation) and behaviour in
punching before the introduction of these materials in the assembly line of a precasting industry.
Prototypes of panels were made to assess the structural behaviour of the lightweight panel
elements. Bending and punching tests were performed. The structural properties assessment ended
with the fabrication of a real size panel in industrial environment
3.6.1. Flexural Behavior of Panel Prototypes
The geometrical configuration of the lightweight panel developed is presented in Figure 3.22. The
lightweight zones of the panels are constituted by (300x300x80) mm3 polystyrene blocks
(represented in blue in the 3D model), fixed to the formwork by an adhesive and a massive layer of
30 mm thick. These lightweight parts are involved by massive components forming a grid of bars
with 100 mm width and 110 mm thick (grey in the 3D model).
150
Polystyrene
S S'
S'S-
100 300 100 150
150
100
300
100
150
30 80
Polystyrene
Figure 3.22: Geometry of panel prototype

The Bending and Shear Behaviour of Laminar Structures of High Performance Steel Fibre Reinforced Concrete
Simão Pedro Fonseca Santos – University of Minho, Portugal 41-119
Panels were filled with the SFRSCC compositions supra defined. The concrete was
discharged in the center of the formwork, spreading only by its own weight, due to its self-
compacting characteristics (see Figures 3.23 to 3.26).
Figure 3.23: Metallic formwork to build the panel and disposition of the lightweight elements Figure 3.24: Formwork detail
Figure 3.25: Filling the panel Figure 3.26: Panel after have been cast
The experimental program was composed of bending and punching tests in square panels of
size edge of 1000 mm and 600 mm, respectively. Both panel series had a thickness of 110 mm. The
demoulding of these panels was done 24 hours after the casting process, and the tests were carried
out at 7 days.
The test setup of the bending tests with panel prototypes is schematically described in
Figures 3.27 to 3.30. The panel has eight supports, each one composed of two square steel plates of
100 mm edge and 10 mm thick, with a steel sphere of 20 mm diameter between these plates (see
Figures 3.27 and 3.28). These supports only avoid displacements in the direction orthogonal to the

The Bending and Shear Behaviour of Laminar Structures of High Performance Steel Fibre Reinforced Concrete
Simão Pedro Fonseca Santos – University of Minho, Portugal 42-119
plane of the panel. The load is applied in four points, using devices similar to those for the supports
(see Figure 3.29). A special device was built to transfer the load from the actuator up to these points,
which can accommodate the deformation of the panel without introducing parasitic force
components in the panel. Four LVDTs were used to measure the deflection of the points at the
panel bottom surface, in the alignment of the point loads (see Figure 3.30).
A servo-controlled equipment of 500 kN of maximum load capacity was used. The test was
controlled by the displacement transducer of the actuator, at a displacement ratio of 5 µm/s. Figure
3.31 shows a panel prototype being tested in bending.
Figure 3.27: Test setup
Support detail
Figure 3.28: Supports of the panel prototype
Figure 3.29: Position of the loading points
Figure 3.30: Position of the LVDTs to measure the panel deflection
Loaded areas

The Bending and Shear Behaviour of Laminar Structures of High Performance Steel Fibre Reinforced Concrete
Simão Pedro Fonseca Santos – University of Minho, Portugal 43-119
Figure 3.31: Panel prototype being tested in bending
The load-displacement relation recorded in the four LVDTs is represented in Figures 3.32
and 3.33. For both panels the cracking phase starts for a load of about 40 kN. In SFRSCC_30 the
load increased until 55 kN, followed by a softening phase. In SRFSCC_45 the increase of the load
carrying capacity after crack initiation was much more significant, once a load level of 100 kN was
exceeded. Both SFRSCC_30 and SFRSCC_45 panels showed a high residual strength capacity at the
post-peak phase. This can only be justified by the reinforcement mechanisms of the fibres bridging
the cracks.
0
10
20
30
40
50
60
0 5 10 15 20 25 30 35 40 45
Displacement (mm)
Forc
e (k
N)
Figure 3.32: Load-deflection curve for each LVDTs of the SFRSCC_30 panel
0
20
40
60
80
100
120
0 5 10 15 20 25 30 35 40Displacement(mm)
Loa
d(kN
)
Figure 3.33: Load-deflection curve for each LVDTs of the SFRSCC_45 panel
The typical crack patterns of the tested panels are shown in Figures 3.34 and 3.35. A
tendency for a localization of the fracture surfaces near the nodes of the grid can be visualized, due
to a stress concentration in these zones.

The Bending and Shear Behaviour of Laminar Structures of High Performance Steel Fibre Reinforced Concrete
Simão Pedro Fonseca Santos – University of Minho, Portugal 44-119
Figure 3.34: Crack pattern in SFRSCC_30, at the end of the bending test
Figure 3.35: Crack pattern in SFRSCC_45, at the end of the bending test
3.6.2. Punching behaviour of panel prototypes
To assess the punching resistance of the lightweight parts of the SFRSCC panels, the panel modules
were tested under the load configuration represented in Figure 3.36
a) b)
Figure 3.36: Punching test apparatus: a) General view representation; b) Detail view of the real test
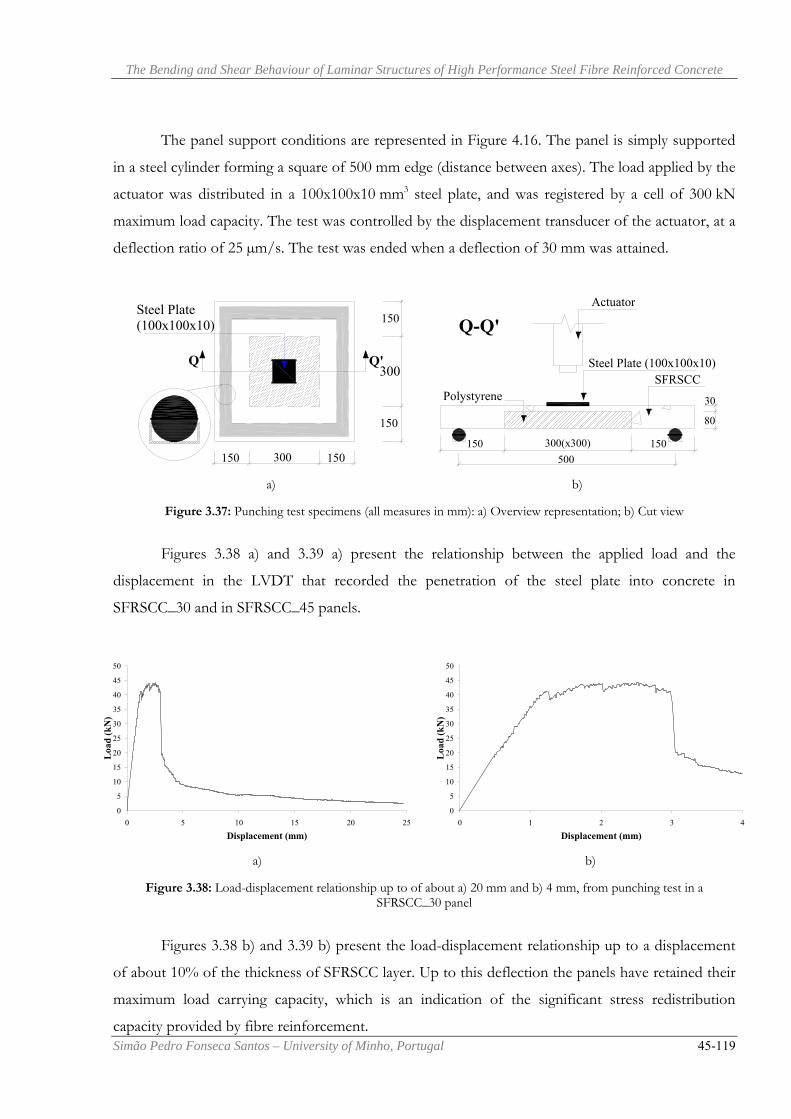
The Bending and Shear Behaviour of Laminar Structures of High Performance Steel Fibre Reinforced Concrete
Simão Pedro Fonseca Santos – University of Minho, Portugal 45-119
The panel support conditions are represented in Figure 4.16. The panel is simply supported
in a steel cylinder forming a square of 500 mm edge (distance between axes). The load applied by the
actuator was distributed in a 100x100x10 mm3 steel plate, and was registered by a cell of 300 kN
maximum load capacity. The test was controlled by the displacement transducer of the actuator, at a
deflection ratio of 25 µm/s. The test was ended when a deflection of 30 mm was attained.
150 150
150
150
300
300
Steel Plate(100x100x10)
Q Q'
SFRSCCSteel Plate (100x100x10)
Actuator
150 150300(x300)
80
30
Q-Q'
Polystyrene
500
a) b)
Figure 3.37: Punching test specimens (all measures in mm): a) Overview representation; b) Cut view
Figures 3.38 a) and 3.39 a) present the relationship between the applied load and the
displacement in the LVDT that recorded the penetration of the steel plate into concrete in
SFRSCC_30 and in SFRSCC_45 panels.
0
5
10
15
20
25
30
35
40
45
50
0 5 10 15 20 25
Displacement (mm)
Loa
d (k
N)
0
5
10
15
20
25
30
35
40
45
50
0 1 2 3 4
Displacement (mm)
Loa
d (k
N)
a) b)
Figure 3.38: Load-displacement relationship up to of about a) 20 mm and b) 4 mm, from punching test in a SFRSCC_30 panel
Figures 3.38 b) and 3.39 b) present the load-displacement relationship up to a displacement
of about 10% of the thickness of SFRSCC layer. Up to this deflection the panels have retained their
maximum load carrying capacity, which is an indication of the significant stress redistribution
capacity provided by fibre reinforcement.

The Bending and Shear Behaviour of Laminar Structures of High Performance Steel Fibre Reinforced Concrete
Simão Pedro Fonseca Santos – University of Minho, Portugal 46-119
0
10
20
30
40
50
60
70
0 5 10 15 20Displacement(mm)
Loa
d(kN
)
0
10
20
30
40
50
60
70
0 1 2 3 4Displacement(mm)
Loa
d(kN
)
a) b)
Figure 3.39: Load-displacement relationship up to of about a) 20 mm and b) 4 mm, from punching test in a SFRSCC_45 panel
Figure 3.40 a) shows the typical crack pattern of panels after have been tested. The punching
critical contour involves the loaded area at a distance of approximately d/2, where d is the layer
thickness. Due to the resistance provided by fibres bridging the punching failure surface (composed
by planes at about 45 degrees - see Figure 3.40 b)), the resistant negative bending moment of the
SFRSCC layer was exceeded, leading to the development of a yield line, which is in a middle distance
between the punching critical contour and the boundaries of the lightweight part.
a) b)
Figure 3.40: a) Punching critical contour and yield line due to negative moments (exterior contour); b) Failure surface in a punching test
Bending tests carried out with panel prototypes of the developed SFRSCC showed that the
panel structural configuration and the ductility provided by fibre reinforcement allowed high stress
redistribution levels, since the maximum load carrying capacity (Fmax) was much higher that the load

The Bending and Shear Behaviour of Laminar Structures of High Performance Steel Fibre Reinforced Concrete
Simão Pedro Fonseca Santos – University of Minho, Portugal 47-119
at crack initiation (Fcr). The load increment, Fmax-Fcr, increased with the content of fibres. After peak
load, the panels presented a significant residual load carrying capacity, even at a crack opening
several times higher the crack opening limit imposed by the serviceability limit state analysis.
The developed SFRSCC was also very efficient in terms of punching resistance, once the
panel maximum load was maintained up to a plate penetration of about 10% of the thickness of
SFRSCC layer (30 mm) of the panel lightweight zone.

The Bending and Shear Behaviour of Laminar Structures of High Performance Steel Fibre Reinforced Concrete
Simão Pedro Fonseca Santos – University of Minho, Portugal 48-119
3.7. Manufacture and testing a real scale façade panel
With the tests carried out in prototypes of precast façade panels, all the requirements made to these
elements were quite exceed. But the rigorous proceedings taken in the laboratory permit a great
domain of all the quality control items, which conduces to elements with perfect finishing,
compositions without segregation or other problems related with deficient management of materials.
Usually, the SCC compositions are very sensitive to little variations on its components; when a
significant dosage of steel fibres is used, self compacting requirements are much difficult to assure.
One of the most important items is, without any doubt, the water dosage: a little variation in
its right dosage can easily impede the reach of the Self-Compacting requirements or cause a severe
segregation and the refuse of the mixture. An obligatory proceeding in laboratory is the previous
evaluation of the water content in the aggregate, once they are, normally, exposed to the air. With a
well known water content of aggregate, the dosage of water remains perfectly defined, which allows
a great control on this item.
In a precasting industry the reality is quite different: the question of water saturation level is
the most difficult to control. Normally, the aggregates are stocked in outdoors, exposed to all the
weather circumstances. The water content is measured one or two times per day (one in the morning
and other by the lunch time, starting the afternoon). Some ready concrete mixers have a dispositive
to evaluate the water content; however, in general, it provides values with low accuracy, since its
precision is also low. Actually, the mixtures used in pre fabricated elements are developed and
prepared to be almost insensitive to water content: remember that, most of the times, the elements
are produced with ordinary concretes.
Therefore, there was the dimensional question. It is quite different to fill a 120 dm3 mould
and a 1000 dm3 mould. There was the extreme necessity to know the composition behaviour within
an industrial environment. From the beginning, there was the question of dosage of materials and
water, the measurement of SCC requisites, the transportation from the concrete mixer to the mould,
the filling capacity of the concrete in such a big mould, the final finishing of the elements and so on.

The Bending and Shear Behaviour of Laminar Structures of High Performance Steel Fibre Reinforced Concrete
Simão Pedro Fonseca Santos – University of Minho, Portugal 49-119
The only way to know all the previous aspects was to perform the construction of a real
panel in the real environment of a precasting industry.
Finished the characterization of the compression and flexural behaviour of the developed
SFRSCC, the next step of the research program was to assess the behaviour of SFRSCC panel
prototypes under load configurations that can simulate the possible failures modes of the real
application where the developed SFRSCC is intended to be used (façade panels). Therefore,
SFRSCC lightweight panel prototypes were fabricated and tested under load configurations that
produce flexural and punching failures modes. Flexural failures modes can occur due to wind loads.
Since the SFRSCC compression layer is only 30 mm thick in the lightweight parts of the panel,
punching can occur if point loads act in this part of the panel.
The present phase had the aim of verifying if the procedures adopted in the laboratory, in
the development of a SFRSCC, can be directly applicable in industrial environment. It had also the
purpose of evaluating the behaviour of a real panel when submitted to its dead weight and to an
increase live load up to its rupture.
The geometry of the fabricated panel is represented in Figure 3.41, which includes extra
information related to this panel.
4100
300
300
300
300
100
100
100
100
100
100
100
2200
150
150
100
100
100
100
100
100
100
100
100
100
100300 300 300 300 300 300 300 300 300 300
Figure 3.41: Panel Geometry (dimensions in mm)
Panel Characteristics Width (m) 2.100 Length (m) 4.200
Thickness (m) 0.110 Total Volume(m3) 0.882 Lightweight (m3) 0.360 Vol. to cast (m3) 0.522
Approximate weight (kg) 1305.0

The Bending and Shear Behaviour of Laminar Structures of High Performance Steel Fibre Reinforced Concrete
Simão Pedro Fonseca Santos – University of Minho, Portugal 50-119
The panel lightweight parts were materialized by 40 polystyrene plates of
(300×300×80) mm3 and 20 plates of (300×150×80) mm3 fixed to timber bars (see Figure 3.42). To
maintain this structure stable during the filling process, a very heavy concrete beam was placed
above this structure as can be seen in Figure 3.43.
Figure 3.42: Placing the lightweight elements
Figure 3.43: Heavy beam to assure stability of the
lightweight elements during concrete casting
Two mixtures of 400 dm3 were made to fabricate the panel and to fill three (600×150×150)
mm3 beams and three cylinders of 150 mm diameter and 300 mm height. Slump flow and L-box
tests were also carried out to assess the self-compacting characteristics of the designed SFRSCC
before the filling process. In order to know for how long these properties can be maintained, the
same tests were carried out after the filling process. Both concrete mixtures were stable without any
indication of segregation. The spread was 600 mm and 630 mm in the mixtures 1 and 2, respectively.
After the filling (just to the second composition, the spread was 580mm and the Cbl parameter of the
L-Box test was 0.80: these results prove that very stable compositions can be reached in industrial
environment, with the maintenance of self-compacting properties for a significant time (aprox. 20
minutes after the mixture). Figure 3.44 shows the concrete casting phase.
Figure 3.44: Casting operations of the panel
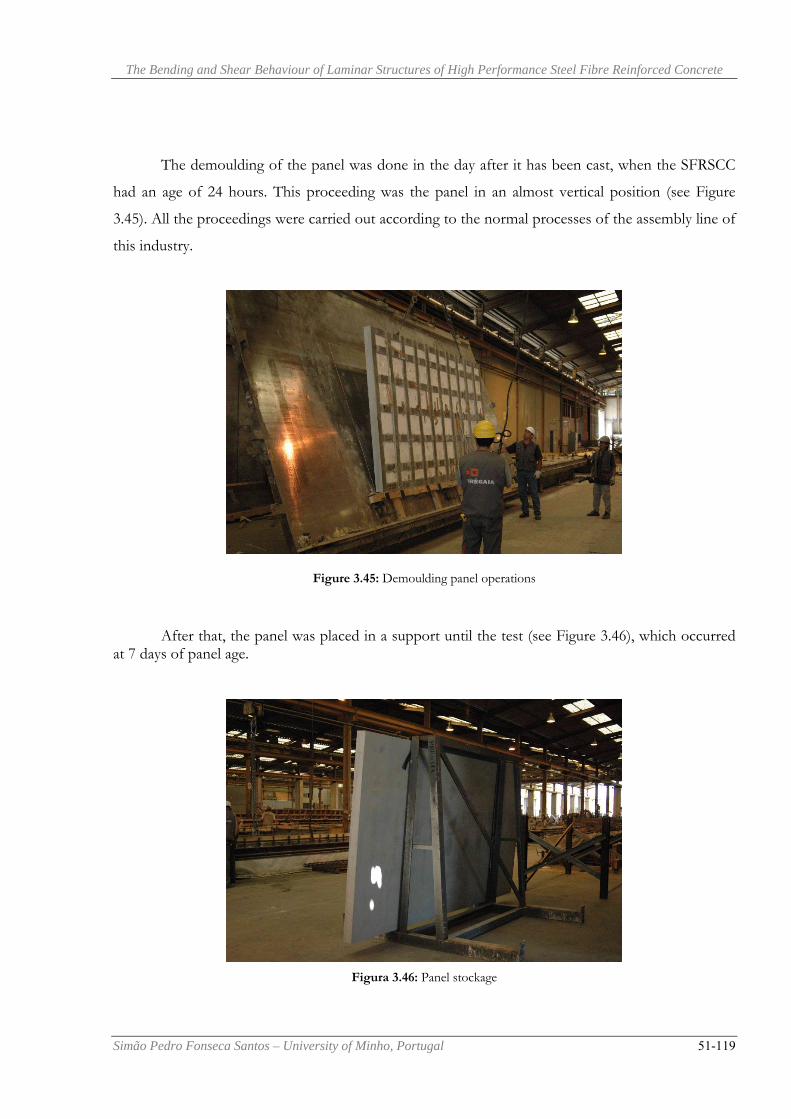
The Bending and Shear Behaviour of Laminar Structures of High Performance Steel Fibre Reinforced Concrete
Simão Pedro Fonseca Santos – University of Minho, Portugal 51-119
The demoulding of the panel was done in the day after it has been cast, when the SFRSCC
had an age of 24 hours. This proceeding was the panel in an almost vertical position (see Figure
3.45). All the proceedings were carried out according to the normal processes of the assembly line of
this industry.
Figure 3.45: Demoulding panel operations
After that, the panel was placed in a support until the test (see Figure 3.46), which occurred at 7 days of panel age.
Figura 3.46: Panel stockage

The Bending and Shear Behaviour of Laminar Structures of High Performance Steel Fibre Reinforced Concrete
Simão Pedro Fonseca Santos – University of Minho, Portugal 52-119
Figure 3.47 represents the panel support conditions and the location where the deflection
was measured (center of the panel). The panel was supported in four points, see Figure 5.8.
a)
30
80
1500
10
1300
P-P'
HEB 200 HEB 200HEB 200
b)
100
100
100
100
100
100
100
2200
Q-Q'30
80
1500
10
150 150300 300 300 300
HEB 200
c)
Figure 3.47: Setup of the loading test: a) general view; b) section P-P’; c) section Q-Q’(dimensions in mm)
A portable data acquisition system (see Figure 3.48), developed by FibreSensing Company,
was used to measure the panel deflection at its center (see Figure 3.49).

The Bending and Shear Behaviour of Laminar Structures of High Performance Steel Fibre Reinforced Concrete
Simão Pedro Fonseca Santos – University of Minho, Portugal 53-119
Figure 3.48: Data acquisition system Figure 3.49: LVDT for measuring the panel
deflection at its center
To simulate a uniform distributed live load, concrete plates of (500×500) mm2, each one
with 0.25 kN, were uniformly distributed in the area interior to the panel supports (see Figure 3.50).
Figure 3.50: Placing the concrete plates to simulate the panel live load
The panel supported 33 concrete plates (see Figure 3.51), corresponding to a uniform
distributed load of 8.25/(3.1×1.5)=1.77 kN/m2, plus its dead weight (1.47 kN/m2). When placing
the 33rd concrete plate, an abrupt increase of deflection occurred, having the test been interrupted
due to safety reasons.

The Bending and Shear Behaviour of Laminar Structures of High Performance Steel Fibre Reinforced Concrete
Simão Pedro Fonseca Santos – University of Minho, Portugal 54-119
Figure 3.51: Final view of the panel, loaded with 33 concrete plates
When the 18th concrete plate was placed, a deflection of 24 mm was measured. When the
test was interrupted, the deflection was about 44 mm and the maximum crack opening of the critical
crack was around 3 mm. Fibres crossing this crack were visible (see Figure 3.52).
Figure 3.52: Crack opening profile of the critical crack
The total resisted uniform distributed load (1.77+1.47=3.24 kN/m2) was higher than the
characteristic value to the wind dynamic pressure in building with more of 100 m height, located in
A zone and in zones of type II irregularity (RSA, 1983). It may be concluded that, for the majority of
the buildings, where façade panels are used, the developed SFRSCC_45 panel provides the necessary
structural safety.

The Bending and Shear Behaviour of Laminar Structures of High Performance Steel Fibre Reinforced Concrete
Simão Pedro Fonseca Santos – University of Minho, Portugal 55-119
3.8. Conclusions
A method for conceiving cost competitive steel fibre reinforced self-compacting concrete (SFRSCC)
was described. The designed SFRSCC has met all the requirements of self-compactability, and a
compressive strength of 25 MPa at 12 hours and 62 MPa at 28 days was reached, with a cement
content of about 360 kg/m3.
To assess the influence of the SFRSCC age on its compression and bending behaviour, an
experimental program was carried out, testing specimens at 1/2, 1, 3, 7 and 28 days. The strength
and ductility levels required by the precasting industry for the application in which the conceived
SFRSCC will be used were exceeded. Taking the force-deflection relationships ( F δ− ) obtained in
the three point bending tests with SFRSCC notched beams, and performing an inverse analysis with
a discrete crack model, a trilinear stress-crack opening diagram ( wσ − ) was obtained for the distinct
ages considered. The obtained F δ− relationships showed that, to avoid a softening phase up to a
deflection of 3 mm, a higher fibre content should be used.
The SFRSCC_45 flexural behaviour, evaluated from three point bending notched beam tests
carried out according to the RILEM TC 162-TDF recommendations, was significantly more ductile
than the behaviour of SFRSCC_30. These tests showed that 45kg/m3 of steel fibres are capable of
maintaining feq values grater than 7.5 MPa when the strength of the material is almost attained.
The influence of the SFRSCC age on the values of the σi, wi parameters that define the wσ −
diagram was analyzed. A correspondence between the σi values of the wσ − diagram and the
equivalent and residual flexural tensile strength parameters (feq and fR, respectively), proposed by
RILEM TC 162-TDF, was obtained in order to verify if the post-cracking diagram proposed by this
committee for the design of steel fibre reinforced concrete (SFRC) elements can be applied to the
designed SFRSCC. A strong correlation was obtained between σi and feq, but the constants of this
correlation were not equal to those recommended by RILEM TC 162-TDF for SFRC. New values
were proposed for the designed SFRSCC.
Panel prototypes simply supported on a redundant number of supports were tested up to an
average deflection of 30 mm. The maximum force was attained at a deflection of about 0.5 mm, and

The Bending and Shear Behaviour of Laminar Structures of High Performance Steel Fibre Reinforced Concrete
Simão Pedro Fonseca Santos – University of Minho, Portugal 56-119
was maintained up to a deflection of 5 mm, showing that the panel system has high ductility. Beyond
this deflection limit, the panel load carrying capacity decreased smoothly.
To assess the punching strength of the lightweight parts of the panel system, panel
prototypes were submitted to a punching failure load configuration. A punching crack was formed
at the contour of the steel loaded plate, followed by a flexural crack at the borders of the lightweight
zone. This second crack, caused by negative moments, was responsible for the quasi-plastic response
of the panels up to a penetration of the loaded plate of about 10% of the layer thickness.
The fabrication of the real panel permitted to assess the applicability of SFRSCC to
industrial production. It was very useful to verify the concrete behaviour in terms of self compacting
properties, what permits the adjusting of the necessary parameters to use this concrete in the
production line of precast industries. It was possible to verify the final aspect of panels, due to the
usage of a self compacting concrete: in fact the visual appearance was very satisfactory, although
some aspects can be improved. The load test was, willfully realized in the most unfavorable way:
note that these elements will be placed in vertical plane and not in horizontal plane as this test was
performed. The tested panel resisted to its own weight and to an overload of about 1.77 kN/m2.
This indicates that the developed panel is structurally effective to resist to the wind loading, which, is
the most unfavorable load case when the panel is placed in the façades of the buildings.

The Bending and Shear Behaviour of Laminar Structures of High Performance Steel Fibre Reinforced Concrete
Simão Pedro Fonseca Santos – University of Minho, Portugal 57-119
4. STEEL FIBRE REINFORCED SELF-COMPACTING
CONCRETE FAILING IN BENDING
4.1. Introduction
The inclusion of steel fibres in plain concrete is known to enhance not only the flexural and shear
strength of the resulting composite material but also its tensile strain capacity, toughness and
ductility (Swamy, 1975).
These inherent properties of steel fibre reinforced concrete can be utilized in concrete
structural members with conventional steel reinforcement. In flexure, the presence of fibres can
improve the cracking behaviour, and the load carrying capacity at serviceability and at ultimate limit
states of structural members (Swamy and Al-Ta’an, 1981).
As it was already exposed, the prefabrication industry is particularly interested in the
applications of Steel Fibre Reinforced Concrete (SFRC). Besides, in underground concrete
infrastructures, like pipes and box-culverts, fibre reinforcement is particularly opportune, due to
high stress redistribution these structures can experience, in result of the redundant supports
provided by surrounding soil. Here, steel fibres may be successfully adopted in the substitution, at
least partially, of the conventional reinforcement (rebar or welded mesh) to reduce labour and costs
(since the conventional reinforcement is placed manually) (Di Prisco and Plizzari, 2004).
Furthermore, when fibres substitute conventional reinforcement, the element thickness can
be reduced since the minimum concrete cover is no longer required. Recently, fibres have been used
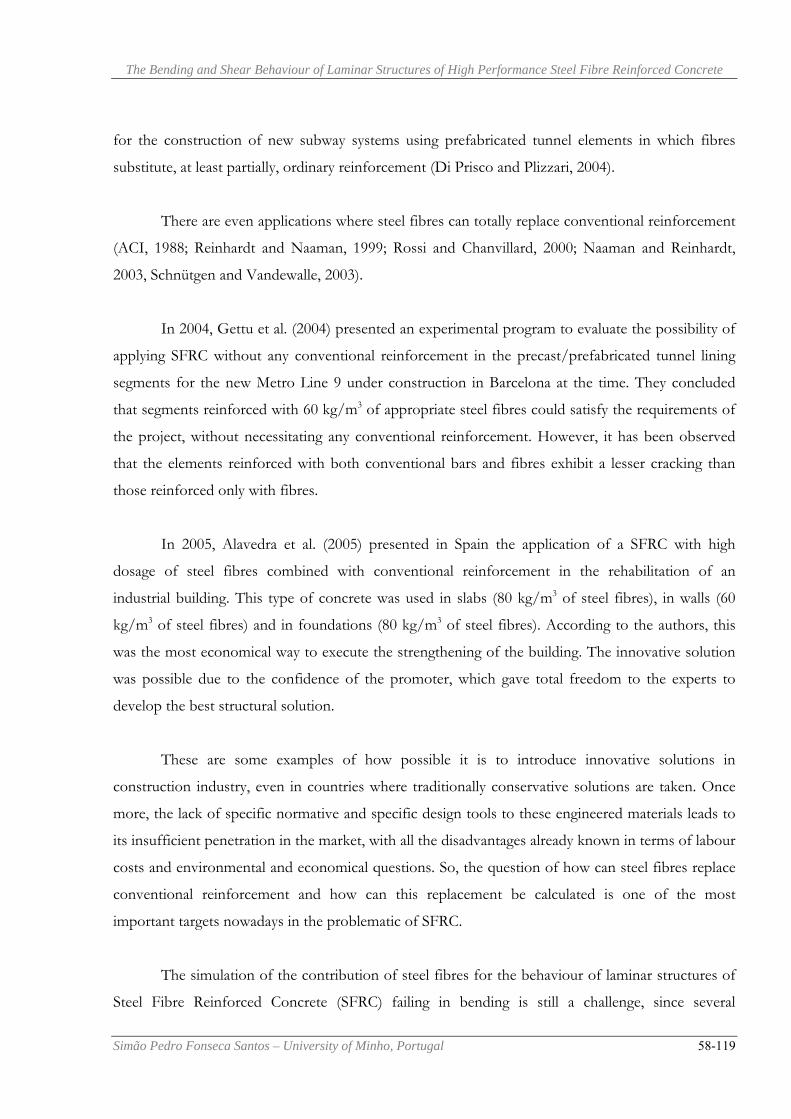
The Bending and Shear Behaviour of Laminar Structures of High Performance Steel Fibre Reinforced Concrete
Simão Pedro Fonseca Santos – University of Minho, Portugal 58-119
for the construction of new subway systems using prefabricated tunnel elements in which fibres
substitute, at least partially, ordinary reinforcement (Di Prisco and Plizzari, 2004).
There are even applications where steel fibres can totally replace conventional reinforcement
(ACI, 1988; Reinhardt and Naaman, 1999; Rossi and Chanvillard, 2000; Naaman and Reinhardt,
2003, Schnütgen and Vandewalle, 2003).
In 2004, Gettu et al. (2004) presented an experimental program to evaluate the possibility of
applying SFRC without any conventional reinforcement in the precast/prefabricated tunnel lining
segments for the new Metro Line 9 under construction in Barcelona at the time. They concluded
that segments reinforced with 60 kg/m3 of appropriate steel fibres could satisfy the requirements of
the project, without necessitating any conventional reinforcement. However, it has been observed
that the elements reinforced with both conventional bars and fibres exhibit a lesser cracking than
those reinforced only with fibres.
In 2005, Alavedra et al. (2005) presented in Spain the application of a SFRC with high
dosage of steel fibres combined with conventional reinforcement in the rehabilitation of an
industrial building. This type of concrete was used in slabs (80 kg/m3 of steel fibres), in walls (60
kg/m3 of steel fibres) and in foundations (80 kg/m3 of steel fibres). According to the authors, this
was the most economical way to execute the strengthening of the building. The innovative solution
was possible due to the confidence of the promoter, which gave total freedom to the experts to
develop the best structural solution.
These are some examples of how possible it is to introduce innovative solutions in
construction industry, even in countries where traditionally conservative solutions are taken. Once
more, the lack of specific normative and specific design tools to these engineered materials leads to
its insufficient penetration in the market, with all the disadvantages already known in terms of labour
costs and environmental and economical questions. So, the question of how can steel fibres replace
conventional reinforcement and how can this replacement be calculated is one of the most
important targets nowadays in the problematic of SFRC.
The simulation of the contribution of steel fibres for the behaviour of laminar structures of
Steel Fibre Reinforced Concrete (SFRC) failing in bending is still a challenge, since several

The Bending and Shear Behaviour of Laminar Structures of High Performance Steel Fibre Reinforced Concrete
Simão Pedro Fonseca Santos – University of Minho, Portugal 59-119
parameters influence this contribution, such as geometrical characteristics and material properties of
the fibres, concrete properties, method of SFRC application, geometry of the structure, etc. Due to
this fact, there are several approaches for modelling the fibres’ contribution, which, in a certain way,
does not contribute for a more extended use of this high performance material, even in certain
applications where its use would result in the already expressed technical and economic advantages.
The designers of reinforced concrete structures are still not well familiarized with SFRC and,
when they need to design a structure with this material, the most current question is the following:
what percentage of longitudinal tensile steel bars can a certain content of fibres replace? This
attitude results from the understanding that the simplest strategy for modelling the contribution of
fibres for the flexural resistance of laminar concrete structures is to convert fibres in a certain
percentage of a fictitious longitudinal conventional reinforcement. In the present work this strategy
is explored for steel fibre reinforced self-compacting concrete (SFRSCC) laminar structures.
Previous research showed that the addition of steel fibres is especially favourable in
structures with redundant number of supports, since the ultimate load carrying capacity of this type
of structures is much higher than the load corresponding to the concrete crack initiation (Barros and
Figueiras 1998, Falkner and Teutsch 1993).
In the ambit of the assessment of the potentialities of SFRSCC for structures with redundant
number of supports, an experimental program was carried out. In this type of structures, concrete
crack control is a mandatory requisite in its design and, due to the congestion of conventional
reinforcement in certain zones, its replacement for a certain content of steel fibres could be a
favourable option in terms of assuring good concrete casting. The obtained results were used, not
only to appraise the contribution of the steel fibres for the flexural behaviour of laminar structures,
but also to propose a simple strategy to convert a certain content of fibres in an equivalent fictitious
longitudinal reinforcement. The SFRSCC was developed for Box-Culvert structures in order to
assure the self-compacting requirements and the mechanical properties required by this
underground structure. To assess the real benefits provided by fibre reinforcement mechanisms for
this type of structures, the test set up should contemplate the possibility of simulating the stress
redistribution that occurs in structures of high number of supports, such is the case of Box-Culverts.
However, this type of tests is too expensive and valid indicators can be obtained from much simpler
tests like the four point bending test used in the present experimental program. Therefore, the
experimental program of the present work is composed of 12 slab strips reinforced with distinct

The Bending and Shear Behaviour of Laminar Structures of High Performance Steel Fibre Reinforced Concrete
Simão Pedro Fonseca Santos – University of Minho, Portugal 60-119
percentage of conventional longitudinal reinforcement and a constant content of hooked-end steel
fibres.
Previous research showed that fibre reinforcement efficacy is so high as more resistant is the micro-
structure of the fibre-matrix interface, as long as fibres do not suffer rupture (Gopalaratnam and Shah 1987).
For Box-Culverts structures the required level of resistance was achieved developing a SCC of high compacity
and reinforced with 45 kg/m3 of hooked end steel fibres of high aspect ratio (length/diameter) and high
tensile strength (Barros et al. 2006). This SCC composition was used on the manufacture of the slab strips
tested in the ambit of the present work.
4.2. Experimental program
4.2.1. Test series
The experimental program is composed of three series of slab strips. Each one has a shear span
(a = 450 mm) almost equal to 3.5 times the effective depth of the slab cross section (a/d ≈ 3.5), a
total length of 1600 mm, a distance between supports of 1350 mm and a cross section of
(350×150)mm2 (Figure 4.1). A distinct percentage of longitudinal reinforcement was adopted for
each series of slabs: 3φ6 ( slρ =0.2), 3φ8 ( slρ =0.36) and 3φ10 ( slρ =0.56), having been attributed the
designations of A, B and C for these series, respectively. In all tested slab strips, three steel rebars of
6 mm diameter were used in the top part of the cross section. Twelve slabs were tested: six of them
reinforced with steel fibres and six without steel fibres, which were used for comparison purposes.
150mm
1600mm
125mm 125mm450mm 450mm1350mm
F/2
Concrete
b=350mm
20m
m
22mm
3ø6mm
Asl
F/2
20m
m
Figure 4.1: Longitudinal and transversal cross sections of the tested slab strips

The Bending and Shear Behaviour of Laminar Structures of High Performance Steel Fibre Reinforced Concrete
Simão Pedro Fonseca Santos – University of Minho, Portugal 61-119
4.2.2. Mix compositions
The mix composition adopted for the manufacture of the SFRSCC was optimized for a solid
skeleton that includes 45 kg of the selected steel fibres per m3 of concrete. This mix composition was
obtained applying a design method that takes into account the strong perturbation effect produced
by steel fibres on the flowability of fresh concrete. In fact, steel fibres are rigid and, consequently, do
not easily accommodate to the dynamically changing shape of the bulk paste located between the
particles constituting the granular skeleton structure. Consequently, the design procedure and the
optimization process followed to achieve self-compactability requirements are sensible to the fibre
content, as well as to the geometrical and material properties of the fibres (Pereira 2006, Barros et
al., 2007).
The characteristics of the SFRSCC mix composition are included in Table 4.1. The materials
used were cement (C) CEM I 52.5R (rapid hardening and high strength cement, according to
EN197-1:2000), limestone filler MICRO 100 AB (LF), a superplasticizer (SP) with the trade name
SIKA 3002 HE, water (W), four type of aggregates (fine river sand, FS; coarse river sand, CS;
crushed calcareous 6-14 mm, CG_1; and 14-20, CG_2) and DRAMIX® RC-80/60-BN hooked end
steel fibres (SF). This fibre has a length (lf ) of 60 mm, a diameter (df ) of 0.75 mm, an aspect ratio
(lf / df) of 80 and a yield stress of 1100 MPa.
In the slab strips only reinforced with conventional steel bars, the mix composition of the
used SCC was similar to the mix composition applied in the SFRSCC slabs, apart the fact of the
former one do not include fibres. This is not the most appropriate procedure, since the composition
depends on the interferences introduced by the fibres. However, for the relatively small content of
45 kg per m3 of concrete it was assumed that the changes necessary to introduce due to the presence
of fibres are not so significant that compromise the principal conclusions of the present work. For
both compositions the total spread, df, and the time to reach a spread diameter of 500 mm, T50
measured in the Slump flow in conjunction with J-Ring, were measured, as well as the H2/H1
(blocking ratio) parameter of the L Box test (EFNARC 2002). The obtained results are indicated in
Table 4.1, showing that the self-compacting requirements were assured. For the developed
compositions, no visual sign of segregation was detected and the mixtures showed good

The Bending and Shear Behaviour of Laminar Structures of High Performance Steel Fibre Reinforced Concrete
Simão Pedro Fonseca Santos – University of Minho, Portugal 62-119
homogeneity and cohesion, even while flowing trough the smaller orifice of the Abrams cone (while
testing, the Abrams cone was always used in the inverted position).
Table 4.1: Adopted composition (per m3 of concrete)
4.2.3. Test set up and monitoring system
The slab strips were subjected to four line loading points distributed in the width of the slab cross
section (see Figure 4.2). The force was registered by a load cell of 300 kN maximum capacity, while
the deflections were measured from five LVDT’s (Linear Voltage Differential Transducer), two of them
of 25 mm measuring length (lmeas) placed at the extremities of the slab, and the others three of
lmeas = 50 mm placed at the central part of the slab (pure bending zone). To avoid the recordings of
extraneous deflections, like support settlements, the LVDT’s were supported on a Japanese Yoke
bar, as represented in Figure 4.2. The tests were carried out with servo-controlled equipment,
imposing a deflection ratio of 30 µm/s in the central LVDT for the test control purposes.
Composition Cement (kg)
Water (dm3)
LF (kg)
SP (dm3)
Fine sand (kg)
Coarse sand (kg)
Coarse Aggr.1
(kg)
Coarse Aggr.2
(kg)
SF (kg)
df (mm)
T50 (s)
H2/H1
SCC 380.5 102.7 360.0 12.5 391.4 429.1 336.9 298.2 0 700 12 0.80
SFRSCC 380.5 102.7 360.0 12.5 391.4 429.1 336.9 298.2 45.0 710 16 0.77

The Bending and Shear Behaviour of Laminar Structures of High Performance Steel Fibre Reinforced Concrete
Simão Pedro Fonseca Santos – University of Minho, Portugal 63-119
150mm
1600mm
125mm 125mm450mm 450mm1350mm
F/2
Concrete
F/2
a)
b)
Figure 4.2: Apparatus of 4 point loading tests in slab strips including monitoring system: a) Scheme; b) Real test performing
4.3. Results and analysis
A label Li_j_k was used to differentiate the tested slabs strips, where: “L” can be replaced by A, B or
C to designate the series that the slab strip pertains; “i” identifies the number of the slab strip test in
each series (two slab strips were tested per each series); “j” represents the diameter of the steel bars
used as tensile longitudinal reinforcement; “k” represents the quantity of applied fibres (value in kg
per m3). For instance, A2_6_45 slab represents the second slab strip of “A” series that is reinforced
with 6 mm diameter longitudinal steel bars and includes 45 kg of steel fibres per concrete m3. If “i”

The Bending and Shear Behaviour of Laminar Structures of High Performance Steel Fibre Reinforced Concrete
Simão Pedro Fonseca Santos – University of Minho, Portugal 64-119
is omitted, the result represents the average value of the results of the slabs of the corresponding
series. The principal characteristics of each slab strip are indicated in Table 4.2.
The relationship between the force and the midspan deflection of the tested slab strips are
represented in Figures 4.3, 4.4 and 4.5. Each curve corresponds to the average load values observed
at each deflection level, obtained from the two slab strips of each sub-series (with a constant Qf ).
From the analysis of these curves it is observed that, after crack initiation, the load carrying capacity
of the SFRSCC slab strips is higher than the corresponding SCC ones. The difference of the load
carrying capacity between these two types of slab strips increases from the crack initiation up to the
maximum load of the SFRSCC slab. However, this difference decreases with the increase of the
percentage of the conventional reinforcement.
Table 4.2: Main characteristics of the tested slab strips.
Designation Longitudinal
reinforcement (Asl+)
Percentage of longitudinal reinforcement (ρsl*)
Content of fibres
Qf (kg/m3) Series
A1_6_0 3Ø 6 0.20 0 A A2_6_0
A1_6_45 3Ø 6 0.20 45 A2_6_45B1_8_0 3Ø 8 0.36 0
B B2_8_0B1_8_45 3Ø 8 0.36 45 B2_8_45C1_10_0 3Ø 10 0.56 0
C C2_10_0C1_10_45 3Ø 10 0.56 45 C2_10_45
ρsl*=Asl+/(b.d)*100
In terms of serviceability limit states for deflection control, Eurocode 2 (2004) recommends
that the maximum deflection of a structural member should not exceed a limit value in the range
[L/250-L/500], depending on the type of structure, where L is the span length of the member, in
mm. Assuming a limit value of u = L/400 = 3.4mm for the deflection, the corresponding force
(FELUt) was obtained (see Table 4.3). From the analysis of these values it can be verified that fibres
increased FELUt from 1.29 up to 1.77, when the FELUt values of the SCC slabs are taken for
comparison purposes. This increase was as higher as lower was the reinforcement ratio of the
longitudinal steel bars, slρ . This table also includes the values of the maximum forces supported by
the tested slabs (Fmax). From the analysis of the FELUt and Fmax values it can be concluded that FELUt

The Bending and Shear Behaviour of Laminar Structures of High Performance Steel Fibre Reinforced Concrete
Simão Pedro Fonseca Santos – University of Minho, Portugal 65-119
/Fmax ratio ranged from 0.66 to 0.95 in the slabs without fibres, while in the slabs reinforced with
fibres the FELUt /Fmax ratio varied from 0.70 to 0.97. For both types of reinforcement FELUt/Fmax ratio
increased with the decrease of slρ . This shows that fibre reinforcement is very effective for the
verifications of the design requirements imposed by the serviceability limit states, being this
effectiveness as more pronounced as lower is slρ .
Table 4.3: Force values of the tested slabs.
Serie
s
ρsl
FELUt (kN) Fmax (kN) SCC
ELUtF [0 kg/m3]
SFRSCCELUtF
[45 kg/m3]
SFRSCCELUt
SCCELUt
FF
maxSCCF
[0 kg/m3] maxSFRSCCF
[45 kg/m3]max
max
SFRSCC
SCC
FF
max
SCCELUtSCC
FF
max
SFRSCCELUtSFRSCC
FF
A 0.20 27.68 49.03 1.77 29.19 50.76 1.74 0.95 0.97 B 0.36 42.46 64.45 1.52 55.42 78.96 1.42 0.77 0.82 C 0.56 55.53 71.60 1.29 83.53 102.59 1.23 0.66 0.70
To evaluate the increase in terms of slab’s load carrying capacity provided by fibre
reinforcement during the deflection process of the slabs, the difference between the load carrying
capacity of the SFRSCC and SCC slabs, ∆F, for each deflection value, was evaluated. The relationship
between ∆F/F ratio and the slab midspan deflection are represented in Figure 4.6, in which F is the
load carrying capacity of the SCC slab at the same deflection where ∆F is evaluated. From the
resulting curves it is apparent that the contribution of the fibres for the slab load carrying capacity
starts from very early stages of the slab deformation, just after the formation of incipient cracks. It is
visible that ∆F/F increases up to the deflection corresponding to Fmax of the SFRSCC slabs, having
this increase attained a maximum value of 80%. The decrease of ∆F/F ratio with the increase of slρ
is also apparent. For the slabs reinforced with the minimum percentage of longitudinal reinforcement
(L_6) the maximum value of the ∆F/F ratio occurred at a deflection of about the deflection
corresponding to the serviceability limit states (uELUt = 3.4 mm). In the series of slabs reinforced with
the other two percentages of longitudinal reinforcement, the ∆F/F ratio maintained almost constant
in the deflection range between 20% and 200% of the uELUt. This means that the benefits provided by
fibre reinforcement for the serviceability limit states are as more pronounced as lower is the
longitudinal reinforcement ratio. In case of necessity to increase ∆F/F of slabs of considerable slρ , a
higher content of fibres needs to be applied. However, economic and technical aspects should be
considered since, besides the higher costs of the fibres (in comparison to the one of conventional
steel bars), the costs derived from the necessity of using higher percentage of fine materials in the
concrete composition when the content of fibres increases should be also taken into account.

The Bending and Shear Behaviour of Laminar Structures of High Performance Steel Fibre Reinforced Concrete
Simão Pedro Fonseca Santos – University of Minho, Portugal 66-119
0 2 4 6 8 10 120
5
10
15
20
25
30
35
40
45
50
55
L_6_45
Load
[kN
]
Vertical Displacement [mm]
Experimental Numerical
L_6_0
0 2 4 6 8 10 120
10
20
30
40
50
60
70
80
L_8_45
Load
[kN
]
Vertical Displacement [mm]
Experimental Numerical
L_8_0
Figure 4.3: Load-central deflection curves of series L_6.
Figure 4.4: Load-central deflection curves of series L_8.
0 2 4 6 8 10 120
10
20
30
40
50
60
70
80
90
100
110
L_10_45
Load
[kN
]
Vertical Displacement [mm]
Experimental Numerical
L_10_0
0 1 2 3 4 5 6 7 8 9 100
10
20
30
40
50
60
70
80
ΔF/F
[%]
Vertical Displacement, u [mm]
L_6 L_8 L_10
u ELU
t = 3
.4m
m
Figure 4.5: Load-central deflection curves of series L_10.
Figure 4.6: Relationship between the midspan deflection and the relative increment of the slab load
carrying capacity for all series.
The indices IF(ELUt) and IF(Max), representing the relative increase of the slab load carrying
capacity provided by fibre reinforcement for the deflection corresponding to the serviceability limit
states and for the deflection corresponding to the maximum load carrying capacity of SFRSCC slab,
respectively, were determined from (4.1) and (4.2).
( ) 100SFRSCC SCC
ELUt ELUtF ELUt SCC
ELUt
F FIF
−= × ; (4.1)
( ) 100SFRSCC SCC
Max MaxF Max SCC
Max
F FIF
−= × (4.2)

The Bending and Shear Behaviour of Laminar Structures of High Performance Steel Fibre Reinforced Concrete
Simão Pedro Fonseca Santos – University of Minho, Portugal 67-119
where SFRSCCELUtF , SCC
ELUtF and SFRSCCMaxF , SCC
MaxF are the forces of the SFRSCC and SCC slabs at uELUt and at peak load, respectively. The values of IF(ELUt) and IF(Max) are included in Table 4.6.
Table 4.4: Increase provided by fibre reinforcement in terms of load carrying capacity at serviceability (IF(ELUt)) and ultimate limit states (IF(Max)).
Designation IF(ELUt) (%) IF(Max) (%) L_6 77.13 73.90 L_8 51.79 42.48 L_10 28.94 22.82
Table 4.4 indicates that the reinforcement of 45 kg of fibres per m3 of concrete provided a
gain in the load carrying capacity at the deflection corresponding to the serviceability limit states that
ranged from 29% to 77%. This gain decreased with the increase of slρ . In terms of the maximum
load of the slabs, this tendency was almost the same, since this gain varied from 23% to 74%, with an
increase of the gain with the decrease of slρ .
4.4. Fibre Distribution
To evaluate the degree of heterogeneity on the fibre distribution in the in-plane of the slab strip,
three core samples were extracted along the longitudinal axis of the slab (Figure 4.8). The fibre
distribution in the depth of the slab was also estimated cutting these samples in three slices of equal
thickness.
1600mm
125mm 450mm 225mm
150m
m
75mmTop Layer
Bottom Layer
MiddleLayer45mm
Figure 4.7: Locations of the core samples extracted.
According to the EFNARC (1996), the amount of fibres is calculated from (4.3).
ff
1000
c
mQ
V×
= (4.3)
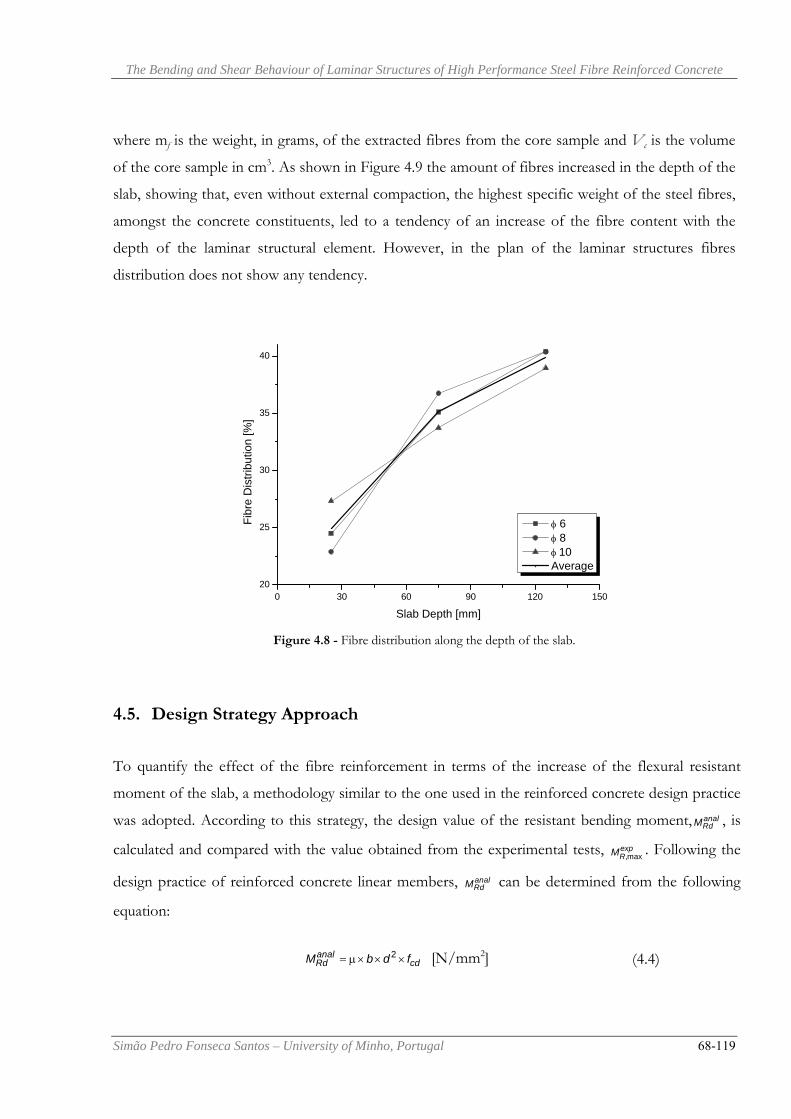
The Bending and Shear Behaviour of Laminar Structures of High Performance Steel Fibre Reinforced Concrete
Simão Pedro Fonseca Santos – University of Minho, Portugal 68-119
where mf is the weight, in grams, of the extracted fibres from the core sample and Vc is the volume
of the core sample in cm3. As shown in Figure 4.9 the amount of fibres increased in the depth of the
slab, showing that, even without external compaction, the highest specific weight of the steel fibres,
amongst the concrete constituents, led to a tendency of an increase of the fibre content with the
depth of the laminar structural element. However, in the plan of the laminar structures fibres
distribution does not show any tendency.
0 30 60 90 120 15020
25
30
35
40
Fibr
e D
istri
butio
n [%
]
Slab Depth [mm]
φ 6 φ 8 φ 10 Average
Figure 4.8 - Fibre distribution along the depth of the slab.
4.5. Design Strategy Approach
To quantify the effect of the fibre reinforcement in terms of the increase of the flexural resistant
moment of the slab, a methodology similar to the one used in the reinforced concrete design practice
was adopted. According to this strategy, the design value of the resistant bending moment, analRdM , is
calculated and compared with the value obtained from the experimental tests, ,maxexpRM . Following the
design practice of reinforced concrete linear members, analRdM can be determined from the following
equation:
2anal
Rd cdM b d f= μ × × × [N/mm2] (4.4)

The Bending and Shear Behaviour of Laminar Structures of High Performance Steel Fibre Reinforced Concrete
Simão Pedro Fonseca Santos – University of Minho, Portugal 69-119
where μ is the reduced bending moment of the cross section, which can be obtained from the
mechanical percentage of the conventional reinforcement (Lima et al. 1985):
sydsl
cd
fAb d f
ω = (4.5)
where b is the width of the cross section of the element and d its effective depth, fcd is the design
value of the concrete compressive strength, Asl is the cross section area of the tensile longitudinal
reinforcement and fsyd the design value of the yield stress of this reinforcement. Values of
fcd = 51MPa and fsyd = 435 MPa were obtained from the results registered in the experimental tests
carried out with concrete and steel specimens (see Tables 4.2 and 4.3).
The value of analRdM was compared to the value of the bending moment recorded at the
maximum load of the tested slabs, ,maxexpRM , having been obtained the gain in terms of flexural
resistance, flexMΔ , that is calculated from the following equation:
exp
,max -100
analRdR
flex analRd
M MM
MΔ = × (4.6)
The values of flexMΔ and the values of the corresponding ,maxexpRM / anal
RdM ratio are included in Table 4.5.
Table 4.5: Influence of the content of fibres on the flexural resistance.
ρsl (%) analRdM [kN.m] ,max
expRM [kN.m] flexMΔ [%] ,max
expRM / anal
RdM
0.20 4.68 11.42 144 2.44 0.36 8.35 17.77 113 2.13 0.56 12.48 23.08 85 1.85
The values indicated in Table 4.5 show that 45 kg of fibres per m3 of concrete provided an
increase of the resistance bending moment varying between 85% and 144%. It is also verified that
flexMΔ decreased with the increase of slρ , but, even for the slabs with the highest slρ the increase is
still significant. Following this methodology, the 45 kg of fibres per m3 of concrete used in the
present experimental program can be converted in a given percentage of a fictitious conventional
reinforcement, placed at the level of the existent tensile longitudinal bars. Table 4.6 includes the
obtained results, where max, ( )f eq sA is the area of the cross section of this fictitious reinforcement. In this

The Bending and Shear Behaviour of Laminar Structures of High Performance Steel Fibre Reinforced Concrete
Simão Pedro Fonseca Santos – University of Minho, Portugal 70-119
evaluation a value of 1.3 was adopted for the partial safety factor for FRC, γf, which is
recommended by the Italian CNR-DT 204/2006 document, when high quality control on materials
and structures is assured, as is the expected case, since the developed SFRSCC will be used in
pre-casting industry.
Table 4.6: Equivalence between a cross section area of a fictitious conventional reinforcement and a content of steel fibres.
ρsl [%] analRdM [kN.m] γ,max
expfRM [kN.m] max
, ( )f eq sA [mm2] max, ( )f eq s
sl
AA
×100 [%]
0.20 4.68 8.78 159 187 0.36 8.35 13.67 238 158 0.56 12.48 17.75 311 132
The values of Table 4.6 indicate that 45 kg per m3 concrete of the steel fibres used in the
present experimental program are equivalent to a fictitious reinforcement which, in terms of cross
section area and comparing to the cross section area of the steel bars really applied, varies between
186% for the series with slρ = 0.20 up to 132% in the series with slρ = 0.56.
4.6. Numerical Simulation
Previous works (Barros et al. 2005a and 2005b) have shown that, using a cross-section layered model
that takes into account the constitutive laws of the intervenient materials, and the cinematic and the
equilibrium conditions, the deformational behaviour of structural elements failing in bending can be
predicted from the moment-curvature relation, M-χ, of the representative sections. To verify the
capability of this model for predicting the deformational behaviour of SFRSCC laminar structures,
the tests carried out in the ambit of the present work were simulated. To evaluate the M-χ of the
cross sections, a discretization in 50 layers of 3 mm thickness was used. The tensile and compression
longitudinal reinforcements were converted in steel layers with a thickness that provides the cross
section area of the corresponding steel bars, placed at 20 mm and at 130 mm from bottom surface
of the cross section (see Figure 4.1). The concrete properties of the constitutive model are included
in Table 4.2, while the steel properties are indicated in Table 4.3. The concrete strain-softening
behaviour is simulated by the tri-linear stress-strain diagram. From this inverse analysis the concrete
fracture parameters can be assessed (see Table 4.7).

The Bending and Shear Behaviour of Laminar Structures of High Performance Steel Fibre Reinforced Concrete
Simão Pedro Fonseca Santos – University of Minho, Portugal 71-119
Figure 4.9: Stress-Strain diagram used in the numerical strategy (NOTE: the valuesαi and βi ,in the figure are multiples of fct,ax and εcp; giving an example: the value α 1 is equal to (α 1x fct,ax) the representation was made like this to
facilitate the reading).
Table 4.7: Concrete properties.‰
Panel Compression Tension Softeningfck
(MPa) Eci
(GPa)fct,ax
(MPa) β,1 α1 β,2 α2 Gf,
(N/mm) L_6_0 86.34 40.00 3.00 2.00 0.20 4.00 0.10 0.080 L_8_0 86.34 40.00 3.00 2.30 0.45 6.00 0.42 0.092 L_10_0 86.34 40.00 3.00 2.30 0.45 6.00 0.41 0.085 L_6_45 91.22 45.00 3.50 5.00 0.65 40.00 0.45 3.900 L_8_45 91.22 45.00 3.50 5.00 0.65 80.00 0.57 3.900 L_10_45 91.22 45.00 3.50 5.00 0.65 60.00 0.43 3.900
Note: a constant value of lb, (crack band width) was used in the simulations: 45mm
As it can be seen in Figures 4.3, 4.4 and 4.5, this model can predict the behaviour of
elements failing in bending with high accuracy. In the series without fibres, after the peak, a constant
or little hardening phase follows, which is the expected behaviour of elements with only ordinary
reinforcement, since the failure mode depends on the steel; no softening phase is observed. In the
series reinforced with steel fibres, after the peak load, the elements present a softening phase: after
the concrete crack opening, both ordinary reinforcement and steel fibres start working together.
This result in a higher load carrying capacity in the series reinforced with fibres; after the steel
achieve its yield strength, the steel fibres are the ones responsible for the resisting mechanisms,
bridging the cracks, resulting in a softening behaviour, with the energy dissipation decreasing slowly,
as it can be seen in the softening branches in Figures 4.3, 4.4 and 4.5. For this reason, higher values
of fracture energy Gf,n,, are observed in the series with steel fibres: around 45 times higher.

The Bending and Shear Behaviour of Laminar Structures of High Performance Steel Fibre Reinforced Concrete
Simão Pedro Fonseca Santos – University of Minho, Portugal 72-119
4.7. Conclusions
The present chapter resumes the main results obtained in an experimental program carried out to
assess the effect of a constant content of steel fibre reinforcement (45 kg/m3) for the behaviour of
reinforced self-compacting concrete laminar structures failing in bending. For this purpose three
series of slab strips reinforced with distinct percentage of conventional longitudinal steel bars were
tested under four line loads.
Using a content of cement of 380 kg per m3 of concrete, a SFRSCC of strength class C70/85
was produced, which shows that the mix design method developed in previous research is able to
develop High Strength SFRSCC at a competitive cost.
The force-deflection relationships obtained in the slab strip tests evidenced that 45 kg per m3
of concrete of the selected fibres contributed significantly for the slabs load carrying capacity from
the incipient crack formation stage, i.e., from a deflection level that is lower than 1/10 of the
deflection corresponding to the serviceability limit states. The increase in terms of slab load carrying
capacity provided by fibre reinforcement was as significant as lower was the percentage of the
conventional reinforcement ( slρ ). At the deflection corresponding to the serviceability limit states,
45 kg of the used steel fibres per m3 of concrete provided an increase of the slab load carrying
capacity that ranged from 29% for slρ = 0.56 up to 77% for slρ = 0.2.
In terms of the slab maximum load carrying capacity, this content of steel fibres provided an
increase that varied from 23% for slρ = 0.56 up to 74% for slρ = 0.36.
Applying a methodology used in the design practice of reinforced concrete structures an
equivalence between the content of fibres and a cross section area of a fictitious longitudinal
reinforcement ( fictslA ) was determined. From the obtained results it was verified that 45 kg per m3 of
concrete is equivalent, in terms of flexural resistance, to a fictslA of 74 mm2, 87 mm2 and 75 mm2 for
the slabs with slρ =0.20, 0.36 and 0.56, respectively, which corresponds to a 87%, 58% and 32% of
the cross sectional area of the real reinforcement applied in the tested slabs.

The Bending and Shear Behaviour of Laminar Structures of High Performance Steel Fibre Reinforced Concrete
Simão Pedro Fonseca Santos – University of Minho, Portugal 73-119
A cross section layer model was used to determine the moment-curvature relationship, M-χ,
of the representative sections of the tested slab strips. This simple numerical strategy was able to
predict, with enough accuracy, the load-deflection response registered experimentally.

The Bending and Shear Behaviour of Laminar Structures of High Performance Steel Fibre Reinforced Concrete
Simão Pedro Fonseca Santos – University of Minho, Portugal 74-119
5. HIGH PERFORMANCE FIBRE REINFORCED
CONCRETE ELEMENTS FAILING IN SHEAR
5.1. Motivation
In recent years, the terminology "High-Performance Concrete" has been introduced into the
construction industry.
The American Concrete Institute (ACI) defines high-performance concrete as concrete
meeting special combinations of performance and uniformity requirements that cannot always be
achieved routinely when using conventional constituents and normal mixing, placing and curing
practices. A commentary to the definition states that a high-performance concrete is one in which
certain characteristics are developed for a particular application and environment. Examples of
characteristics that may be considered critical for an application are ease of placement, compaction
without segregation, early age strength, long-term mechanical properties, permeability, density, heat
of hydration, toughness, volume stability, long life in severe environments, etc.
Since many characteristics of high-performance concrete are interrelated, a change in one
usually results in changes in one or more of the other characteristics. Consequently, if several
characteristics have to be taken into account in producing a concrete for the intended application,
each must be clearly specified in the contract documents.
A high-performance concrete is something more than is achieved on a routine basis and
involves a specification that often requires the concrete to meet several criteria. For example, on the
The Bending and Shear Behaviour of Laminar Structures of High Performance Steel Fibre Reinforced Concrete
Simão Pedro Fonseca Santos – University of Minho, Portugal 75-119
Lacey V. Murrow floating bridge in Washington State, the concrete was specified to meet
compressive strength, shrinkage and permeability requirements. The latter two requirements
controlled the mix proportions so that the actual strength was well in excess of the specified
strength. This occurred due to the interrelation between the three characteristics.
A high-strength concrete is always a high-performance concrete, but a high-performance
concrete is not always a high-strength concrete. ACI defines a high-strength concrete as a concrete
that has a specified compressive strength for design 41 MPa or greater.
Most high-performance concretes have a high cementitious content and a
water-cementitious material ratio less than 0.40. However, the proportions of the individual
constituents vary, depending on local preferences and local materials. Mix proportions developed in
one part of the country do not necessarily work in a different location. Many trial batches are usually
necessary before a successful mix is developed.
High-performance concretes are also more sensitive to changes in constituent material
properties than conventional concretes. Variations in the chemical and physical properties of the
cementitious materials and chemical admixtures need to be carefully monitored. This means that a
greater degree of quality control is required for the successful production of high-performance
concrete.
Fibre reinforced concrete is certainly a High Performance Concrete for the great ductility of
the elements built with this material. This fact has an extreme importance since manufacturers of
pre-cast elements are constantly increasing the compressive strength of the concrete they use
without necessarily taking into account that the failure of HSC is more brittle than that of concrete
with a lower strength (Kearsley and Mostert, 2004). One of the possibilities from the structural point
of view to avoid this brittle failure is the utilization of fibres.
Shear failure of conventional reinforced concrete beams usually occurs by tensile failure of
concrete in the shear span. For this reason, shear failure in general is brittle and, in practice, shear
reinforcement, in the form of stirrups, is incorporated to prevent this type of failure, and to increase
the shear strength of the beams (Al-Ta’an and Al-Feel, 1990).
The application of stirrups in concrete elements, especially in hollow section or thin wall
elements, mobilize significant labor time, resulting in important financial charges. In structural

The Bending and Shear Behaviour of Laminar Structures of High Performance Steel Fibre Reinforced Concrete
Simão Pedro Fonseca Santos – University of Minho, Portugal 76-119
concrete elements of buildings in seismic risk zones, the density of steel stirrups and hoops may
difficult to obtain the desired concrete quality. Due to this and other reasons, the substitution of
stirrups per steel fibres has been studied for several researchers (Casanova et al (2000), Di Prisco and
Plizzari (2004), Gettu et al (2004)).
In heavy precast industry, discrete fibres could be used to reduce or substitute conventional
transverse reinforcement, with advantages in the production process and reduction of labor costs
(Failla et al, 2002).
Some previous research indicates that shear resistance of SCC and HPC is lesser than in
current concretes (Schiessel, 2001). This author defends that this happens due to a better
arrangement of the particles, as a consequence of the smaller dimensions of the aggregates and
volume of voids, and also caused by the smoother surfaces of failure in case of High Resistance
Self-Compacting Concrete. In the other hand, the shear formulations of the actual normative still
treating this phenomenon with semi-empirical expressions, varying the theoretical basis and taking
into account the material properties, the level of prestressed reinforcement, the shear reinforcement,
and the supports (Cladera, 2004). The major part of the complexity is in accurate the contribution of
concrete in the general shear resistance (Ma, 1997). In addition, the contribution of steel fibres in the
shear resistance is still not well dominated.
5.2. Fibrous reinforcing systems for the shear resistance of concrete elements:
an overview
Casanova (1995) concluded that steel fibres may substitute significant percentages of stirrups,
especially when a High Strength Concrete (HSC) is used, once the reinforcement mechanisms of
fibres are more effectively mobilized. He also concluded that the height of the cross section of the
beams has a significant influence in the fibre reinforcement performance: the higher the beam is, the
less efficient are the steel fibre reinforcement.
Steel fibres have some advantages over vertical stirrups or bent-up flexural steel. First, the
fibre spacing is much closer than the practical spacing of stirrups, since the former is randomly and
more or less uniformly distributed throughout the concrete volume. Secondly, the first crack and the

The Bending and Shear Behaviour of Laminar Structures of High Performance Steel Fibre Reinforced Concrete
Simão Pedro Fonseca Santos – University of Minho, Portugal 77-119
ultimate tensile strength of concrete are increased by the presence of steel fibres. This results in an
increase of the load necessary to produce shear cracking, as well as the ultimate shear resistance of
the beams. Thirdly, stirrups require a high labor input of cutting, bending and fixing, and in thin
webs they can be impractical and difficult to fix. Lastly, in relatively shallow beams the necessary
development length of the stirrups may not be available due to the short distance between the mid-
depth and the compression face of the member, and, therefore, the use of stirrups may not be
economical (Al-Ta’an and Al-Feel, 1990).
The addition of steel fibres to HSC results in a high performance cement-based composite
material, since their presence reduces the brittleness of HSC and increases the fatigue strength and
resistance to impact loading (Plizzari et al, 2000). In general, fibres proved to be more effective in
high-strength concrete than in normal strength concrete in terms of increasing both the load
carrying capacity and the overall ductility of concrete elements. This is attributed to the improved
bond characteristics associated with the use of fibres in conjunction with HSC (Valle, 2004).
In members where shear stresses are predominant and influence failure, steel fibres cannot
only enhance the intrinsic strength of concrete in beams without conventional flexural
reinforcement, but are also capable of resisting shear stresses in conventionally reinforced beams
and slabs, and indeed increase the shear capacity of the members (Swamy et al, 1993).
Experimental results show that beams reinforced only with steel fibres show a similar, or
even better, post cracking behaviour than the beams with the minimum amount of transverse
reinforcement (Meda et al, 2005). When used in beams with stirrups, steel fibres significantly
improve their shear strength.
Gettu et al. (2004) carried out experimental studies to evaluate the possibility of applying
steel fibres as the unique shear reinforcement. They verified that specimens reinforced with 60
kg/m3 of steel fibres have a similar behaviour as specimens with rebar and 30 kg/m3 of fibres up to
crack widths of 0.2mm.
Steel fibres also reduce the width of shear cracks, thus improving also durability (Meda et al,
2005). The crack spacing in fibre concrete beams was observed to be reduced in about 20 percent
compared to the control normal concrete beams with and without stirrups. The first flexural crack in

The Bending and Shear Behaviour of Laminar Structures of High Performance Steel Fibre Reinforced Concrete
Simão Pedro Fonseca Santos – University of Minho, Portugal 78-119
steel fibre reinforced concrete beams appeared for a higher load, due to the crack resistance
mechanism of the steel fibres (Roshani, 1996).
The fibres not only control the propagation and widening of dowel cracks, but also eliminate
the severe spalling and disintegration of the concrete cover associated with conventional shear
failures. The fibres are thus able to preserve the integrity of the beam as a whole (Swamy et al, 1993).
The shear strength can be increased of as much as 70 percent by adding small quantities of
steel fibres to the ordinary reinforced concrete (H.Tan et al, 1993).
The substitution of stirrups in HSC structures with a volume fraction of fibres higher than
1.25% improves the overall ductility and better control crack growth as compared to conventional
shear reinforcement (Casanova et al, 2000).
Most authors consider that a minimum volume fraction of fibres must be higher than
1%.Williamson emphasized that, using by 1.5% of steel fibres, the shear strength increased up to
45% compared to beams without stirrups. Other authors are less conservative. Roshani (1996) says
that the replacement of vertical stirrups by "hooked" end steel fibres provide effective reinforcement
against shear failure. When using a fibre volume fraction of just 1%, the ultimate shear strength of
beams increased 55% compared to beams without stirrups control.
Shaped fibres such as duoform, crimped and hooked ends fibres are more effective in terms
of increasing the shear strength of RC beams and slabs than plain fibres, due to their better bonding
characteristics (Al-Ta’an and Al-Feel, 1990).
5.3. Experimental program
A research program to assess the influence of steel fibres in the behaviour of laminar structures of
concrete failing in shear was carried out. Uniaxial compression tests with cylinders of 150 mm
diameter and 300 mm height, and bending tests with prismatic (600×150×150) mm3 specimens were
also carried out to assess the compression and bending behaviour of the designed high performance
steel fibre reinforced concrete (HPSFRC). To evaluate the influence of the percentage of fibres in
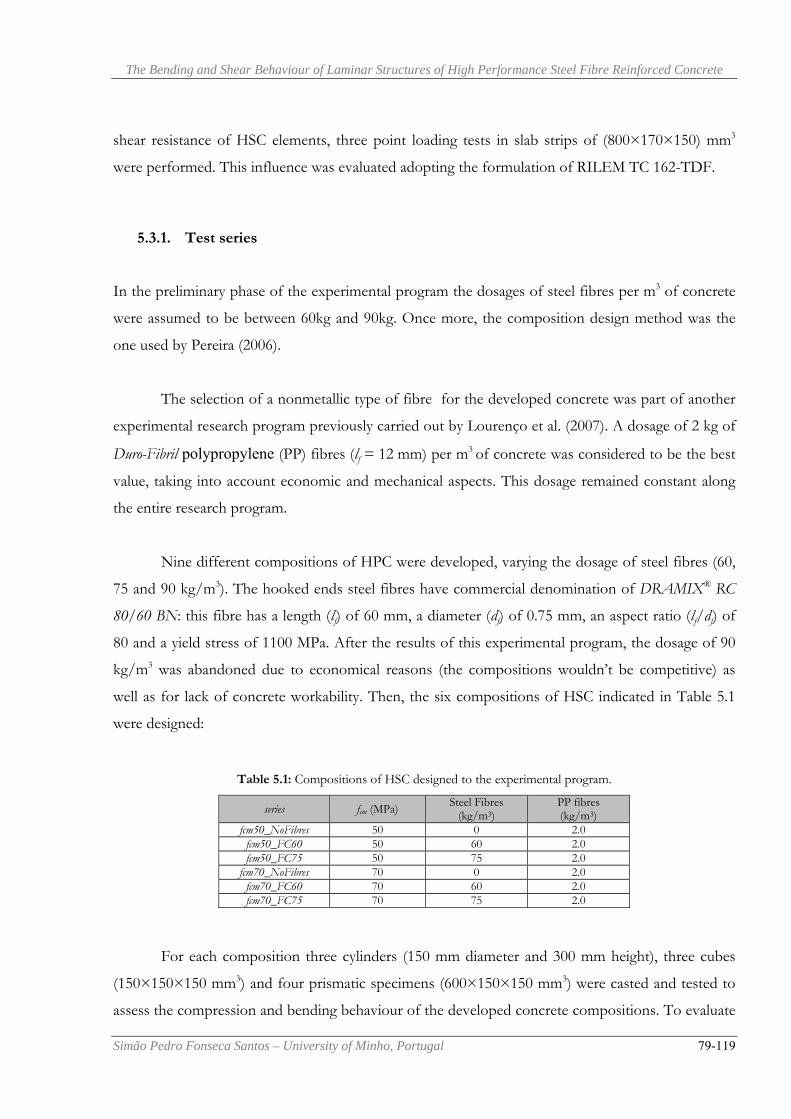
The Bending and Shear Behaviour of Laminar Structures of High Performance Steel Fibre Reinforced Concrete
Simão Pedro Fonseca Santos – University of Minho, Portugal 79-119
shear resistance of HSC elements, three point loading tests in slab strips of (800×170×150) mm3
were performed. This influence was evaluated adopting the formulation of RILEM TC 162-TDF.
5.3.1. Test series
In the preliminary phase of the experimental program the dosages of steel fibres per m3 of concrete
were assumed to be between 60kg and 90kg. Once more, the composition design method was the
one used by Pereira (2006).
The selection of a nonmetallic type of fibre for the developed concrete was part of another
experimental research program previously carried out by Lourenço et al. (2007). A dosage of 2 kg of
Duro-Fibril polypropylene (PP) fibres (lf = 12 mm) per m3 of concrete was considered to be the best
value, taking into account economic and mechanical aspects. This dosage remained constant along
the entire research program.
Nine different compositions of HPC were developed, varying the dosage of steel fibres (60,
75 and 90 kg/m3). The hooked ends steel fibres have commercial denomination of DRAMIX® RC
80/60 BN: this fibre has a length (lf) of 60 mm, a diameter (df) of 0.75 mm, an aspect ratio (lf/df) of
80 and a yield stress of 1100 MPa. After the results of this experimental program, the dosage of 90
kg/m3 was abandoned due to economical reasons (the compositions wouldn’t be competitive) as
well as for lack of concrete workability. Then, the six compositions of HSC indicated in Table 5.1
were designed:
Table 5.1: Compositions of HSC designed to the experimental program.
For each composition three cylinders (150 mm diameter and 300 mm height), three cubes
(150×150×150 mm3) and four prismatic specimens (600×150×150 mm3) were casted and tested to
assess the compression and bending behaviour of the developed concrete compositions. To evaluate
series fcm (MPa) Steel Fibres (kg/m3)
PP fibres (kg/m3)
fcm50_NoFibres 50 0 2.0 fcm50_FC60 50 60 2.0 fcm50_FC75 50 75 2.0
fcm70_NoFibres 70 0 2.0 fcm70_FC60 70 60 2.0 fcm70_FC75 70 75 2.0

The Bending and Shear Behaviour of Laminar Structures of High Performance Steel Fibre Reinforced Concrete
Simão Pedro Fonseca Santos – University of Minho, Portugal 80-119
the influence of the percentage of fibres in shear resistance of HSC elements, three point loading
tests in slab strips (800×170×150 mm3) were performed; for each composition, four slab strips were
casted: two of them including ordinary longitudinal reinforcement (2Ф20 to assure shear failure) and
two without ordinary reinforcement, to serve as reference. A total of twenty-four slab strips were
casted and tested.
5.3.2. Mix Compositions
In Table 5.2 all the six compositions used in this experimental program are shown. Photos of the
materials used to develop these compositions are shown in Figure 5.1. These are current materials,
used in a current plant of a prefabrication industry. Beside, these are local materials, from the south
east zone of Portugal. This is to say that HPC compositions can be developed with current
materials, with reduced costs, which turns these admixtures very powerful from the economical
point of view.

The Bending and Shear Behaviour of Laminar Structures of High Performance Steel Fibre Reinforced Concrete
Simão Pedro Fonseca Santos – University of Minho, Portugal 81-119
a) b)
c) d)
e) f)
g) h)
Figure 5.1: Materials used in HPSFRC compositions: a) Coarse Aggregate 2 (14/20); b) Coarse Aggregate 1 (6/14); c)
Fine Aggregate (2/6); d) Fine Sand; e) Limestone Filler (máx: 10µm); f) Type II, 42.5R Cement;
g) 80/60 Steel Fibres; h) Superplasticizer
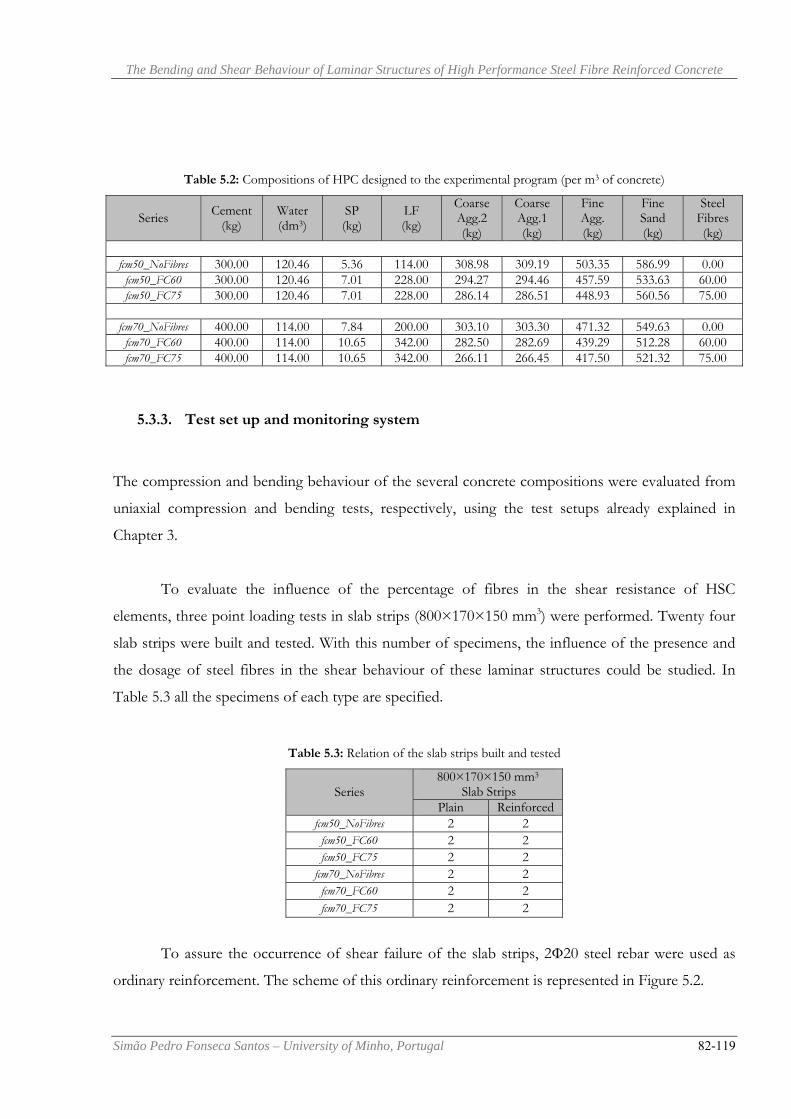
The Bending and Shear Behaviour of Laminar Structures of High Performance Steel Fibre Reinforced Concrete
Simão Pedro Fonseca Santos – University of Minho, Portugal 82-119
Table 5.2: Compositions of HPC designed to the experimental program (per m3 of concrete)
Series Cement (kg)
Water (dm3)
SP (kg)
LF (kg)
Coarse Agg.2 (kg)
Coarse Agg.1 (kg)
Fine Agg. (kg)
Fine Sand (kg)
Steel Fibres (kg)
fcm50_NoFibres 300.00 120.46 5.36 114.00 308.98 309.19 503.35 586.99 0.00fcm50_FC60 300.00 120.46 7.01 228.00 294.27 294.46 457.59 533.63 60.00fcm50_FC75 300.00 120.46 7.01 228.00 286.14 286.51 448.93 560.56 75.00
fcm70_NoFibres 400.00 114.00 7.84 200.00 303.10 303.30 471.32 549.63 0.00fcm70_FC60 400.00 114.00 10.65 342.00 282.50 282.69 439.29 512.28 60.00fcm70_FC75 400.00 114.00 10.65 342.00 266.11 266.45 417.50 521.32 75.00
5.3.3. Test set up and monitoring system
The compression and bending behaviour of the several concrete compositions were evaluated from
uniaxial compression and bending tests, respectively, using the test setups already explained in
Chapter 3.
To evaluate the influence of the percentage of fibres in the shear resistance of HSC
elements, three point loading tests in slab strips (800×170×150 mm3) were performed. Twenty four
slab strips were built and tested. With this number of specimens, the influence of the presence and
the dosage of steel fibres in the shear behaviour of these laminar structures could be studied. In
Table 5.3 all the specimens of each type are specified.
Table 5.3: Relation of the slab strips built and tested
Series 800×170×150 mm3
Slab Strips Plain Reinforced
fcm50_NoFibres 2 2 fcm50_FC60 2 2 fcm50_FC75 2 2
fcm70_NoFibres 2 2 fcm70_FC60 2 2 fcm70_FC75 2 2
To assure the occurrence of shear failure of the slab strips, 2Ф20 steel rebar were used as
ordinary reinforcement. The scheme of this ordinary reinforcement is represented in Figure 5.2.

The Bending and Shear Behaviour of Laminar Structures of High Performance Steel Fibre Reinforced Concrete
Simão Pedro Fonseca Santos – University of Minho, Portugal 83-119
Figure 5.2: Ordinary reinforcement: a) longitudinal view; b) transversal view
The three point loading tests were performed with a servo-controlled equipment of
maximum load capacity of 300kN. The tests were controlled by the displacement transducer of the
actuator, at a displacement ratio of 3 µm/s. Figure 5.3 shows a slab strip prototype being tested.
a) b)
Figure 5.3: Three point loading tests in slab strips: a) general view; b) monitoring system

The Bending and Shear Behaviour of Laminar Structures of High Performance Steel Fibre Reinforced Concrete
Simão Pedro Fonseca Santos – University of Minho, Portugal 84-119
5.4. Results and analysis
Compression behaviour
The compression stress-strain relationship, c cσ ε− , for each testing series of HPSFRC is represented
in Figure 5.4. These results were obtained at the 14th day after the casting operations. Each curve is
the average of three specimens per series. In the series of fcm_50, the concrete with 75kg/m3 of
steel fibres showed higher stiffness until the crack initiation. In the post-peak zone the behaviour is
very similar to the series with 60kg/m3 of steel fibres. In the series of fcm_70, the behaviour of all
series is very similar till the crack initiation. The behaviour of the series with fibres is also very
similar in the post-peak zone, although the series with 75kg/m3 of steel fibres showed higher load
load carrying capacity.
0
10
20
30
40
50
60
70
80
0 5 10 15Strain (‰)
Stre
ss (M
Pa)
no fibres
60 kg/m3
75 kg/m3
0
10
20
30
40
50
60
70
80
0 5 10 15Strain (‰)
Stre
ss (M
Pa)
75 kg/m3
60 kg/m3
no fibres
a) b)
Figure 5.4: Stress-strain curves of HPSFRC: a) fcm50 series; b) fcm70 series
Table 5.4: Mechanical characterization of the tested series: compression tests
Series E (GPa)
Max. Load at the Peak
(kN)
Max. Strain at the Peak
(‰)
fcm50_NoFibres 36.31 41.74 3.50 fcm50_FC60 37.05 46.58 4.15 fcm50_FC75 39.01 48.10 3.77
fcm70_NoFibres 48.41 66.38 3.10
fcm70_FC60 45.68 65.73 3.37 fcm70_FC75 43.75 66.08 3.43

The Bending and Shear Behaviour of Laminar Structures of High Performance Steel Fibre Reinforced Concrete
Simão Pedro Fonseca Santos – University of Minho, Portugal 85-119
Flexural behaviour Once more, in the bending tests, the recommendations of RILEM TC 162-TDF were adopted,
except the depth of the notch of the specimen in the cross section at specimen midspan. Effectively,
the first series started to be tested with a notch of 2-3 mm thick and 25±1 mm depth. At the end of
the preliminary tests, multi cracking was observed in the specimens. According to RILEM TC
162-TDF these tests are not valid, since the parameters related with the fracture energy (Gf) can no
be measured with enough accuracy, since the energy is dissipated in the formation and propagation
of several cracks instead of an unique crack as it is desirable.
To solve this problem, a notch with higher depth was used. The definition of the right depth
was made with many tries until a single crack occur in the test. The right depth of the notch showed
to be 74mm, almost a half of the specimen depth. This way, a single crack occurs and the fracture
energy can be better characterized (see Figure 5.5).
Figure 5.5: Notch in a specimen to evaluate bending parameters of HPSFRC: depth = 74mm
The force-deflection curves, F-δ, obtained in the tested series are depicted in Figure 5.6.
Each curve is the average of the F-δ relationship recorded in three specimens.

The Bending and Shear Behaviour of Laminar Structures of High Performance Steel Fibre Reinforced Concrete
Simão Pedro Fonseca Santos – University of Minho, Portugal 86-119
0
2
4
6
8
10
12
14
16
18
20
0.0 1.0 2.0 3.0 4.0 5.0
Displacement (mm)
Loa
d (k
N)
75 kg/m3
60 kg/m3
no fibres
0
2
4
6
8
10
12
14
16
18
20
0.0 1.0 2.0 3.0 4.0 5.0Displacement (mm)
Loa
d (k
N)
75 kg/m3
60 kg/m3
no fibres
a) b)
Figure 5.6: Load-displacement curves of bending in the tested series of HPSFRC: a) fcm50 series; b) fcm70 series
The influence of the dosage of steel fibres is very evident. The series without fibres show a
deflection softening behaviour, with abrupt load decay after peak load. The series with fibres show a
very ductile behaviour. After the crack initiation a hardening phase happened in all series reinforced
with fibres. The softening phase starts for the same values of displacement (around 2.0mm) in all
series. The influence of the fibre dosage is higher in the series fcm50: the difference between the
series with 60kg and 75kg per m3 of concrete is more pronounced than in the series fcm70. The
softening branch in the series fcm70 with 60kg/m3 of steel fibres has a more pronounced load decay
than in all the other series. This shows that the same dosage of steel fibres may cause different levels
of reinforcement in concretes with different resistant levels, i.e., since a higher load should be
sustained by the fibres bridging mechanism at the specimen’s fracture surface of the specimens with
fcm70, the dosage of fibres should be higher to. This explains why in the series fcm50 the same
dosage of steel fibres leads to a softening phase with a much softer decay.
Shear resistance
The load-displacement curves obtained from the three point loading tests carried out with the slab
strips with ordinary longitudinal reinforcement are present in Figure 5.7. Table 5.5 includes the force
at a deflection corresponding to the serviceability limit state (L/400 with L being the span length in
mm), FELUt, and the maximum force, Fmax, registered in the tests.

The Bending and Shear Behaviour of Laminar Structures of High Performance Steel Fibre Reinforced Concrete
Simão Pedro Fonseca Santos – University of Minho, Portugal 87-119
0 2 4 6 8 100
25
50
75
100
125
150
175
200
225
250
275
Load
(kN
)
Displacement at mid span (mm)
fcm50_NoFibres fcm50_FC60 fcm50_FC75
0 2 4 6 8 100
25
50
75
100
125
150
175
200
225
250
275
Load
(kN
)
Displacement at mid span (mm)
fcm70_NoFibres fcm70_FC60 fcm70_FC75
a) fcm = 50 MPa b) fcm = 70 MPa
Figure 5.7: Load-displacement curves series with ordinary longitudinal reinforcement
To estimate the contribution of fibre reinforcement at serviceability and at ultimate limit
states, the values of the following ratio was determined
100Qf refF
ref
F FI
F−
= × (5.1)
where FQf is the force of the slab strip made by a fibrous composition and Fref is the slab
manufactured with the corresponding plain concrete. When these force values correspond to FELUt,
it is evaluated the IF for the serviceability limit state analysis, IF(ELUt), whereas the IF for the ultimate
limit state analysis, IF(max), is obtained when the maximum forces are used in the evaluation of (5.1).
The obtained values for IF(ELUt) and IF(max) are indicated in Table 5.6, from which it can be concluded
that fibre reinforcement provided a contribution for the load carrying capacity of the slabs, at
deflection corresponding to the serviceability limit state analysis, ranging from 43% up to 72%,
while for the maximum load, the fibre reinforcement effectiveness varied from 80% up to 118%.
Table 5.5: Values for the FELUt and Fmax
Series FELUt Fmax
Qf = 0 kg/m3 Qf = 60 kg/m3
Qf = 75 kg/m3
Qf = 0 kg/m3
Qf = 60 kg/m3
Qf = 75 kg/m3
fcm50 97.35 146.06 154.83 97.66 187.50 212.73 fcm70 112.10 160.29 192.36 125.23 225.82 252.90

The Bending and Shear Behaviour of Laminar Structures of High Performance Steel Fibre Reinforced Concrete
Simão Pedro Fonseca Santos – University of Minho, Portugal 88-119
Table 5.6: Fibre reinforcement effectiveness indexes for serviceability (IF(ELUt)) and ultimate (IF(Max)) limit state analysis
Series IF(ELUt) (%) IF(max) (%)
Qf = 60 kg/m3 Qf = 75 kg/m3 Qf = 60 kg/m3 Qf = 75 kg/m3
fcm50 50.04 59.05 91.99 117.84 fcm70 42.98 71.59 80.33 101.96
5.5. Failure modes
As Figure 5.8 shows all reinforced tested beams failed in shear. However, the number of flexural
cracks formed up to the ocurrence of the shear failure crack increased with the increase of the
content of steel fibres. Furthermore, it is visible that the inclination of the shear failure crack (angle
of the shear crack plan with the beam longitudinal axis) decreased with the increase of the content
of fibres, which justifies the resulting benefits of fibre reinforcement, since larger area of crack,
bridged by fibres, is available, and more favorable inclination of the fibre resisting tensile force is
moblized for the shear resistance. Moreover, due to the crack opening arrestment offered by fibres
bridging the shear crack plans, a diffuse crack pattern occurred in the vicinity of the shear failure
crack, contributing for the increase of energy dissipation and for the more ductile failure mode
observed in HSSFRC beams, in comparison to HSC beams.
a) b) c)
Figure 5.8: Crack Pattern in fcm50 series: a) without fibres, b) 60 kg/m3 and c) 75 kg/m3 of fibres
5.6. Influence of Steel Fibres in Shear Reinforcement
Models to predict Ultimate Shear Strength
Several researchers investigated the efficacy of steel fibres in the shear reinforcement of concrete
elements (Campione and Mindess 1999, Dupont and Vandewalle 2000, Barragán 2002, Rosenbusch
and Teutsch 2003). In parallel, some formulations have been proposed, with the aim of assessing the

The Bending and Shear Behaviour of Laminar Structures of High Performance Steel Fibre Reinforced Concrete
Simão Pedro Fonseca Santos – University of Minho, Portugal 89-119
experimental results obtained. However, these expressions never deserved generalized acceptance.
Some of these expressions require the knowledge of the values of material parameters, which are
difficult to determine (e.g. fibre-matrix interface stress).
RILEM TC 162-TDF (2003) and "Brite-Euram Project 97-4163, BRPR-CT98-0813"
develop numerical and experimental research in order to prepare a formulation with an adjusted
format to its usage in the design of Steel Fibre Reinforced Concrete (SFRC). Three laboratories
where mobilized to study the influence of the stirrups and fibres percentage, the influence of the
beams height and, in case of T-beams, the influence of the thickness and the width of the chords.
With the experimental results obtained, the performance of the Rilem’s formulation, which is based
on the Eurocode 2 formulation to concrete beams, was evaluated.
RILEM TC 162-TDF approach
According to the formulation proposed by RILEM TC 162-TDF committee, the shear resistance of
a concrete element reinforced with steel stirrups, steel fibres and ordinary longitudinal reinforcement
is given by:
3Rd cd fd wdV V V V= + + (5.2)
where cdV represents the concrete contribution for the shear resistance:
( )130.12 100 0.15cd ck cp wV k f b dρ σ⎡ ⎤= +⎢ ⎥⎣ ⎦
l [N] (5.3)
in which
2001kd
= + (d in mm) and k ≤ 2, (5.4)
and
2%s
w
Ab d
ρ = ≤ll (5.5)
with sA l being the cross section area of the tensile longitudinal reinforcement, bw is the minimum width of the web cross section, d is the effective depth of the cross section,

The Bending and Shear Behaviour of Laminar Structures of High Performance Steel Fibre Reinforced Concrete
Simão Pedro Fonseca Santos – University of Minho, Portugal 90-119
sd
cpc
NA
σ = [N/mm2] (5.6)
where Nsd [N] is the axial force due to applied external load and pre(pos)-stress (compression is
assumed positive) and Ac [mm2] is the area of the cross section.
The contribution of steel fibres, fdV , is determined by
0.7fd f l fd wV k k b dτ= [N] (5.7)
where fk is a factor taking the contribution of the flanges in a T cross sections,
1 f ff
w
h hk n
b d⎛ ⎞⎛ ⎞
= + ⎜ ⎟⎜ ⎟⎝ ⎠⎝ ⎠
≤ 1.5 (5.8)
with hf [mm] and bf [mm] being the height and width of the flanges, respectively,
f w
f
b bn
h−
= ≤min( 33; w
f
bh
) (5.9)
This contribution is simulated by fdτ , that can be determined by two different parameters:
,30.12fd eqkfτ = [N/mm2] (5.10a)
or
,40.12fd Rkfτ = [N/mm2] (5.10b)
where ,3eqkf and ,4Rkf are the characteristic values of the equivalent and the residual flexural tensile
strength parameters determined under the recommendations of RILEM TC 162-TDF.
In (5.2), wdV represents the contribution of steel stirrups or inclined bars,

The Bending and Shear Behaviour of Laminar Structures of High Performance Steel Fibre Reinforced Concrete
Simão Pedro Fonseca Santos – University of Minho, Portugal 91-119
( )0.9 1 cot sinswwd ywd
AV d f gs
α α= + [N] (5.11)
where Asw is the cross section area of the arms of the steel stirrup, s is the distance between
consecutive stirrups, fydw is the design value of the yield stress of the stirrup and α is the inclination
of the shear failure crack (assumed 45°). In the present experimental program wdV = 0.
According to this formulation, the contribution of steel fibres for the concrete shear
resistance was evaluated. The obtained values are included in Table 5.7.
Table 5.7: Contribution of steel fibres to the concrete shear resistance
Series fcm
(kN) fck
(kN)
Vcd
(kN)
τfd,1 (1)
(MPa)
τfd,2 (2)
(MPa)
Vfd (1)
(kN)
Vfd (2)
(kN)
VRd (1)
(kN)
VRd (2)
(kN) SF,1 (3) SF,2 (3)
fcm50_NoFibres 41.74 33.74 30.36 - - - - 30.36 - 1.61 -
fcm50_FC60 46.58 38.58 31.65 0.97 0.91 18.23 17.15 49.88 48.80 1.88 1.92
fcm50_FC75 48.10 40.10 32.16 0.87 0.82 16.29 15.34 48.45 47.50 2.20 2.24
fcm70_ NoFibres 66.39 58.39 36.45 - - - - 36.45 - 1.72 -
Fcm70_FC60 65.73 57.73 36.31 1.13 0.82 21.15 15.45 57.46 51.76 1.95 2.17
Fcm70_FC75 66.08 58.08 36.38 0.90 0.49 16.95 9.19 53.33 45.57 2.36 2.72 (1)Considering
,30.12fd eqkfτ = [N/mm2]; (2) Considering ,40.12fd Rkfτ = [N/mm2]; (3) Ratio between Vexp and VRd(1) (or VRd(2)).
According to the Standard Method proposed by RILEM TC 126 – TDF, steel fibres present
a significant contribution to the increase of shear resistance of laminar structures: the smaller value
of the safety factor in series reinforced with fibres was 1.88, which represents an increase of 88% in
the shear resistance. However, the usage of characteristic values to calculate the contribution of
fibres to the shear resistance may result unreasonable from the practical point of view.
The fibres within a concrete matrix can be considered as one more aggregate, an aggregate
with a great slenderness. So, the rearrangement of the constituents of a composition of SFRC is in
general, more complicated than in a current plain concrete composition. This fact may cause a
greater dispersion on the structural response of the elements made of SFRC. Furthermore, the
formulations that calculate characteristic values deriving from medium values are very unfavorable
when few specimens are used (Barros, 2003).
In the present study, three specimens per series were tested. Comparing the experimental
results with the formulation’s prediction, it can be seen that the high values for the safety factors
present in the Table 5.6 can have origin in the little contribution of steel fibres to the shear

The Bending and Shear Behaviour of Laminar Structures of High Performance Steel Fibre Reinforced Concrete
Simão Pedro Fonseca Santos – University of Minho, Portugal 92-119
resistance defined by the formulation. Two main aspects may be commented: i) the values registered
in the experimental program are significantly higher than the ones predicted by the model which
shows that it can be a very conservative model; the exceptional performance of the reinforcement
provided by the steel fibres is not recognized by the model; ii) the utilization of characteristic values
when only three specimens are used, may be also very conservative, for the reasons already exposed.
These two aspects show that the characterization of SFRC must be done with a higher number of
specimens (10 or 12 seem to be a reasonable quantity) in order to reach less influence of deviations.
Otherwise, with such a conservative formulation to quantify the influence of the steel fibres
reinforcement, it will be impossible to gain the structural designers confidence in using the
technology of SFRC.
5.7. Numerical Strategy
5.7.1. Introduction
Previous research indicated that fracture mode I propagation can be simulated using a tri-linear
softening diagram (see Figure 5.9), whose parameters (mode I fracture energy, IfG , and values of
,crn iε and ,
crn iσ that define the shape of the softening diagram) can be obtained performing inverse
analysis with the force-deflection data registered in three-point notched beam bending tests carried
out according to the RILEM TC 162-TDF recommendations.
n,ucrε
crD
n1Dcr
Dcr
n2
n3
ε crn
σ n cr
n,3crε n,2
crε
σ n,1 cr
σ n,3 cr
gf = Gf / lb σ n,2 cr
nsecDcr
,f n
b
Gl
Figure 5.9: Tri-linear normal stress - normal strain diagram to simulate the fracture mode I crack propagation
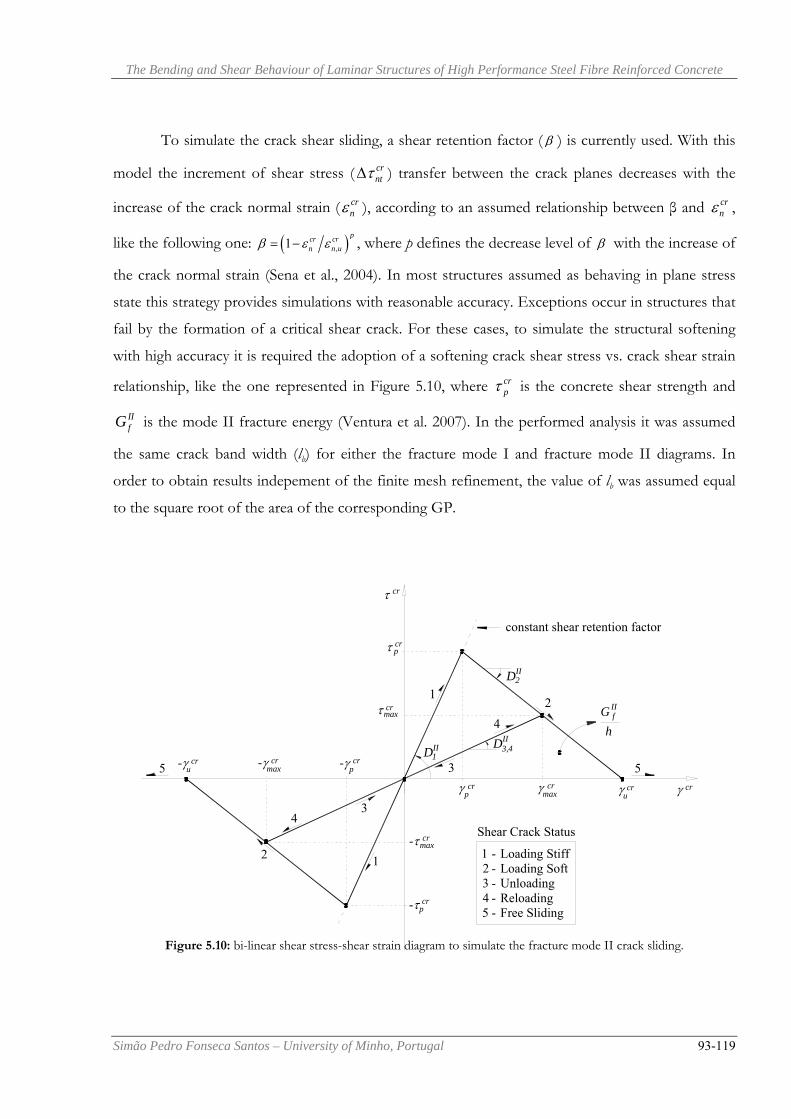
The Bending and Shear Behaviour of Laminar Structures of High Performance Steel Fibre Reinforced Concrete
Simão Pedro Fonseca Santos – University of Minho, Portugal 93-119
To simulate the crack shear sliding, a shear retention factor ( β ) is currently used. With this
model the increment of shear stress ( crntτΔ ) transfer between the crack planes decreases with the
increase of the crack normal strain ( crnε ), according to an assumed relationship between β and cr
nε ,
like the following one: ( ),1pcr cr
n n uβ ε ε= − , where p defines the decrease level of β with the increase of
the crack normal strain (Sena et al., 2004). In most structures assumed as behaving in plane stress
state this strategy provides simulations with reasonable accuracy. Exceptions occur in structures that
fail by the formation of a critical shear crack. For these cases, to simulate the structural softening
with high accuracy it is required the adoption of a softening crack shear stress vs. crack shear strain
relationship, like the one represented in Figure 5.10, where crpτ is the concrete shear strength and
IIfG is the mode II fracture energy (Ventura et al. 2007). In the performed analysis it was assumed
the same crack band width (lb) for either the fracture mode I and fracture mode II diagrams. In
order to obtain results indepement of the finite mesh refinement, the value of lb was assumed equal
to the square root of the area of the corresponding GP.
γγu
τ p
cr
τ cr
21
3
4
5
1 - Loading Stiff2 - Loading Soft3 - Unloading4 - Reloading5 - Free Sliding
DII
DII
constant shear retention factor
1
12
43
5γp
-γp
-τp
-γu
γmax
-γmax
DII3,4
2
τmax
-τmax
GIIf
h
Shear Crack Status
crcrcr
cr
cr
cr
cr
crcrcr
Figure 5.10: bi-linear shear stress-shear strain diagram to simulate the fracture mode II crack sliding.
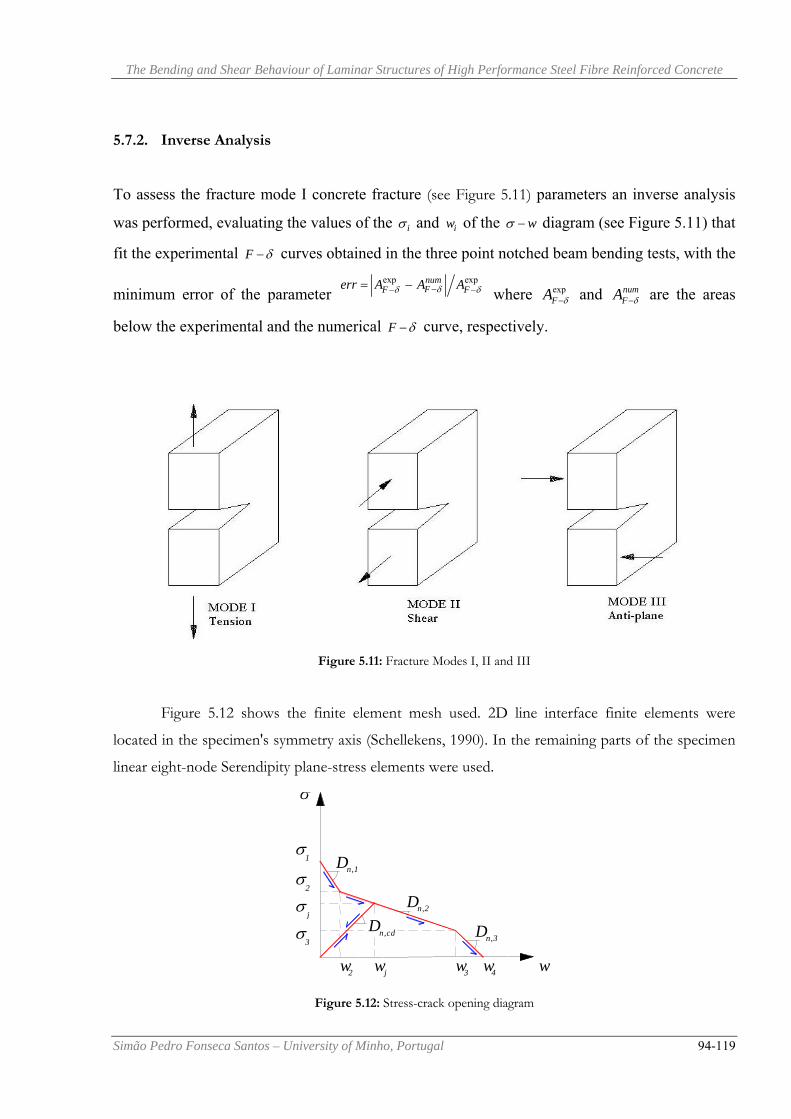
The Bending and Shear Behaviour of Laminar Structures of High Performance Steel Fibre Reinforced Concrete
Simão Pedro Fonseca Santos – University of Minho, Portugal 94-119
5.7.2. Inverse Analysis
To assess the fracture mode I concrete fracture (see Figure 5.11) parameters an inverse analysis
was performed, evaluating the values of the iσ and iw of the wσ − diagram (see Figure 5.11) that
fit the experimental F δ− curves obtained in the three point notched beam bending tests, with the
minimum error of the parameter exp expnum
FF Ferr A A Aδδ δ−− −= − where exp
δ−FA and numFA δ− are the areas
below the experimental and the numerical F δ− curve, respectively.
Figure 5.11: Fracture Modes I, II and III
Figure 5.12 shows the finite element mesh used. 2D line interface finite elements were
located in the specimen's symmetry axis (Schellekens, 1990). In the remaining parts of the specimen
linear eight-node Serendipity plane-stress elements were used.
n,1D
ww2
1 σ
σ 2
3 σ
Dn,2
n,3D
3w 4wjw
σ j
n,cdD
Figure 5.12: Stress-crack opening diagram
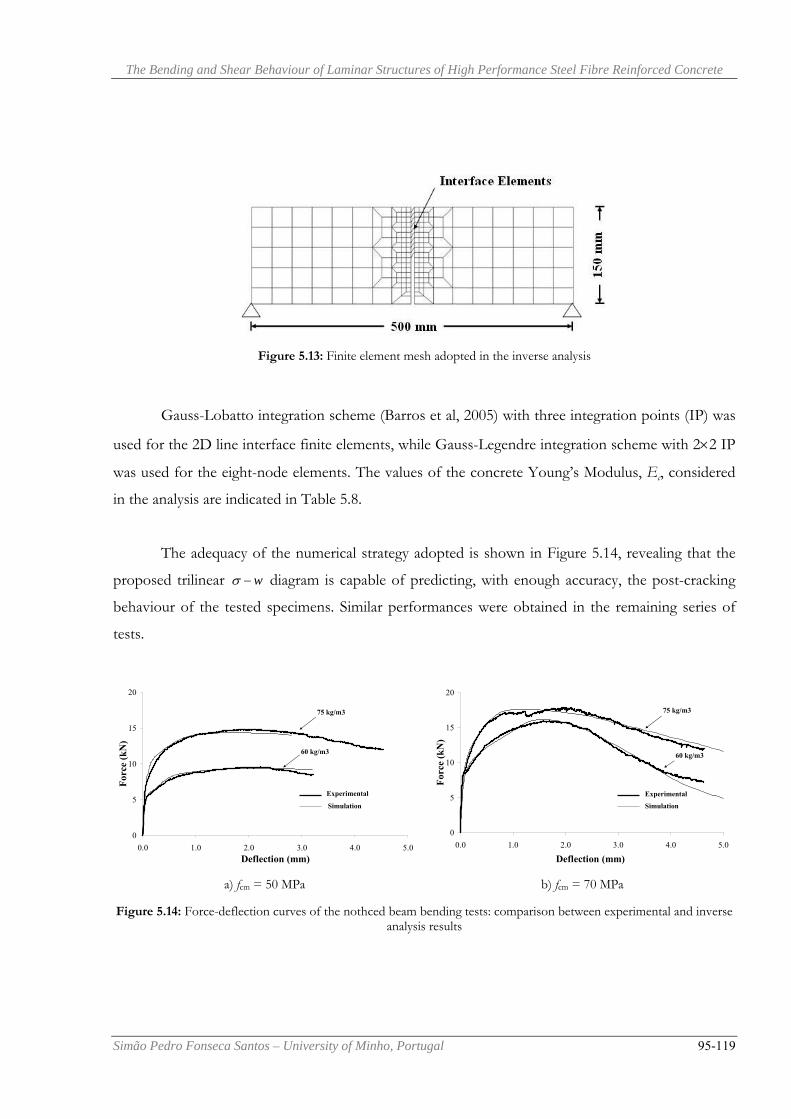
The Bending and Shear Behaviour of Laminar Structures of High Performance Steel Fibre Reinforced Concrete
Simão Pedro Fonseca Santos – University of Minho, Portugal 95-119
Figure 5.13: Finite element mesh adopted in the inverse analysis
Gauss-Lobatto integration scheme (Barros et al, 2005) with three integration points (IP) was
used for the 2D line interface finite elements, while Gauss-Legendre integration scheme with 2×2 IP
was used for the eight-node elements. The values of the concrete Young’s Modulus, Ec, considered
in the analysis are indicated in Table 5.8.
The adequacy of the numerical strategy adopted is shown in Figure 5.14, revealing that the
proposed trilinear wσ − diagram is capable of predicting, with enough accuracy, the post-cracking
behaviour of the tested specimens. Similar performances were obtained in the remaining series of
tests.
0
5
10
15
20
0.0 1.0 2.0 3.0 4.0 5.0Deflection (mm)
Forc
e (k
N)
75 kg/m3
60 kg/m3
Experimental
Simulation
0
5
10
15
20
0.0 1.0 2.0 3.0 4.0 5.0
Deflection (mm)
Forc
e (k
N)
60 kg/m3
75 kg/m3
Experimental
Simulation
a) fcm = 50 MPa b) fcm = 70 MPa
Figure 5.14: Force-deflection curves of the nothced beam bending tests: comparison between experimental and inverse analysis results

The Bending and Shear Behaviour of Laminar Structures of High Performance Steel Fibre Reinforced Concrete
Simão Pedro Fonseca Santos – University of Minho, Portugal 96-119
5.7.3. Simulations of the slabs’ tests
The performance of the crack shear softening model was assessed by the simulation of the
experimental tests with slab strips failing in shear. A finite element mesh of 406 plane stress
elements of 8 nodes, with a Gauss-Legendre 2×2 integration scheme, was used in these simulations.
The steel bars were simulated by perfect bonded two nodes elements, with 2 IP. Due to the
structural symmetry of the slabs, only half part of the slab was simulated. The values of the fracture
mode I parameters of the smeared crack consitutive model, used in the simulations, were the same
derived from the inverse analysis (see Table 5.8).
Table 5.8: Values of the parameters derived from inverse analysis
Series Tri-linear stress-crack opening law
Ec (N/mm2)
crn,1σ
(N/mm2) ω2 α1 ω 3 α2 ω 4
fcm50_FC60 37045 1.90 0.080 0.995 0.200 1.350 5.70 fcm50_FC75 39014 3.50 0.095 0.995 0.350 1.200 8.00
Note that, in order to use the values of the inverse analysis in a smear crack model like the
one used in the simulation of the slab strips, the ξi and αi had to be calculated. The first intent of
simulation of the slab strips was done with the values that came out from this calculation (see Table
5.9).
Table 5.9: Values of the parameters used in the first intent of simulation
Series
Tri-linear stress-crack opening law
Ec (N/mm2)
crn,1σ
(N/mm2) ξ1= ω2/ ω4 α1 ξ2= ω3/ ω4 α2
IfG
(N/mm) fcm50_FC60 37045 1.90 0.014 0.995 0.035 1.350 3.200 fcm50_FC75 39014 3.50 0.012 0.995 0.044 1.200 5.140
Note: the values of Gf correspond to the area above the tri-linear stress-crack opening diagram With these values, the model doesn’t reach the convergence at the second combination. For
this reason, no curve from the simulation with these values is presented. So, the parameters of the
tri-linear tension softening model that assure the high accuracy between the experimental and the
simulation curves were investigated. These values are presented in table 5.10.
This fact shows that the mode I fracture (the only one considered in the inverse analysis) is
not the only one that commands the behaviour of elements failing in shear: the mode II fracture
influences this behaviour, as it was expected. So, the direct utilization of the parameters from inverse

The Bending and Shear Behaviour of Laminar Structures of High Performance Steel Fibre Reinforced Concrete
Simão Pedro Fonseca Santos – University of Minho, Portugal 97-119
analysis – a procedure that would be very useful and fast to simulate the behaviour of laminar
structures – can’t be used in elements failing in shear. Other strategies must be followed.
Table 5.10: Values of the parameters of the Tri-linear tension softening diagram
Series
Tri-linear tension softening diagram Softening crack shear stress-strain diagram
Ec (N/mm2)
crn,1σ
(N/mm2) ξ1 α1 ξ2 α2
IfG
(N/mm)
crpτ
(N/mm2)
IIfG
(N/mm) β
fcm50_FC60 37045 1.90 0.002 0.950 0.035 1.350 3.200 3.40 5.20 0.5 fcm50_FC75 39014 3.50 0.001 0.950 0.044 1.200 5.140 3.00 3.10 0.5
cr cr1 n,2 n,1/α σ σ= , 2 ,3 ,1/cr cr
n nα σ σ= , 1 ,2 ,/cr crn n uξ ε ε= and 2 ,3 ,/cr cr
n n uξ ε ε= ; threshold angle=30º, Poisson’s coefficient=0.2; p=2 was
assumed to define β in the simulations based on the concept of shear retention factor
Figure 5.14 compares the force-midspan deflection curves registered experimentally with
those obtained numerically. It is verified that adopting the concept of shear retention factor, the
numerical model estimates a load carrying capacity higher than the one recorded experimentally, due
to the fact that instead of the shear failure mode observed experimentally, the model predicted a
flexural failure mode. However, if a shear softening diagram is used, the model predicts with high
accuracy the load carrying capacity of the beams, and the structural softening registered in the
experimental tests was also captured in the numerical simulations, inspite of its incapacity of
predicting the abrupt load decay occurred in the experimental tests after peak load. Since
experimental data to characterize the crack shear softening diagrama are not available, the values of crpτ and II
fG were estimated from back fitting analysis in order to assure a high precision prediction
of the peak load of the tested beams.
0
50
100
150
200
250
300
0.0 2.0 4.0 6.0 8.0 10.0
Displacement at midspan (mm)
Loa
d (k
N)
ExperimentalNumerical (shear softening)
60 kg/m3
75 kg/m3
75 kg/m3
60 kg/m3
Numerical (shear retention)
75 kg/m3
60 kg/m3
Figure 5.15: Relationships between the load and the displacement at the midspan
of the RC beams (fcm = 50 MPa)

The Bending and Shear Behaviour of Laminar Structures of High Performance Steel Fibre Reinforced Concrete
Simão Pedro Fonseca Santos – University of Minho, Portugal 98-119
5.8. Conclusions
The experimental program evinced that steel fibre reinforcement provides a significant
contribution for the shear resistance of high strength concrete laminar structures. A content of 60
kg/m3 of hooked end steel fibres of an aspect-ratio of 80 provided an increase on the shear
resistance that varied from 88% to 92% for shallow beams of a concrete with an average
compressive strength ranging from 50 to 70 MPa. For 75 kg/m3 of these steel fibres, this increase
varied from 102 to 118%.
The formulation proposed by RILEM TC 126 – TDF for the evaluation of the contribution
of the fibre reinforcement for the shear resistance of concrete beams provided a safety factor of
about 2.18, while a safety factor of about 1.66 was obtained in the beams without steel fibres.
The inverse analysis was adopted to determine, indirectly, the values of the mode I fracture
parameters of the developed high strength steel fibre reinforced concrete. With these values, and
using a softening diagram for modelling the crack shear softening behaviour, the simulation of the
slab strip’s behaviour showed to be impossible. To reach a high accuracy in terms of the load
carrying capacity of the tested slabs, the values of ξ1 and α1 had to be changed. The utilization of the
mode I fracture parameters directly – which would be very useful to predict the behaviour of these
types of structures with a simple procedure – is insufficient. This fact shows that the mode II
fracture has influence in the behaviour of elements failing in shear, so the mode II fracture
parameters must be known.
The approach used in this chapter showed to be able to predict the occurrence of shear
failure mode, since after peak load the numerical analysis estimated the development of a structural
softening phase. Adopting the conventional concept of shear retention factor for modelling the
shear stiffness degradation with the crack opening propagation, a flexural failure mode was
predicted, which conducted to ultimate loads higher than the values registered in the experimental
tests.

The Bending and Shear Behaviour of Laminar Structures of High Performance Steel Fibre Reinforced Concrete
Simão Pedro Fonseca Santos – University of Minho, Portugal 99-119
6. CONCLUSIONS AND FUTURE WORK
6.1. Introduction
The development of Steel Fibre Reinforced Concrete compositions that can be applicable in the
construction industry showed to have appropriate properties for façade panels and underground
infrastructures with redundant supports. No special requirements in terms of constituent materials
are needed: this allows the development cost competitive SFRC compositions, since it can be
produced everywhere. The designed steel fibre reinforced self-compacting concrete (SFRSCC) has
met all the requirements of self-compactability and great mechanical properties, with cement
contents between 300 and 400 kg of cement per m3 of concrete.
6.2. Main conclusions
6.2.1. Steel fibre reinforced self-compacting concrete for façade elements
The production of a real scale prototype of a façade panel, in a precast industry plant, was
successful, showing that the usage of SFRSCC in this type of industry can be very powerful, not only
from the production and application point of view, but also structurally, since the produced panel
achieved adequate load carrying capacity without any ordinary reinforcement. Since vibration is not
necessary in SFRSCC, the life cycle of the moulds can be potentially increased. Furthermore, this
absence of vibration turns the environment within the plant, undoubtedly, much more healthy.

The Bending and Shear Behaviour of Laminar Structures of High Performance Steel Fibre Reinforced Concrete
Simão Pedro Fonseca Santos – University of Minho, Portugal 100-119
6.2.2. Steel fibre reinforced self-compacting concrete for elements failing in bending
Using a content of cement of 380 kg per m3 of concrete, a SFRSCC of strength class C70/85 was
produced, which shows that the mix design method developed in previous research is able to
develop High Strength SFRSCC at a competitive cost.
The force-deflection relationships obtained in the slab strip tests evidenced that 45 kg per m3
of concrete of the selected fibres contributed significantly for the slabs load carrying capacity from
the incipient crack formation stage. The increase in terms of slab load carrying capacity provided by
fibre reinforcement was as significant as lower was the percentage of the conventional
reinforcement ( slρ ).
In terms of the slab maximum load carrying capacity, this content of steel fibres provided an
increase that varied from 23% up to 74%.
Applying a methodology used in the design practice of reinforced concrete structures an
equivalence between the content of fibres and a cross section area of a fictitious longitudinal
reinforcement ( fictslA ) was determined. From the obtained results it was verified that 45 kg per m3 of
concrete is equivalent, in terms of flexural resistance, to a fictslA of 74 mm2, 87 mm2 and 75 mm2 for
the slabs with slρ =0.20, 0.36 and 0.56, respectively, which corresponds to a 87%, 58% and 32% of
the cross sectional area of the real reinforcement applied in the tested slabs.
6.2.3. Fibre reinforced concrete for elements failing in shear
The improvement on the structural properties of the elements done with High Performance Steel
Fibre Reinforced (HPSFRC) was proved. The load carrying capacity of elements failing in shear
increased significantly. Applying a methodology used in the design practice of reinforced concrete
structures, equivalence between the content of fibres and a cross section area of a fictitious
longitudinal reinforcement can be defined.

The Bending and Shear Behaviour of Laminar Structures of High Performance Steel Fibre Reinforced Concrete
Simão Pedro Fonseca Santos – University of Minho, Portugal 101-119
The shear load capacity of slab strips of HPSFRC failing in shear was also significantly
increased (around two times) with the usage of steel fibres. This capacity increased with the dosage
of fibres. The number of flexural cracks formed up to the ocurrence of the shear failure crack
increased with the increase of the content of steel fibres instead the inclination of the shear failure
crack (angle of the shear crack plan with the beam longitudinal axis) decreased with the increase of
the content of fibres. A diffuse crack pattern occurred in the vicinity of the shear failure crack,
contributing for the increase of energy dissipation and for the more ductile failure mode observed in
HPSFRC beams, in comparison to HSC beams.
The formulation proposed by RILEM TC 126 – TDF for the evaluation of the contribution
of the fibre reinforcement for the shear resistance of concrete beams was used in the present work.
This formulation provided safety factors that increased in the elements with both ordinary
reinforcement and steel fibres when compared to the ones provided to plain concrete elements with
ordinary reinforcement only. A higher number of specimens must be used (10/12) in order to reach
less dispersion in the results: that dispersion is very unfavourable when few specimens are used,
since the calculation of characteristic values derived from the experimental tests is very sensible to a
reduced number of results.
6.2.4. Numerical strategies
A cross section layer model was used to determine the moment-curvature relationship, M-χ, of the
representative sections of slab strips failing in bending. This simple numerical strategy was able to
predict, with enough accuracy, the load-deflection response registered experimentally. It opens a
new window in the design of elements of HPSFRC, since the designer can easily predict the
structural behaviour of such elements.
The inverse analysis was adopted to determine, indirectly, the values of the mode I fracture
parameters of the developed high strength steel fibre reinforced concrete. With these values, and
using a softening diagram for modelling the crack shear softening behaviour, the simulation of the
slab strip’s behaviour showed to be impossible. To reach a high accuracy in terms of the load
carrying capacity of the tested slabs, the parameters of the tri-linear stress-normal strain had to be
changed. The utilization of the mode I fracture parameters directly is insufficient. This fact shows
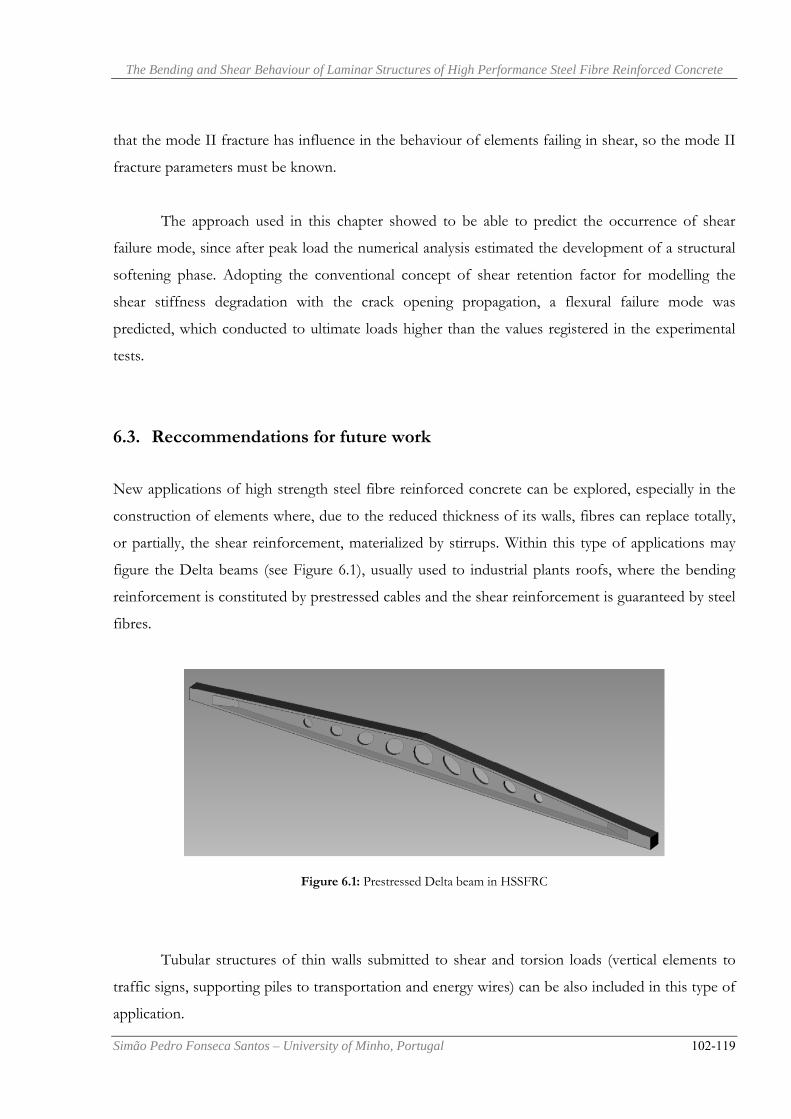
The Bending and Shear Behaviour of Laminar Structures of High Performance Steel Fibre Reinforced Concrete
Simão Pedro Fonseca Santos – University of Minho, Portugal 102-119
that the mode II fracture has influence in the behaviour of elements failing in shear, so the mode II
fracture parameters must be known.
The approach used in this chapter showed to be able to predict the occurrence of shear
failure mode, since after peak load the numerical analysis estimated the development of a structural
softening phase. Adopting the conventional concept of shear retention factor for modelling the
shear stiffness degradation with the crack opening propagation, a flexural failure mode was
predicted, which conducted to ultimate loads higher than the values registered in the experimental
tests.
6.3. Reccommendations for future work
New applications of high strength steel fibre reinforced concrete can be explored, especially in the
construction of elements where, due to the reduced thickness of its walls, fibres can replace totally,
or partially, the shear reinforcement, materialized by stirrups. Within this type of applications may
figure the Delta beams (see Figure 6.1), usually used to industrial plants roofs, where the bending
reinforcement is constituted by prestressed cables and the shear reinforcement is guaranteed by steel
fibres.
Figure 6.1: Prestressed Delta beam in HSSFRC
Tubular structures of thin walls submitted to shear and torsion loads (vertical elements to
traffic signs, supporting piles to transportation and energy wires) can be also included in this type of
application.

The Bending and Shear Behaviour of Laminar Structures of High Performance Steel Fibre Reinforced Concrete
Simão Pedro Fonseca Santos – University of Minho, Portugal 103-119
Underground structures, as box-culvert (see Figure 6.2) are also an example of elements
where stirrups can be replaced by an adequate system of fibre reinforcement.
Figure 6.2: Box-culvert.
One other type of applications consists in the construction of coffin beams to bridge decks,
where fibres can decrease the percentage of ordinary shear reinforcement or increase the shear
resistance of these elements. The utilization of fibre reinforced concrete in piers unions can conduct
to a reduction of the loops in the piers and stirrups in the beams or increase considerably the
capacity of the column-beam intersection to dissipate energy, with the consequent benefits in terms
of structural safety to structures with high seismic risk. The application of steel fibres in slab-
columns connexions can increase the punching resistance of the slab.
As it can be see, fibre reinforced concrete is a high potential material. However, this
potential must be evaluated and proved by experimental research and by the development of
analytical and numerical models to make the characterization of this material. With this data, the
structural designers can count on the benefits of the addition of steel fibres in a rational way, based
in technical-scientific experience. Researchers must be focused in the development of design rules,
in a similar format to the Eurocodes. Only that way the designers will prescribe the usage of steel
fibres in many cases where they are truly added value to the economy and safety of the structure.

The Bending and Shear Behaviour of Laminar Structures of High Performance Steel Fibre Reinforced Concrete
Simão Pedro Fonseca Santos – University of Minho, Portugal 104-119
REFERENCES
ACI SP 182 (1988). Structural Applications of Fiber Reinforced Concrete. American Concrete Institute, Farmington Hills
ACI Committee 544 (1996). State-of-the-Art Report on Fiber Reinforced Concrete. American Concrete Institute, USA
ALAVERA, P. Et Al (2005). Utilización de Hormigón Armado con Alta Dosificación de Fibras de Acero en la Rehabilitación de Un edificio Industrial. Proceedings of III Congreso de Puentes y Estructuras de Edificación de la Asociación Científico-Técnica del Hormigón Estructural, Zaragoza
AL-TA’AN, S.A. and AL-FEEL, J.R. (1990). Evaluation of Shear Strength of Fibre-Reinforced Concrete Beams. Cement and Concrete Composites, 12, (87-94)
BARROS, J.A.O. (1995). Behaviour of fibre reinforced concrete – experimental analysis and numerical simulation. PhD Thesis, Departamento de Engenharia Civil, Faculdade de Engenharia da Universidade do Porto, 502 p (in portuguese).
BARROS, J.A.O. and FIGUEIRAS, J.A. (1998). Experimental behaviour of fiber concrete slabs on soil. Journal Mechanics of Cohesive-frictional Materials, 3, p. 277-290
BARROS, J.A.O. Et Al (2000), Reinforced concrete under cyclic loading, 12th World Conference on Earthquake
Engineering, Auckland New Zeeland, p. 0772 1 a 0772 8, 30 January to 4 February.
BARROS, J.A.O. Et Al (2005). Post-Cracking Behaviour of Steel Fibre Reinforced Concrete. RILEM Materials and Structures Journal, 38(275), p. 47-56.
BARROS, J.A.O. and FORTES, A. S. (2005 a). Flexural Strengthening of Concrete Beams with CFRP Laminates Bonded into Slits. Journal of Cement and Concrete Composites, V 27, No 4, 2005, pp. 471-480.
BARROS, J.A.O., SANTOS, S.P.F. and FREITAS, M.P.A.F. (2006). Assessing the performance of steel fibres for the reinforcement of SCC laminar structures. Technical report CT_Cons/130406, Civitest, 27 p. (in Portuguese – Confidential document)
The Bending and Shear Behaviour of Laminar Structures of High Performance Steel Fibre Reinforced Concrete
Simão Pedro Fonseca Santos – University of Minho, Portugal 105-119
BARROS, J.A.O., PEREIRA, E.B. and SANTOS, S.P.F. (2007). Lightweight panels of steel fiber reinforced self-compacting concrete, Journal of Materials in Civil Engineering, 19(4), 295-304
BARTOS, P. J.M. (1992). Fresh Concrete: Properties and Tests, Elsevier Science Publishers B. V., London.
BARTOS, P.J.M. (2000). Key Properties of Fresh Self-compacting Concrete: A case for Standardisation. Proceedings of Seminar on Self-Compacting Concrete, Malmö/Copenhagen, pp.21-26.
BARTOS, P. J. M. and GRAUERS, M. (1999). Self-Compacting Concrete. Concrete, Vol. 33, No.4, pp. 9-13.
BRITE-EURAM (2002). Rational Production and Improved Working Environment through using Self Compacting Concrete - Brite-EuRam project BRPR-CT96-0366. Technical report, Brite EuRam / Swedish Cement and Concrete Research Institute.
CASANOVA, P. (1995). Bétons de fibres métalliques: du materiau à la structure, PhD Thesis, École Nationale des Ponts et Chaussées CASANOVA Et Al (2000). Can steel fibres replace transverse reinforcement in reinforced concrete beams?. ACI Material Journal, No.94, pp.341-354 CHOULLI, Y. Et Al (2005), in “III Congresso de Puentes y Estructuras de Edificación de la Asociación Científico-Técnica del Hormigón Estructural”, Zaragoza, Spain
CLADERA, A. and MARI, A.R. (2004). Shear design for reinforced normal and high-strength concrete beams using artificial neural networks. Part II: Beams with Stirrups. Engineering Structures, June, Pages 927-936
CNR-DT 204/2006, Istruzioni per la Progettazione, l’Esecuzione ed il Controllo di Strutture di Calcestruzzo Fibrorinforzato, Version of 30 June 2006.
Di PRISCO, M and PLIZZARI, G. (2004). Precast SFRC Elements: from Material Properties to Structural Applications. 6th RILEM Symposium on Fibre-Reinforced Concretes (FRC) – BEFIB, 20-22 September, Varenna, Italy Di PRISCO, M et al (2004). 6th RILEM Symposium on Fibre-Reinforced Concretes (FRC) – BEFIB, 20-22 September, Varenna, Italy
DOMONE, P.L. (2006). Self-Compacting Concrete – An analysis of 11 years of case studies, Cement & Concrete Composites 28, pp. 197–208
EFNARC (1996). European Federation of Producers and Applications of Specialist Products for Structures. European Specification for Sprayed concrete. EFNARC, Loughborough University

The Bending and Shear Behaviour of Laminar Structures of High Performance Steel Fibre Reinforced Concrete
Simão Pedro Fonseca Santos – University of Minho, Portugal 106-119
EFNARC (2002). Specification and Guidelines for Self-Compacting Concrete. ISBN 0 9539733 4 4, 32 pp.
EFSTATHIADIS, E. (1978). Greek Concrete of three milleniums. Public Works Research Centre.
EN 12350-2 (2000). Testing fresh concrete. Slump test. ISBN 0580352994, 8 pp.
EUROCODE 2: Design of concrete structures - Part 1-1: General rules and rules for buildings. Comité Européen de Normalisation (CEN), EN 1992-1-1:2004: E, 2004, Brussels.
FAILLA Et Al (2002). Structural design of prestressed precast roof elements made with steel fibre reinforced concrete, in BIBM 2002, Proceedings of the International Conference, Instambul, May 1-4
FALKNER, H. and TEUTSCH, M. (1993). Comparative investigations of plain and steel fibre reinforced industrial ground slabs, Institut fur Baustoffe, Massivbau und brandschutz, nº 102.
GETTU, R. Et Al (2004). Steel Fiber Reinforced Concrete for the Barcelona Metro Line 9 Tunnel Lining. 6th RILEM Symposium on Fibre-Reinforced Concretes (FRC) – BEFIB, 20-22 September, Varenna, Italy
GIMPEL, J. (1967). The Cathedral Builders. Evergreen Books, Ltd.
GOMES, P.C.C. (2002), Optimization and characterization of high-strength self-compacting concrete, PhD Thesis, UPC, Barcelona, Spain
GOPALARATNAM, V.S. and SHAH, S.P. (1987). Failure mechanisms and fracture of fibre reinforced concrete. Fiber Reinforced Concrete Properties and Applications, edited by S.P. Shah and G.B. Batson, SP-105, ACI, pp.1-26.
GROTH, P. and NEMEGEER, D. (1999). The Use of Steel Fibres in Self-Compacting Concrete. Proc. 1st International RILEM Symposium on Self-Compacting Concrete (Stockholm, Sweden), A. Skarendahl and Ö. Petersson (editors), RILEM Publications S.A.R.L, pp. 497-508.
HAC (2008): 1st Congress on Self-Compacting Concrete, Valencia, 18th and 19th February (www.hac2008.es)
IDORN, G.M. (1997). Concrete Progress - from antiquity to the third millenium. Thomas Telford.
ISO 1920-2 (2005). Testing of Concrete – Part 2: Properties of fresh concrete. International Organization for Standardization, replaces ISO 4109, 1980
JSCE – F503 (1990). Method of Test for the Slump Flow of Concrete. Standards of Japan Society of Civil Engineers.

The Bending and Shear Behaviour of Laminar Structures of High Performance Steel Fibre Reinforced Concrete
Simão Pedro Fonseca Santos – University of Minho, Portugal 107-119
KEARSLEY, E.P. and MOSTERT, H.F. (2004). Optimizing Mix Composition for Steel Fibre Reinforced Concrete with Ultra High Flexural Strength. 6th RILEM Symposium on Fibre-Reinforced Concretes (FRC) – BEFIB, 20-22 September, Varenna, Italy
le CHÂTELIER, H. (1904). Experimental Studies on the production of Hydraulic Mortars.
LIMA, J.A., MONTEIRO, V. and MUN, M. (1985) Betão Armado: esforços axiais e de flexão (REBAP – 83), LNEC 1985. (in Portuguese)
LOURENÇO, L.A.P., BARROS, J.A.O. and SANTOS, S.P.F. (2007). High strength and ductile fibrous concrete of enhanced fire resistance, Materiais 2007, FEUP, April
MA, Z., TADROS, M.K. and BAISHYA, M. (1997). Shear Limit of HPC Bridges I – Girders. International Symposium on High Performance Concrete, New Orleans, Lousiana, October
MAS, PERE BORRALERAS, (2005). Hormigón Autocompactable para Aplicaciones Convencionales. III Congresso de Puentes y Estructuras de Edificación de la Asociación Científico-Técnica del Hormigón Estructural, Zaragoza
MEDA Et Al (2005). Shear behavior of steel fibre reinforced concrete beams, Materials and Structures Journal 38, April, pp. 343-353
NAAMAN, A.E. and Reinhardt, H.W. (eds) (2003). High Performance Fiber Reinforced Cement Composites – HPFRCC 4. RILEM Proc., PRO 30, RILEM Publications S.A.R.L., Bagneux, France
OKAMURA, H. (1997). Self-Compacting High-Performance Concrete. Concrete International, Vol. 19, No. 7, pp. 50-54.
OKAMURA, H. and OUCHI, M. (1999). Self-Compacting Concrete. Development, Present use and Future. Proc. 1st International RILEM Symposium on Self-Compacting Concrete (Stockholm, Sweden), A. Skarendhal and O.Pstersson (editors), RILEM Publications S.A.R.L
OZAWA, K., SAKATA, N. and OKAMURA, H. (1994). Evaluation of Self Compactability of Fresh Concrete Using the Funnel Test. Proceedings of the Japan Society of Civil Engineers, Vol. 23, No. 490, pp. 71-80, (in Japanese).
PEREIRA, E.N.B. (2006). Steel Fibre Reinforced Self-compacting Concrete: from material to mechanical behaviour, dissertation for Pedagogical and Scientific Aptitude Proofs, Department Civil Engineering, University of Minho, 188 pp, <http://www.civil.uminho.pt/composites>
PETERSSON, Ö., BILLBERG, P. and VAN, B.K. (1996). A Model for Self-Compacting Concrete. Proc. International RILEM Conference on Production Methods and Workability of Concrete, P.J.M. Bartos, D.L. Marrs and D.J. Cleand (editors), E & FN Spon, pp. 483-492.

The Bending and Shear Behaviour of Laminar Structures of High Performance Steel Fibre Reinforced Concrete
Simão Pedro Fonseca Santos – University of Minho, Portugal 108-119
PLIZZARI, G.A. Et Al (2000). Postpeak behavior of fibre reinforced concrete under cyclic tensile loads. ACI Materials Journal 97, pp. 182-192 REINHARDT, H W. and NAAMAN, A.E. (eds), (1999). High Performance Fiber Reinforced Cement Composites – HPFRCC 3. RILEM Proc., PRO 6, RILEM Publications S.A.R.L., Cachan, France
ROONEY, M. and BARTOS, P.M.J. (2001). Development of the settlement column segregation test for fresh self-compacting concrete (SCC). Second International Symposium on SCC, Tokyo, Japan.
ROSHANI, D. (1996). Shear Capacity of Steel Fiber Reinforced Concrete Beams. MSc Thesis, Göteborg University
ROSSI, P. and CHANVILLARD, G. (eds) (2000). 5th RILEM Symp. On Fibre Reinforced Concretes (BEFIB 2000), RILEM Publications S.A.R.L., Cachan, France
SCHELLEKENS, J.C.J. (1990). Interface elements in finite element analysis. TU-Delft report 25.2-90-5-17/TNO-IBBC report BI-90-165, October.
SCHIESSEL, A. and ZILCH, K. (2001). The effects of the modified composition of SCC on Shear Bond Behavior. The Second International Symposium on Self-Compacting Concrete, Tokyo, Japan
SEDRAN, T. and De LARRARD, F. (1999). Optimization of Self-Compacting Concrete Thanks to Packing Model. Proc. 1st International RILEM Symposium on Self-Compacting Concrete (Stockholm, Sweden), A. Skarendahl and Ö. Petersson (editors), pp. 321-332.
SENA-CRUZ, J. M. Et Al. (2004). Stress-crack opening relationship of enhanced performance concrete. 9th Portuguese Conference on Fracture, ESTSetúbal, Portugal, p. 395-403, 18-20 February SMEATON, J. (1813). Narrative of the building and a description of the construction of the Eddystone Lighthouse.
SONEBI, M., BARTOS, P.J.M., ZHU, W., GIBBS, J. and TAMIMI, A. (2000). Task 4 – Properties of Hardened Concrete, SCC, Brite EuRam Contract BRPR-CT96-0366.
OLIVEIRA e SOUSA, J. and GETTU, R. (2004). Inverse Analysis of Notched-Beam Test Data for obtaining Tensile Stress-Crack Opening Relation of Fibre Reinforced Concrete. 6th RILEM Symposium on Fibre-Reinforced Concretes (FRC) – BEFIB, 20-22 September, Varenna, Italy
SWAMY, R.N. Et Al (1993). Influence of Steel Fibers on the Shear Resistance of Lightweight Concrete I-Beams. ACI Journal, Proceedings V.90, No.1 January-February, pp. 103-114. SWAMY, R.N. (1975). Fibre Reinforcement of Cement and Concrete. Materials and Structures, Research and Testing (RILEM, Paris), nº.48, May-June 1975, pp.235-254

The Bending and Shear Behaviour of Laminar Structures of High Performance Steel Fibre Reinforced Concrete
Simão Pedro Fonseca Santos – University of Minho, Portugal 109-119
SWAMY, R.N. and AL-TA’AN, S.A. (1981). Deformation and Ultimate Strength in Flexure of Reinforced Concrete Beams made with Steel Fibre Concrete. ACI Journal, Proceedings V.78, No.5, Sept-Oct., pp. 395-405.
STANLEY, C.S. (1979). Highlights in the history of concrete. Wexham Springs.
VANDEWALLE, L. Et Al (2000a). Test and design methods for steel fiber reinforced concrete. Recommendations for bending test. RILEM Materials and Structures Journal, 33 (225), 3-5.
VANDEWALLE, L. Et Al (2000b). Test and design methods for steel fiber reinforced concrete. Recommendations for σ-ε design method. RILEM Materials and Structures Journal, 33 (226), 75-81.
VANDEWALLE, L. Et Al (2002). Test and design methods for steel fibre reinforced concrete-Final Recommendation. Materials and Structures 35(253): 579-582.
VAN MIER, J.G.M. (1984). Strain-softening of concrete under multiaxial loading conditions, Dissertation, Delft
University of Technology.
VENTURA Et Al (2007). Crack constitutive model to simulate the behavior of fiber reinforced concrete
structures failing in punching. CMNE 2007 - Congress on Numerical Methods in Engineering and XXVIII
CILAMCE - Iberian Latin American Congress on Computational Methods in Engineering, Abstract pp. 287, Paper nº
232 published in CD – FEUP, 13 pp., Porto.
VITRUVIUS, P. (1931). De Architectura.

The Bending and Shear Behaviour of Laminar Structures of High Performance Steel Fibre Reinforced Concrete
Simão Pedro Fonseca Santos – University of Minho, Portugal 110-119
APPENDIX
Slabs failing in bending
• Φ 6mm reinforced series
0
20
40
60
80
100
120
0 5 10 15
Displacement at midspan (mm)
Loa
d (k
N)
0
20
40
60
80
100
120
0 5 10 15
Displacement at midspan (mm)
Loa
d (k
N)
Slab 1: fi 6_NoFibres_1 Slab 2: fi 6_NoFibres_2
0
20
40
60
80
100
120
0 5 10 15
Displacement at midspan (mm)
Loa
d (k
N)
0
20
40
60
80
100
120
0 5 10 15
Displacement at midspan (mm)
Loa
d (k
N)
Slab 3: fi 6_FC 45_1 Slab 4: fi 6_FC 45_2
0
20
40
60
80
100
120
0 5 10 15
Displacement at midspan (mm)
Loa
d (k
N)
0
20
40
60
80
100
120
0 5 10 15
Displacement at midspan (mm)
Loa
d (k
N)
Slab 5: fi 6_FC 60_1 Slab 6: fi 6_FC 60_2

The Bending and Shear Behaviour of Laminar Structures of High Performance Steel Fibre Reinforced Concrete
Simão Pedro Fonseca Santos – University of Minho, Portugal 111-119
• Φ 8mm reinforced series
0
20
40
60
80
100
120
0 5 10 15
Displacement at midspan (mm)
Loa
d (k
N)
0
20
40
60
80
100
120
0 5 10 15
Displacement at midspan (mm)
Loa
d (k
N)
Slab 7: fi 8_NoFibres_1 Slab 8: fi 8_NoFibres_2
0
20
40
60
80
100
120
0 5 10 15
Displacement at midspan (mm)
Loa
d (k
N)
0
20
40
60
80
100
120
0 5 10 15
Displacement at midspan (mm)
Loa
d (k
N)
Slab 9: fi 8_FC 45_1 Slab 10: fi 8_FC 45_2
0
20
40
60
80
100
120
0 5 10 15
Displacement at midspan (mm)
Loa
d (k
N)
0
20
40
60
80
100
120
0 5 10 15
Displacement at midspan (mm)
Loa
d (k
N)
Slab 11: fi 8_FC 60_1 Slab 12: fi 8_FC 60_2

The Bending and Shear Behaviour of Laminar Structures of High Performance Steel Fibre Reinforced Concrete
Simão Pedro Fonseca Santos – University of Minho, Portugal 112-119
• Φ 10mm reinforced series
0
20
40
60
80
100
120
0 5 10 15
Displacement at midspan (mm)
Loa
d (k
N)
0
20
40
60
80
100
120
0 5 10 15
Displacement at midspan (mm)
Loa
d (k
N)
Slab 13: fi 10_NoFibres_1 Slab 14: fi 10_NoFibres_2
0
20
40
60
80
100
120
0 5 10 15
Displacement at midspan (mm)
Loa
d (k
N)
0
20
40
60
80
100
120
0 5 10 15
Displacement at midspan (mm)
Loa
d (k
N)
Slab 15: fi 10_FC 45_1 Slab 16: fi 10_FC 45_2

The Bending and Shear Behaviour of Laminar Structures of High Performance Steel Fibre Reinforced Concrete
Simão Pedro Fonseca Santos – University of Minho, Portugal 113-119
Slabs failing in shear
• Rilem Beams
0
5
10
15
20
0 1 2 3 4 5
Displacement (mm)
Stre
ss (M
Pa)
0
5
10
15
20
0 1 2 3 4 5
Displacement (mm)
Stre
ss (M
Pa)
Beam 1: fcm50_NoFibres_1 Beam 2: fcm50_NoFibres_2
0
5
10
15
20
0 1 2 3 4 5
Displacement (mm)
Stre
ss (M
Pa)
Beam 3: fcm50_NoFibres_3
0
5
10
15
20
0 1 2 3 4 5
Displacement (mm)
Stre
ss (M
Pa)
0
5
10
15
20
0 1 2 3 4 5
Displacement (mm)
Stre
ss (M
Pa)
Beam 5: fcm50_FC60_5 Beam 6: fcm50_ FC60_6
0
5
10
15
20
0 1 2 3 4 5
Displacement (mm)
Stre
ss (M
Pa)
Beam 7: fcm50_ FC60_7

The Bending and Shear Behaviour of Laminar Structures of High Performance Steel Fibre Reinforced Concrete
Simão Pedro Fonseca Santos – University of Minho, Portugal 114-119
0
5
10
15
20
0 1 2 3 4 5
Displacement (mm)
Stre
ss (M
Pa)
0
5
10
15
20
0 1 2 3 4 5
Displacement (mm)
Stre
ss (M
Pa)
Beam 9: fcm50_FC75_9 Beam 10: fcm50_FC75_10
0
5
10
15
20
0 1 2 3 4 5
Displacement (mm)
Stre
ss (M
Pa)
Beam 11: fcm50_FC75_11
0
5
10
15
20
0 1 2 3 4 5
Displacement (mm)
Stre
ss (M
Pa)
0
5
10
15
20
0 1 2 3 4 5
Displacement (mm)
Stre
ss (M
Pa)
Beam 13: fcm70_NoFibres_13 Beam 14: fcm70_NoFibres_14
0
5
10
15
20
0 1 2 3 4 5
Displacement (mm)
Stre
ss (M
Pa)
Beam 15: fcm70_NoFibres_15

The Bending and Shear Behaviour of Laminar Structures of High Performance Steel Fibre Reinforced Concrete
Simão Pedro Fonseca Santos – University of Minho, Portugal 115-119
0
5
10
15
20
0 1 2 3 4 5
Displacement (mm)
Stre
ss (M
Pa)
0
5
10
15
20
0 1 2 3 4 5
Displacement (mm)
Stre
ss (M
Pa)
Beam 17: fcm50_FC60_17 Beam 18: fcm50_FC60_18
0
5
10
15
20
0 1 2 3 4 5
Displacement (mm)
Stre
ss (M
Pa)
Beam 19: fcm50_FC60_19
0
5
10
15
20
0 1 2 3 4 5
Displacement (mm)
Stre
ss (M
Pa)
0
5
10
15
20
0 1 2 3 4 5
Displacement (mm)
Stre
ss (M
Pa)
Beam 21: fcm70_NoFibres_21 Beam 24: fcm70_NoFibres_24

The Bending and Shear Behaviour of Laminar Structures of High Performance Steel Fibre Reinforced Concrete
Simão Pedro Fonseca Santos – University of Minho, Portugal 116-119
Slab Strips: fcm = 50Mpa Series
0
50
100
150
200
250
300
0 2 4 6 8 10
Displacement (mm)
Loa
d (k
N)
0
50
100
150
200
250
300
0 2 4 6 8 10Displacement (mm)
Loa
d (k
N)
Slab Strip 1: fcm50_NoFibres_Reinforced Slab Strip 2: fcm50_NoFibres_Reinforced
No graphic or crack pattern available
15.43
0.000
5
10
15
20
25
0 0.02 0.04 0.06 0.08 0.1
Displacement (mm)
Loa
d (k
N)
Slab Strip 3: fcm50_NoFibres_Without Reinf. Slab Strip4: fcm50_NoFibres_Without Reinf.
0
50
100
150
200
250
300
0 2 4 6 8 10
Displacement (mm)
Loa
d (k
N)
0
50
100
150
200
250
300
0 2 4 6 8 10Displacement (mm)
Loa
d (k
N)
Slab Strip 5: fcm50_FC60_Reinforced Slab Strip 6: fcm50_FC60_Reinforced

The Bending and Shear Behaviour of Laminar Structures of High Performance Steel Fibre Reinforced Concrete
Simão Pedro Fonseca Santos – University of Minho, Portugal 117-119
0
10
20
30
40
50
0 2 4 6 8 10
Displacement (mm)
Loa
d (k
N)
0
10
20
30
40
50
0 2 4 6 8 10
Displacement (mm)
Loa
d (k
N)
Slab Strip 7: fcm50_FC60_Without Reinf. Slab Strip 8: fcm50_FC60_Without Reinf.
0
50
100
150
200
250
300
0 2 4 6 8 10
Displacement (mm)
Loa
d (k
N)
0
50
100
150
200
250
300
0 2 4 6 8 10
Displacement (mm)
Loa
d (k
N)
Slab Strip 9: fcm50_FC75_Reinforced Slab Strip 10: fcm50_FC75_Reinforced
0
10
20
30
40
50
0 2 4 6 8 10
Displacement (mm)
Loa
d (k
N)
0
10
20
30
40
50
0 2 4 6 8 10
Displacement (mm)
Loa
d (k
N)
Slab Strip 11: fcm50_FC75_Without Reinf. Slab Strip 12: fcm50_FC75_Without Reinf.

The Bending and Shear Behaviour of Laminar Structures of High Performance Steel Fibre Reinforced Concrete
Simão Pedro Fonseca Santos – University of Minho, Portugal 118-119
Slab Strips: fcm = 70Mpa Series
0
50
100
150
200
250
300
0 2 4 6 8 10
Displacement (mm)
Loa
d (k
N)
0
50
100
150
200
250
300
0 2 4 6 8 10
Displacement (mm)
Loa
d (k
N)
Slab Strip 13: fcm70_NoFibres_Reinforced Slab Strip 14: fcm70_NoFibres_Reinforced
21.09
0.000
5
10
15
20
25
0 0.02 0.04 0.06 0.08 0.1
Displacement (mm)
Loa
d (k
N) 17.24
0.000
5
10
15
20
25
0 0.02 0.04 0.06 0.08 0.1
Displacement (mm)
Loa
d (k
N)
Slab Strip 15: fcm70_NoFibres_Without Reinf. Slab Strip 16: fcm70_NoFibres_Without Reinf.
0
50
100
150
200
250
300
0 2 4 6 8 10
Displacement (mm)
Loa
d (k
N)
.
0
50
100
150
200
250
300
0 2 4 6 8 10
Displacement (mm)
Loa
d (k
N)
Slab Strip 17: fcm70_FC60_Reinforced Slab Strip 18: fcm70_FC60_Reinforced

The Bending and Shear Behaviour of Laminar Structures of High Performance Steel Fibre Reinforced Concrete
Simão Pedro Fonseca Santos – University of Minho, Portugal 119-119
0
10
20
30
40
50
0 2 4 6 8 10
Displacement (mm)
Loa
d (k
N)
0
10
20
30
40
50
0 2 4 6 8 10
Displacement (mm)
Loa
d (k
N)
Slab Strip 19: fcm70_FC60_Without Reinf. Slab Strip 20: fcm70_FC60_Without Reinf.
0
50
100
150
200
250
300
0 2 4 6 8 10
Displacement (mm)
Loa
d (k
N)
0
50
100
150
200
250
300
0 2 4 6 8 10
Displacement (mm)
Loa
d (k
N)
Slab Strip 21: fcm70_FC75_Reinforced Slab Strip 22: fcm70_FC75_Reinforced
0
10
20
30
40
50
0 2 4 6 8 10
Displacement (mm)
Loa
d (k
N)
0
10
20
30
40
50
0 2 4 6 8 10
Displacement (mm)
Loa
d (k
N)
Slab Strip 23: fcm70_FC75_Without Reinf. Slab Strip 24: fcm70_FC75_Without Reinf.