high performance low-dimensional perovskite solar cells ...supporting information high performance...
TRANSCRIPT

Supporting Information
High Performance Low-dimensional Perovskite Solar Cells Based on One-
dimensional Lead Iodide Perovskite
Chunqing Ma,ab Dong Shen,ab Bin Huang,ab Xiaocui Li,e Wen-Cheng Chen,ab Ming-Fai Lo,*ab
Pengfei Wang,c Michael Hon-Wah Lam,d Yang Lu,e Biwu Maf and Chun-Sing Lee*ab
aCentre of Super-Diamond and Advanced Films (COSDAF), Department of Chemistry, Joint
Laboratory of Nano-organic Functional Materials and Devices (TIPC and CityU), City University
of Hong Kong, Hong Kong SAR, P. R. China.
bCity University of Hong Kong Shenzhen Research Institute, Shenzhen 518057, Guangdong, P.R.
China.
cKey Laboratory of Photochemical Conversion and Optoelectronic Materials, Technical Institute
of Physics and Chemistry (TIPC), Joint Laboratory of Nano-organic Functional Materials and
Devices (TIPC and CityU), Chinese Academy of Sciences, Beijing 100190, P. R. China.
dDepartment of Chemistry, City University of Hong Kong, Hong Kong SAR, P. R. China.
eDepartment of Mechanical Engineering, City University of Hong Kong, Hong Kong SAR, P. R.
China.
fDepartment of Chemistry and Biochemistry, Florida State University, Tallahassee, Florida 32306,
USA.
E-mail: [email protected] and [email protected]
Electronic Supplementary Material (ESI) for Journal of Materials Chemistry A.This journal is © The Royal Society of Chemistry 2019
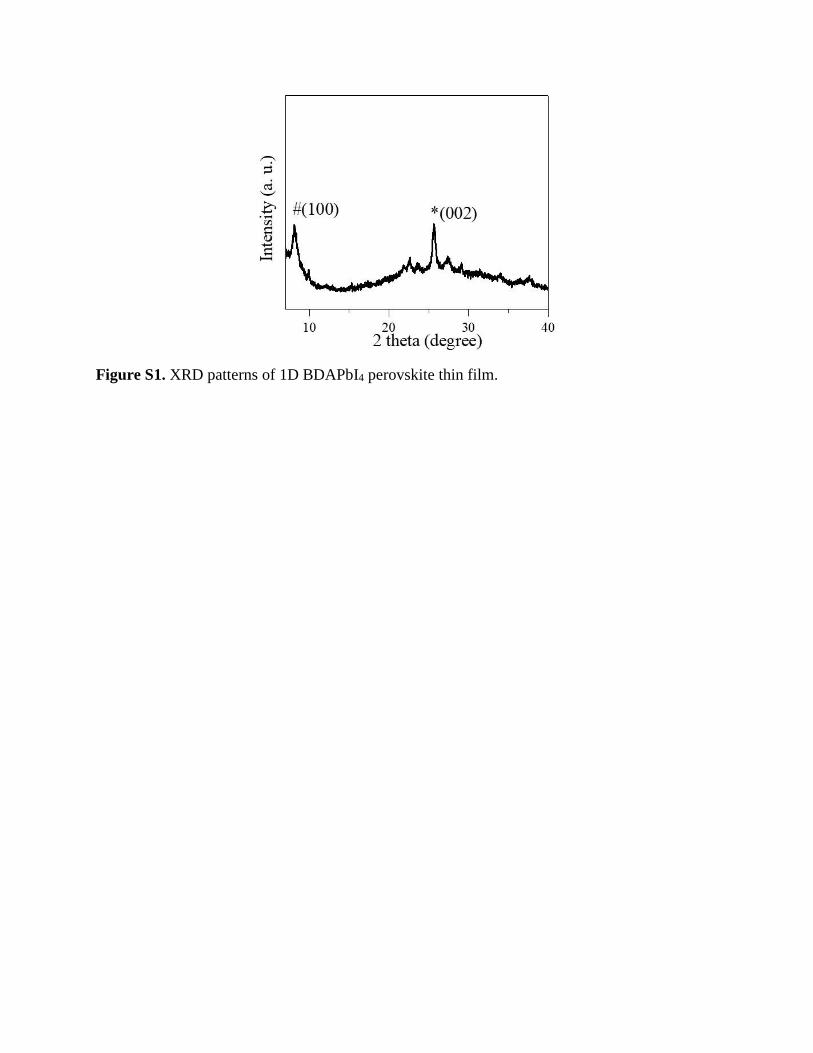
Figure S1. XRD patterns of 1D BDAPbI4 perovskite thin film.

Figure S2. Cross-sectional SEM image of BDAPbI4 perovskite thin film.

Figure S3. C 1s core level XPS spectra for the BDAPbI4, N4 and MAPbI3 perovskite thin films

Figure S4. SEM and cross-sectional SEM image of (a, d) N2, (b, e) N3 and (d, f) N4 perovskite
thin film.

Figure S5. PL decays of emissions at 660, 700, 740 nm in N4 sample.
Table S1. Summary of the parameters from fits of the TRPL measurement. The fitting functions
of exponential equation: y = 𝑦0 + 𝐴1exp(−𝑡
𝜏1) + 𝐴2exp(−
𝑡
𝜏2).
Peak position
(nm)
A1 τ1 (ns) A2 τ2 (ns)
660 0.70 2.01 0.28 11.02
700 0.74 3.16 0.25 22.05
740 0.69 3.03 0.26 26.66

Figure S6. Photo of BDAPbI4 and MAPbI3 single crystals grown from a solution of BDAI, MAI
and Pb2+.
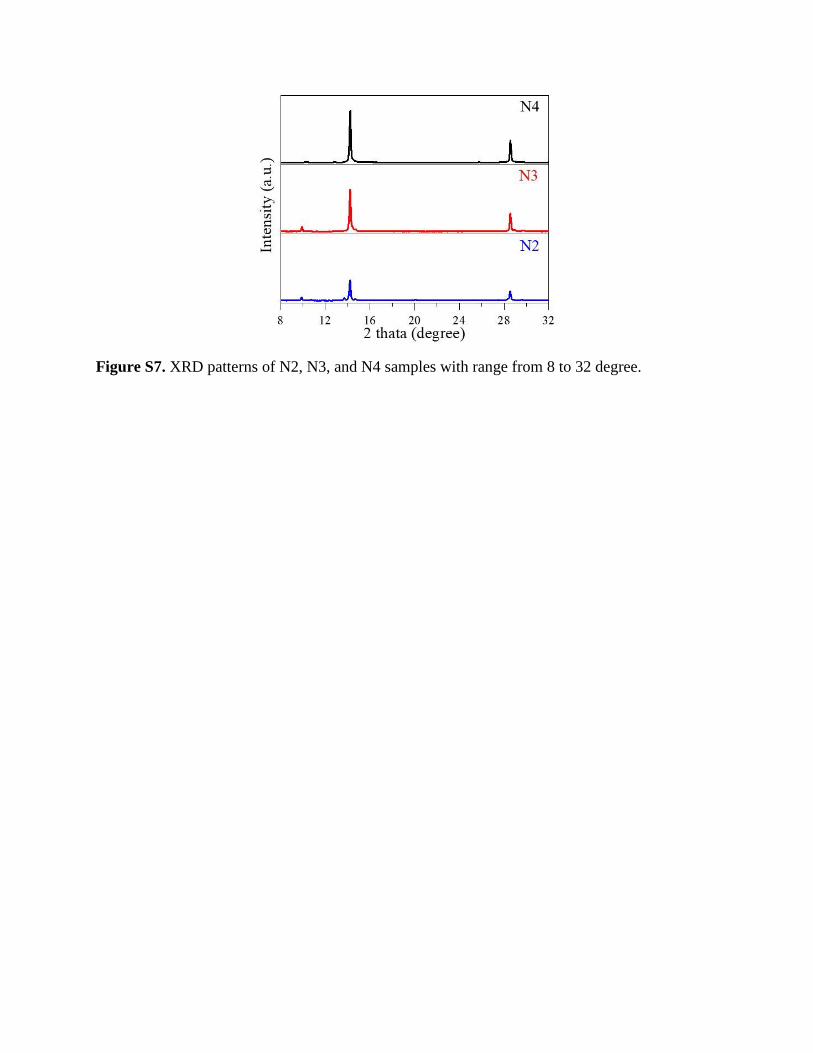
Figure S7. XRD patterns of N2, N3, and N4 samples with range from 8 to 32 degree.

Table S2. Summary of the parameters from fits of the TRPL measurement. The fitting functions
of exponential equation: y = 𝑦0 + 𝐴1exp(−𝑡
𝜏1) + 𝐴2exp(−
𝑡
𝜏2).
Peak position
(nm)
A1 τ1 (ns) A2 τ2 (ns)
480 0.49 0.42 0.50 0.56
530 0.96 0.52 0.04 3.86
570 0.87 0.60 0.13 3.78
610 0.76 0.97 0.23 6.28
660 0.70 2.01 0.28 11.02

Figure S8. PL decays of emissions at 660 nm in N2, N3 and N4 samples.
Table S3. Summary of the parameters from fits of the TRPL measurement. The fitting functions
of exponential equation: y = 𝑦0 + 𝐴1exp(−𝑡
𝜏1) + 𝐴2exp(−
𝑡
𝜏2).
sample A1 τ1 (ns) A2 τ2 (ns)
N2 0.87 0.82 0.13 2.13
N3 0.91 0.75 0.07 4.93
N4 0.70 2.01 0.28 11.02

Figure S9. Dark J–V measurements of a) electron- and b) hole-only devices of N4, N3 and N2
samples.
Figure S9 shows the J–V curves of the electron and hole-only devices. The linear relation indicates
an ohmic response of the device at low bias voltage, and the current quickly increases nonlinearly
when the bias voltage exceeds the key point, demonstrating that the trap-states are completely
filled. Further increase the bias voltage, the devices will operate in the trap-free space charge limit
current (SCLC) region. The carrier mobility can be determined by the equation:
J =9𝜀𝜀0𝜇𝑉
2
8𝑑3;
Where, e is the elementary charge of the electron, d is the perovskite film thickness, ε is the relative
dielectric constant, ε0 is the vacuum permittivity. Perovskite devices are more dominated in
electron transport/electron traps, therefore, the J–V behaviors are different in FigureS9a and b.

Figure S10. Statistics of PCE distribution of the PSCs with N2, N3, and N4 samples.

Figure S11. (a) J–V curve of 1D BDAPbI4 perovskite solar cell. (b) PL decay profiles of 1D
perovskite thin film.
Perovskite solar cells based on this 1D perovskite are also prepared. However, the efficiency of
the device is only up to 0.01% (Figure S1a), which is due to the high energy absorption and large
exciton binding energy. Figure S1b shows the decay of emission at 610 nm from the 1D perovskite
thin film at room temperature, giving lifetime of ~2 ns, which indicates short carrier lifetime in the
1D perovskite.

Figure S12. EIS spectra of N4, N3 and N2 PSCs measured at open circuit condition.

Table S4. Summary of the parameters from fits of the TRPL measurement. The fitting functions
of exponential equation: y = 𝑦0 + 𝐴1exp(−𝑡
𝜏1) + 𝐴2exp(−
𝑡
𝜏2).
Substrate A1 τ1 (ns) A2 τ2 (ns)
Glass 0.70 2.01 0.28 11.02
PEDOT:PSS 0.86 1.31 0.14 6.5

Figure S13. PL decay profiles of emission at (a) 530 and (b) 570 nm of N4 sample with/without
HTL.
Table S5. Summary of the parameters from fits of the TRPL measurement. The fitting functions
of exponential equation: y = 𝑦0 + 𝐴1exp(−𝑡
𝜏1) + 𝐴2exp(−
𝑡
𝜏2).
A1 τ1 (ns) A2 τ2 (ns)
530nm
Glass 0.96 0.52 0.04 3.87
PEDOT:PSS 0.96 0.57 0.04 4.40
570 nm
Glass 0.87 0.60 0.13 3.78
PEDOT:PSS 0.93 0.59 0.06 3.39