high-resolution ensemble flood forecasting: a … · high-resolution ensemble flood forecasting: a...
TRANSCRIPT

85VATTEN · 3 · 17
HIGH-RESOLUTION ENSEMBLE FLOOD FORECASTING: A CASE STUDY IN HÖJE Å, SWEDEN
Högupplösta ensembleprognoser för översvämningar: en fallstudie i Höje Å
by IVARSSON C.-L.1, OLSSON J.2, PERS C.2 , HUNDECHA Y. 2
1 Department of Water Resources Engineering, Lund University, Lund, Sweden2 Swedish Meteorological and Hydrological Institute, Norrköping, Sweden
AbstractThe number and impacts of pluvial floods are likely to increase with the growth of our cities and as extreme weather is anticipated to intensify with climate change. Improved preparedness is needed which may be at-tained owing to recent development of high-resolution hydro-meteorological observations and forecasts as well as geographical data. This paper investigates the capacity of the HYPE model for rainfall-runoff modelling and ensemble forecasting at hourly resolution. The analysis includes evaluation and application of several new high-resolution data sources: radar-based precipitation (HIPRAD), urban land-use data (EEA Urban Atlas) and high-resolution ensemble forecasts (MEPS). These components are finally integrated in a forecasting prototype for a catchment in southern Sweden. The results showed that HYPE, forced with HIPRAD and with land-use from Urban Atlas, performed well with a long-term Nash-Sutcliffe Efficiency > 0.8 at hourly level. Analysis of selected pluvial-type high-flow events close to an urban area indicated a good representation of fast runoff. The application of MEPS forecasts has been demonstrated for a few single events with promising results. Overall, it is concluded that the 1-hour forecasts provide added value compared with the 1-day time step and that an increased resolution in time and space is important to accurately forecast pluvial-type events.
Key words – high-resolution, rainfall-runoff modelling, HYPE, forecasting, pluvial flooding
SammanfattningDet är troligt att antalet pluviala översvämningar samt dess konsekvenser, kommer att öka i framtiden. Detta beror bland annat på tillväxten av våra städer vilket leder till större områden med hårdgjord yta, samt att klimatförändringarna förväntas leda till mer extremt väder. En förbättrad beredskap behövs och tack vare ut-veckling inom hydro-meteorologiska observationer och prognoser samt geografiska data finns det nu möjlighet att också utveckla prognossystem för pluviala översvämningar. I denna artikel undersöks kapaciteten av HYPE-modellen med 1-h upplösning för avrinningsmodellering samt för ensembleprognoser. Analysen omfattar ut-värdering och tillämpning av flera nya datakällor med hög upplösning: radarbaserad nederbördsdata (HIPRAD), data om urban markanvändning (EEA Urban Atlas) och högupplösta ensembleprognoser (MEPS). Dessa kom-ponenter är slutligen integrerade i en flödesprognos för ett avrinningsområde i södra Sverige. Resultaten visade att HYPE-modellen, körd med högupplöst data från HIPRAD och med markanvändning från Urban Atlas, presterade bra med en långsiktig Nash-Sutcliffe Efficiency > 0,8 på 1-h nivå. Analys av utvalda nederbördstill-fällen av pluvial typ nära ett urbant område visade en bra representation av snabb avrinning. Tillämpningen av MEPS-prognoser har testats för några enskilda händelser med lovande resultat. Sammantaget dras slutsatsen att 1-h prognoser kan ge ett mervärde jämfört med 1-dygns prognoser och att en ökad upplösning i tid och rum är betydelsefullt för att kunna förutse händelser av pluvial typ.
VATTEN – Journal of Water Management and Research 73:85–92. Lund 2017
86 VATTEN · 3 · 17
1 IntroductionFloods in urban areas bring potential risks for human lives, health and environment and the resulting destruc-tion can be severe and expensive to reconstruct. Urban flooding can be caused by either increased water levels at sea (coastal flooding), from a river that is overflowed (fluvial flooding) or when the rainfall intensity exceeds the infiltration capacity of the ground (pluvial flooding). The latter may result from short intense rainfalls in combination with a large fraction of impervious surface and a limited capacity of storm water sewer systems. The frequency and severity of pluvial flooding is likely to in-crease in a future climate (Houston et al., 2011). There is an ongoing growth of our cities, creating larger areas of impermeable ground and at the same time human activities such as carbon-dioxide emissions are resulting in climate change and global warming (IPCC, 2013) which is anticipated to cause more intensified precipita-tion (European Environmental Agency, 2012). In order to have better preparedness and limit the consequences of pluvial flooding, models can be used to forecast the event. Since the intense rainfalls which cause pluvial floods usually are short and local, it is important that the resolution in time and space of the model is high enough to catch rapid variations. This paper inves-tigates the capacity of The Swedish Meteorological and Hydrological Institute’s (SMHI) rainfall-runoff model, called HYPE, for rainfall-runoff modeling at hourly resolution. The analysis includes evaluation and applica-tion of several new high-resolution data sources: radar-based precipitation (HIPRAD), urban land-use data (EEA Urban Atlas) and high-resolution ensemble fore-casts (MEPS). Finally these components are integrated in a forecasting prototype for a catchment area in south-ern Sweden. The study is a part of the development of an hourly national flood forecasting system at SMHI.
2 Models and dataThe study is based on the latest development of two models; HYPE at 1h resolution and MEPS, as well as newly obtained data sets of high resolution precipitation (HIPRAD) and areal data for urban areas (EEA Urban Atlas). Below the models and data are described further.
HYPE (Hydrological Predictions for the Environment) is a hydrological model developed by SMHI (Lindström et al., 2010). HYPE can be used to model flow and cir-culation of water and nutrients from precipitation through the soil to the river discharge. It provides the ability to forecast water quantity and quality with high spatial detail, even for catchments with few gauges. The
current operational model uses a daily time-step, but the temporal resolution has recently been increased with an aim to better support water management and risk assess-ment in e.g. urban areas. An increase in temporal resolu-tion would allow catching also the short intensive rain-fall causing pluvial flooding, which cannot be captured with a 1-day time step. The performance of a high-reso-lution HYPE-model is evaluated within this study.
HIPRAD is a gridded national precipitation data set with a 2×2 km² spatial and 15 min temporal resolution, currently under development at SMHI (Berg et al., 2015). High-resolution precipitation data is needed to catch quick events for urban modeling and to initialize hydrological forecasting models in real-time. HIPRAD uses radar data adjusted to gridded gauge data called PTHBV to combine the high accuracy of the gauge data with the nearly full spatial coverage of the radar data. PTHBV was introduced in 2003 to provide the SMHI-HBV model with precipitation (P) and temperature (T) data and is today also used to drive the HYPE model over Sweden. It is produced by optimal interpolation from weather stations to a 4x4 km² grid.
MEPS (MetCoOp Ensemble Prediction System) is a numerical weather prediction (NWP) system for high-resolution ensemble forecasts by the HARMONIE model (Seity et al., 2012), developed in a cooperation between Sweden, Finland and Norway (MetCoOp). MEPS has an hourly time step and a high enough spatial resolution (2.5×2.5 km²) to simulate short and local precipitation events which can result in pluvial flooding. Instead of making a single forecast of the most likely weather, within ensemble forecasting an ensemble of forecasts are produced. These are called members. The amount of spread between the members should be re-lated to the uncertainty of the forecast. The ensemble system of MEPS consist of 10 members, all run on dif-ferent surface assimilation’s and forecasting 36 hours ahead (Andrae, 2017; Olsson et al., 2017).
EEA Urban Atlas is a high resolution GIS map for each European city with more than 100 000 inhabitants. The resolution of Urban Atlas is 100 times higher than of the Corine land cover data, which is originally used in HYPE. Just as Corine, Urban Atlas is based on satellite data (European Environmental Agency, 2010).
3 MethodThe data and models are evaluated in the Höje Å catch-ment, located in the South of Sweden (Figure 1). Within this 316 km² catchment, the town of Lund is located and the discharge gauge Trolleberg is situated just down-stream of Lund. The gauge at Trolleberg is one of few

87VATTEN · 3 · 17
gauges in Sweden situated close to an urban area. The impermeable surfaces of the urban areas result in quicker and increased runoff, which could typically result in plu-vial flood events. Since the aim of this study is to inves-tigate HYPE’s ability to simulate this type of situations, the selected catchment makes an ideal study area. The quality of the HIPRAD precipitation data is checked by comparing it with local precipitation gauges from the regional wastewater organization VA Syd at hourly resolution as well as a station from the national SMHI network at daily resolution (Figure 1). VA Syd has two gauges in Lund (referred to as VA Syd North and VA Syd South). These are compared to the corre-sponding grid cells from HIPRAD overlaying the same spot (referred to as HIPRAD North and HIPRAD South). Considering the spatial uncertainty in the radar, also neighboring grid cells would have been interesting to compare against and a more thorough investigation is
ongoing. The following indices were used for the com-parison: standard deviation, annual precipitation, wet days, monthly variations, monthly mean and maximum values and correlation. The size of the VA Syd tipping-bucket rain gauge was upgraded in 2012. The correla-tion after this year was examined closely using scatter plots to compare values from the same time-step and using quantile-quantile plots to compare sorted data. Comparing values from the same time step will show to which degree HIPRAD manages to reproduce the exact timing of precipitation in the gauges, whereas compar-ing the sorted data will show if the data sources have a similar statistical distribution. The hourly HYPE model was calibrated with a special emphasis in capturing the quick peak runoff resulting from short intense rainfall. Prior to calibration, the model was improved by increased spatial description of the area using the EEA Urban Atlas (European Environ-
Figure 1. Location of Höje Å catchment area. Only the catchment upstream Trolleberg is considered. Close-up on Lund and positions of rain gauges and HIPRAD gridcells.

88 VATTEN · 3 · 17
mental Agency, 2010). The calibration was evaluated by comparing the long-term efficiency criteria (EC) be-tween 2006 to 2014 and additionally visually compar-ing the runoff-curves for typical fluvial events. The model parameters which resulted in the best ECs as well as the best runoff dynamics compared with the observed runoff for the chosen events were kept and represent the model used; “1-h HYPE”. Two different ECs were con-sidered in this work. The first is the Nash-Sutcliffe Effi-ciency (NSE), which is a measurement of goodness of fit between calculated and observed runoff, developed es-pecially for hydrological models. A NSE value of 1 cor-responds to a perfect fit. The second EC is the relative volume error (RE (%)), which describes the volume error of the calculated runoff. Positive RE indicates that the model is systematically overestimating the runoff volumes. A negative value indicates the opposite – that the volumes are underestimated on average. Finally, the calibrated 1-h model is applied to re-fore-cast the discharge during a rainfall event in October 2016 by using the MEPS ensemble forecasts that were issued at the time. The result from the model is com-pared with the observed runoff of the event.
4 Results and discussionHIPRAD is compared to the local gauges from VA Syd and SMHI, and overall the agreement is good. Some of the results are presented here. The annual precipitation over the period 2000–2014 (Figure 2) from the different sources corresponds well. The result is improved after 2012 when the accuracy of the VA Syd gauges is improved. The correlation between the data is investi-
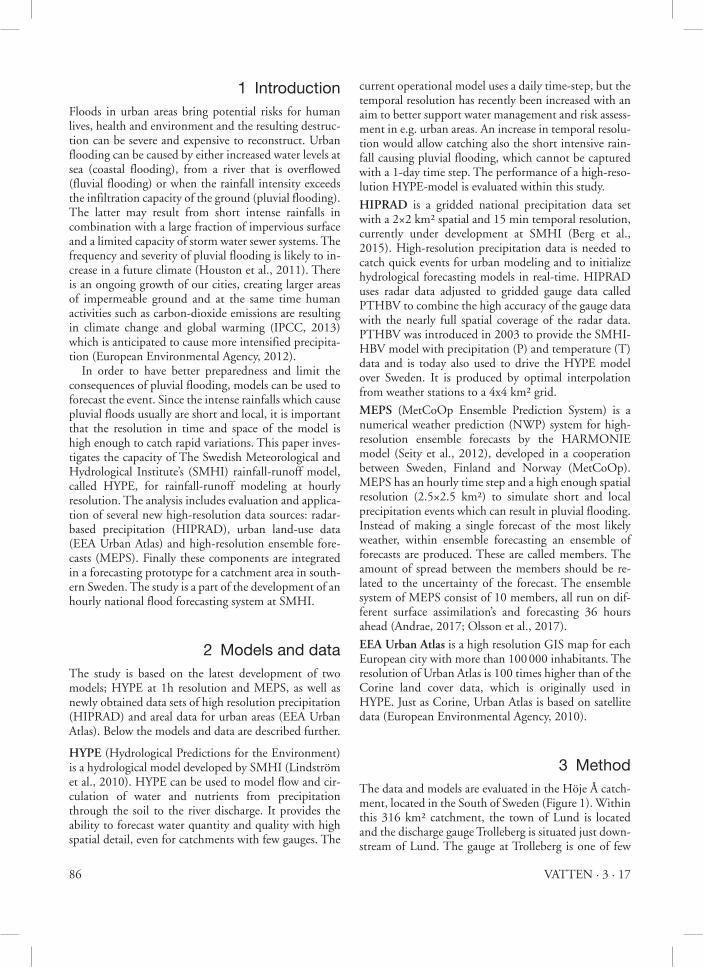
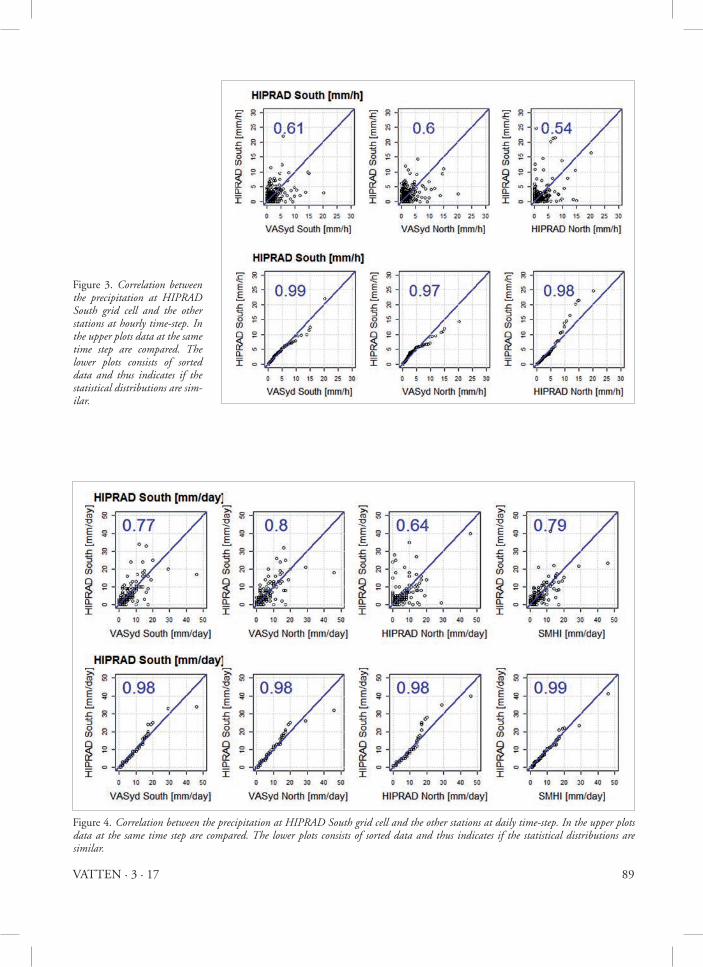
gated for the summer months 2012–2014 (Figure 3 and Figure 4). The correlation is evaluated both by scatter plots comparing values from the same time-step (Figure 3) and by quantile-quantile plots comparing sorted data (Figure 4). The correlation at daily timescale (Figure 4) is better than the correlation at hourly scale (Figure 3). This is expected as the exact time of ground rainfall is difficult to capture with radar, which HIPRAD is based on. This is also evident from the difference between correlations using same time step and sorted data, respectively. Com-paring the correlation of the sorted data, HIPRAD shows similar distribution as the local gauges from VA Syd and SMHI. This is an encouraging result. It should be remarked that data from the SMHI gauge (daily val-ues) are used in the production of the PTHBV-grid that HIPRAD is correlated to, but the VA Syd gauges are completely independent from HIPRAD. The sorted data also show how HIPRAD has a tendency to under-estimate the highest intensities compared to VA Syd, which is expected in light of the spatial averaging in the HIPRAD data. The performance of the HYPE model at hourly and daily resolution are compared in Table 1 and Figure 5.
Table 1. Efficiency criteria for HYPE models in Figure 4, for period 2006–2014.
HYPE model NSE RE (%)
1-h HYPE 0.83 –3.71-day HYPE 0.80* –17.9*
*These values are calculated using daily values.
Figure 2. Annual precipitation. Com-parison of precipitation data over Lund. HIPRAD grid cells (South and North) are compared to local gauges VA Syd South and North and SMHI.
89VATTEN · 3 · 17
Figure 3. Correlation between the precipitation at HIPRAD South grid cell and the other stations at hourly time-step. In the upper plots data at the same time step are compared. The lower plots consists of sorted data and thus indicates if the statistical distributions are sim-ilar.
Figure 4. Correlation between the precipitation at HIPRAD South grid cell and the other stations at daily time-step. In the upper plots data at the same time step are compared. The lower plots consists of sorted data and thus indicates if the statistical distributions are similar.

90 VATTEN · 3 · 17
The evaluation of the efficiency criteria over the period 2006–2014 indicate that both models performed well with high NSE values. However, the model at daily time step (1-day HYPE) is evaluated agianst runoff at a daily time step, while the 1-h HYPE model is fitted to runoff data at hourly timestep. Both models tend to underesti-mate the runoff volumes (negative RE-values). The volume error is considerably lower for 1-hour HYPE. Figure 5 shows a comparison for two intense short rain events modeled at hourly and daily resolutions, respec-tively. The advantages of using a 1-h time-step when modeling sub-daily pluvial events is evident as the dis-charge peaks may be entirely missed with a daily time step. In both cases, the timing of the peak of 1-hour HYPE is delayed compared to the observed runoff. As indicated by the correlation at hourly scale (Figure 3, upper row) there are uncertainties in the radar data at the hourly time scale. There are different reasons for this. One reason is that the precipitation is measured at a high elevation and can drift before it reaches ground level. Thus the main reason for peak timing error is probably uncertainty in the forcing data (HIPRAD / Precipitation, Figure 5). This assumption is further sub-stantiated when comparing observed runoff to the forc-ing data (see precipitation in Figure 5). Expecting a de-lay between peak of precipitation and peak of runoff, the timing of the precipitation for particularly the upper event seems questionable. The calculated runoff from the forecasted event at 2016-11-04 is compared with the observed runoff in
Figure 6. The dynamics of the forecasted event correlate well. One day prior to the rain event, all members show an increase in flow. However, the members exhibit a larger spread 12 hours prior to the event, implying a higher uncertainty. The initial levels of the forecast are overestimated which is due to errors in the HIPRAD data used to initialize the model. The current version of HIPRAD is valid until the end of 2014. The equation of adjustment to the gridded gauge-based data does not fit at the present time, probably due to updates in the measuring equipment. The forecasts exhibit overall good dynamics considering to the short-duration nature of the event, indicating that a 1-h national HYPE model coupled with high-resolution meteorological ensemble forecasts could be a valuable tool to add preparedness for pluvial flooding.
5 Conclusions The main results from this study are the following.
• HIPRAD showed generally good agreement for long accumulations and statistical distributions. For short time step (1 hour) there were however temporal de-viations. The correlation to point-scale data is affected by HIPRAD being gridded and therefore has a ten-dency to underestimate the highest intensities.
• HYPE at 1-h temporal resolution could be overall well fitted to the 1-hour observation in terms of effi-ciency criteria with NSE above 0.8. The advantages of
Figure 5. Two sub-daily discharge peaks in Höje Å representing pluvial events, modeled at hourly and daily resolution. Black line represents the observed runoff. Purple line represents the calculated runoff from 1-h HYPE model using HIPRAD as driving data and yellow line from 1-day HYPE, using aggregated HIPRAD as forcing data. Blue line is mean precipitation over total catchment upstream discharge gauge (HIPRAD).

91VATTEN · 3 · 17
using an hourly time step when modeling sub-daily events were evident.
• The result from the forecasting was promising and the dynamics of the observed runoff was captured reasonably well in the forecast. A relatively early sig-nal of rapid flow increase was obtained.
We conclude that the evaluated components performed overall well, which supports their applicability for high-resolution flood forecasting. This study is a part of the development of an hourly national flood forecasting sys-tem at SMHI, aiming at an improved support for plu-vial flooding and other events producing rapid flow changes on sub-daily time scales.
References Andrae, U. (2017) Technical report, The MetCoOp ensem-
ble.Berg P., Norin L., Olsson J. (2015) Creation of a high resolu-
tion precipitation data set by merging gridded gauge data and radar observations for Sweden, Journal of Hydrology. ISSN 00221694. doi: 10.1016/j.jhydrol.2015.11.031.
European Environmental Agency (2010) Technical report, Ur-ban Atlas, available at http://www.eea.europa.eu/data-and-maps/data/urban-atlas.
European Environmental Agency (2012) Climate change, im-pacts and vulnerability in Europe: An indicator-based re-port, volume 12/2012. ISBN 9789292133467.
Houston D., Werritty A, Bassett D., Geddes A., Adrew H., McMillan M.. (2011) Pluvial (rain-related) flooding in ur-
Figure 6. Forecasted event on Friday 00:00 (red line) the 4th of November 2016. The precipitation event continued from 00:00 to 18:00.

92 VATTEN · 3 · 17
ban areas: the invisible hazard, York: Joseph Rowntree Foundation
IPCC (2013) Climate Change 2013: The Physical Science Basis. Contribution of Working Group I to the Fifth Assessment Report of the Intergovernmental Panel on Cli-mate Change [Stocker, T.F., D. Qin, G.-K. Plattner, M. Tignor, S.K. Allen, J. Boschung, A. Nauels, Y. Xia, V. Bex and P.M. Midgley (eds.)]. Cambridge University Press, Cambridge, United Kingdom and New York, NY, USA, 1535 pp, doi:10.1017/CBO9781107415324.
Johansson, B. (2002) Estimation of areal precipitation for hy-drological modelling in Sweden. Ph.D. Thesis. Report No. A76. Earth Sciences Centre, Göteborg University.
Lindström G., Pers C., Rosberg R., Strömqvist J., Arheimer B.
(2010) Development and test of the hype (hydrological predictions for the environment) model – a water quality model for different spatial scales. Hydrology Research, 41.3-4, 295–319.
Olsson, J., Bengtsson, L., Pers, B.C., Berg, P., Pechlivanidis, I., H. Körnich (2017) Distance-dependent depth-duration analysis in high-resolution hydro-meteorological ensemble forecasting: a case study in Malmö, Sweden. Environ. Model. Softw., 93, 381–397, doi:10.1016/j.env-soft.2017.03.025.
Seity, Y., Brousseau, P., Malardel, S., Hello, G., Bénard, P., Bouttier, F., Lac, C., Masson, V. (2011) The AROME-France convective scale operational model, Mon. Weather, 139, 976–999, doi: 10.1175/2010MWR3425.1.