high resolution measurements - intranet deibhome.deib.polimi.it/sampietr/nano/ferrari - high...
TRANSCRIPT
1
High resolution measurements
The differential approach
Giorgio FerrariDipartimento di elettronica, informazione e bioingegneria
Politecnico di Milano
Milano, November 23 2016
Electrical characterisation of nanoscale samples & biochemical interfaces: methods and electronic instrumentation
High resolution measurements - G. Ferrari2
OUTLOOK of the LESSON
Difficulties of high resolution measurements• Linear noise sources• Non-linear noise sources
Differential approach Examples

2
High resolution measurements - G. Ferrari3
Definitions
Minimum detectable signal (limit of detection): Smin
Maximum signal (saturation sensor or electronics) : Smax
Dynamic range: Smax/Smin
Sensor + electronics response:
SSmax
Vmax
Smin
Vnoise
Vout
A. D
’Am
ico
and
C. D
i Nat
ale,
“A
con
trib
utio
n on
som
e ba
sic
defin
ition
s of
sen
sors
pro
pert
ies,
” IE
EE
Sen
s. J
., vo
l. 1,
no.
3, p
p. 1
83–1
90, 2
001.
SensorInterface
electronics
Given by sensor and electronics
High resolution measurements - G. Ferrari4
Definitions
Resolution: minimum measurable ∆Sx
Relative resolution: ∆Sx/Sx
(sensitivity: ∆Vx/∆Sx )
SSmax
Vmax
Smin
Vnoise
Vout
Sx
Vx
∆Sx
∆Vx
3
High resolution measurements - G. Ferrari5
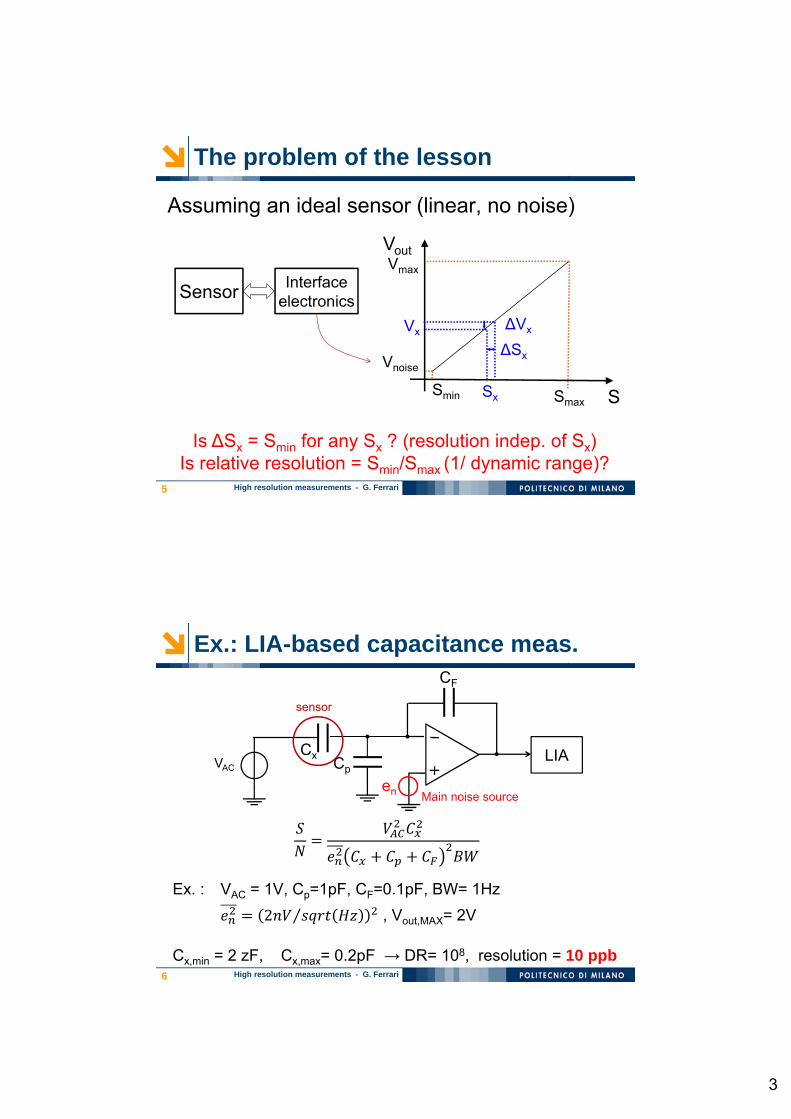
The problem of the lesson
Assuming an ideal sensor (linear, no noise)
Sensor
Is ∆Sx = Smin for any Sx ? (resolution indep. of Sx)Is relative resolution = Smin/Smax (1/ dynamic range)?
Interface electronics
SSmax
Vmax
Smin
Vnoise
Vout
Sx
Vx
∆Sx
∆Vx
High resolution measurements - G. Ferrari6
Ex.: LIA-based capacitance meas.
Ex. : VAC = 1V, Cp=1pF, CF=0.1pF, BW= 1Hz
2 ⁄ , Vout,MAX= 2V
Cx,min = 2 zF, Cx,max= 0.2pF → DR= 108, resolution = 10 ppb
CF
VAC
CxCp
en
LIA
Main noise source
sensor

4
High resolution measurements - G. Ferrari7
High resolution meas. require:
• Low-noise, wide-bandwidth circuits
… and a full control of the setup, for example:
- Noise of the waveform generator
- Gain fluctuations
- Temperature effects
- 1/f noise
- Dielectric noise
- …
High resolution measurements - G. Ferrari8
Noise of the stimulus signal
Example: sine waveform
frequency
Power spectraldensity
f0
Additive noise
Amplitude and phase noise
5
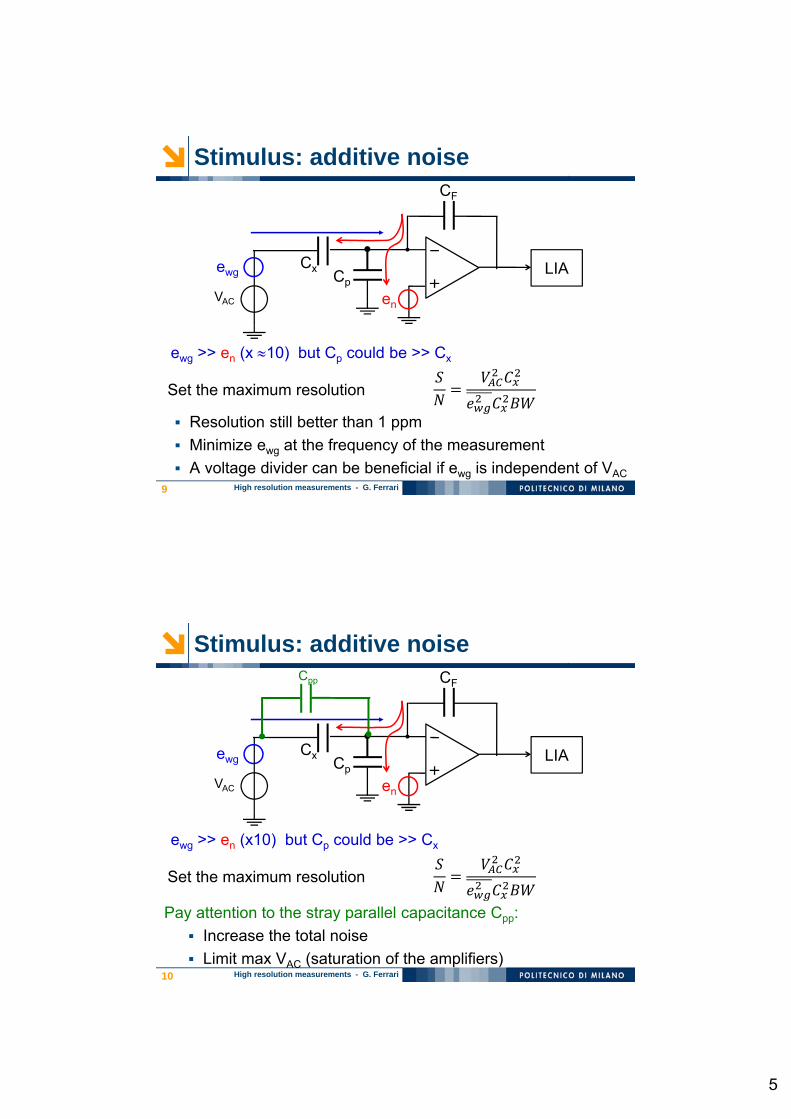
High resolution measurements - G. Ferrari9
Stimulus: additive noiseCF
VAC
CxCp
en
LIAewg
ewg >> en (x 10) but Cp could be >> Cx
Set the maximum resolution
Resolution still better than 1 ppm
Minimize ewg at the frequency of the measurement
A voltage divider can be beneficial if ewg is independent of VAC
High resolution measurements - G. Ferrari10
Stimulus: additive noiseCF
VAC
CxCp
en
LIAewg
ewg >> en (x10) but Cp could be >> Cx
Set the maximum resolution
Cpp
Pay attention to the stray parallel capacitance Cpp:
Increase the total noise
Limit max VAC (saturation of the amplifiers)

6
High resolution measurements - G. Ferrari11
Stimulus: amplitude and phase noise
frequency
Power spectraldensity
f0
Additive noise
Amplitude and phase noise
⋅ 1 ⋅ sin 2
High resolution measurements - G. Ferrari12
Phase noise modulation
It is NOT important for high resolution meas.:
Phasor notation: VAC
ϕrms
The measured amplitude is not affected 1
x
y

7
High resolution measurements - G. Ferrari13
Phase noise modulation
It is IMPORTANT in the case of
signal + large spurious shifted of 90°:Phasor notation: Vspurious
ϕrms Smin ≈ Vspurious ⋅ sin(ϕ rms)Smin ≈ Vspurious ⋅ ϕ rms
Vgood signal
Example: -100dBc/Hz at 100Hz offset→ 2 ⋅ 10 ⋅ 100 0.1 (BW=100Hz)Smin/Vspurious > 100 ppm
x
High resolution measurements - G. Ferrari14
Amplitude noise modulation
It is IMPORTANT for high resolution meas.
DAC
VREF
f
SVref
Power spectral density of VREF
sin(nT)VREF⋅ sin(t)
digital sine
The demodulated amplitude has the SAME noise of VREF
1/f noise at the output of the LIA!
LIAVREF⋅ sin(t) VREF

8
High resolution measurements - G. Ferrari15
Amplitude noise modulation
Example:
White noise: 5 / , noise corner: 100Hz
100m 1 10 100 1k 10k0
100n
200n
300n
400n
500n
600n
white + 1/f noise white noise
rms
nois
e [V
]
Bandwidth [Hz]
1 10 100 1k 10k10-18
10-17
10-16
10-15
10-14
Noi
se s
pect
ral d
ensi
ty [V
2 /Hz]
Frequency [Hz]
(fmin= 0.1mHz)
High resolution requires narrow BW 1/f noise of AM set a limit!
High resolution measurements - G. Ferrari16
Ex.: LIA-based capacitance meas.
CF
VAC
CxCp
en
LIA
Front end amplifier and conditioning stages:en … other?

9
High resolution measurements - G. Ferrari17
Temperature fluctuations
Temperature coeff. of a C0G cap. («0 drift») is up ∆C/C= 30 ppm/°C
CF
VAC
CxCp
LIAVout = VAC Cx/CF
A fluctuation of the gain changes the LIA output (as AM)
1 ppm requires a temperature stability better than 0.03 °C (worst case)
High resolution measurements - G. Ferrari18
Gain set by a resistor
Temperature coeff. of standard R is 50 ppm/°C ( 100ppm/°C for high value resistors)
RF
VAC
CxCp
LIAVout = VAC Cx RF
1 ppm requires a temperature stability better than 0.02 °Cor resistors with low temp. coef. (down to 1 ppm/°C)
1/f noise of a resistor is often a resistivity fluctuation
1 ppm requires low 1/f noise resistors (metal thin film)

10
High resolution measurements - G. Ferrari19
Temperature effectO
utpu
t [V
]
SR830 lock-in: 840nV rmsCustom lock-in, standard R (50 ppm/°C): 240nV rms (4 ppm)Custom lock-in, LTC R (5 ppm/°C): 45 nV rms (0.7 ppm)
Low temp. coef. components along the signal path!
High resolution measurements - G. Ferrari20
Noise from the input capacitance
R
Vac
Cx Cp1
en
Is the capacitance a true noiseless component?What is the role of the substrate?
M. Sampietro “Conductive or insulating substrate”

11
High resolution measurements - G. Ferrari21
Ex.: LIA-based capacitance meas.CF
VAC
CxCp
LIA
Digital LIA:
A.A. filter
Filters
ADC
DAC
VIN
VAC
-sin
cos
jy
x
LIADigital
processingcos
-sin DDS
Outputs
Analogstages
Analogstages
High resolution measurements - G. Ferrari22
ADC: amplitude noise modulation
ADC
VR,ADC[1+nR,ADC(t)]
,, 1 ,
Unavoidable slow fluctuations of the ADC gain
Unavoidable fluctuations of the LIA output!
f
SVr,adc
Power spectral density of VR,ADC

12
High resolution measurements - G. Ferrari23
1 10 100 1k 10k 100k
100n
1µ
10µ
100µ
VIN
= 1 V
VIN
= 300 mV
VIN
= 100 mV
VIN
= 30 mV
VIN
= 0 V
VIN
= 1 V (quad: 40 mV)
Ou
tpu
t noi
se s
pec
tra
l de
nsity
[Hz]
Frequency [Hz]
Zurich Instruments, HF2LI
Spectral analysisf = 1 MHz
out in LIALIA Output
1m 10m 100m 1100m
1
10
100
1k
Res
olut
ion
[pp
m]
Signal amplitude [V]
1 kHz BW (ideal) 1 kHz BW 10 Hz BW (ideal) 10 Hz BW
×140
Resolution limits of LIAsO
utpu
t noi
sesp
ectr
alde
nsity
⁄
High resolution measurements - G. Ferrari24
How to improve the resolution ?
The limiting factor is the gain fluctuations of voltage source, amplifiers, ADC
OUT = (G+δG(t)) ⋅ S → δOUT(t) = δG(t)⋅S
The additional noise is proportional to the signal
only keep the useful signal!

13
High resolution measurements - G. Ferrari25
The differential approach
t
S
baseline
t
Ref
baseline
S = baseline + ∆S
t
S-Ref
• Gain fluctuations prop. to ∆S ≪ S
High resolution measurements - G. Ferrari26
The differential approach
t
S
baseline
t
Ref
baseline
S = baseline + ∆S
t
S-Ref
• Gain fluctuations prop. to ∆S ≪ S
• Ref must share the gain fluctuations of the stimulus
• The subtraction should be implemented as soon as possible (no digital domain!)

14
High resolution measurements - G. Ferrari27
Ex 1: Wheastone bridge
• VAC fluctuations reduced by the CMRR (balanced case)
• Amplifier and LIA input operate on ADIFF
• Z1,Z2,Z3,ZDUT should be placed near to experience the same temperature fluctuations
LIA
VOUT
VIN
+
-ADIFF
ADUT AREF
VAC
High resolution measurements - G. Ferrari28
Ex 1: Wheastone bridge
MEMS piezoresistive sensors (pressures, acceleration,…)
Sensors 2009, 9(8), 6200‐6218; doi:10.3390/s90806200
Proceedings of the IEEE 2009, 513-552, DOI: 10.1109/JPROC.2009.2013612

15
High resolution measurements - G. Ferrari29
Ex 2: Ratiometric – Half bridge
• No compensation of VAC fluctuations
• Large signal processed by amplifiers and LIA
LIA
VOUT
VIN
ZR
EF
-+
ZD
UT
VAC
VAC/2
High resolution measurements - G. Ferrari30
Ex 2: Ratiometric – Half bridge
• Balanced structure
• Balun or inverting amplifier (requires a stable gain!)
• ZREF adjacent to ZDUT
LIA
VOUT
VIN
ZR
EF
-+Balun
ZD
UT
VAC
ADIFF
-VAC

16
High resolution measurements - G. Ferrari31
Ex 2: Ratiometric – Half bridge
http://www.microsystems.metu.edu.tr/gyroscope/gyroscope.html
Microsystem Technologies, 2013, pp 713–720, DOI: 10.1007/s00542-013-1741-z
MEMS capacitive sensors (pressures, acceleration,…)
High resolution measurements - G. Ferrari32
Ex 3: Current sensing
• Balanced structure
• Balun or inverting amplifier (requires a stable gain!)
• ZREF adjacent to ZDUT
LIA
VOUT
VIN
ZR
EF
+
-Balun
ZD
UT
VAC
0V
-VAC

17
High resolution measurements - G. Ferrari33
Cap. detection of the surface coverage
dust deposition, cell growth, …
M. Carminati, Capacitive detection of micrometric airborne particulate matter for solid-state personal air quality monitors, Sensors Actuators A 219, 2014.
Cel(t)
Cel
time
High resolution measurements - G. Ferrari34
Interdigitated Electrodes
Ex.: area 1 mm2
gap 1 mlength 500 mLIA resolution: 30 ppm
Large sensitive area implies large total capacitance
Ctotal = 15pF
∆Cmin = 450 aF
Minimum particle size > 50 m

18
High resolution measurements - G. Ferrari35
Differential structure • Common mode
rejection• Generator• Environment
Differential electrodes architecture
High resolution measurements - G. Ferrari36
Realized Chip Prototype
2mm
1 mm2
collection area
Cel = 1.7aF
5µm
Noise: 65 zF(differential structure)
Noise: 450 aF(single structure)

19
High resolution measurements - G. Ferrari37
Ex 4: Current-Sensing AFM (CS-AFM)
X,Y,Z piezo
conductive probe
current detector
topography
IDC
VDC
IDC
sample
force feedback
A voltage bias is applied between a conductive tip and the sample on a conductive substrate. Thecurrent flowing through the sample is measured while the tip is maintained in contact under forcefeedback control.
R
Advantages compared to STM:
1) conducting and insulating samples
2) independent topography and electrical image
High resolution measurements - G. Ferrari38
Nanoscale Impedance Microscopy
piezo
topography
AFMcontroller
sampleVDC
Conductiveprobe
I-V
Lock-in amplifier
Z( f )
+ vAC(t)
IDC+iAC(t)
Topography controls
C RAC
IDC
C RAC Noise
Current amplifier with BW=1MHz:
• Capacitance and dielectric maps
• Impedance measurements (100Hz – 1MHz)
• Noise spectroscopy(proof of the concept, ICNF 2005)
• Current transient on a s scale
G. Gomila (IBEC), L. Fumagalli(University of Manchester)
Fumagalli L et al, Nanotechnology 2006
Fumagalli L., Ph. D. Thesis
20
High resolution measurements - G. Ferrari39
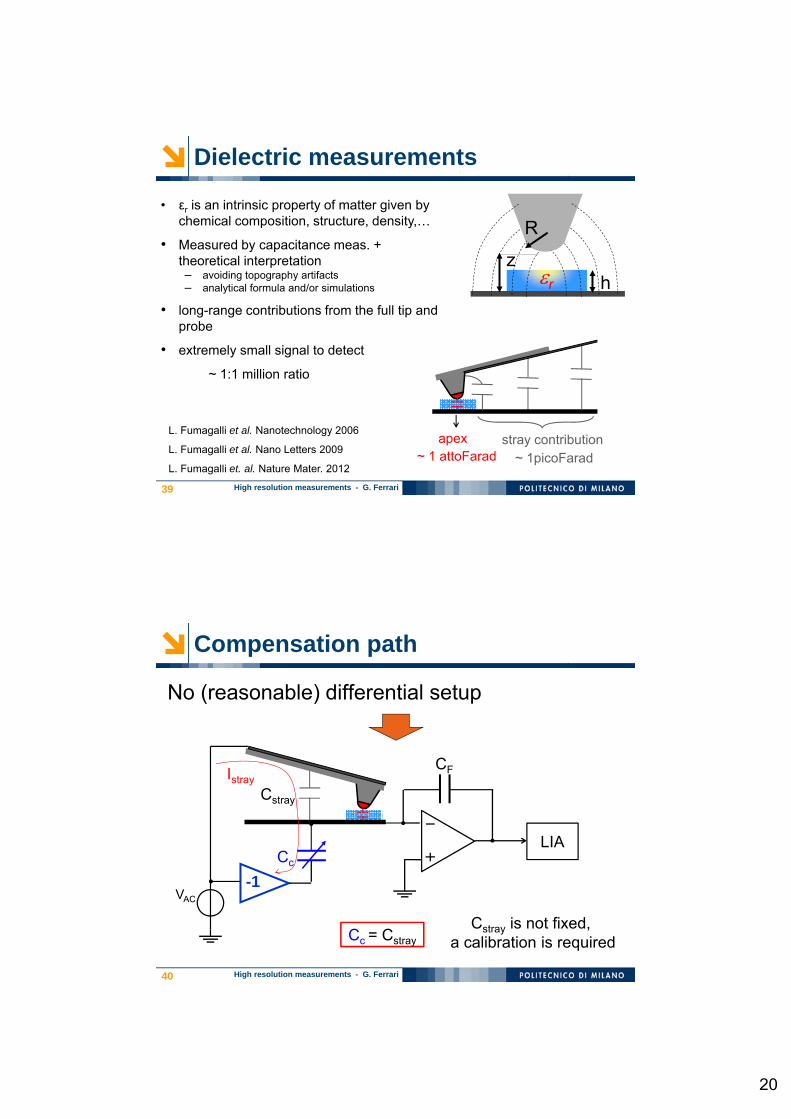
L. Fumagalli et al. Nanotechnology 2006
L. Fumagalli et al. Nano Letters 2009
L. Fumagalli et. al. Nature Mater. 2012
• εr is an intrinsic property of matter given by chemical composition, structure, density,…
• Measured by capacitance meas. + theoretical interpretation– avoiding topography artifacts– analytical formula and/or simulations
• long-range contributions from the full tip and probe
• extremely small signal to detect
~ 1:1 million ratio
stray contribution~ 1picoFarad~ 1 attoFarad
apex
r
R
hz
Dielectric measurements
High resolution measurements - G. Ferrari40
Compensation path
No (reasonable) differential setup
CF
VAC
Cc
LIA
Cstray
Cc = Cstray
-1
Istray
Cstray is not fixed,a calibration is required

21
High resolution measurements - G. Ferrari41
Compensation path
A more practical configuration
CF
VAC
Cc
LIA
Cstray
nCc/214= Cstray
DAC -VAC n/214
AD5446: 14-bit multiplying DAC, BW= 12MHz, gain temp. coef. <20 ppm /°C
14 bit
High resolution measurements - G. Ferrari42
Summary
• Resolution could be limited by gain fluctuations:• Signal source (DAC, optical source,…)
• Amplifiers (C, R,…)
• A/D converters
• Differential approach• Remove large baseline: gain fluctuations prop. to the signal
• Reference path generated from the same signal source• Differential sensor
• Circuit with a calibrated component (+ variable gain and/or phase shifter)
• Reference path with –∆S whenever possible (e.g. MEMS)