high risk jurisdiction severity trends, time to closure ... · high risk jurisdiction severity...
TRANSCRIPT

High Risk Jurisdiction Severity Trends, Time to Closure & Obstetric Claims Trends Analysis and Findings Provided by Beazley Group Excerpt taken from: Aon/ASHRM Hospital and Physician Professional Liability 2013 Benchmark Analysis

2013 Aon | ASHRM Hospital and Physician Professional Liability Benchmark Analysis Aon Risk Solutions 69
Beazley Group’s Large Claim Analysis
One of the main purposes of this study is to provide health care providers with the tools to fully understand their cost of risk. In effort to obtain this goal, Aon and Beazley have partnered to utilize Beazley’s insurance knowledge to focus on the cost in excess layers. Using their robust claims database, Beazley provides large claim analytics on: high risk jurisdictions, amount of time to closure, and obstetrics claims.
Beazley has been underwriting U.S. risks since the company’s formation in 1986. Today, the bulk of its U.S. business continues to be underwritten in London by its Lloyd’s underwriters, but it also has a rapidly growing local presence in the United States. With total gross premiums written approaching $2 billion, Beazley provides a wealth of information on topics of interest to the health care industry.iii
70 2013 Aon | ASHRM Hospital and Physician Professional Liability Benchmark Analysis Aon Risk Solutions
Beazley Group’s Large Claim Analysis
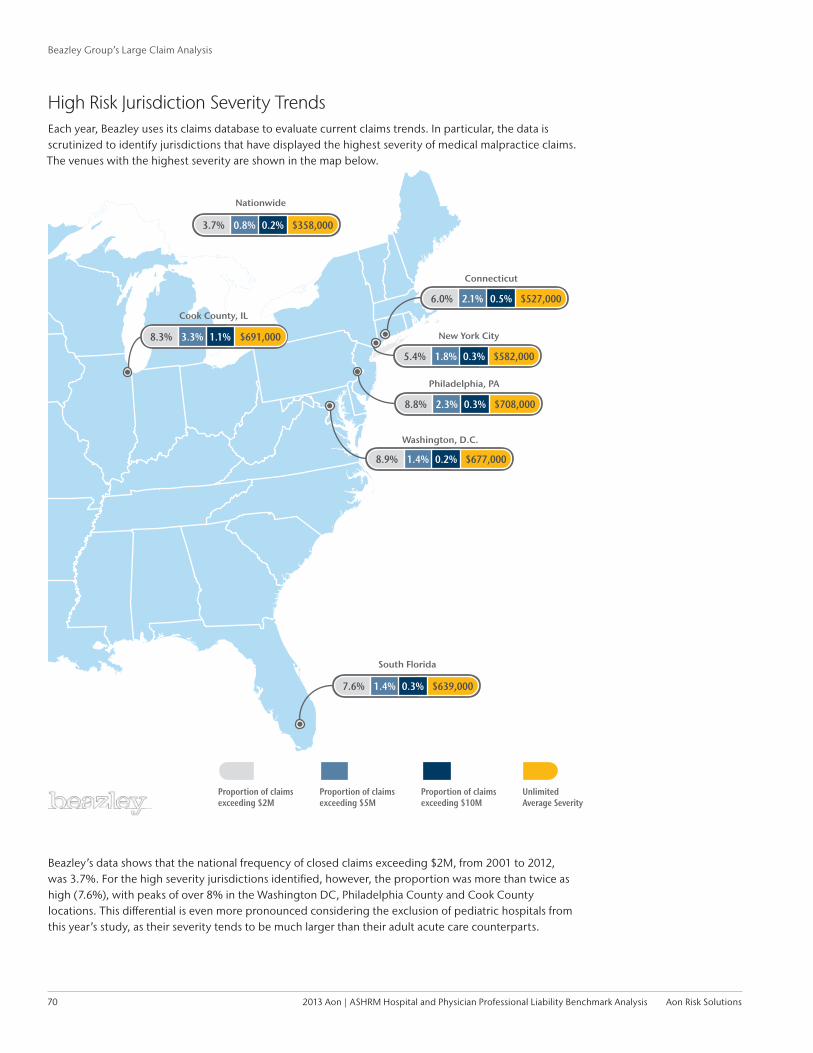
High Risk Jurisdiction Severity TrendsEach year, Beazley uses its claims database to evaluate current claims trends. In particular, the data is scrutinized to identify jurisdictions that have displayed the highest severity of medical malpractice claims. The venues with the highest severity are shown in the map below.
Beazley’s data shows that the national frequency of closed claims exceeding $2M, from 2001 to 2012, was 3.7%. For the high severity jurisdictions identified, however, the proportion was more than twice as high (7.6%), with peaks of over 8% in the Washington DC, Philadelphia County and Cook County locations. This differential is even more pronounced considering the exclusion of pediatric hospitals from this year’s study, as their severity tends to be much larger than their adult acute care counterparts.
Cook County, IL
Proportion of claims exceeding $2M
Proportion of claims exceeding $5M
Proportion of claims exceeding $10M
Unlimited Average Severity
South Florida
Connecticut
New York City
Philadelphia, PA
Washington, D.C.
1.0%
7.6% 1.4% 0.3% $639,000
8.3% 3.3% 1.1% $691,000
6.0% 2.1% 0.5% $527,000
5.4% 1.8% 0.3% $582,000
8.8% 2.3% 0.3% $708,000
8.9% 1.4% 0.2% $677,000
Nationwide
3.7% 0.8% 0.2% $358,000

2013 Aon | ASHRM Hospital and Physician Professional Liability Benchmark Analysis Aon Risk Solutions 71
Beazley’s study indicates that the increase in severity is not confined to the more established challenging venues, but appears to have spread to jurisdictions that have historically been considered more benign. The chart below compares the average severity on closed claims from high risk venues against Tort Reform states, which we define as those states with some form of cap (on either non-economic or overall damages). As we noted last year, the average value of the claims has increased for both overall and tort reform categories in recent years. As shown in the magnified area of the graph, the severity trend over the past four closing years shows a higher rate of increase in the tort reform category.
Average Severity for Closed Claims with Indemnity - Unlimited
Beazley’s actuarial findings are corroborated by its claims handling experiences, with its claims professionals reporting a continued trend of large and often record-setting verdicts. Moreover, the Beazley claims team confirms that the escalation of verdict values has not been confined to high severity jurisdictions.
Closing Year
$0
$100,000
$200,000
$300,000
$400,000
$500,000
$600,000
$700,000
$800,000
$900,000 Tort ReformOverall USHigh
201220112010200920082007200620052004200320022001
Tort ReformOverall US
$250,000
$300,000
$350,000
$400,000
$450,000
$500,000
2012201120102009

72 2013 Aon | ASHRM Hospital and Physician Professional Liability Benchmark Analysis Aon Risk Solutions
Beazley Group’s Large Claim Analysis
Below we highlight two specific Tort Reform states, California and Maryland, where severity appears to be increasing significantly. Both states have recently experienced some of their largest ever medical malpractice verdicts. Parts of Maryland, in particular, are becoming extraordinarily difficult venues, especially within the Baltimore City area. Specifically, the average claim closed in Maryland has nearly doubled in the last seven years from $385,000 in 2005 to $750,000 in 2012.
CaliforniaCalifornia Average Severity for Closed Claims with Indemnity – Unlimited
MarylandMaryland Average Severity for Closed Claims with Indemnity – Unlimited
Closing Year
$0
$50,000
$100,000
$150,000
$200,000
$250,000
$300,000
$350,000
201220112010200920082007200620052004200320022001
Closing Year
$0
$100,000
$200,000
$300,000
$400,000
$500,000
$600,000
$700,000
$800,000
201220112010200920082007200620052004200320022001

2013 Aon | ASHRM Hospital and Physician Professional Liability Benchmark Analysis Aon Risk Solutions 73
Time to ClosureBeazley has used its closed claims database to evaluate the average time required to resolve (i.e. closure/settlement) by incurred value and jurisdiction. Average time to closure/resolution is based on the number of months from the date the claim is reported to the date the claim is settled or resolved.
The chart below shows the average number of months taken to close claims incurred above $500,000 by state and over a 12 claims made year period (2000 to 2011). Only states with a statistically credible sample size are displayed.
Average Time to Closure for Claims Greater than $500,000
As expected, large claims take longer to close, but there is wide variance depending on jurisdictions. Nationwide, the average time to close a claim was 21 months. Claims incurred below $100,000 took on average 18 months, while claims incurred above $500,000 took almost 36 months. Generally, it appears that there is a corollary between disposition time and a state’s severity.
High severity venues such as Connecticut, New York, Washington D.C., and Illinois are among the venues with the longest time to closure. Among the Tort Reform states, claims appear to be disposed of most rapidly in Florida, Texas, Maryland, West Virginia, and Virginia.
VAWA
WV
MDTXFLORAZ
NM
MT
NC
OH
GAIATNCOPAM
I
AL
CA
MNKY
MO
NHDENJILD
C
NY
CT
MA
0
10
20
Num
ber
of M
onth
s fr
om R
epor
t to
Clo
se
30
40
50
60

74 2013 Aon | ASHRM Hospital and Physician Professional Liability Benchmark Analysis Aon Risk Solutions
Beazley Group’s Large Claim Analysis
Obstetrics ClaimsObstetrics claims are of particular interest as they continue to present the greatest liability exposure, regardless of jurisdiction. This section seeks to analyze obstetrics claims trends and explain some of the reasons why they are of interest, not only to health care providers, but also to insurers.
Insurers like Beazley have a particular interest in obstetric claims as they are a significant part of the claims covered by excess insurance, as the charts below demonstrate.
The chart below depicts the average incurred cost (including defense payments) of claims closed with indemnity payments of obstetric claims versus all other claims.
Average Severity for Closed Claims with Indemnity - Unlimited
Notably, the chart above reveals that not only have the incurred costs of obstetric claims steadily increased over time, but their rate of increase has significantly outpaced the rate of increase for non-obstetric claims.
$0
$200,000
$400,000
$600,000
$800,000
$1,000,000
$1,200,000
$1,400,000
$1,600,000All Claims OB Claims
20122011201020092008200720062005
$
Closing Year

2013 Aon | ASHRM Hospital and Physician Professional Liability Benchmark Analysis Aon Risk Solutions 75
The significance of obstetrics claims to an excess insurer is highlighted by the chart below which demonstrates that the impact of obstetric claims becomes disproportionally higher as the attachment point increases.
Proportion of Obstetrics Claims to All Claims by Layer
In light of this disproportionate exposure presented by obstetric claims to excess carriers, as well as the increasing severity of these claims, many insurers place great emphasis on an insured’s focus on obstetrical patient safety and quality, and effective risk and claims management.
Benefits can be gained from team training and simulation techniques, the deployment of technology, and the monitoring of OB patient safety indicators.
Beazley is keen to be able to better actuarially analyze the impact of these methodologies and identify emerging trends at an earlier stage, but is limited by the dataset typically captured at this time. Beazley is in the process of developing claims codes that should facilitate such analysis and would welcome health care providers’ input in this regard.
10%
28%
36%
43%
0%
5%
10%
15%
20%
25%
30%
35%
40%
45%
Claims Greater than $5M
Claims Greater than $2M
Claims Greater than $1M
Claims Greater than $0