high school/community college - lwvto.orglwvto.org/docs/fftv-module2-04252019.docx · web...
TRANSCRIPT

High School/Community College Lesson Plan
“Fighting for the Vote”MODULE 2: Voter Turnout (Use Powerpoint, if technology is available)
Overall turnout “So far, we’ve covered all that was done and sacrificed so that we can vote. The interesting question
now is: ‘Are people taking advantage of this hard-won right to vote?’ ‘Do people vote?’” Ask the students to write down their best guess of the percent of eligible voters who actually voted in
the last election (2018). Explain that ELIGIBLE VOTERS are those that meet the requirements (citizen, at least 18 years old, debts paid to society if a former felon)—whether or not they are registered. Call on several students, but don’t reveal the answer. Ask: How many (show of hands) of you think that more than half the people eligible actually voted? How many (show of hands) of you think that less than half the people eligible actually voted?
Click to reveal the pie graph showing 50% of the population voting (prize awarded to anyone who wrote 50%)
Using your hand, divide the class down the middle – Point out that effectively, one side is making all the decisions for the other side - gun control, school funding, health care, the environment, roads, recreation in town – other things that matter to you and your future
Ask: “Are you surprised?” “Does it worry you that such a small part of the population is making decisions for all of us?”
Show the slide depicting voter turnout rates from 1916-2018. Explain what they are looking at:The purple line shows the percent of turnout in every Presidential election since 1916. The blue line show voter turnout for what we call “mid-term elections”—elections in years where we elect Congress members but not a president.
Copyright © 2019 by the League of Women VotersApril 23, 2019
Module 2-1
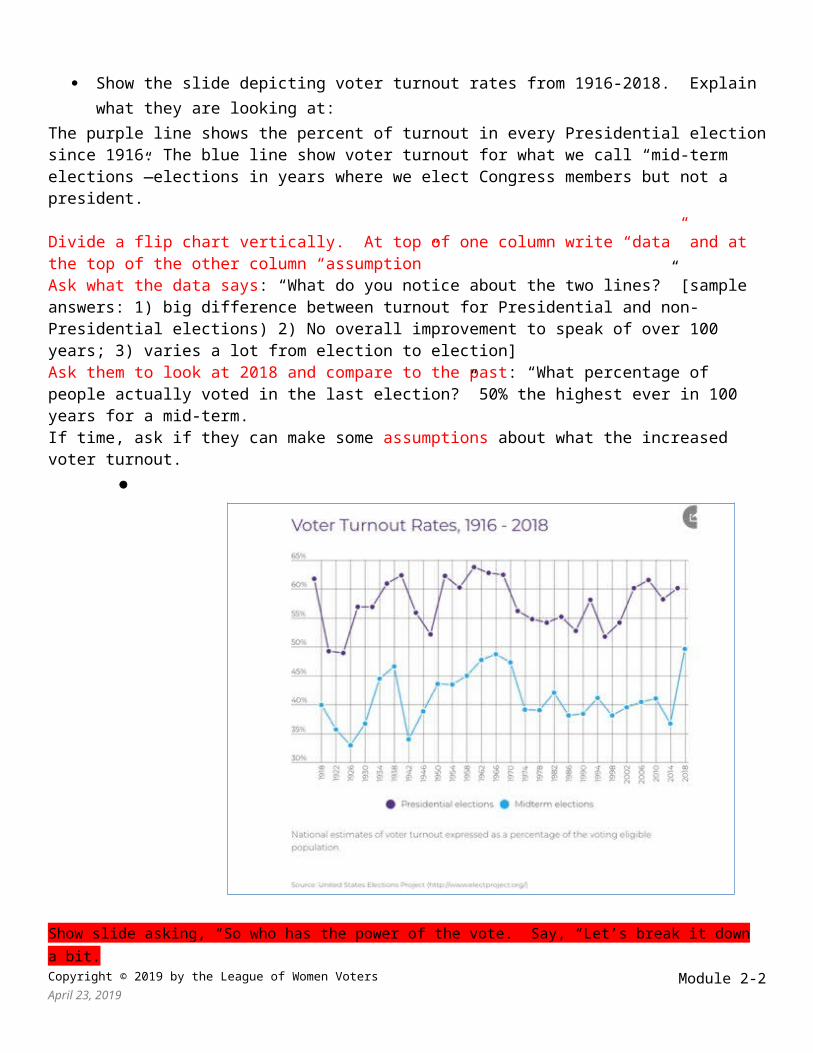
Divide a flip chart vertically. At top of one column write “data” and at the top of the other column “assumption”Ask what the data says: “What do you notice about the two lines?” [sample answers: 1) big difference between turnout for Presidential and non-Presidential elections) 2) No overall improvement to speak of over 100 years; 3) varies a lot from election to election]Ask them to look at 2018 and compare to the past: “What percentage of people actually voted in the last election?” 50% the highest ever in 100 years for a mid-term. If time, ask if they can make some assumptions about what the increased voter turnout.
Show slide asking, “So who has the power of the vote. Say, “Let’s break it down a bit.
Copyright © 2019 by the League of Women VotersApril 23, 2019
Module 2-2

Insert graph showing turnout by age in Presidential and mid-term elections 18-29Explain what they are looking at – this graph shows the % of eligible voters in each election from 1986 to 2016.among people in your age group (18-29)It shows both Presidential and mid-term election turnoutAsk what the data says: “What do you notice about the line?” [sample answers: 1) big difference between turnout for Presidential and non-Presidential elections) 2) varies a lot from Presidential election to Presidential election; 3) It shows a nearly static turnout for mid-term elections Chart under “data”
Copyright © 2019 by the League of Women VotersApril 23, 2019
Module 2-3

Ask them to make some assumptions about the high turnout years Likely answers 1) 2008 was the year Obama ran for President and young voters were more engaged in his candidacy; 2) Social media was first used to reach out to younger votersLet’s break it down further. Explore turnout by AGE We’ll look at presidential over the past 20 or so years. The show the slide below
Ask: “What does the line tell you about voter turnout among people in your age group?” Ask one or two students (Do not add ideas to chart yet.)
Show the chart. [Source: United States Elections Project electproject.org/home/voter-turnout/demographics). If using a poster, all the data are on a single poster and will need additional explanation. If using slides not a poster, the slides will build, adding one age group at a time, starting at the top. Discuss what they are looking at: “The lines go up as the age goes up. The blue line is THEIR line and the 18-to-29-year-olds show the lowest voter turnout every election. The oldest voters, the purple line, have the highest turnout, year after year.”
Pause only for a moment, then go to the next slide.
Copyright © 2019 by the League of Women VotersApril 23, 2019
Module 2-4

Say, “The added line shows voter turnout among people 30-44 years of age.” Pause for a moment, then go to the next slide
This line shows voter turnout among people 45-59 years of age.” Pause for a moment, then go to next slide.
Copyright © 2019 by the League of Women VotersApril 23, 2019
Module 2-5
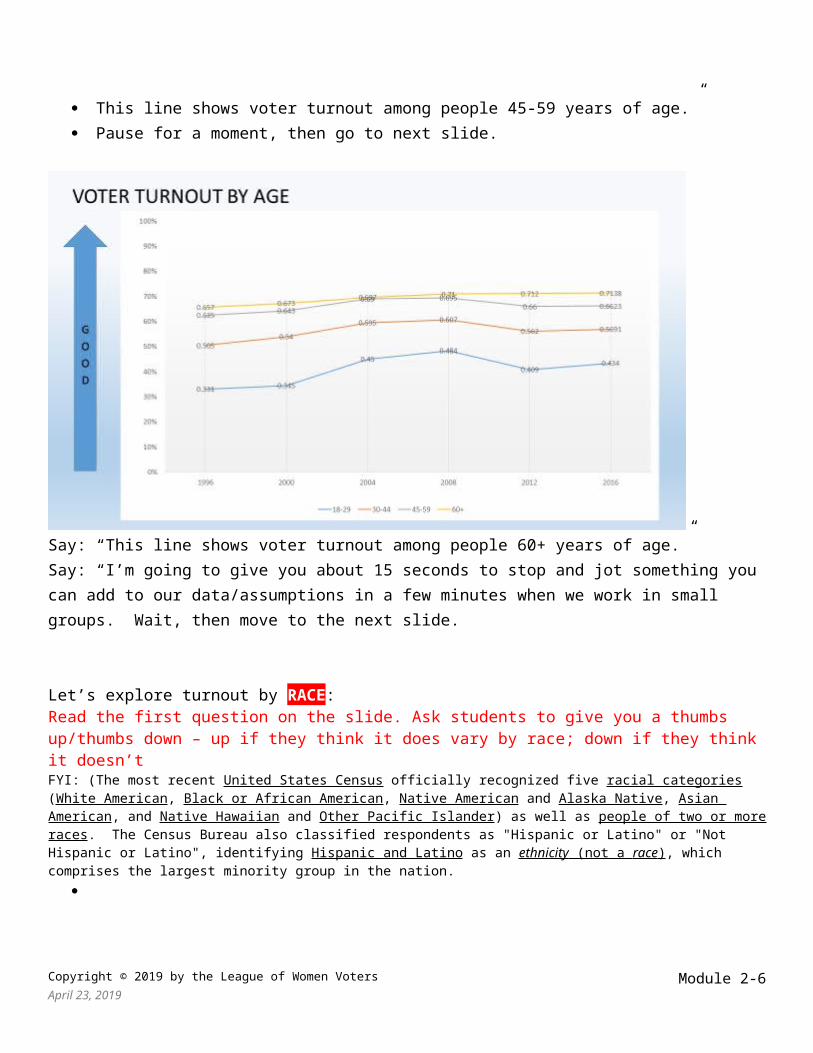
Say: “This line shows voter turnout among people 60+ years of age.”Say: “I’m going to give you about 15 seconds to stop and jot something you can add to our data/assumptions in a few minutes when we work in small groups. Wait, then move to the next slide.
Let’s explore turnout by RACE: Read the first question on the slide. Ask students to give you a thumbs up/thumbs down – up if they think it does vary by race; down if they think it doesn’tFYI: (The most recent United States Census officially recognized five racial categories (White American, Black or African American, Native American and Alaska Native, Asian American, and Native Hawaiian and Other Pacific Islander) as well as people of two or more races. The Census Bureau also classified respondents as "Hispanic or Latino" or "Not Hispanic or Latino", identifying Hispanic and Latino as an ethnicity (not a race ) , which comprises the largest minority group in the nation.
Copyright © 2019 by the League of Women VotersApril 23, 2019
Module 2-6

For presentations with limited time, the following slide is hidden. Move to the next slide showing a graph of white voter turnout in the past Presidential elections.Move to the next slide and show the chart below.
Say: “The voting population in the United States originally was all white, land-owning men. We saw that voting population change over time in our avatar game. That change means, of course, that our electorate has become more representative of our actual adult population over time. It also means that the percentage of white voters has been decreasing in terms of the share of voting power they have to affect the laws and policies in our communities and nation.” Explain what they are looking atCopyright © 2019 by the League of Women VotersApril 23, 2019
Module 2-7

Total percentage of white share of the electoratePresidential and mid-term elections1984-2016 – about 30 yearsObserve:In 1986, the white share of the electorate was 85% (15% was non-white)In 2016, the white share of the electorate was 73% (27% was non-white)Ask: “What does the line tell you about the trend in our national electorate?”Ask one or two students to respondGo to next slide
Show the chart. [Source: United States Elections Project electproject.org/home/voter-turnout/demographics) If using slides not a poster, the slides will build, adding one ethnic group at a time, starting at the top. Discuss what they are looking at. Explain the key—the ethnic group represented by each color. Ask the students to interpret the chart and reserve their answers until the end for group work. “1) Which group usually has the highest turnout? In what years did black voters turn out in greater percentages than white? Why do you think?”
Explain what they are looking at Total voter turnout among people who are non-Hispanic whites only (all ages) Presidential elections only
Copyright © 2019 by the League of Women VotersApril 23, 2019
Module 2-8

1992-2016 – the years most of you have been on this earth
Ask: “What does the line tell you about voter turnout among whites?”Ask one or two students to respond (DO NOT CHART YET)Pausing only for a moment, then Go to next slide
say: “This slide adds voter turnout among people who are non-Hispanic blacks.”Go to next slide
Copyright © 2019 by the League of Women VotersApril 23, 2019
Module 2-9

say: “This slide adds voter turnout among Hispanic voters.”Go to next slide
say: “This slide adds voter turnout among other racial and ethnic groups” Say: “I’m going to give you about 15 seconds to stop and jot something you can add to our data/assumptions when we break into small groups.Wait, then go to the next slide.
Copyright © 2019 by the League of Women VotersApril 23, 2019
Module 2-10

Explore turnout by EDUCATION: “Let’s look one more variable—how much education the voter has. Before we see the chart, do you think that voter turnout varies by education? If so, what do you guess is the relationship between education and voter turnout?” . [Source: United States Elections Project electproject.org/home/voter-turnout/demographics
Explain what they are looking at: Total voter turnout among people with less than a high school diploma
Copyright © 2019 by the League of Women VotersApril 23, 2019
Module 2-11

Presidential elections only 1988-2016 – 30 years
Ask: “What does the line tell you about voter turnout among people who don’t have a high school diploma or GED?”Ask one or two students to respond (DO NOT CHART YET)Pausing only for a moment, then Go to next slide
Copyright © 2019 by the League of Women VotersApril 23, 2019
Module 2-12

Say: “This slide adds voters who turned out who are high school grads
Go to next slideSay: This slide adds those who have some college education through to college gradsGo to next slide
Say: “And finally, this slide adds those voters who have a post-graduate degree”Say: “I’m going to give you about 15 seconds to stop and jot something you can add to our data/assumptions when we break into small groups
Copyright © 2019 by the League of Women VotersApril 23, 2019
Module 2-13

Turn and Talk: Say: “You will have two-three minutes to turn to the person next to you. Share your statements about each of the sets of charts with each other and then together, create a statement of one or more assumptions which the data suggests. Write them down.”Walk around to be sure everyone is engaged (give a private nudge if someone seems unengaged.) When pairs are finished, or at the end of 3 minutes at the most, call on each group at random and chart the facts evident from each set of charts.Move to next slide. Slides will animate to reveal one statement at a time after a blank blue slide begins the reveal.
Ask: “Do you wonder why we have a lot of old, white men in government?” Why are differences we see between age groups, races, and educational levels important? What do they mean to you?”
Go to next slide. Bring home the message:
Copyright © 2019 by the League of Women VotersApril 23, 2019
Module 2-14

Say: 1) “In elections to the present, the older, the white, and the more education you have been able
to obtain, the more likely you are to vote.” 2) Even in the highest turnout group (mine), more than ¼ of the people eligible to vote choose not
to.3) Among the young (people 18-29 who are in the room,) the record is awful. More than ½ of
those who are eligible to vote choose not to. Ask ½ of the class to stand. 4) Point out that those sitting are letting those standing make the decisions for them on things like
the environment, gun safety, reproduction rights, taxes, health care, school funding, and so much more.
Next slide
Copyright © 2019 by the League of Women VotersApril 23, 2019
Module 2-15

Say: “Take 1 minute to turn and talk. Brainstorm as many reasons as you can think of to answer this question about your own age group. “What keeps people from voting? Why do you think people don’t vote?”
Record on a new flip chart, randomly calling each group in the room. Put a check mark by any duplicate answers. Ask: “Does anyone have another idea that hasn’t been boarded?” Draw any conclusions that pop out from the list.Next slide
Discussion of root causesSay: “We need you to help us SOLVE THIS PROBLEM.”
Copyright © 2019 by the League of Women VotersApril 23, 2019
Module 2-16

Ask pairs of students to join another pair for the next activity. Ask students: “If you were in charge, what would you do or what would you change to get people out to vote?”Allow 2-3 minutes (judge by conversation when to stop, but definitely by 3 minute mark.)Randomly call on each group to capture as many ideas as possible on a new flip chart. Put a check mark next to an idea that’s already on the flip chart. Tell the students they are contributing to our understanding of ways we can GOTV. Summarize the themes.Next slide.
Why don’t people vote? Summarize the themes.
Copyright © 2019 by the League of Women VotersApril 23, 2019
Module 2-17

BRAINSTORM PERSONAL ACTIONS: Ask students to work in groups of 4 for 2 minutes and develop a list what they themselves could do to improve voter turnout.
What I can do 1. Call on each four-person team and capture their responses on the flip chart. Put a check mark next to an idea that’s already on the flipchart.
2. Invite students to look at their personal lists and see if there is anything that should be added
Chart the ideas on a new flipchart sheet.
Summarize the themes. State your “vote of confidence” that everyone in the room will vote in the coming year if they are eligible
GIVE OUT THE “FIGHTING FOR THE VOTE” WRIST BANDS
PRACTICE WHAT TO SAY: Explain that they may get questions about their wrist bands. Refer to the flipchart list of “Why people don’t vote” and anticipate what questions/objections they might hear. [My vote won’t make it difference. It’s too much bother. The powers-that-be control the outcome . . . Role play the questioner and call on students to offer an “answer.” Ask the class to support the student responder with other ideas.
Copyright © 2019 by the League of Women VotersApril 23, 2019
Module 2-18

Share voter support tools:
1) Hand out Voting Reminder/VOTE411 cards and explain those who are, or who intend to register to vote when able, can text the word VOTE to the non-partisan LWV. (Info will be used ONLY for sending a reminder to vote prior to the elections.) If time, give students the opportunity to so while in the room.
2) Point out that the VOTE411 (on other side of card) has voter information tailored to you. You enter your address and see what will be on your ballot, where to go to vote, polling hours, and more. It also has a hotline to call if you have any trouble voting.
Ask students to write down one new thing they will do to personally take responsibility for increasing voter turnout.
Have voter registration forms available to pass out to anyone who needs them for themselves, friends, or family members.
Copyright © 2019 by the League of Women VotersApril 23, 2019
Module 2-19