high-shear granulation modeling using a discrete element
TRANSCRIPT
High-Shear Granulation Modeling Using a Discrete ElementSimulation Approach
Justin A. Gantt and Edward P. Gatzke
Department of Chemical EngineeringThe University of South Carolina
301 Main Street, Columbia , SC 29201
Abstract
This work develops a method for prediction of dynamicchanges in particle size distributions (PSD) of high-sheargranulation systems using a discrete element simulationtechnique. This method allows for direct evaluation ofparticle interactions based on multi-dimensional descrip-tions of particle parameters. Pouw et al. [37] proposedthe use of a volume-based Population Balance Equation(PBE) model with the volume of solid, liquid, and gasin each particle as internal parameters to predict result ofparticle interactions. This paper extends on the work ofPouw et al. by using a discrete element simulation ap-proach rather than direct application of population bal-ance equations to determine the evolution of particle sizedistributions. This is accomplished by simulating the ef-fects of particle interactions based on physically signifi-cant coalescence criteria.
Three granule modification mechanisms are used in theproposed method: coalescence, consolidation, and break-age. Two types of coalescence are modeled in this simula-tion. In Type I coalescence, granules are stopped solely byviscous dissipation of the binder layer before the granulesolid surfaces touch, whereas Type II coalescence occurswhen weak deformable granules come into contact withtheir solid surfaces and the granule surfaces then bind to-gether. Consolidation, the escape of air from granules dueto compaction following collisions, is described by an ex-ponential relationship related to the porosity of each indi-vidual simulated particle. One may assume that breakagewill occur when there is sufficient externally applied ki-netic energy to deform and shear a granule. Breakage canbe determined based on whether the Stokes deformationnumber for a particle exceeds a critical value.
One objective of this work is to move toward modelingand simulation methods that allow for dynamic changesin operating conditions at any time in a batch run. Currentempirically based coalescence kernels used in populationbalance based models are generally developed using staticoperating conditions, limiting the model validity for on-
line control applications. The main contribution of thiswork lies in the observation that when using this type ofsimulation model, the physics of the granulation systemcan be altered more easily than modeling the granulationprocess using traditional population balance. Systems ex-hibiting a wide range of deformations can be modeled todetermine boundaries for Type I coalescence, Type II co-alescence, or rebound events based on physical argumentsrather than extrapolation of empirically based coalescencekernels. Using similar initial and operating conditions,the discrete element simulation is shown to produce re-sults similar to population balance results. To examine theextended flexibility of the new modeling method, severalopen-loop simulations using this method are presented inthis paper to display how a process would dynamicallyreact to changes in operating conditions.
1 IntroductionGranulation is a size enlargement technique where small,dry particles agglomerate to form larger aggregate parti-cles by means of binder addition and process agitation.Types of granulation processes include fluidized bed, pan,drum, and high-shear mixer granulation. Size enlarge-ment is used in industry for many purposes: eliminationof dust to mitigate handling hazards or minimize losses,increased bulk density during storage, control of productsolubility, control of porosity, improved product appear-ance, improved heat transfer characteristics, etc. [10]. Formost size enlargement processes, the granule size distri-bution is a property of primary importance, directly re-lated to product quality. Modeling and control of the evo-lution of granule size distributions can be investigated us-ing a variety of modeling techniques.
Models based on Population Balance Equations(PBE’s) are crucial in the field of particulate process anal-ysis because these models allow for the calculation of sizedistribution, as well as the determination of controllinggranulation mechanisms. PBEs are particularly usefulwith respect to process control through the use of sensitiv-
1
ity analysis to determine how changes to input conditionseffect product quality [10]. In most cases, the analyti-cal solution to a population balance is not trivial. Manymethods for the modeling of aggregate processes usingdiscrete population balances have been proposed, whereparticles of different sizes exist in discrete groups that in-teract collectively with particles in other groups. Variousresearchers (Batterham et al., 1981[5], Ramkrishna et al.,1985[38], Hounslow et al., 1988[14]), pioneered the useof numerical techniques to solve a PBE in order to find adiscretized solution for these agglomerate processes.
Modeling of a granulation process using only a one-dimensional PBE, as is commonly done in practice, willnot suffice in most situations because it will not capturethe true intergranular behavior between particles [17, 4].Several independent granule properties such as porosity,pore saturation, and moisture fraction have been provento strongly effect granular behavior [20, 16]. These prop-erties have been found to be most easily modeled whenthe intrinsic particle parameter used in the PBE is the par-ticle volume [37]. Using volume as the intrinsic parame-ter in a population balance allows for the PBE to be con-sistent with the mass balance; this is not necessarily truewhen particle size is used as an intrinsic parameter be-cause changes in particle diameter are not additive. Pouwet al. [37] proposed a multi-dimensional population bal-ance, which uses volume as the intrinsic parameter. Thisvolume-based model tracks the evolution of the volume ofsolids, volume of liquid, and volume of air of a nucleatedgranule at each time step. Other models have been estab-lished using these intrinsic parameters to calculate granu-late parameters such as pore saturation, porosity, and liq-uid fraction. Kumar and Ramkrishna [28] have shownthat most discretized population balance equations for ag-glomerate processes often over-predict number densitiesfor large particles, so other methods for predicting parti-cle size distributions would be beneficial for properly es-timating aggregate-breakage process parameters [28, 29].
This work extends current granulation models that usevolume as the intrinsic parameter by use of a dynamicsimulation approach, with some characteristics of MonteCarlo modeling. The proposed discrete element methodallows for the determination of particle size distributionsas well as pore saturation, porosity, or other properties ofgranules in each size class. In this simulation work, afinite number of particle are initially given velocity andposition values in a three dimensional space. These parti-cles are also initialized with internal solid, liquid, and gasvolume values. Using these internal parameters, granularproperties such as porosity, pore saturation, liquid content[47, 46], moisture fraction, size class, liquid binder thick-ness [31], granule yield stress [44], and strain are calcu-lated based on models for intragranular properties. Mul-tiple simulations are performed and averaged to mitigate
effects of random initial conditions and limited samplingsize.
Granulation rates are controlled by several key parti-cle changing mechanisms: coalescence, breakage, con-solidation, attrition, and evaporation [19, 31, 32]. Somemechanisms such as breakage and coalescence apply tothe entire particle, while others only apply to only a cer-tain phase (i.e. consolidation only applies to air volumeand evaporation only applies to liquid volume). To sim-plify the simulation process, only three primary mecha-nisms are taken into account in this work: coalescence,consolidation, and breakage.
Coalescence between particles is based on a physicallysignificant coalescence kernel that depends on the fol-lowing dimensionless parameters: (1) the viscous Stokesnumber Stv, a measure of the kinetic energy of a particlemade dimensionless with respect to the scale of viscousdissipation of the liquid binder layer, (2) the Stokes de-formation number Stdef , which is the ratio of the impactkinetic energy to the plastic deformation of the particle,(3) the ratio of the plastic yield stress to the elastic modu-lus, Yd/E
∗, and (4) the ratio of the liquid layer thicknessto the height of the surface asperities, ho/ha. Each ofthese dimensionless parameters are calculated and contin-uously updated during the simulation based on the varyingintrinsic parameters of each individual particle.
Using this dynamic simulation method, several testshave been performed to simulate granular behavior un-der different operating conditions. The dynamic results ofthe simulation show an induction period where the liquidin the particle becomes compressed through the pores dueto consolidation until the liquid layer thickness of eachparticle reaches a level capable of supporting successfulcollisions resulting in coalescence. Rapid particle growthis observed following this induction period. When fivesize classes are used to describe the granulation process,the results found using this approach are analogous to re-sults found by Pouw et al. using an extended populationbalance model [37]. Dynamic effects observed using an-alytical methods can also be observed using the discreteelement simulation approach. These effects include in-creasing pore saturation and a decreasing porosity due toconsolidation,
2 Theory
The proposed simulation method is developed from a col-lection of physics-based models. The discrete elementsimulation method uses fundamental expressions for de-termination of coalescence or rebound when individualparticle collisions occur. The details of these expressionsare described in the following sections.
2
(s1, l1, a1) (s2, l2, a2) (s3, l3, a3)
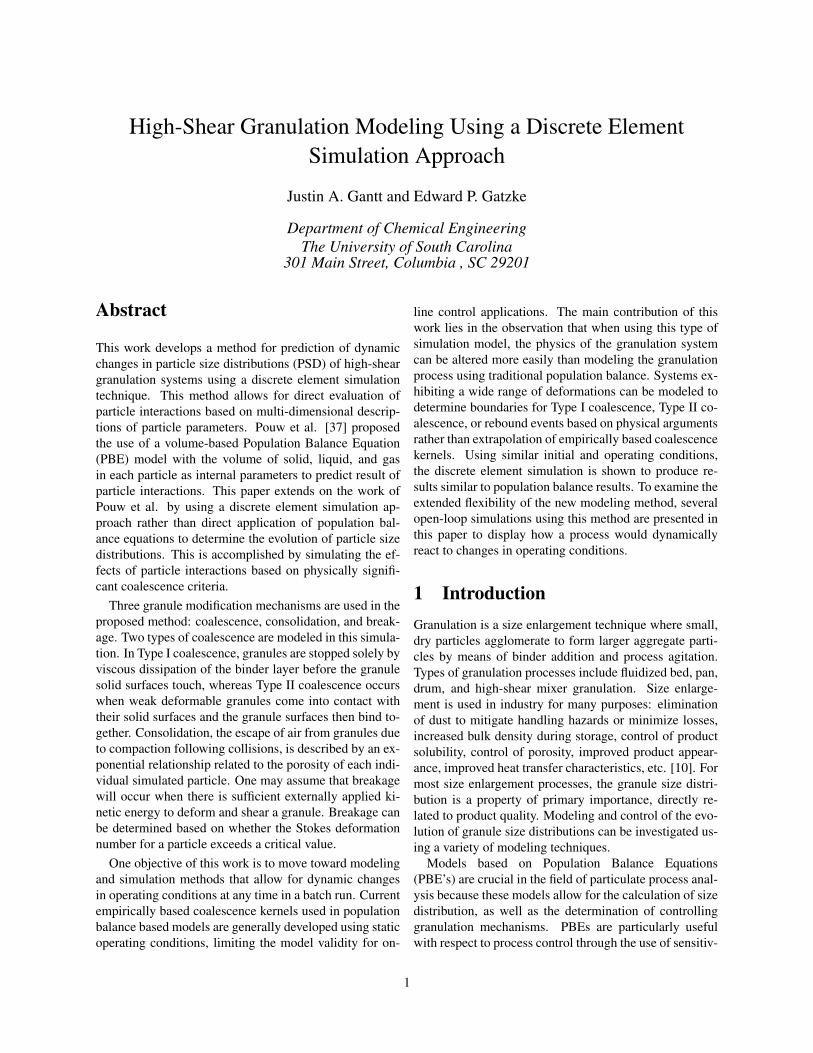
Figure 1: Coalescence of two particles using volume asthe internal property.
2.1 Basic particle representationIt is assumed that the granules in the simulation are ina nucleated particle matrix each with an identical initialpore saturation due to an assumed uniform binder disper-sion in the granulator. The binder is assumed to be a com-pressible Newtonian fluid and the granule is assumed toreact as a simple elastic-plastic solid as described by Liuet al. [32]. Due to an assumed uniform binder disper-sal method, the granules are assumed to follow a normalinitial nuclei distribution. Using granule volume as the in-trinsic parameter in the simulation, Pouw et al. [37] pro-posed a method where a particle volume can be describedas a vector G composed of the granule solid volume s,liquid binder volume l, and air volume a:
G = [s l a]T (1)
where the total volume of granule i is the sum of the threecomponents:
Vi = si + li + ai (2)
Using this initial composition of phases in each granule,internal granule properties such as porosity ε, moisturefraction w, pore saturation S, and liquid fraction L, canbe calculated as:
εi = li+ai
si+li+ai
wi = lisi
Si = lili+ai
Li = lisi+li+ai
(3)
Assuming that the densities of each phase are assumedconstant, the mass of the granule m, can easily be calcu-lated as well;
mi = ρs · si + ρl · li + ρa · ai (4)
where ρs, ρl, and ρa are the densities of the solid pow-der, liquid binder and air, respectively. In the event ofcoalescence, the volumes and masses of each phase of thecoalescing particles are added to calculate the volume andmass of the new particle, while internal parameters suchas porosity and moisture fraction are not additive and mustbe recalculated, see Figure 1.
Pore saturation is a critical parameter for modeling co-alescence of granules, as pore saturation can be assumed
to be the determining parameter in the calculation of a liq-uid binder layer on a granule [31]. If the pore saturation,S, is greater than a critical value, S∗, then the particleis considered oversaturated and the binder layer first ap-pears. Assuming that the binder layer, h0, is much smallerthan the granule diameter, (h0 � D), Liu and Litster [31]derived the binder layer thickness as :
h0 =
{D(L−εS∗)
6 ; L > εS∗
0; L < εS∗(5)
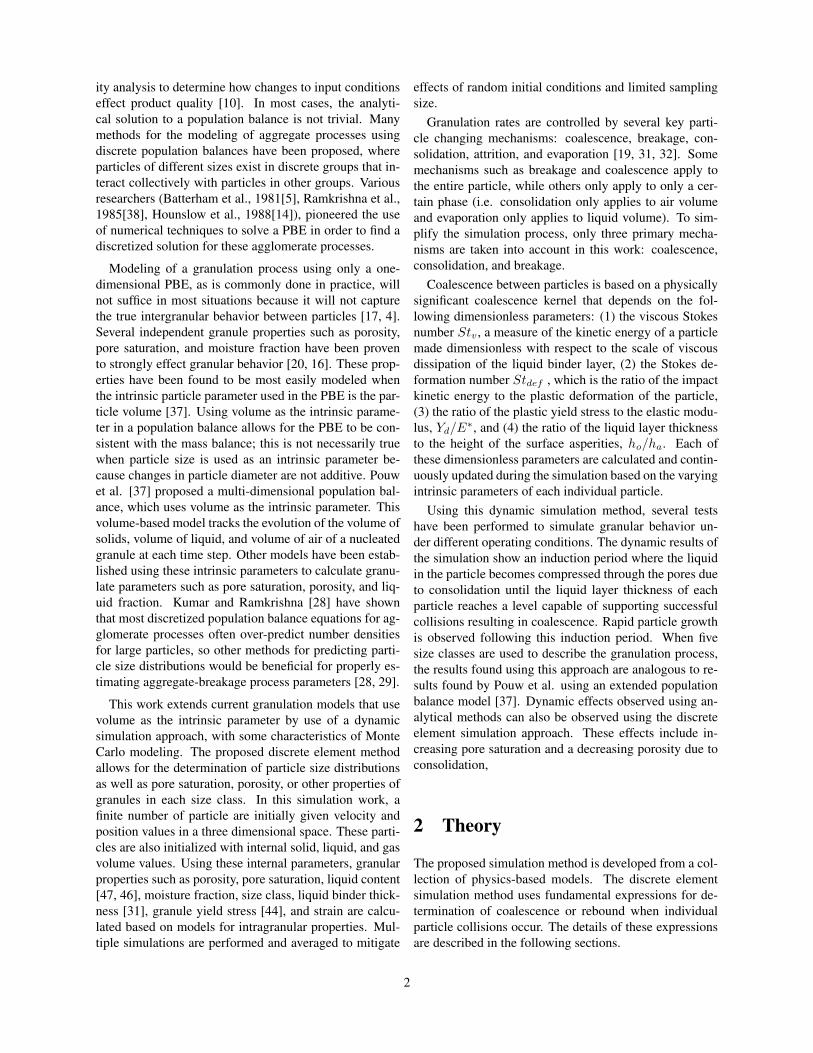
2.2 Coalescence of surface wet granulesLiu [31] presents a criteria for coalescence among de-formable surface-wet granules. This criteria was first de-rived using contact mechanics described by Johnson [21].Their model assumes that deformation begins when gran-ules are in physical contact, liquid capillary forces arenegligible, the interparticle attractive forces are negligi-ble, and fluid cavitation does not occur during rebound.Their model also neglected breakage following deforma-tion, which will be discussed later. The work presentedhere considers the collision between two particles with aliquid binder layer present. The collision velocity used istwice the relative velocity of the particles, 2u0, where therelative velocity between particles i and j is:
u0 =
√(vxi
− vxj
)2+(vyi
− vyj
)2+(vzi
− vzj
)2
2(6)
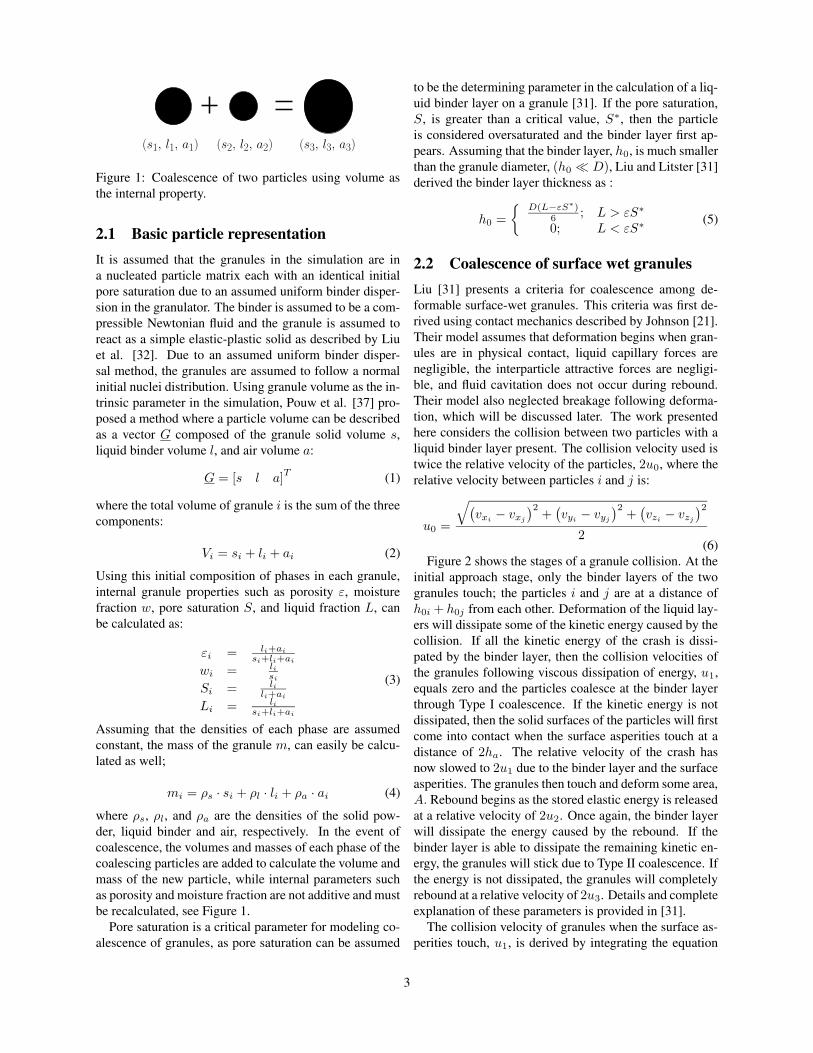
Figure 2 shows the stages of a granule collision. At theinitial approach stage, only the binder layers of the twogranules touch; the particles i and j are at a distance ofh0i + h0j from each other. Deformation of the liquid lay-ers will dissipate some of the kinetic energy caused by thecollision. If all the kinetic energy of the crash is dissi-pated by the binder layer, then the collision velocities ofthe granules following viscous dissipation of energy, u1,equals zero and the particles coalesce at the binder layerthrough Type I coalescence. If the kinetic energy is notdissipated, then the solid surfaces of the particles will firstcome into contact when the surface asperities touch at adistance of 2ha. The relative velocity of the crash hasnow slowed to 2u1 due to the binder layer and the surfaceasperities. The granules then touch and deform some area,A. Rebound begins as the stored elastic energy is releasedat a relative velocity of 2u2. Once again, the binder layerwill dissipate the energy caused by the rebound. If thebinder layer is able to dissipate the remaining kinetic en-ergy, the granules will stick due to Type II coalescence. Ifthe energy is not dissipated, the granules will completelyrebound at a relative velocity of 2u3. Details and completeexplanation of these parameters is provided in [31].
The collision velocity of granules when the surface as-perities touch, u1, is derived by integrating the equation
3
2. Deformation stage; solid layers touch.
u0u0
ha
2h0
Dh0
4. Final separation stage; Type II coalscence or rebound occurs.
3. Initial separation stage; rebound begins.
1. Initial approach stage; Type I coalescence may occur.
u1u1
�
u2u2
u3u3 2h0
2a
Figure 2: Current model used to predict coalescence be-tween granules. [31, 19]
of motion. The collision velocity is found to be:
u1 = u0
[1 −
1
Stvln
(h0
ha
)](7)
where h0/ha is the ratio of the binder layer thickness tothe height of the surface asperities and Stv is the viscousStokes number given as [19, 8, 31]:
Stv =8m̃u0
3πµD̃2(8)
where m̃ is the mean harmonic mass, µ is the binder vis-cosity, and D̃ is the mean harmonic diameter of particlesi and j given by:
m̃ =mimj
mi + mj(9)
D̃ =DiDj
Di + Dj(10)
As previously stated, if the viscous dissipation of thebinder layer is sufficient to bring the granule velocity atthe binder layer, u1, equal to or less than zero, then Type Icoalescence takes place. The criteria defined by Liu [31]states:
Stv < ln
(h0
ha
)(11)
When the dissipation is not great enough to halt the gran-ules and deformation occurs, the maximum deformed areawas derived in Equation 10 of [31] to be:
A∗ = πD̃δ∗ = 2u1
√√√√[
πm̃D̃
3Yd
](12)
where δ∗is the maximum compression distance and Yd isthe yield strength of the granule. Liu [31] used an ap-proximation experimentally developed by Johnson [21],which showed that the yield strength could be approxi-mated as one third of the mean contact pressure. Bull[6] provided a relationship between mean contact pres-sure, P , and maximum tensile stress, σt, by defining eachin terms of the maximum contact pressure between twoelastic-plastic spherical bodies, P0:
P0 =1
π
[24P (E∗)
2
D̃2
]1/3
(13)
where P is the contact force between the particles and E∗
is the effective Young’s modulus between two particles:
E∗ =1 − ν2
1
E1+
1 − ν22
E2(14)
4
Here E1 and E2 are the Young’s modulus of the two gran-ules, and ν1 and ν2 are the Poisson ratios. The mean con-tact pressure, P , was defined by Bull as 2
3P0. Further-more, the maximum tensile stress is defined as a functionof the maximum contact pressure by:
σt =1
3(1 − 2ν)P0 (15)
Iveson et al. [18] used a model previously derived byRumpf [40], which assumed that for granules in the funic-ular or capillary states, the maximum tensile stress couldbe modeled in terms of internal granular properties by
σt =1 − ε
ε
SC γl
Dpcos (θ) (16)
where C is a shape factor (6 for spheres), Dp is the di-ameter of the particles making up the granules, γl is theliquid surface tension, and θ is the solid-liquid contact an-gle (assumed to be zero throughout these simulations).
Combining Equations 15 and 16 and expressing the re-sult in terms of the yield stress results in an expression forthe yield stress in terms of internal parameters:
Yd =2
3
σt
1 − 2ν=
2
3 − 6ν
1 − ε
ε
SC γl
Dpcos (θ) (17)
For many solids ν = 0.3 [30, 6], producing a yield stressof Yd = 5
3σt.The initial rebound velocity as defined by Liu [31] is:
u2 ≈ 2.46
√Yd
E∗
(m̃u2
0
2D̃3Yd
)−1/8(1 −
1
Stvln
h0
ha
)3/4
(18)The permanent deformation, δ
′′
, is defined as the maxi-mum deformation, δ∗ minus the extent of elastic recovery,δ′
:δ′′
=A∗
πD̃−√
A∗π9Yd
4E∗(19)
The granule velocity, u3, at the separation distance whenthe bridge will rupture, 2h0, is defined by Liu as
u3 = u2 −3πD̃2
(δ′′
)2
16m̃h20
×
[(h2
0
h2a
− 1
)+
2h0
δ′′
(h0
ha− 1
)+
2h20
(δ′′)2 ln
(h0
ha
)]
(20)By setting the rebound velocity, u3 < 0, the criteria forType II coalescence was developed by Liu [31] for thesituation in which δ
′′
> 0:
√Yd
E∗St
(−9/8)def <
0.172
Stv
(D̃
h0
)2 [1 −
1
Stvln
h0
ha
]5/4
×
[(h2
0
h2a
− 1
)+
2h0
δ′′
(h0
ha− 1
)+
2h20
(δ′′)2 ln
(h0
ha
)]×
{1 − 7.36
Yd
E∗St
−1/4def
[1 −
1
Stvln
h0
ha
]−1/2
}2
(21)
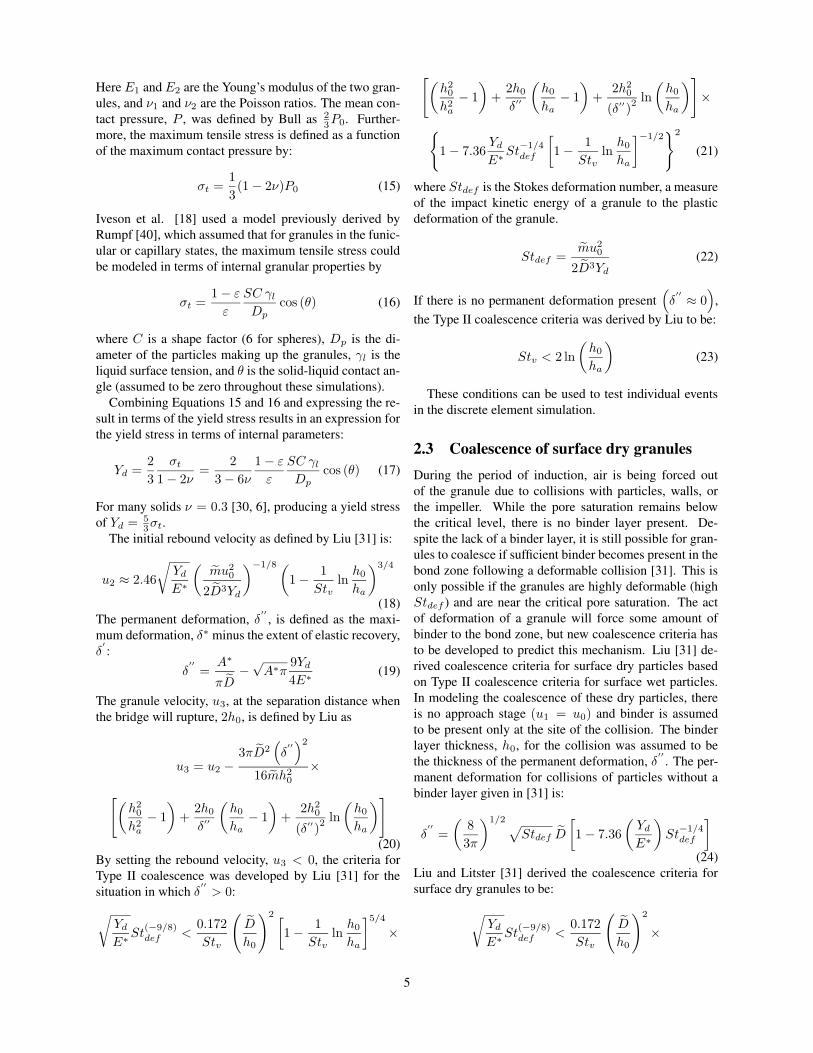
where Stdef is the Stokes deformation number, a measureof the impact kinetic energy of a granule to the plasticdeformation of the granule.
Stdef =m̃u2
0
2D̃3Yd
(22)
If there is no permanent deformation present(δ′′
≈ 0)
,the Type II coalescence criteria was derived by Liu to be:
Stv < 2 ln
(h0
ha
)(23)
These conditions can be used to test individual eventsin the discrete element simulation.
2.3 Coalescence of surface dry granulesDuring the period of induction, air is being forced outof the granule due to collisions with particles, walls, orthe impeller. While the pore saturation remains belowthe critical level, there is no binder layer present. De-spite the lack of a binder layer, it is still possible for gran-ules to coalesce if sufficient binder becomes present in thebond zone following a deformable collision [31]. This isonly possible if the granules are highly deformable (highStdef ) and are near the critical pore saturation. The actof deformation of a granule will force some amount ofbinder to the bond zone, but new coalescence criteria hasto be developed to predict this mechanism. Liu [31] de-rived coalescence criteria for surface dry particles basedon Type II coalescence criteria for surface wet particles.In modeling the coalescence of these dry particles, thereis no approach stage (u1 = u0) and binder is assumedto be present only at the site of the collision. The binderlayer thickness, h0, for the collision was assumed to bethe thickness of the permanent deformation, δ
′′
. The per-manent deformation for collisions of particles without abinder layer given in [31] is:
δ′′
=
(8
3π
)1/2√Stdef D̃
[1 − 7.36
(Yd
E∗
)St
−1/4def
]
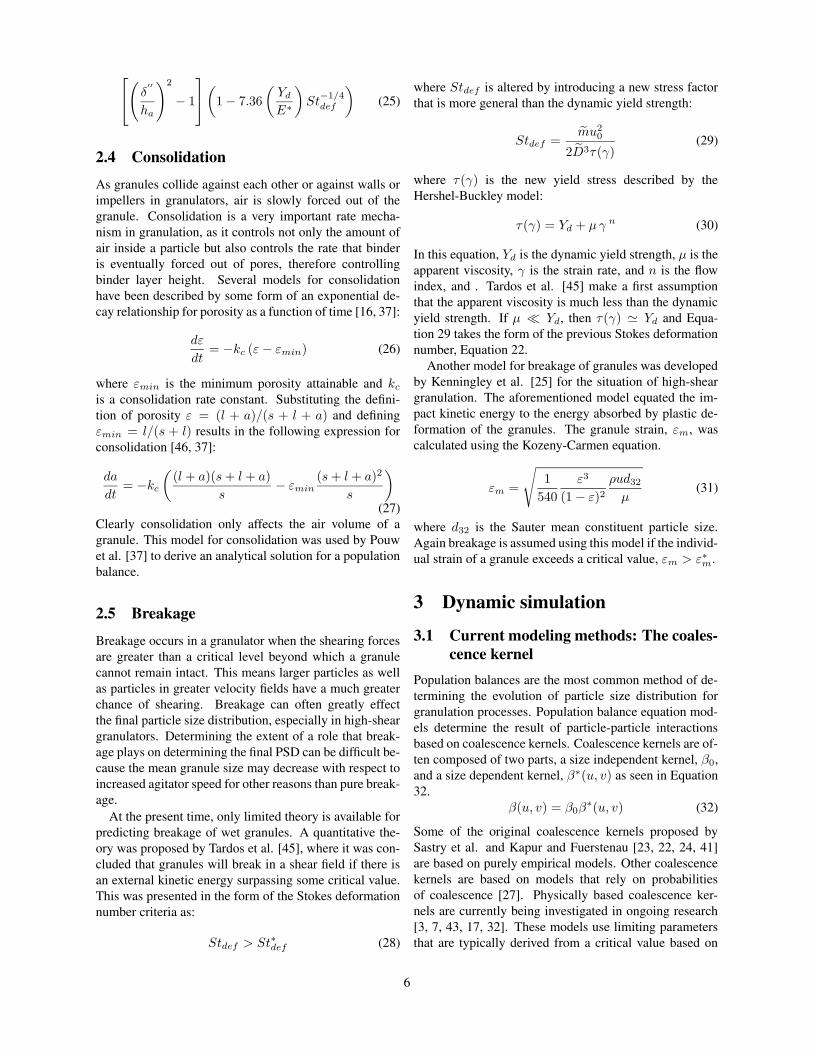
(24)Liu and Litster [31] derived the coalescence criteria forsurface dry granules to be:
√Yd
E∗St
(−9/8)def <
0.172
Stv
(D̃
h0
)2
×
5
(
δ′′
ha
)2
− 1
(
1 − 7.36
(Yd
E∗
)St
−1/4def
)(25)
2.4 Consolidation
As granules collide against each other or against walls orimpellers in granulators, air is slowly forced out of thegranule. Consolidation is a very important rate mecha-nism in granulation, as it controls not only the amount ofair inside a particle but also controls the rate that binderis eventually forced out of pores, therefore controllingbinder layer height. Several models for consolidationhave been described by some form of an exponential de-cay relationship for porosity as a function of time [16, 37]:
dε
dt= −kc (ε − εmin) (26)
where εmin is the minimum porosity attainable and kc
is a consolidation rate constant. Substituting the defini-tion of porosity ε = (l + a)/(s + l + a) and definingεmin = l/(s + l) results in the following expression forconsolidation [46, 37]:
da
dt= −kc
((l + a)(s + l + a)
s− εmin
(s + l + a)2
s
)
(27)Clearly consolidation only affects the air volume of agranule. This model for consolidation was used by Pouwet al. [37] to derive an analytical solution for a populationbalance.
2.5 Breakage
Breakage occurs in a granulator when the shearing forcesare greater than a critical level beyond which a granulecannot remain intact. This means larger particles as wellas particles in greater velocity fields have a much greaterchance of shearing. Breakage can often greatly effectthe final particle size distribution, especially in high-sheargranulators. Determining the extent of a role that break-age plays on determining the final PSD can be difficult be-cause the mean granule size may decrease with respect toincreased agitator speed for other reasons than pure break-age.
At the present time, only limited theory is available forpredicting breakage of wet granules. A quantitative the-ory was proposed by Tardos et al. [45], where it was con-cluded that granules will break in a shear field if there isan external kinetic energy surpassing some critical value.This was presented in the form of the Stokes deformationnumber criteria as:
Stdef > St∗def (28)
where Stdef is altered by introducing a new stress factorthat is more general than the dynamic yield strength:
Stdef =m̃u2
0
2D̃3τ(γ)(29)
where τ(γ) is the new yield stress described by theHershel-Buckley model:
τ(γ) = Yd + µγ n (30)
In this equation, Yd is the dynamic yield strength, µ is theapparent viscosity, γ is the strain rate, and n is the flowindex, and . Tardos et al. [45] make a first assumptionthat the apparent viscosity is much less than the dynamicyield strength. If µ � Yd, then τ(γ) ' Yd and Equa-tion 29 takes the form of the previous Stokes deformationnumber, Equation 22.
Another model for breakage of granules was developedby Kenningley et al. [25] for the situation of high-sheargranulation. The aforementioned model equated the im-pact kinetic energy to the energy absorbed by plastic de-formation of the granules. The granule strain, εm, wascalculated using the Kozeny-Carmen equation.
εm =
√1
540
ε3
(1 − ε)2ρud32
µ(31)
where d32 is the Sauter mean constituent particle size.Again breakage is assumed using this model if the individ-ual strain of a granule exceeds a critical value, εm > ε∗m.
3 Dynamic simulation
3.1 Current modeling methods: The coales-cence kernel
Population balances are the most common method of de-termining the evolution of particle size distribution forgranulation processes. Population balance equation mod-els determine the result of particle-particle interactionsbased on coalescence kernels. Coalescence kernels are of-ten composed of two parts, a size independent kernel, β0,and a size dependent kernel, β∗(u, v) as seen in Equation32.
β(u, v) = β0β∗(u, v) (32)
Some of the original coalescence kernels proposed bySastry et al. and Kapur and Fuerstenau [23, 22, 24, 41]are based on purely empirical models. Other coalescencekernels are based on models that rely on probabilitiesof coalescence [27]. Physically based coalescence ker-nels are currently being investigated in ongoing research[3, 7, 43, 17, 32]. These models use limiting parametersthat are typically derived from a critical value based on
6
Stokes law. Adetayo and Ennis [2] found a critical granulesize based on the conditions for Type I coalescence. Us-ing this critical size, they developed a cut-off kernel. Liuand Litster [32] solved the population balance equation,deriving a kernel by classifying particle-particle interac-tions as either Type I coalescence or Type II coalescencewithout permanent deformation, Type II coalescence withpermanent deformation, or rebound.
Models based on physical granule and binder propertiesare more fundamentally sound than their empirical coun-terparts. Despite this, there is still little information avail-able on the application of physically based coalescencekernels in literature. This can be attributed to several rea-sons. Adetayo and Ennis [1] attribute this to a lack ofknowledge of the granule collision velocity distribution ina granulator. Also, the solution to a population balanceequation is not trivial [10, 11]. Analytical solutions arerarely available. When complex coalescence kernels aswell as breakage and compaction are present, a PBE so-lution may only be available numerically. Often with thenumerical solution, the computation time may be too un-realistic to be applied to control or optimization of a gran-ulation process. With this in mind, dynamic simulationusing a population of individual particles is now consid-ered.
3.2 The simulation process
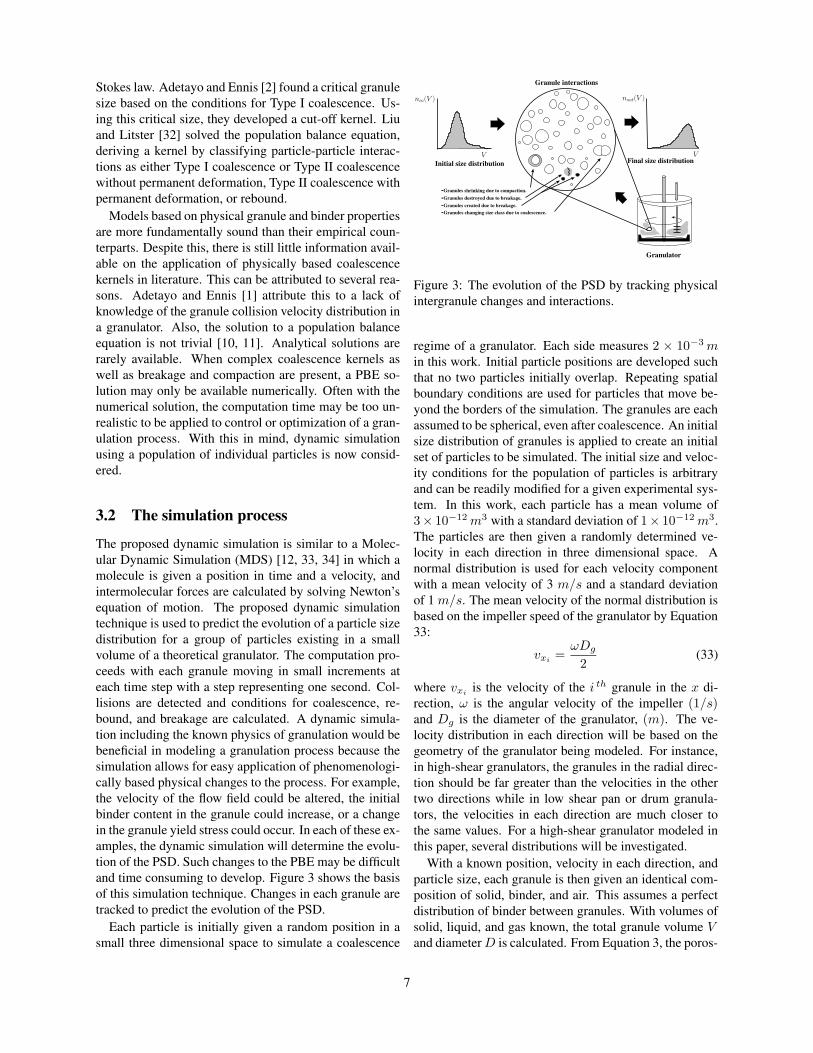
The proposed dynamic simulation is similar to a Molec-ular Dynamic Simulation (MDS) [12, 33, 34] in which amolecule is given a position in time and a velocity, andintermolecular forces are calculated by solving Newton’sequation of motion. The proposed dynamic simulationtechnique is used to predict the evolution of a particle sizedistribution for a group of particles existing in a smallvolume of a theoretical granulator. The computation pro-ceeds with each granule moving in small increments ateach time step with a step representing one second. Col-lisions are detected and conditions for coalescence, re-bound, and breakage are calculated. A dynamic simula-tion including the known physics of granulation would bebeneficial in modeling a granulation process because thesimulation allows for easy application of phenomenologi-cally based physical changes to the process. For example,the velocity of the flow field could be altered, the initialbinder content in the granule could increase, or a changein the granule yield stress could occur. In each of these ex-amples, the dynamic simulation will determine the evolu-tion of the PSD. Such changes to the PBE may be difficultand time consuming to develop. Figure 3 shows the basisof this simulation technique. Changes in each granule aretracked to predict the evolution of the PSD.
Each particle is initially given a random position in asmall three dimensional space to simulate a coalescence
nin(V )
V
Initial size distribution
nout(V )
VFinal size distribution
-Granules shrinking due to compaction.-Granules destroyed due to breakage.-Granules created due to breakage.-Granules changing size class due to coalescence.
Granulator
Granule interactions
Figure 3: The evolution of the PSD by tracking physicalintergranule changes and interactions.
regime of a granulator. Each side measures 2 × 10⁻³ min this work. Initial particle positions are developed suchthat no two particles initially overlap. Repeating spatialboundary conditions are used for particles that move be-yond the borders of the simulation. The granules are eachassumed to be spherical, even after coalescence. An initialsize distribution of granules is applied to create an initialset of particles to be simulated. The initial size and veloc-ity conditions for the population of particles is arbitraryand can be readily modified for a given experimental sys-tem. In this work, each particle has a mean volume of3× 10−12 m3 with a standard deviation of 1× 10⁻¹² m3.The particles are then given a randomly determined ve-locity in each direction in three dimensional space. Anormal distribution is used for each velocity componentwith a mean velocity of 3 m/s and a standard deviationof 1 m/s. The mean velocity of the normal distribution isbased on the impeller speed of the granulator by Equation33:
vxi=
ωDg
2(33)
where vxiis the velocity of the i th granule in the x di-
rection, ω is the angular velocity of the impeller (1/s)and Dg is the diameter of the granulator, (m). The ve-locity distribution in each direction will be based on thegeometry of the granulator being modeled. For instance,in high-shear granulators, the granules in the radial direc-tion should be far greater than the velocities in the othertwo directions while in low shear pan or drum granula-tors, the velocities in each direction are much closer tothe same values. For a high-shear granulator modeled inthis paper, several distributions will be investigated.
With a known position, velocity in each direction, andparticle size, each granule is then given an identical com-position of solid, binder, and air. This assumes a perfectdistribution of binder between granules. With volumes ofsolid, liquid, and gas known, the total granule volume Vand diameter D is calculated. From Equation 3, the poros-
7
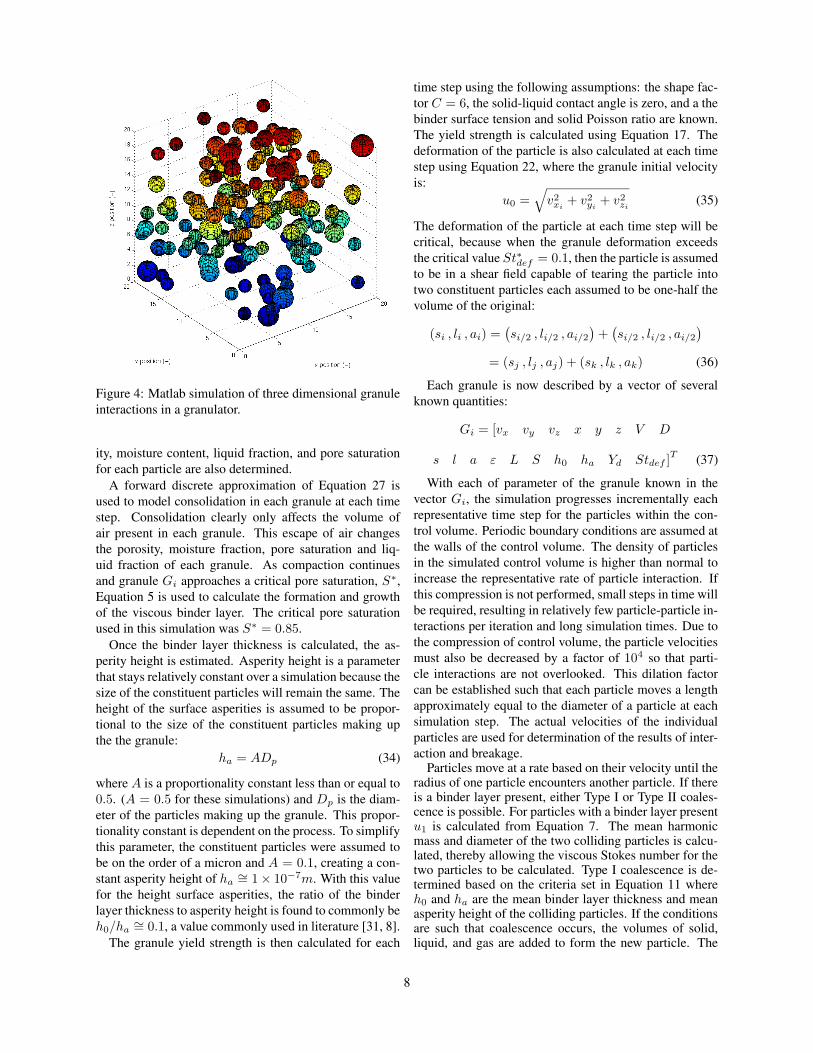
Figure 4: Matlab simulation of three dimensional granuleinteractions in a granulator.
ity, moisture content, liquid fraction, and pore saturationfor each particle are also determined.
A forward discrete approximation of Equation 27 isused to model consolidation in each granule at each timestep. Consolidation clearly only affects the volume ofair present in each granule. This escape of air changesthe porosity, moisture fraction, pore saturation and liq-uid fraction of each granule. As compaction continuesand granule Gi approaches a critical pore saturation, S∗,Equation 5 is used to calculate the formation and growthof the viscous binder layer. The critical pore saturationused in this simulation was S∗ = 0.85.
Once the binder layer thickness is calculated, the as-perity height is estimated. Asperity height is a parameterthat stays relatively constant over a simulation because thesize of the constituent particles will remain the same. Theheight of the surface asperities is assumed to be propor-tional to the size of the constituent particles making upthe the granule:
ha = ADp (34)
where A is a proportionality constant less than or equal to0.5. (A = 0.5 for these simulations) and Dp is the diam-eter of the particles making up the granule. This propor-tionality constant is dependent on the process. To simplifythis parameter, the constituent particles were assumed tobe on the order of a micron and A = 0.1, creating a con-stant asperity height of ha
∼= 1× 10⁻⁷m. With this valuefor the height surface asperities, the ratio of the binderlayer thickness to asperity height is found to commonly beh0/ha
∼= 0.1, a value commonly used in literature [31, 8].The granule yield strength is then calculated for each
time step using the following assumptions: the shape fac-tor C = 6, the solid-liquid contact angle is zero, and a thebinder surface tension and solid Poisson ratio are known.The yield strength is calculated using Equation 17. Thedeformation of the particle is also calculated at each timestep using Equation 22, where the granule initial velocityis:
u0 =√
v2xi
+ v2yi
+ v2zi
(35)
The deformation of the particle at each time step will becritical, because when the granule deformation exceedsthe critical value St∗def = 0.1, then the particle is assumedto be in a shear field capable of tearing the particle intotwo constituent particles each assumed to be one-half thevolume of the original:
(si , li , ai) =(si/2 , li/2 , ai/2
)+(si/2 , li/2 , ai/2
)
= (sj , lj , aj) + (sk , lk , ak) (36)
Each granule is now described by a vector of severalknown quantities:
Gi = [vx vy vz x y z V D
s l a ε L S h0 ha Yd Stdef ]T (37)
With each of parameter of the granule known in thevector Gi, the simulation progresses incrementally eachrepresentative time step for the particles within the con-trol volume. Periodic boundary conditions are assumed atthe walls of the control volume. The density of particlesin the simulated control volume is higher than normal toincrease the representative rate of particle interaction. Ifthis compression is not performed, small steps in time willbe required, resulting in relatively few particle-particle in-teractions per iteration and long simulation times. Due tothe compression of control volume, the particle velocitiesmust also be decreased by a factor of 104 so that parti-cle interactions are not overlooked. This dilation factorcan be established such that each particle moves a lengthapproximately equal to the diameter of a particle at eachsimulation step. The actual velocities of the individualparticles are used for determination of the results of inter-action and breakage.
Particles move at a rate based on their velocity until theradius of one particle encounters another particle. If thereis a binder layer present, either Type I or Type II coales-cence is possible. For particles with a binder layer presentu1 is calculated from Equation 7. The mean harmonicmass and diameter of the two colliding particles is calcu-lated, thereby allowing the viscous Stokes number for thetwo particles to be calculated. Type I coalescence is de-termined based on the criteria set in Equation 11 whereh0 and ha are the mean binder layer thickness and meanasperity height of the colliding particles. If the conditionsare such that coalescence occurs, the volumes of solid,liquid, and gas are added to form the new particle. The
8
two constituent granules are destroyed and a new one iscreated with volumes shown in Equation 38.
(si , li , ai) + (sj , lj , aj) = (si + sj , li + lj , ai + aj)
= (sk , lk , ak) (38)
If Type I coalescence does not occur, rebound veloci-ties u2 and u3 are calculated from interactions created bythe collision. If the final rebound velocity, u3 is greaterthan zero, then no coalescence occurs and the particles“bounce” off each other. These rebounding particles arethen given velocities equal to their collision velocities, butin the opposite direction. This assumes each collisionhas a coefficient of restitution of one, regardless of theactual coefficient of restitution for the particle. Coales-cence of surface wet particles is based on the criteria setin Equation 21. If Type II coalescence does occur, a newgranule is created in the same manner as for Type I coa-lescence. For granules without a binder layer present, asin the induction period, coalescence or rebound is deter-mined based on the criteria set in Equation 25. For eachnew particle “born”, a new vector Gj will be created withparameters calculated using new solid, liquid, and air vol-umes from Equation 38.
One may assume that granules will continue to coa-lesce until they reach a critical granule size above whichgranulation becomes impossible. This critical size is rep-resented in PBE models as the size independent kernel,β0. This constant kernel is commonly used to representa higher probability of coalescence between particles atlower size classes. Ouchiyama and Tanaka [35] deriveda critical granule size for deformable particles. Theyassumed that highly deformable particles had a largercontact area, thereby decreasing the chance of particlebreakup and increasing growth rate. From the torqueforces and binding forces acting on a deformed granuleat the contact area, Ouchiyama and Tanaka derived thefollowing equation:
D∗ = A1
(K3/2σt
)a1
(39)
where A1 and a1 are constants independent of granulesize for a system, σt is the granule tensile strength given inEquation 16, and K is a measure of the granule deforma-bility, a ratio of the contact area between granules and theforce of the granule impact. The force of colliding gran-ules in the approach stage was derived in Liu [31],
F =3
4πD̃2µ
u
2h(40)
where 2h is the distance between approaching granules,commonly assumed to be the binder layer thicknesses.The contact area is related to the permanent deformation,δ′′
, by:A = πD̃δ
′′
(41)
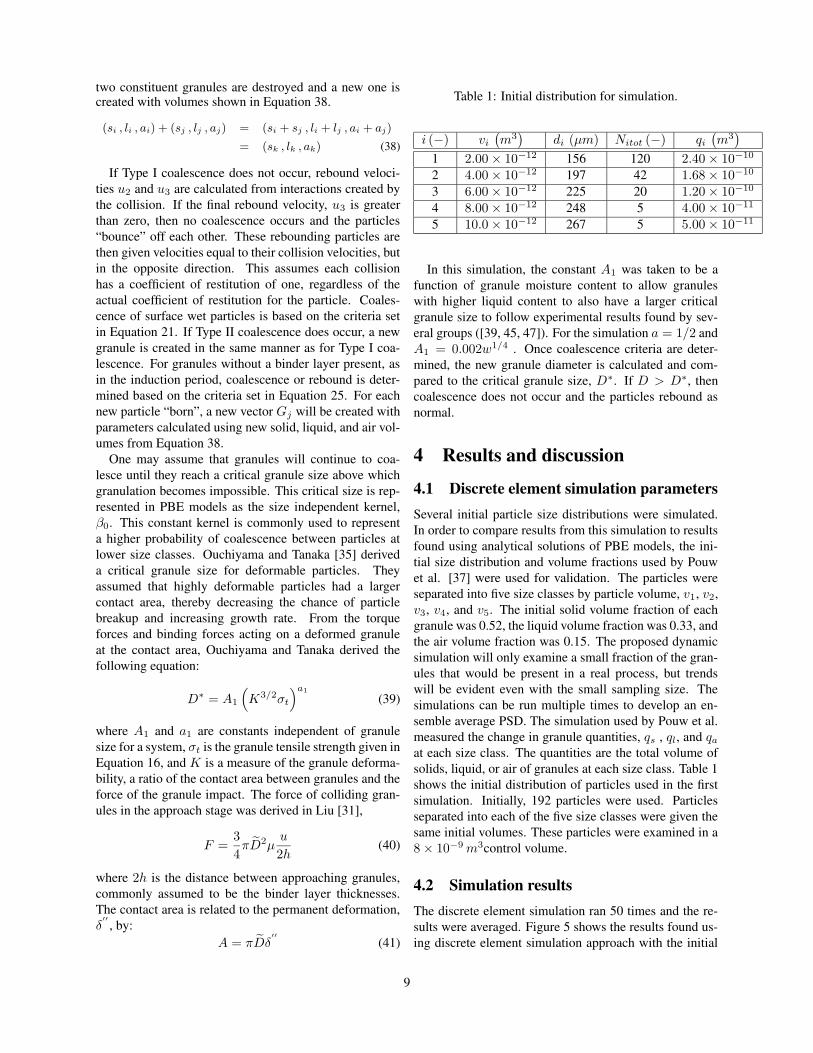
Table 1: Initial distribution for simulation.
i (−) vi
(m3)
di (µm) Nitot (−) qi
(m3)
1 2.00 × 10⁻¹² 156 120 2.40 × 10⁻¹⁰
2 4.00 × 10⁻¹² 197 42 1.68 × 10⁻¹⁰
3 6.00 × 10⁻¹² 225 20 1.20 × 10⁻¹⁰
4 8.00 × 10⁻¹² 248 5 4.00 × 10⁻¹¹
5 10.0 × 10⁻¹² 267 5 5.00 × 10⁻¹¹
In this simulation, the constant A1 was taken to be afunction of granule moisture content to allow granuleswith higher liquid content to also have a larger criticalgranule size to follow experimental results found by sev-eral groups ([39, 45, 47]). For the simulation a = 1/2 andA1 = 0.002w1/4 . Once coalescence criteria are deter-mined, the new granule diameter is calculated and com-pared to the critical granule size, D∗. If D > D∗, thencoalescence does not occur and the particles rebound asnormal.
4 Results and discussion
4.1 Discrete element simulation parametersSeveral initial particle size distributions were simulated.In order to compare results from this simulation to resultsfound using analytical solutions of PBE models, the ini-tial size distribution and volume fractions used by Pouwet al. [37] were used for validation. The particles wereseparated into five size classes by particle volume, v1, v2,v3, v4, and v5. The initial solid volume fraction of eachgranule was 0.52, the liquid volume fraction was 0.33, andthe air volume fraction was 0.15. The proposed dynamicsimulation will only examine a small fraction of the gran-ules that would be present in a real process, but trendswill be evident even with the small sampling size. Thesimulations can be run multiple times to develop an en-semble average PSD. The simulation used by Pouw et al.measured the change in granule quantities, qs , ql, and qa
at each size class. The quantities are the total volume ofsolids, liquid, or air of granules at each size class. Table 1shows the initial distribution of particles used in the firstsimulation. Initially, 192 particles were used. Particlesseparated into each of the five size classes were given thesame initial volumes. These particles were examined in a8 × 10−9 m3control volume.
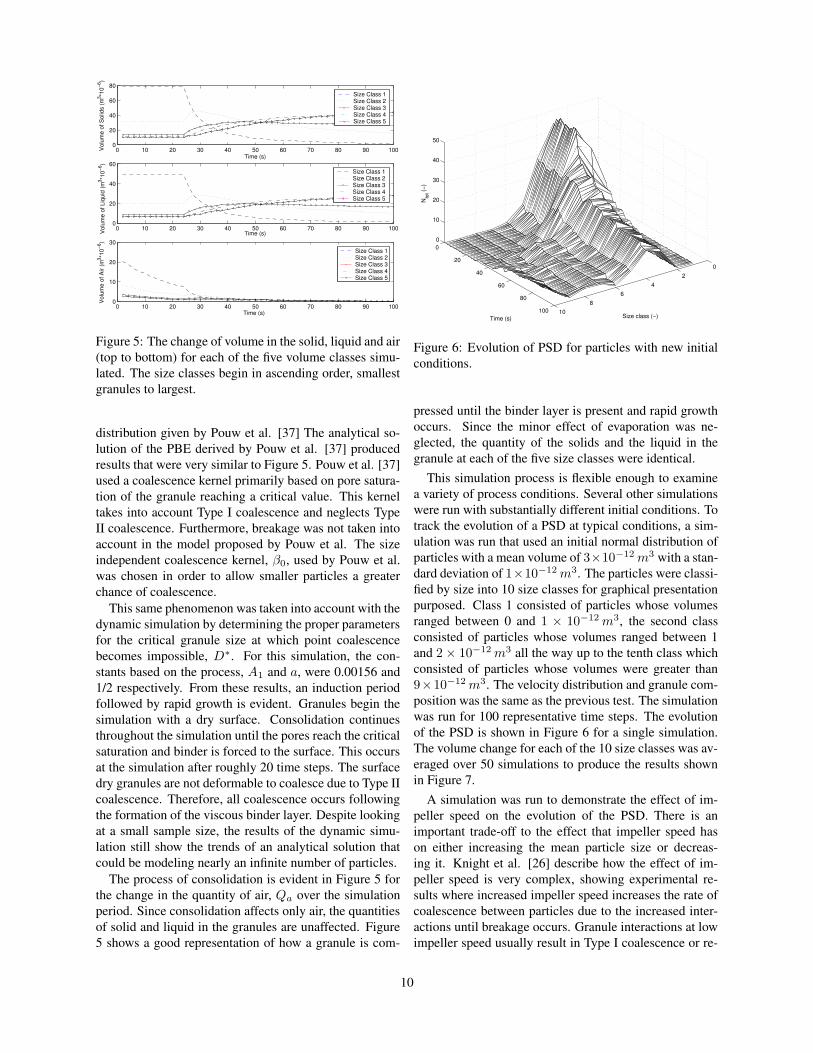
4.2 Simulation resultsThe discrete element simulation ran 50 times and the re-sults were averaged. Figure 5 shows the results found us-ing discrete element simulation approach with the initial
9
0 10 20 30 40 50 60 70 80 90 1000
20
40
60
80
Time (s)
Vol
ume
of S
olid
s (m
3 *10−6
)
0 10 20 30 40 50 60 70 80 90 1000
20
40
60
Time (s)Vol
ume
of L
iqui
d (m
3 *10−6
)
0 10 20 30 40 50 60 70 80 90 1000
10
20
30
Time (s)
Vol
ume
of A
ir (m
3 *10−6
)
Size Class 1Size Class 2Size Class 3Size Class 4Size Class 5
Size Class 1Size Class 2Size Class 3Size Class 4Size Class 5
Size Class 1Size Class 2Size Class 3Size Class 4Size Class 5
Figure 5: The change of volume in the solid, liquid and air(top to bottom) for each of the five volume classes simu-lated. The size classes begin in ascending order, smallestgranules to largest.
distribution given by Pouw et al. [37] The analytical so-lution of the PBE derived by Pouw et al. [37] producedresults that were very similar to Figure 5. Pouw et al. [37]used a coalescence kernel primarily based on pore satura-tion of the granule reaching a critical value. This kerneltakes into account Type I coalescence and neglects TypeII coalescence. Furthermore, breakage was not taken intoaccount in the model proposed by Pouw et al. The sizeindependent coalescence kernel, β0, used by Pouw et al.was chosen in order to allow smaller particles a greaterchance of coalescence.
This same phenomenon was taken into account with thedynamic simulation by determining the proper parametersfor the critical granule size at which point coalescencebecomes impossible, D∗. For this simulation, the con-stants based on the process, A1 and a, were 0.00156 and1/2 respectively. From these results, an induction periodfollowed by rapid growth is evident. Granules begin thesimulation with a dry surface. Consolidation continuesthroughout the simulation until the pores reach the criticalsaturation and binder is forced to the surface. This occursat the simulation after roughly 20 time steps. The surfacedry granules are not deformable to coalesce due to Type IIcoalescence. Therefore, all coalescence occurs followingthe formation of the viscous binder layer. Despite lookingat a small sample size, the results of the dynamic simu-lation still show the trends of an analytical solution thatcould be modeling nearly an infinite number of particles.
The process of consolidation is evident in Figure 5 forthe change in the quantity of air, Qa over the simulationperiod. Since consolidation affects only air, the quantitiesof solid and liquid in the granules are unaffected. Figure5 shows a good representation of how a granule is com-
02
46
810
0
20
40
60
80
100
0
10
20
30
40
50
Size class (−)Time (s)
Nto
t (−)
Figure 6: Evolution of PSD for particles with new initialconditions.
pressed until the binder layer is present and rapid growthoccurs. Since the minor effect of evaporation was ne-glected, the quantity of the solids and the liquid in thegranule at each of the five size classes were identical.
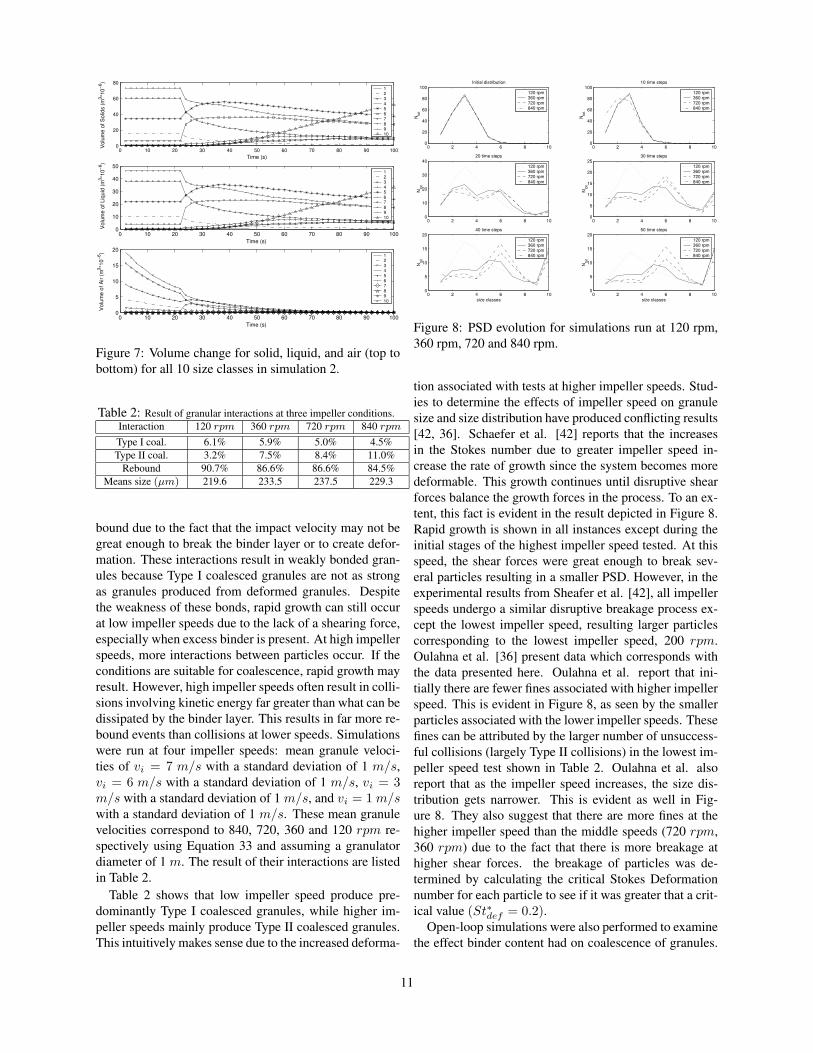
This simulation process is flexible enough to examinea variety of process conditions. Several other simulationswere run with substantially different initial conditions. Totrack the evolution of a PSD at typical conditions, a sim-ulation was run that used an initial normal distribution ofparticles with a mean volume of 3×10⁻¹² m3 with a stan-dard deviation of 1×10⁻¹² m3. The particles were classi-fied by size into 10 size classes for graphical presentationpurposed. Class 1 consisted of particles whose volumesranged between 0 and 1 × 10⁻¹² m3, the second classconsisted of particles whose volumes ranged between 1and 2 × 10⁻¹² m3 all the way up to the tenth class whichconsisted of particles whose volumes were greater than9×10−12 m3. The velocity distribution and granule com-position was the same as the previous test. The simulationwas run for 100 representative time steps. The evolutionof the PSD is shown in Figure 6 for a single simulation.The volume change for each of the 10 size classes was av-eraged over 50 simulations to produce the results shownin Figure 7.
A simulation was run to demonstrate the effect of im-peller speed on the evolution of the PSD. There is animportant trade-off to the effect that impeller speed hason either increasing the mean particle size or decreas-ing it. Knight et al. [26] describe how the effect of im-peller speed is very complex, showing experimental re-sults where increased impeller speed increases the rate ofcoalescence between particles due to the increased inter-actions until breakage occurs. Granule interactions at lowimpeller speed usually result in Type I coalescence or re-
10
0 10 20 30 40 50 60 70 80 90 1000
20
40
60
80
Time (s)
Vol
ume
of S
olid
s (m
3 *10−6
)
12345678910
0 10 20 30 40 50 60 70 80 90 1000
10
20
30
40
50
Time (s)
Vol
ume
of L
iqui
d (m
3 *10−6
)
12345678910
0 10 20 30 40 50 60 70 80 90 1000
5
10
15
20
Time (s)
Vol
ume
of A
ir (m
3 *10−6
) 12345678910
Figure 7: Volume change for solid, liquid, and air (top tobottom) for all 10 size classes in simulation 2.
Table 2: Result of granular interactions at three impeller conditions.Interaction 120 rpm 360 rpm 720 rpm 840 rpm
Type I coal. 6.1% 5.9% 5.0% 4.5%Type II coal. 3.2% 7.5% 8.4% 11.0%
Rebound 90.7% 86.6% 86.6% 84.5%Means size (µm) 219.6 233.5 237.5 229.3
bound due to the fact that the impact velocity may not begreat enough to break the binder layer or to create defor-mation. These interactions result in weakly bonded gran-ules because Type I coalesced granules are not as strongas granules produced from deformed granules. Despitethe weakness of these bonds, rapid growth can still occurat low impeller speeds due to the lack of a shearing force,especially when excess binder is present. At high impellerspeeds, more interactions between particles occur. If theconditions are suitable for coalescence, rapid growth mayresult. However, high impeller speeds often result in colli-sions involving kinetic energy far greater than what can bedissipated by the binder layer. This results in far more re-bound events than collisions at lower speeds. Simulationswere run at four impeller speeds: mean granule veloci-ties of vi = 7 m/s with a standard deviation of 1 m/s,vi = 6 m/s with a standard deviation of 1 m/s, vi = 3m/s with a standard deviation of 1 m/s, and vi = 1 m/swith a standard deviation of 1 m/s. These mean granulevelocities correspond to 840, 720, 360 and 120 rpm re-spectively using Equation 33 and assuming a granulatordiameter of 1 m. The result of their interactions are listedin Table 2.
Table 2 shows that low impeller speed produce pre-dominantly Type I coalesced granules, while higher im-peller speeds mainly produce Type II coalesced granules.This intuitively makes sense due to the increased deforma-
0 2 4 6 8 100
20
40
60
80
100
Nto
t
Initial distribution
120 rpm360 rpm720 rpm840 rpm
0 2 4 6 8 100
20
40
60
80
100
Nto
t
10 time steps
120 rpm360 rpm720 rpm840 rpm
0 2 4 6 8 100
10
20
30
40
Nto
t
20 time steps
120 rpm360 rpm720 rpm840 rpm
0 2 4 6 8 100
5
10
15
20
25
Nto
t
30 time steps
120 rpm360 rpm720 rpm840 rpm
0 2 4 6 8 100
5
10
15
20
size classes
Nto
t
40 time steps
120 rpm360 rpm720 rpm840 rpm
0 2 4 6 8 100
5
10
15
20
size classes
Nto
t
50 time steps
120 rpm360 rpm720 rpm840 rpm
Figure 8: PSD evolution for simulations run at 120 rpm,360 rpm, 720 and 840 rpm.
tion associated with tests at higher impeller speeds. Stud-ies to determine the effects of impeller speed on granulesize and size distribution have produced conflicting results[42, 36]. Schaefer et al. [42] reports that the increasesin the Stokes number due to greater impeller speed in-crease the rate of growth since the system becomes moredeformable. This growth continues until disruptive shearforces balance the growth forces in the process. To an ex-tent, this fact is evident in the result depicted in Figure 8.Rapid growth is shown in all instances except during theinitial stages of the highest impeller speed tested. At thisspeed, the shear forces were great enough to break sev-eral particles resulting in a smaller PSD. However, in theexperimental results from Sheafer et al. [42], all impellerspeeds undergo a similar disruptive breakage process ex-cept the lowest impeller speed, resulting larger particlescorresponding to the lowest impeller speed, 200 rpm.Oulahna et al. [36] present data which corresponds withthe data presented here. Oulahna et al. report that ini-tially there are fewer fines associated with higher impellerspeed. This is evident in Figure 8, as seen by the smallerparticles associated with the lower impeller speeds. Thesefines can be attributed by the larger number of unsuccess-ful collisions (largely Type II collisions) in the lowest im-peller speed test shown in Table 2. Oulahna et al. alsoreport that as the impeller speed increases, the size dis-tribution gets narrower. This is evident as well in Fig-ure 8. They also suggest that there are more fines at thehigher impeller speed than the middle speeds (720 rpm,360 rpm) due to the fact that there is more breakage athigher shear forces. the breakage of particles was de-termined by calculating the critical Stokes Deformationnumber for each particle to see if it was greater that a crit-ical value (St∗def = 0.2).
Open-loop simulations were also performed to examinethe effect binder content had on coalescence of granules.
11
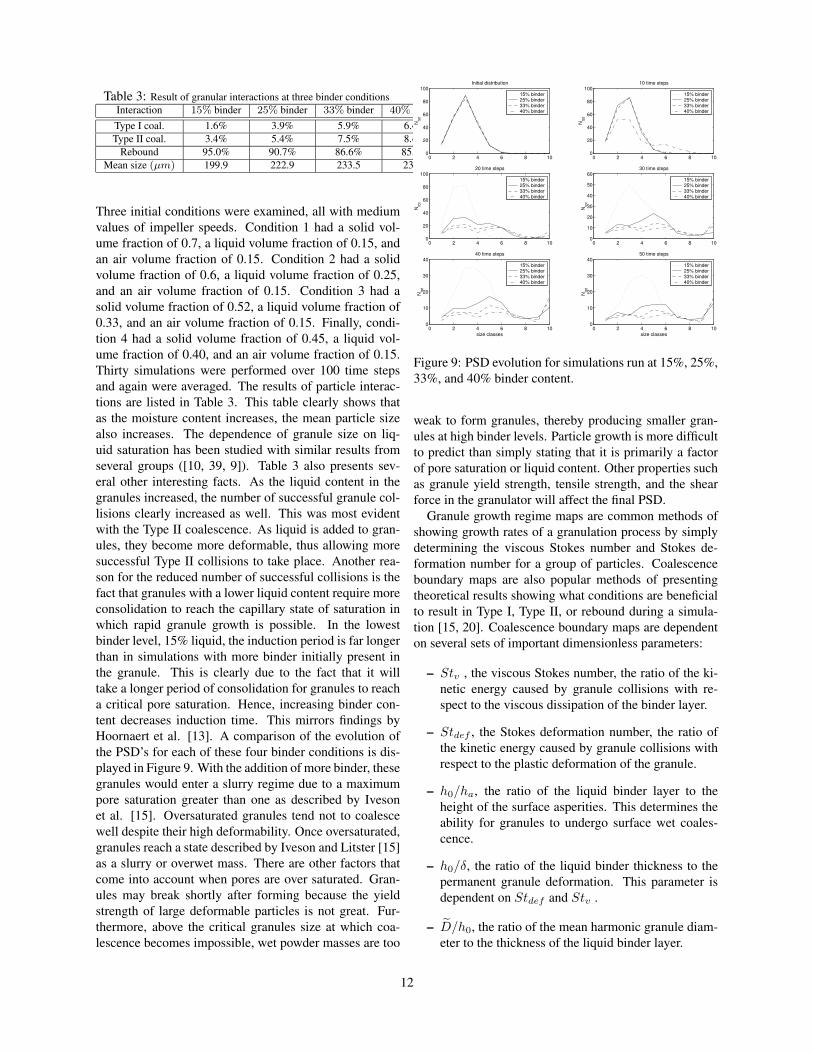
Table 3: Result of granular interactions at three binder conditionsInteraction 15% binder 25% binder 33% binder 40% binderType I coal. 1.6% 3.9% 5.9% 6.4%Type II coal. 3.4% 5.4% 7.5% 8.4%
Rebound 95.0% 90.7% 86.6% 85.2%Mean size (µm) 199.9 222.9 233.5 237.4
Three initial conditions were examined, all with mediumvalues of impeller speeds. Condition 1 had a solid vol-ume fraction of 0.7, a liquid volume fraction of 0.15, andan air volume fraction of 0.15. Condition 2 had a solidvolume fraction of 0.6, a liquid volume fraction of 0.25,and an air volume fraction of 0.15. Condition 3 had asolid volume fraction of 0.52, a liquid volume fraction of0.33, and an air volume fraction of 0.15. Finally, condi-tion 4 had a solid volume fraction of 0.45, a liquid vol-ume fraction of 0.40, and an air volume fraction of 0.15.Thirty simulations were performed over 100 time stepsand again were averaged. The results of particle interac-tions are listed in Table 3. This table clearly shows thatas the moisture content increases, the mean particle sizealso increases. The dependence of granule size on liq-uid saturation has been studied with similar results fromseveral groups ([10, 39, 9]). Table 3 also presents sev-eral other interesting facts. As the liquid content in thegranules increased, the number of successful granule col-lisions clearly increased as well. This was most evidentwith the Type II coalescence. As liquid is added to gran-ules, they become more deformable, thus allowing moresuccessful Type II collisions to take place. Another rea-son for the reduced number of successful collisions is thefact that granules with a lower liquid content require moreconsolidation to reach the capillary state of saturation inwhich rapid granule growth is possible. In the lowestbinder level, 15% liquid, the induction period is far longerthan in simulations with more binder initially present inthe granule. This is clearly due to the fact that it willtake a longer period of consolidation for granules to reacha critical pore saturation. Hence, increasing binder con-tent decreases induction time. This mirrors findings byHoornaert et al. [13]. A comparison of the evolution ofthe PSD’s for each of these four binder conditions is dis-played in Figure 9. With the addition of more binder, thesegranules would enter a slurry regime due to a maximumpore saturation greater than one as described by Ivesonet al. [15]. Oversaturated granules tend not to coalescewell despite their high deformability. Once oversaturated,granules reach a state described by Iveson and Litster [15]as a slurry or overwet mass. There are other factors thatcome into account when pores are over saturated. Gran-ules may break shortly after forming because the yieldstrength of large deformable particles is not great. Fur-thermore, above the critical granules size at which coa-lescence becomes impossible, wet powder masses are too
0 2 4 6 8 100
20
40
60
80
100
Nto
t
Initial distribution
15% binder25% binder33% binder40% binder
0 2 4 6 8 100
20
40
60
80
100
Nto
t
10 time steps
15% binder25% binder33% binder40% binder
0 2 4 6 8 100
20
40
60
80
100
Nto
t
20 time steps
15% binder25% binder33% binder40% binder
0 2 4 6 8 100
10
20
30
40
50
60
Nto
t
30 time steps
15% binder25% binder33% binder40% binder
0 2 4 6 8 100
10
20
30
40
size classes
Nto
t
40 time steps
15% binder25% binder33% binder40% binder
0 2 4 6 8 100
10
20
30
40
size classes
Nto
t
50 time steps
15% binder25% binder33% binder40% binder
Figure 9: PSD evolution for simulations run at 15%, 25%,33%, and 40% binder content.
weak to form granules, thereby producing smaller gran-ules at high binder levels. Particle growth is more difficultto predict than simply stating that it is primarily a factorof pore saturation or liquid content. Other properties suchas granule yield strength, tensile strength, and the shearforce in the granulator will affect the final PSD.
Granule growth regime maps are common methods ofshowing growth rates of a granulation process by simplydetermining the viscous Stokes number and Stokes de-formation number for a group of particles. Coalescenceboundary maps are also popular methods of presentingtheoretical results showing what conditions are beneficialto result in Type I, Type II, or rebound during a simula-tion [15, 20]. Coalescence boundary maps are dependenton several sets of important dimensionless parameters:
– Stv , the viscous Stokes number, the ratio of the ki-netic energy caused by granule collisions with re-spect to the viscous dissipation of the binder layer.
– Stdef , the Stokes deformation number, the ratio ofthe kinetic energy caused by granule collisions withrespect to the plastic deformation of the granule.
– h0/ha, the ratio of the liquid binder layer to theheight of the surface asperities. This determines theability for granules to undergo surface wet coales-cence.
– h0/δ, the ratio of the liquid binder thickness to thepermanent granule deformation. This parameter isdependent on Stdef and Stv .
– D̃/h0, the ratio of the mean harmonic granule diam-eter to the thickness of the liquid binder layer.
12
10−7 10−6 10−5 10−4 10−3 10−2 10−110−2
10−1
100
101
102
Stdef
=(0.5mU2)/(D3Yd)
St v=(
8mU
)/(3(
pi)(
mu)
D2 )
ReboundType I coalescence onlyType I & II coalescenceType II coalescence only
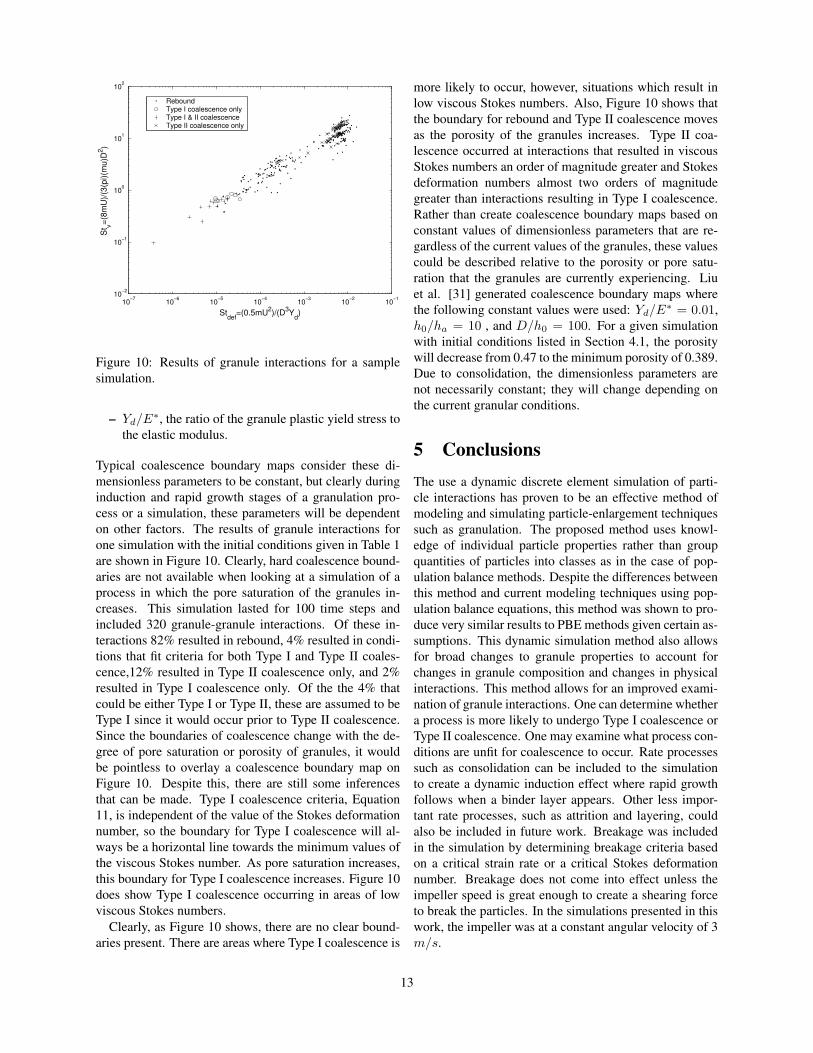
Figure 10: Results of granule interactions for a samplesimulation.
– Yd/E∗, the ratio of the granule plastic yield stress to
the elastic modulus.
Typical coalescence boundary maps consider these di-mensionless parameters to be constant, but clearly duringinduction and rapid growth stages of a granulation pro-cess or a simulation, these parameters will be dependenton other factors. The results of granule interactions forone simulation with the initial conditions given in Table 1are shown in Figure 10. Clearly, hard coalescence bound-aries are not available when looking at a simulation of aprocess in which the pore saturation of the granules in-creases. This simulation lasted for 100 time steps andincluded 320 granule-granule interactions. Of these in-teractions 82% resulted in rebound, 4% resulted in condi-tions that fit criteria for both Type I and Type II coales-cence,12% resulted in Type II coalescence only, and 2%resulted in Type I coalescence only. Of the the 4% thatcould be either Type I or Type II, these are assumed to beType I since it would occur prior to Type II coalescence.Since the boundaries of coalescence change with the de-gree of pore saturation or porosity of granules, it wouldbe pointless to overlay a coalescence boundary map onFigure 10. Despite this, there are still some inferencesthat can be made. Type I coalescence criteria, Equation11, is independent of the value of the Stokes deformationnumber, so the boundary for Type I coalescence will al-ways be a horizontal line towards the minimum values ofthe viscous Stokes number. As pore saturation increases,this boundary for Type I coalescence increases. Figure 10does show Type I coalescence occurring in areas of lowviscous Stokes numbers.
Clearly, as Figure 10 shows, there are no clear bound-aries present. There are areas where Type I coalescence is
more likely to occur, however, situations which result inlow viscous Stokes numbers. Also, Figure 10 shows thatthe boundary for rebound and Type II coalescence movesas the porosity of the granules increases. Type II coa-lescence occurred at interactions that resulted in viscousStokes numbers an order of magnitude greater and Stokesdeformation numbers almost two orders of magnitudegreater than interactions resulting in Type I coalescence.Rather than create coalescence boundary maps based onconstant values of dimensionless parameters that are re-gardless of the current values of the granules, these valuescould be described relative to the porosity or pore satu-ration that the granules are currently experiencing. Liuet al. [31] generated coalescence boundary maps wherethe following constant values were used: Yd/E
∗ = 0.01,h0/ha = 10 , and D/h0 = 100. For a given simulationwith initial conditions listed in Section 4.1, the porositywill decrease from 0.47 to the minimum porosity of 0.389.Due to consolidation, the dimensionless parameters arenot necessarily constant; they will change depending onthe current granular conditions.
5 ConclusionsThe use a dynamic discrete element simulation of parti-cle interactions has proven to be an effective method ofmodeling and simulating particle-enlargement techniquessuch as granulation. The proposed method uses knowl-edge of individual particle properties rather than groupquantities of particles into classes as in the case of pop-ulation balance methods. Despite the differences betweenthis method and current modeling techniques using pop-ulation balance equations, this method was shown to pro-duce very similar results to PBE methods given certain as-sumptions. This dynamic simulation method also allowsfor broad changes to granule properties to account forchanges in granule composition and changes in physicalinteractions. This method allows for an improved exami-nation of granule interactions. One can determine whethera process is more likely to undergo Type I coalescence orType II coalescence. One may examine what process con-ditions are unfit for coalescence to occur. Rate processessuch as consolidation can be included to the simulationto create a dynamic induction effect where rapid growthfollows when a binder layer appears. Other less impor-tant rate processes, such as attrition and layering, couldalso be included in future work. Breakage was includedin the simulation by determining breakage criteria basedon a critical strain rate or a critical Stokes deformationnumber. Breakage does not come into effect unless theimpeller speed is great enough to create a shearing forceto break the particles. In the simulations presented in thiswork, the impeller was at a constant angular velocity of 3m/s.
13
Open loop simulations were performed that comparedPSD’s over time for processes with differing binder con-tent and impeller speeds. High impeller speed were shownto create a strong shear field in which large granules werebroken. At higher impeller speeds, however, a narrowerPSD was present. While the lower impeller speeds didnot result in as many successful Type II collisions, thelow collision velocity resulted in a very high amount ofType I collisions. These Type I collisions produce largeparticles held together by weak viscous forces. Type IIcollisions produce stronger aggregate particles. Higherimpeller speeds produce additional Type II collisions, andthe resulting granules may be more beneficial as a finalproduct.
A comparison of initial binder contents was also simu-lated. The simulation in which the lowest binder contentwas used resulted in the least number of successful colli-sions and the smallest mean granule size. As the bindercontent in each granule increased, the number of success-ful Type I and Type II collisions increased as well,. There-fore, larger granules are present in simulations with morebinder present. This is in agreement with conclusionsfound by several other reported results [9, 10, 39].
AcknowledgementsThe authors gratefully acknowledge the helpful commentsof the anonymous reviewers and financial support fromthe University of South Carolina Center for Manufactur-ing and Technology.
6 Nomenclature
ai Air volume of granule iA Asperity height proportionality constantA∗ Maximum deformation areaA1 Size independent parameter for critical granule sizea1 Size independent parameter for critical granule sizeβ(u, v) Coalescence kernelβ0 Size independent coalescence kernelβ∗(u, v) Size dependent coalescence kernelC Shape factorδ∗ Maximum compression distanceδ′ Extent of elastic recoveryδ′′ Maximum deformationD Granule diameterDg Granulator diameterDp Basic particle diameterD∗ Critical granule diameterD̃ Mean harmonic diameterεi Porosity of granule iεmin Minimum attainable granule porosity
εm Granule strainε∗m Critical granule strainE∗ Effective Young’s modulusEi Young’s modulus of granule i
F Force of colliding granulesγ Strain rate in Hershel-Buckley modelγl Liquid surface tension2h Distance between approaching granulesha Surface asperity heightho Liquid layer thicknessK Measure of granule deformabilitykc Consolidation rate constantli Liquid volume of granule i
Li Liquid fraction of granule i
mi Mass of granule i
m̃ Mean harmonic massn Flow index in Hershel-Buckley modelµ Binder viscosityω Angular velocity of impellerP Mean contact pressurePo Maximum contact pressureρa Density of airρl Density of liquidρs Density of solidσt Maximum tensile stressSi Pore saturation of granule i
si Solid volume of granule i
Stv Stokes numberStdef Stokes deformation numberSt∗def Critical stokes deformation numberθ Solid-liquid contact angleτ Yield stress of Hershel-Buckley modeluo Initial relative velocity of colliding particlesu1 Approach velocity of colliding particlesu2 Deformation velocity in Type II collisionvi Poisson ratiowi Moisture fraction of granule i
Vi Total volume of granule i
vxiVelocity of granule i in x direction
Yd Plastic yield stress
References
[1] A. A. Adetayo and B. J. Ennis. A unifying approachto modeling coalescence mechanisms. AIChE,43(1):927–934, 1997.
[2] A. A. Adetayo and B. J. Ennis. A new approach tomodeling granulation processes for simulation andcontrol purposes. Powder Technology, 108:202–209,2000.
14
[3] A. A. Adetayo, J. D. Litster, S. E. Pratsinis, and B. J.Ennis. Population balance modeling of drum granu-lation of materials with wide size distribution. Pow-der technology, 82:37–49, 1995.
[4] A. Annapragada and J. Neilly. On the modeling ofgranulation processes: a short note. Powder Tech-nology, 89:83–84, 1996.
[5] R. J. Batterham, J. S. Hall, and G. Barton. Pel-letizing kinetics and simulation of full scale ballingcircuits. Proceedings of the 3rd InternationalSymposium on Agglomeration, Nurnberg, W. Ger-many:A136, 1981.
[6] Steve Bull. Elastic contact stress formulae.www.staff.ncl.ac.uk/s.j.bull/ecsttr.html, 1999.
[7] S. A. Cryer. Modeling agglomeration processes influid-bed granulation. AIChE, 45(10):2069–2078,1999.
[8] B. J. Ennis. A microlevel-based characterizationof granulation phenomena. Powder Technology,65:257–272, 1991.
[9] B. J. Ennis. Agglomeration and size enlarge-ment session summary paper. Powder Technology,88:203–225, 1996.
[10] B. J. Ennis and J. D. Litster. Perry’s Chemical En-gineers’ Handbook, chapter Particle size enlarge-ment, pages 20–56–20–89. McGraw Hill, 7th edi-tion, 1997.
[11] K. Heiskanen. On the difficulties of implementingparticle size control in particulate processes. PowderTechnology, 82:13–19, 1995.
[12] B. Hess and R. M. Scheek. Orientation restraints inmolecular dynamics simulation using time and en-semble averaging. Journal of Magnetic Resonance,164:19–27, 2003.
[13] F. Hoornaert, P. Wauters, G. Meesters, S. Pratsinis,and B. Scarlett. Agglomeration behavior of powdersin a lodige mixer granulator. Powder technology,97:116–128, 1998.
[14] M. J. Hounslow, R. L. Ryall, and V. R. Marshall. Adiscetized population balance for nucleation, growthand aggregation. AIChE Journal, 34(11):1821–1832, 1988.
[15] S. Iveson and J. Litster. Growth regime map forliquid-bound granules. AIChE Journal, 44:1510–1518, 1998.
[16] S. Iveson, J. Litster, and B. Ennis. Fundamentalstudies of granule consolidation. part 1: effects ofbinder content and binder viscosity. Powder Tech-nology, 88:15–20, 1996.
[17] S. M. Iveson. Limitations of one-dimensional popu-lation balance models of wet granulation processes.Powder Technology, 124:219–229, 2002.
[18] S. M. Iveson, J A. Beathe, and N. W. Page. Thedynamic strength of partially saturated powder com-pacts: the effect of liquid properties. Powder Tech-nology, 127:149–161, 2002.
[19] S. M. Iveson, J. D. Litster, K. Hapgood, and B. J En-nis. Nucleation, growth and breakage phenonmenain agitated wet granulation process: a review. Pow-der technology, 117:3–39, 2001.
[20] S. M. Iveson, P. A. L. Wauters, S. Forrest, J. D. Lit-ster, G. M. H. Meesters, and B. Scarlett. Growthregime map for liquid-bound granules: further de-velopment and experimantal validation. PowderTechnology, 117:83–97, 2001.
[21] K. L. Johnson. Contact Mechanics. Cambridge Uni-versity Press, 1987.
[22] P. C. Kapur. Kinetics of granulation by non-randomcoalescence mechanism. Cemical Engineering Sci-ence, 27:1863–1869, 1972.
[23] P. C. Kapur and D. W. Fuerstenau. Trans. AIME,229:348–355, 1963.
[24] P. C. Kapur and D. W. Fuerstenau. Coalescencemodel for granulation. Industrial and EngineeringChemistry, Process Design Devices, 8:56–62, 1969.
[25] S. Kenningley, P. Knight, and A. Amrson. An in-vestigation into the effect of binder viscosity onagglomeration. Powdeer Technology, 91:95–103,1997.
[26] P. Knight, A. Johansen, H. Kristensen, T Schaefer,and J. Seville. An investigation of the effects on ag-glomeration of changing the speed of the mechanicalmixer. Powder Technology, 110:204–209, 2000.
[27] H. G. Kristensen, P. Holm, and T. Schaefer. Me-chanical propeties of moist agglomerates in relationto moist agglomerates. Powder Technology, 44(227-247), 1985.
[28] S. Kumar and D. Ramkrishna. On the solution ofpopulation balance equations by discretization-i. afixed pivot technique. Chemical Engineering Sci-ence, 51:1311–1332, 1996.
15
[29] S. Kumar and D. Ramkrishna. On the solution ofpopulation balance equations by discretization-ii. amoving pivot technique. Chemical Engineering Sci-ence, 51:1333–1342, 1996.
[30] T. Lee and R. S. Lake. Anisotropic polyurethanefoam with Poisson’s ratio greater than 1. Journal ofMembrane Science, 32:2397–2401, 1997.
[31] L. X. Liu and J. D. Litster. Coalescence of de-formable granules in wet granulation processes.AIChE Journal, 46(3):529–539, March 2000.
[32] L. X. Liu and J. D. Litster. Population balancemodeling of granulation with a physically based co-alescence kernel. Chemical Engineering Science,57:2183–2191, 2002.
[33] H. Marques and K. Brown. Molecular mechanicsand molecular dynamics simulations of porphyrins,metalloporphyrins, heme protiens and cobalt corri-noids. Coordination Chemistry Reviews, 225:123–158, 2002.
[34] M. Matsumoto. Molecular dynamics of fluid phasechange. Fluid phase equilibria, 144:307–314, 1998.
[35] N. Ouchiyama and T. Tanaka. I and EC Process De-sign and Dev., 21(29-35), 1982.
[36] D. Oulahna, F. Cordier, L. Galet, and J. A. Dodds.Wet granulation: the effect of shear on granule prop-erties. Powder Technology, 130:238–246, 2003.
[37] G. A. Pouw, D. Verkoeijen, G. M. H. Meesters,and B. Scarlett. Population balances for particulateprocesses-avolume approach. Chemical Engineer-ing Science, 57:2287–2303, 2002.
[38] D. Ramkrishna. The status of population balances.Rev. Chem. Engng, 3:49–95, 1985.
[39] M. Ritala, P. Holm, T. Schaefer, and H. Kristensen.Influence of liquid bonding strength on power con-sumption duirng granulation in a high shear mixer.Drug Dev. Ind. Pharm., 14:1041–1060, 1988.
[40] H. Rumpf. The strength of granule and agglom-erates. AIME, Agglomeration, Interscience, pages379–418, 1962.
[41] K. V. S. Sastry. Similarity size distribution of ag-glomerates during their growth by coalescence ingranulation or green pelletization. InternationalJournal of Mineral Processing, 2:187–203, 1975.
[42] T. Schaefer, P. Holm, and H. G. Kristensen. Wetgranulation in a laboratory scale high shear mixer.Pharm Ind., 52:1147–1153, 1990.
[43] M. Song, A. Steiff, , and P. M. Weinspach. A very ef-fective new method to solve the population balanceequation with particle size growth. Chemical Engi-neering Science, 52(20):3493–3498, 1997.
[44] I. Talu, G. Tardos, and M. I. Khan. Computersimulation of wet granulation. Powder Technology,110:59–75, 2000.
[45] G. Tardos, M. I. Khan, and P. R. Mort. Critical pa-rameters limiting conditions in binder granulationof fine powders. Powder Technology, 94:245–258,1997.
[46] P. Wauters. Modeling and mechanisms of granula-tion. PhD thesis, Delft University of Technology,Delft, The Netherlands, 2001.
[47] P. A. L. Wauters, R. B. Jacobsen, J. D. Litster,G. M. H. Meesters, and B. Scarlett. Liquid distribu-tion as a means to describe the granule growth mech-anism. Powder Technology, 123:166–177, 2002.
16