high-speed civil transport study - nasa · 1-1 high-speed civil transport mission perspective ......
TRANSCRIPT

NASA Contractor Report 4233
High-Speed Civil Transport Study
Boeing Commercial Airplanes
New Airplane Development
Seattle, Washington
Prepared for
Langley Research Center
under Contract NAS1-18377
National Aeronautics andSpace Administration
Office of Management
Scientific and TechnicalInformation Division
1989
https://ntrs.nasa.gov/search.jsp?R=19890018277 2018-08-18T21:45:30+00:00Z


CONTENTS
eag
FIGURES ........................................................................ v
TABLES .......................................................................viii
GLOSSARY .....................................................................ix
FOREWORD ...................................................................
SUMMARY .................................................................... xiii
INTRODUC_ON ................................................................ 1
ENVIRONMENTAL, OPERATIONAL, AND MARKET REQUIREMENTS ANDMARKET ASSUMPTIONS ........................................................ 5
2.1 Environmental Requirements ................................................. 5
2.2 Operational Requirements .................................................... 5
2.3 Market Requirements and Assumptions ........................................ 92.4 Conclusions ................................................................ 28
3.0 PROPULSION TECHNOLOGY .................................................. 29
3.1 Conventional-Fueled Engine Concepts ........................................ 30
3.2 Cryogenic-Fueled Engine Concepts ........................................... 343.3 Advanced Jet Noise Reduction Concepts ...................................... 37
3.4 Emission Reduction Concepts ................................................ 40
3.5 Fuels Technology ........................................................... 443.6 Conclusions ................................................................ 51
4.0 VEHICLE DEVELOPMENT ..................................................... 53
5.0
4.1 Technology Projections and Design Options ................................... 54
4.2 Concept Screening .......................................................... 56
4.3 Configuration and Performance Analyses ...................................... 594.4 Alternative Mach 4.5 Configurations .......................................... 65
4.5 Final Study Configurations .................................................. 674.6 Aerodynamics .............................................................. 72
4.7 Stability and Control ........................................................ 74
4.8 Weight and Balance ......................................................... 75
4.9 Impact of Technology ....................................................... 76
ENVIRONMENTAL EVALUATION .............................................. 81
5.1 Upper Atmosphere Emissions-Ozone Impact .................................. 815.2 Community Noise .......................................................... 845.3 Sonic Boom ................................................................ 91
,.o
PRECEDING PAGE BLANK NOT RLMED m

6.0
7.0
gag
ECONOMIC EVALUATION ..................................................... 97
6.1 The Evaluation Concept ..................................................... 976.2 Results of the Economic Model ............................................. 100
6.3 Conclusions ............................................................... 109
CONCLUSIONS AND RECOMMENDATIONS ................................... 111
7.1 Conclusions ............................................................... 111
7.2 Recommendations ......................................................... 112
REFERENCES ................................................................. 115
iv

FIGURES
1-1 High-Speed Civil Transport Study Plan and Schedule ................................. 2
2-12-2
2-3
2-4
2-5
2-6
2-72-8
2-9
2-102-11
2-12
2-13
2-142-15
2-16
2-172-18
2-192-20
2-21
2-222-23
2-242-25
2-262-27
Superhub Airport Network ......................................................... 9
Units Required--Year 2015 ........................................................ 9
Average Trip Time--Superhub System .............................................. 10World Air Traffic Demand Forecast--Year 2000 ..................................... 10
Year 2000 International Traffic Distribution Forecast Based on Total of 1,100,000
Passengers/Day .................................................................. 11Revenue Passenger Mile Forecast .................................................. 12Potential Market for the HSCT .................................................... 12HSCT Traffic Distribution--Year 2000 ............................................. 13
Overwater Distance .............................................................. 14
Major HSCT Markets--Year 2015 ................................................. 14
Units Required--Overwater Markets ............................................... 15Relative Travel Time--Overwater Markets .......................................... 16
Units Required--Other Markets ................................................... 17Relative Travel Time--Other Markets .............................................. 18HSCT Utilization Results ......................................................... 19
HSCT Utilization Results for Typical Airline System ................................. 20Fleet Size Versus Seats ................................... , ....................... 21
Effect of Design Range on Fleet Size ............................................... 22Fleet Size Versus Turn/Through Time .............................................. 22Effect of Acceleration Rate on Average Mach Number (7,000-nmi Design Range) ....... 23
Effect of Reroute on Fleet Size and Average Mach Number ........................... 24Class Mix From the United States ................................................. 25
Time and Price Trades for High-Speed Air Travel .................................... 25Estimated Market Share Versus Ticket Price ........................................ 26
Impact of Time Savings on Traffic Carried--1-Hr Turn/Through Time ................. 26
Impact of Time Savings on Market Size ............................................ 27Units Required Assuming 100% of First-Class Market--l-Hr Turn/Through Time ...... 27
3-9
3-10
3-113-12
3-13
3-1 Conventional-Fueled Engine Concepts .............................................. 31
3-2 Conventional-Fueled Engine Cruise Performance Comparison ........................ 32
3-3 Engine Technology Improvements .................................................. 33
3-4 Cryogenically Fueled Engine Concepts .............................................. 353-5 Supersonic Cruise Installed Performance Comparison--Year 2015 Cryogenically Fueled
Engines ...................................... ........ ........................... 363-6 Jet Noise Reduction Concepts ..................................................... 38
3-7 Jet Noise Suppression Thrust Penalties ....................... ... ................... 39
3-8 Naturally Aspirated, Coannular (NACA) Nozzle Configured in the NoiseAbatement Mode ........................... • .................................... 39
NACA Nozzle Suppression Estimates .............................................. 40
Pratt & Whitney Current Technology Baseline Combustor ............................ 42
Pratt & Whitney Staged-Lean Combustor ........................................... 43
Pratt & Whitney Rich-Burn, Quick-Quench Combustor .............................. 43Pratt & Whitney Lean, Premixed, and Prevaporized Combustor ....................... 44
!
!
1
!
t
i
E

3-14
3-15
3-163-17
3-18
3-19
3-203-21
3 -22
3-23
3-24
General Electric Lean, Premixed, and Prevaporized Combustor ....................... 45Thermal Stability of Currently Delivered Fuels ...................................... 46Cost Versus Price of Jet Fuel ...................................................... 46
Density of High-Thermal-Stability Fuels ............................................ 47Worldwide Fuel Type Demand Change ............................................. 47
Typical Flight Profile ............................................................. 48Liquid Hydrogen Cost Sensitivities ................................................. 49
Cryogenic Fuel Costs--Equivalent Jet A ............................................ 49
The Influence of Aircraft Duty Cycle on Airport Losses--Los Angeles
International Airport Projections .................................................. 50
Liquid Methane Airport Costs--Sample Projections for Los Angeles
International Airport ............................................................. 51Airport Conversion Cost Comparison .............................................. 51
4-1
4-24-34-4
4-54-6
4-7
4-84-9
4-104-11
4-124-134-14
4-15
4-16
4-17
4-18
4-19
4-204-21
4-22
4-234-24
4-25
4-26
4-27
HSCT Activities ................................................................. 53
Technology Assessment and Configuration Development ............................. 54Technology Projections ........................................................... 55
Use of Technology Application Chart .............................................. 57Risk and Benefit Analysis Screening Index With Examples ........................... 58Concept Screening Planform Trends at Mach 2.4 .................................... 59
Mach 2.4 Configuration ........................................................... 60
Mach 3.2 Configuration ........................................................... 60Mach 3.8 Configuration ........................................................... 61
Mach 4.5 Configuration .............................................. .-. ........... 61Mach 6.0 Configuration ........................................................... 62
Mach 10.0 Configuration .......................................................... 63
Maximum Takeoff Weight Versus Mach Number--Year 2015, 250-Seat Airplane ........ 63Average Flight Number Versus Cruise Mach Number--West Coast to Tokyo ........... 64
Structural Material Candidates and Projected Temperature Range for HSCTApplication ..................................................................... 64
Alternative Mach 4.5 Configurations ............................................... 66
Alternative Mach 4.5 Configuration Study Results--247-Seat Airplane With
5,000-nmi Design Range .......................................................... 67Flight Profile and Reserves ........................................................ 68
HSCT Growth Strategy .......................................................... 69Airplane Size Speed Trends ....................................................... 70
Mach 2.4 Baseline Configuration ........ , .......................................... 71
Sizing Chart Model--Mach 2.4 Baseline ............................................ 72
Drag Breakdown--Mach 2.4 Baseline .............................................. 73Lift/Drag Versus Mach--Mach 2.4 Baseline ......................................... 74
Impact of Technology--Mach 2.4 Baseline .......................................... 78
Design Payload Sensitivity--Mach 2.4, 247-Seat Airplane With Year 2000 Certification .. 79
Impact of Technology--Mach 2.4, 247-Seat Airplane With Year 2000 Certification,5,000-nmi Design Range .......................................................... 79
5-1 Environmental Impact Study Approach ............................................ 82
5-2 Case B7, Subsonic-Supersonic Mix--Year 2015 ...................................... 84
5-3 Maximum Takeoff Weight Penalties for Combustor Concepts With ReducedNOx Emission Index ............................................................. 85
vi

5-45-5
5-6
5-7
5-85-95-105-115-125-13
Takeoff Profile ................................................................... 86
Noise Impact Study Results--Penalty to Meet Sideline Stage 3 Noise Rule,Constant Wing Loading ........................................................... 87
Noise Impact Study Results--Penalty to Meet 747-200 Footprint Area,
Constant Wing Loading ........................................................... 88
Noise Impact Study Results--Effect of Wing Area (Wing Loading),Constant Thrust Loading ......................................................... 89Noise Contour at 85 dBA--Comparison of HSCT to 747-200 .......................... 90
Target Waveforms ................................................................ 92Low-Sonic-Boom Configuration .................................................... 93
Mach 1.5 Pressure Signature and Loudness Predictions .............................. 94Effect of Cruise Procedure on Pressure Wave at Mach 1.5 ............................ 95
Parametric Payload--Gross Weight Trends .......................................... 96
6-1
6-26-3
6-4
6-5
6-6
6-7
6-8
6-9
6-10
6-11
6-12
6-13
Example of Operating Cost History and Revenue Required to Cover All CostElements and Provide Desired Return on Investment ................................ 98
Life Cycle Cost .................................................................. 99HSCT System Baseline Revenue Required Compared With Reported Yield--Yield
Data of September 1987 ......................................................... 101Airplane Market Value in Revenue Environment Set by Subsonic Baseline--Early
Screening ...................................................................... 102Fleet Size and Investment Relative to Baseline Speed Study Airplanes--OptimisticPrices Based on 500 Units ......................................................... 102
Sensitivity of Required Yield to Design Parameters Mach 0.9, Overland WaypointRouting--Optimistic Prices Based on 500 Units .................................... 103
Sensitivity of Revenue Required for 12% Return on Investment to Requirement
for Reduced Community Noise ................................................... 104
Sensitivity of Revenue Required for 12% Return on Investment to Requirementfor Reduced Emissions .......................................................... 105
Revenue Required for 12% Return on Investment--Low-SonicBoom Design ........... 105
Sensitivity of Revenue Required for 12% Return on Investment to Design,Operations, and Price Assumptions ............................................... 106
Economic Viability--Technology Impact on Fleet Size Based on Mach 2.4,
247-Seat Design With 5,000-nmi Range ............................................ 107
Economic Viability--Impact of Speed Based on 247-Seat Design With
5,000-nmi Range ................................................................ 108
Impact of Technology Development on HSCT Fleet Size ............................. 109
r
vii

TABLES
Table
1-1 High-Speed Civil Transport Mission Perspective ...................................... 3
2-1 Selected High-Demand Airports .................................................... 6
2-2 Summary Throughput Change With 10% HSCT Airplanes ............................ 8
3-1 Engine Data Packs for Airplane Configuration Studies ............................... 293-2 Conventional-Fueled Engine Weights ............................................... 33
3-3 Cryogenically Fueled Engine Weights ............................................... 363-4 Pratt & Whitney Mach 2.4 TBE Emission Indexes and Performance for
Derated Engine Cycles ........................................................... 413-5 Pratt & Whitney Mach 2.4 TBE Emission Indexes and Performance for
Innovative Combustors ........................................................... 42
3-6 Pratt & Whitney Low-Emission Combustor Concepts: Engine Weight andDimension Penalties Relative to Current Combustor Technology (for 630-1b/s Engine) ... 44
3-7 Study Fuel Prices ................................................................ 52
4-1 Design Mach Number Selections .................................................. 56
4-2 Risk and Benefit Analysis Criteria ................................................. 58
4-3 Design Requirements and Objectives ............................................... 68
4-4 Key Technology Elements for Study Mach Numbers ................................. 704-5 Technical Benefits and Risk Assessment ............................................ 71
4-6 Weight Improvements From Current Technology to Year 2000 Certification ............. 764-7 Uncycled Weight Data ........................................................... 77
5-1 Ozone Evaluations ............................................................... 83
...
VIII

GLOSSARY
ALT
APUASM
ASTM
ATCATFE
ATR
ATTCS
BMI
BTU
CCCD
CfgCGCH4CLCL APP
CL LOFCO
C/T-BMI
CfFPI
dB
dBADOT
ENG
EPNdB
EST
FAR25
FAR 36
FL600
Fn
altitude
auxiliary power unitavailable seat miles
American Society for Testing andMaterialsAir Traffic Control
advanced technology fighter
engine
air turbo-ramjetautomatic takeoff thrust control
system
carbon fiber toughenedbismaleimide
British thermal units
conventional combustor
aerodynamic drag coefficient
nozzle gross thrust coefficient
center of gravitymethanelift coefficient
aerodynamic approach liftcoefficient
aerodynamic liftoff lift coefficientcarbon monoxide
high modulus carbon fiber
reinforced toughenedbismaleimide
high modulus carbon fiber
reinforced thermoplastic
polyimide
decibels
A-weighted decibels
Department of Transportation
engineeffective perceived noise decibelsestimated
Federal Aviation Regulation, part25
Federal Aviation Regulation, part36
60,000 foot altitude
net thrust per engine
(Fn-D)/q
gGE
HL
HSCTHz
IATA
IFR
JFTOT
JP
keas
kiaskn
lb/ft 2
lbls
L/D
L/Dc/o
LH2LHV
LNG
LO2LPP
mi
MLW
MMC
ms
MTOW
MV
NA
NACA
NASA
NASP
nmiN/M 2
NOx
thrust minus drag over dynamic
pressure
acceleration of gravityGeneral Electric
high-lift systemhigh-speed civil transporthertz
International Air TransportAssociation
instrument flight rules
jet fuel thermal oxidation testerjet petroleum fuel
knots equivalent air speed
knots indicated airspeedknots
pound per square foot
pounds per secondlift to drag ratio
climbout lift to drag ratio
liquid hydrogenlower heating value
liquefied natural gas
liquid oxygenlean, premixed, and prevaporized
statute mile
maximum landing weight
metal matrix compositemillisecond
maximum takeoff weightmarket value
not available
naturally aspirated, coannularNational Aeronautics and SpaceAdministration
National Aero-Space Planenautical miles
newtons per square meteroxides of nitrogen
ix

OEWOLOPCOST
OPROW
P&WPLRPNLPNdB
R&DRAMRBQQROIRPMRSRSR
SCRSFCSJS/LSL
operatingemptyweightoverlandOperationCostProgram(computerprogram)overallpressureratiooverwater
Pratt & Whitneyprogrammedlapserateperceivednoiselevelperceivednoisedecibels
researchand developmentrevenueaircraft milesrich-burn,quick-quenchreturnon investmentrevenuepassengermilesrapid solidificationrapid solidificationrate
supersoniccruiseresearchspecificfuel consumptionscramjetsealevelstagedlean
SLSSST
TBETFTHCTJTOFLTOGWTPTSFCTSJFTI3
TF4
T/W
VAT
VCEVCHJ
VFR
Wa
W/SWt
sea level static thrust
supersonic transport
turbine bypass engineturbofan
total hydrocarbon
turbojettakeoff field length
takeoff gross weighttechnology projections
thrust specific fuel consumptionthermally stable jet fuel
combustor inlet temperature
combustor outlet temperaturethrust to weight ratio
variable-area turbine
variable-cycle engine
turbofan ramjet
visual flight rules
engine airflowweight to wing area ratio
weight
X

FOREWORD
This report documentswork completed for phases I, II, and III on high-speed civil transports underNASA contract NAS1-18377. The New Airplane Development group of Boeing Commercial Air-
planes, Seattle, Washington, was responsible for the study. Charles E. K. Morris, Jr., NASA LangleyResearch Center, was NASA program manager. Michael L. Henderson and Frank H. Brame were pro-
gram managers for Boeing Commercial Airplanes. Boeing task managers were: Robert M. Kulfan for
phase I and II Engineering; John D. Vachal for phase HI Engineering; William H. Lee and Roger WRoll for Marketing; and Donald W Hayward and Edward N. Coates for Special Factors.
The Boeing team consisted of--
Manager HSCT Design Development M. I. K. MacKinnon
Aerodynamics D. N. Ball, T. H. Hallstaff, G. T. Haglund,J. C. Klein, S. S. Ogg, J. A. Paulson,
S. E. Stark, P. F. Sweetland,
T E. Trimbath, G. H. Wyatt
Configurations T. Derbyshire, V. K. Stuhr
Finance G .J. Gracey
Marketing R. E. Bateman, T. Higman,S. C. Henderson
Noise J. G. Brown, G. L. Nihart
Payloads D. P. Lefebvre
Propulsion J. J. Brown, G. B. Evelyn, R. B. McCormick,J. Merrick, P. Ormiston
Special Factors N. M. Barr, J. H. Foster, O. J. Hadaller,
A. M. Momenthy
Structures and Materials J. W Fogelman, D. L. Grande, T. E. Munns,D. G. Stensrud, R. T Wagner
Systems A. W Waterman, T Timar
Weights J. D. Brown, M. W. Peak, J. E Rams
xi

i
iE

SUMMARY
Boeing Commercial Airplanes has conducted a study of the potential for high-speed civil trans-ports. The primary objectives of the study were to identify the time frame and technologies required
for such aircraft in order to guide plans for appropriate technology development. To achieve these
objectives, the study had to address economics and technology as well as environmental constraints.The technology included factors beyond the vehicle itself, such as airport infrastructure and fuel-han-
dling systems. Analyses assessed the economic impact of all these factors on the commercial attrac-tiveness of such vehicles.
The study progressed in three phases. The first phase allowed consideration of a broad range of
vehicle and system characteristics. Initial results allowed a reduction of the range of vehicle conceptsto those flying with cruise speeds of Mach 4.5 or less. The second phase allowed for more direct and
specific integration of technology and economics. The final phase focused on the impact of environ-mental constraints and refined analyses on the value of cruise speed. In this final phase, cruise speed
ranged from Mach 2.4 to Mach 3.2.
Market and Competition
The market results show that a viable HSCT could acquire a significant portion of the growing,
long-range, worldwide market. However, to achieve this result, the airplane must have the followingcharacteristics:
a. Environmentally acceptable (no special operating limits other than subsonic flight over land).b. Adaptable to the year 2000 airport system (i.e., no superhubs for the HSCT alone).c. From about 250 to 300 seats (in triclass seatings). Final seat definition is a function of productivity,
which depends on Mach number and design range capabilities.d. A range of 5,000 nmi initially with growth to over 6,000 nmi. This increase will occur through weight
growth; the use of improved engines; minimizing intermediate stops, which increase airline costsand passenger trip times; and allowing maximum flexibility of the airplane within an airline's sys-tem. Maximum flexibility will be reached only if the HSCT is used on routes suited to its capabili-
ties, rather than as a direct substitute for 747-class missions.
e. Economically competitive with a year 2000 subsonic fleet (i.e., increases in utilization must over-
come increased operating and ownership costs).f. Cruise Mach number should be consistent with minimum operating costs and maximum produc-
tivity when considering design-range tradeoffs.
An HSCT with these characteristics could justify a total fleet size of over 1,200 aircraft between
the years 2000 and 2015, serving primarily the long-range (2,500 nmi and greater), high-density market.
Environmental Concerns
The primary areas of environmental impact identified by this study were--a. Potential ozone depletion. Projections of advanced low-emissions burner technology indicate that
an NOx emissions reduction from 30 + lb to approximately 5 lb of nitrous oxide emissions per 1,000
lb of fuel burned is possible. A clearer understanding of the effect of engine emissions on the atmos-
phere is being investigated using the best atmospheric models available and data from the currentHSCT studies. This knowledge is essential to understanding the design requirements for an envi-
ronmentally acceptable HSCT.
b. Community noise. The study shows that with projected suppression technology, achievement ofFAR36 Stage 3 noise levels may be possible. The primary issues involved in achieving Stage 3 levels
are--
1. Development of projected jet-noise suppressor technology.
PRECEDING PAGE BLANK NOT FILMED r_q.__iltNltetn_AttV _tA_ xm

. Possible modifications to the Stage 3 rules. The unique characteristics of an HSCT could justifya different trade between sideline noise and takeoff noise, which could further reduce noise to
the majority of the community. Requirements could also focus on the area exposed to a given
sound level to take into account the operating characteristics of an advanced HSCT in reducing
residential area exposed to noise.
C. Sonic boom. Subsonic, boomless overland flight was assumed for the basic technical and economic
viability estimates, However, a preliminary low-sonic-boom-design study suggests that a combina-tion of fuselage shaping, wing planform choice, and overland cruise at reduced supersonic Machhas potential for reducing boom overpressure levels. Acceptable sonic boom levels have not been
established. Therefore, committing a design to a reduced sonic boom level is premature at this early
stage. Continued effort must be made toward developing a low-boom configuration.
Technical Feasibility
Within the Mach 2.0 to 3.2 speed range, vehicles can be operated with kerosene-based fuels, enginecycles using conventional turbomachinery, an uncooled high-temperature composite, or a titanium
primary structure. These vehicles would be capable of operating from existing airports.Based on the results of the contract studies and other independent studies focusing on lower cruise
speed vehicles, maximum potential for an environmentally sound, technically feasible HSCT exists fora vehicle designed to cruise at Mach 2.0 to Mach 2.5 over water and Mach 0.9 over land.
Economic Viability
Preliminary estimates of the response of the projected HSCT market to increases in ticket cost
have been measured against the revenues needed for the airplanes studied in this and other indepen-dent studies to provide adequate profit margins to the manufacturer and the airlines. Based on thisevaluation, the following conclusions can be drawn:
a. Present technology is not adequate.
b. A year 2000, Mach 2.0 to 2.5 HSCT shows promise (potential total market of 650 to 750 airplanes).
While this would be an adequate demand for a single manufacturer, it is not an adequate marketfor two or more.
c. A Mach 2.0 to 2.5 HSCT with the advanced technology projected to be available for a year 2015
airplane (either as an all-new airplane or an advanced derivative of a year 2000 airplane) is more
encouraging. With this technology, the potential total market is estimated at 950 to 1,050 airplanes,which clearly represents a business opportunity.
d. Technology that reduces the weight and cost at Mach 2.0 to 2.5 has a much greater impact on eco-nomic viability than technology that enables higher cruise Mach numbers.
Key areas of improvement that would directly impact economic performance are-a. Reduced structural weight.
b. Improved engines available for year 2000 vehicles.
c. Increased aerodynamic performance through improved wing planforms and hybrid laminar flow.
Finally, while the development costs of vehicles in the preferred Mach range may be considerably
higher than the costs of a similar-sized subsonic vehicle, Government support of the production pro-
gram for an HSCT would not be required if such a vehicle were economically viable.
xiv _: _

RECOMMENDATIONS
Technology Development Program
Potential for a successful U.S. commercial high-speed transport exists for the year 2000 market
if aggressive technology development is undertaken in the near term. Based on maximum potentialfor environmental and economic viability, the highest near-term priorities for technology development
are-
a. Low-emissions technology.
b. Noise-suppressor technology.c. Variable-cyle engine technology.
d. High-temperature, durable composite structures and materials.
e. High-lift aerodynamics.f. High-temperature metals compatible with lightweight composite structures.
XV


1.0 INTRODUCTION
Present projections predict that the worldwide demand for long-range air travel will double by theyear 2000 and nearly double again by year 2015. This growth in the market will occur at the same time
that increasing numbers of aircraft in the existing fleet will be retired due to age and noise rules.Manufacturers must make difficult and long-lasting decisions in the next 5 to 10 years concerning
future products so that sufficient time is allowed for development. One option to consider is a new
generation of commercial transports that cruise at speeds of Mach 2.0 or greater and can serve boththe Atlantic and Pacific markets.
Boeing Commercial Airplanes conducted a three-phase study of the potential for future high-speed
civil transports (HSCT) under NASA contract NAS1-18377 between October 1986 and August 1988.
The primary objectives were to identify the most promising concepts in high-speed transports and to
guide the development of requisite technology that may not flow directly from the National Aero-SpacePlane or other existing programs. To achieve this it was necessary to examine the environmental, op-erational, and nonvehicle factors that will influence the vehicle configuration, supporting facilities and
systems requirements, and overall program viability. Also, it was essential to identify and accountfor those market and economic factors that must be considered to provide a commercially acceptable
high-speed transport system.The study examined the requirements of a future HSCT as affected by the environment, operation-
al concerns related to other HSCTs and subsonic aircraft, and the market demand for aircraft after
the year 2000. Market assumptions were developed for an HSCT operating in this timeframe. Thestudy evaluated both supersonic and hypersonic aircraft. Initially, aircraft were evaluated through
Mach 10.0; the latter phases looked at supersonic only (under Mach 6.0). Propulsion concepts were
investigated in conjunction with the fuel technology required. A screening process was employed todetermine the best Mach number range for further investigation of the environmental issues such as
community noise, effect on the ozone layer, and sonic boom. The economic impact of the configura-tions investigated were compared throughout the study. Figure 1-1 illustrates the flow of the study
process through the three phases.Table 1-1 indicates the level of challenge posed by this goal of an economically attractive, environ-
mentally acceptable HSCT. Passenger count must increase significantly from the Concorde to be eco-
nomical, and noise and emission levels must be greatly reduced.
A capable HSCT like the one postulated in table 1-1 would compete well even with advanced sub°sonics because of reduced flight times. It is important that U.S. manufacturers understand the poten-tial of such an airplane, as a product or a competitor. Ignoring the HSCT's potential, or delaying the
timely development of technology that could make it a viable product, could promote the loss of a
significant national opportunity to the competition from abroad. If successful, this competition wouldreduce the United States' traditionally high market share in the international marketplace for large,
long-range commercial transports. Even worse, commitment to a program without an adequate tech-
nological and environmental database could lead to an expensive failure. Both arguments lead to theconclusion that it is justified and highly desirable to continue research and the development of key
technologies for an environmentally and economically sound HSCT.

=
2
g
g,
0
t _UI
---- _

Table 1-1. High-Speed Civil Transport Mission Perspective
Transport type Concorde U.S. SST HSCT
Year In service
Market
Range (nml)
Payload (passengers)
TOGW (Ib)
Community noise requirements
Revenue required(cents/revenue passenger miles)
1971
North Atlantic
3,500
100
400,000
None
1975
North Atlantic
3,500
200
750,000
Stage II
87 6O
2000-2015
Atlantic and Pacific
5,000-6,500
250-300
750,000
Stage III
9-10
5-ugoo27R2-122

This Page
Intentionally Left Blank
. ,

2.0 ENVIRONMENTAL, OPERATIONAL, AND MARKET REQUIREMENTSAND MARKET ASSUMPTIONS
The objective of this study was to determine the requirements for a successful, commercially viable
high-speed civil transport (HSCT) that is environmentally acceptable and technically feasible.Certain environmental, operational, and marketing requirements were driving issues in the evolu-
tion of the designs. The framework was established by combining the unique requirements for a super-sonic environment and the market with those for commercial-airplane safety, comfort, and durability.
Merging this with the projected levels of airframe, propulsion, and systems technology permitted spe-
cific designs to be established. Assessments were then made regarding the aircraft's technical feasibil-
ity and market viability for certain calendar-year windows.
2.1 ENVIRONMENTAL REQUIREMENTS
Ozone. One of the environmental goals of this study is to identify the technologies that will allow
future operation of an HSCT that will cause no significant impact on the ozone layer.An HSCT will cruise at a higher altitude and in a different environment than present commercial
air traffic. Because of this, depletion of the stratospheric ozone by oxides of nitrogen (NOx) is a possi-bility. Thus, it is paramount to understand the technology and operational procedures required to
minimize the effects of the HSCT engine effluents in the stratosphere.Two engine companies (Pratt & Whitney and General Electric) have estimated the cruise emissions
on several engine/combustor concepts. Total emissions based on projected fleet size and route struc-tures were then established. NASA will use this information to assess the impact on the environment.
Research and technology will be applied to ensure that emissions be reduced to the level required.
Community Noise. Achieving the noise levels of subsonic noise rule FAR36 Stage 3 is the goal for
airport sideline and community noise. When further test data and analyses are available, it will be more
appropriate to decide on the most beneficial noise rule criteria, taking into account options affordedby the difference between performance characteristics of the HSCT and conventional, subsonic trans-
port aircraft.
Sonic Boom. A further goal for the future HSCT is to operate with an acceptable boom over popu-
lated areas. Large supersonic aircraft typically produce sonic booms that have shock waves with inten-
sities of 2.0 to 3.0 lb/ft 2. Commercial overland supersonic flights are not allowed by U.S. law. The air-
planes under study have been evaluated with subsonic flight profiles over land, which results in a
significant economic and market impact. Thus, there is impetus to explore low-boom designs that al-
low some form of overland supersonic operation.Based on a review of human response testing, design criteria of 72 dBA for corridors and 65 dBA
for unconstrained flight are suggested. The 72 dBA criterion suggests that 1.0 lb/ft 2 shock waves may
be acceptable. Parameters that significantly influence the effect of sonic boom pressure waves includerise time, duration, maximum overpressure, and initial overpressure.
2.2 OPERATIONAL REQUIREMENTS
Operational requirements include the use of suitable airports and design constraints based on the
speed and altitude of the mission.Two types of airports were considered: the conventional airport for subsonic and supersonic ve-
hicles, and a special airport constructed to support the heavy, hypersonic (Mach 6.0 or greater) vehicle.
If the HSCT were to operate from a conventional airport, the effect on airport construction and capac-
ity must be assessed. Furthermore, the vehicle's performance requirements in terms of field length

and low-speed characteristics must be defined. The very high weight of the hypersonic HSCT makes
use of a conventional airport impossible. This limitation, along with the hypersonic's special fuel sys-
tem, dictates the need for a customized airport.The speeds and altitudes to be flown by the HSCT could produce flight operation requirements
unlike those for subsonic aircraft in terms of both controlled airspace and the influence of cruise speed
and altitude on vehicle design.
Operation From Conventional Airports. Operation from conventional airports requires that thevehicle must meet anticipated weight and field-length constraints, as well as operate compatibly with
subsonic vehicles during approach to avoid system degradation.
Twenty-seven airports were selected as primary candidates for use by the HSC'E. The airports,along with their runway characteristics, are listed in table 2-1. A vehicle designed for a sea-level-takeoff
field length of 12,000 ft will impose little additional requirements to existing runways at these interna-tional airports.
The pavement strength at eight of these candidate airports is inadequate to support a 750,000-to900,000-1b HSCT without additional strengthening. However, the larger subsonic aircraft that are
Table 2-1. Selected High-Demand Airports
City
Anchorage, AK
Bahrain
Bombay
Buenos Aires (EZE)
Caracas
Chicago, IL (ORD)
Dallas/Fort Worth, TX
Frankfurt
Hong Kong
Honolulu, HI
Johannesburg
Los Angeles, CA
Lisbon
London (LHR)
Madrid
Mexico City
Miami, FL
Manila
New York, NY (JFK}
Paris (CDG)
Rio de Janelro (GIG)
Rome (FCO)
Seattle, WA
Singapore (Changi)
Sydney (Klngsford)
Tel Avlv
Tokyo (NRT)
Country
United States
Bahrain
India
Argentina
Venezuela
United States
United States
Germany
Hong Kong
United States
South Africa
United States
Portugal
United Kingdom
Spain
Mexico
United States
Philippines
United States
France
Brazil
Italy
United States
Singapore
Australia
Israel
Japan
Runway
Width x length, ft
150 x 10,897
200 x 13,000
150 x 11,455
262 x 10,824
150 x 11,483
150 x 11,600
200 x 11,388
150 x 13,123
200 x 10,930
150 x 12,360
200 x 14,495
150 x 12,091
150 x 12,483
150 x 12,802
150 x 13,451
150 x 12,796
150 x 13,002
200 x 11,004
150 x 14,572
150 x 11,860
150 x 13,124
200 x 12,795
150 x 11,900
200 x 13,123
150 x 13,000
150 x 11,998
200 x 13,120
Elevation, ft
44
6
27
66
235
667
596
328
15
13
5,557
126
374
80
1,998
7,341
11
75
12
387
30
14
429
21
21
135
135
B
6
4-Ug(X_7R2-2

anticipated to be in concurrent operation with the HSCT will require that the pavement strength be
increased by at least 20% over current levels.The HSCT may have some effect on the pavement fillet radius because of the anticipated length
of the vehicle. Some modifications to the runway fillets may be necessary to maintain an acceptable
runway-edge safety margin while maneuvering an HSCT on the ground from the runway to the taxiway
with the cockpit over the center line. Again, modifications must be made to accommodate the subsonic
vehicles anticipated for the years 2000 to 2015.To avoid an increase in the takeoff and landing separation between subsonic and supersonic air-
planes, a design approach speed of 145 kias (with a wake vortex system similar to that of a Boeing747) will ensure that impact is no more serious than a "heavy jet." If the vehicle had an approach speed
of 185 kias or a significantly stronger wake vortex field, there would be a significant incremental im-pact. Table 2-2 summarizes airport throughput sensitivities for flight rules (instrument flight rules
(IFR) and visual flight rules (VFR)), approach speeds, and approach path variants.
Operation From Special Airports. Special airports are envisioned to accommodate the needs and
improve the productivity of a hypersonic HSCT (airplanes with cruise Mach number of 6.0 or greater),
which is expected to operate with weights greater than 1 million pounds. This higher speed vehiclewill require special fuel systems as well and will probably not meet community noise standards.
To improve the productivity of a hypersonic HSC'I;, the average stage length must be long enoughto provide a substantial period of time at cruise. A network of strategically located "superhubs,"
shown in figure 2-1, was developed to maximize the average stage length of the hypersonic HSCT. These
hubs would be fed by subsonic airplanes, with service between the hubs by airplanes with cruise speeds
of Mach 6.0 and greater. The productivity, measured by units required, and the average trip time forthis superhub system were compared when serving the same market, with more direct routing and
either an all-subsonic fleet (Mach 0.84 cruise) or an aU-supersonic fleet (Mach 3.2 cruise, Mach 0.9
over land).
Figure 2-2 compares the units required in the year 2015 for each case. The aU-subsonic system (with525-seat airplanes) requires about 560 units, while the all-supersonic, Mach 3.2 system (with 283 seats,
subsonic over land, and waypoint routing) requires 50 fewer units. The third bar in figure 2-2 showsthat the system using superhubs requires more units (90 more than the subsonic and 110 more than
the supersonic system), but 370 of these are subsonic (and less expensive) airplanes.Figure 2-3 compares the average trip time for the three systems. Both the all-supersonic and the
hypersonic-subsonic superhub system show significant gains over the all-subsonic system. The super-hub system at Mach 6.0, however, shows no gain over a Mach 3.2 system and only 1 hr improvement
at Mach 15.0. This is because the feed portion of the trip and the passenger transfer at each end of
the high-speed leg consumes almost 4 hr (even assuming an optimistic 30-min transfer time).In conclusion, the benefits, in terms of the travel-time savings of a dedicated superhub network,
are minimal. Productivity gains are offset by the requirement for a large number of subsonic feed air-
planes. The hypersonic airplanes are likely to be very expensive because of both the technology re-
quired and the small number of units needed (less than 300). Operating costs are also likely to be high.In addition, six dedicated ground facilities would have to be built, the cost of which must be includedin the economic evaluation of the total transportation system.
Flight Operations. The high speed of travel and the high altitude of HSCT flight require specialconsideration of uncontrolled airspace. Currently, only the Concorde and special military vehicles use
the airspace above 60,000 ft. A new definition of airspace above this level is required to ensure that
the Air Traffic Control (ATC) services and standards provide the HSCT with safety levels equivalentto conventional, subsonic commercial operations. There are currently no known ATC services at the
higher altitudes for civil aircraft.No special considerations for ATC electronic equipment are required. The HSCT-era avionics sys-
tems will greatly enhance HSCT integration into ATC environments. The avionics, with improved7

L!
z
i
=

Superhub
Superhub
\ Superhub
Figure 2-1. Superhub Airport Network 4-uooo27P_-41,000
Units 500 --
All subsonic
Mach 0.84,
525 seats,
6,660 nrnl
Figure 2-2.
All supersonic
Mach 3.2,
283 seats,
5,500 nrni
Units Required- Year 2015
Superhub, rnlxed
subsonic and Mach 8.0,
283 seats
"IN\\ Dedicated NNNNN_
IN_N_ Mach 8.0 \_N I
_'/_:_.: it'..'..'._ili Mach 0.84 ::::'::.'::_:.'1:,'::::':::':._'::"..';..:;..'..","..".._.".,;..:/.."e;..':_':::'::':::
|_ _':','.9.Z.".e//...'.,',.,.'., _ ....,/..._.:..1
4-Ug0027R3-5
navigation accuracy, will permit a reduction in the separation standards used in oceanic and remoteareas. Tighter separation standards will lead to increased flight capacity and easier access to the system.
2.3 MARKET REQUIREMENTS AND ASSUMPTIONS
The development of HSCT market requirements demanded an assessment of not only the size anddistribution of the market, but also of certain airplane characteristics. These characteristics include
speed, design range, airplane through time and turnaround time at an airport, and passenger seatcount within the market. Each characteristic was examined parametrically and then in more detail
as required. The parametrics considered two basic environments: (1) an "unconstrained" environment
(that is, Great Circle routing and sonic boom allowed over land), and (2) a "constrained" environmentthat assumed no sonic boom over land and some rerouting to maximize time spent in supersonic
cruise. In both cases, existing airport curfews were observed and all the passengers were served within
a postulated universal airline system.
Additionally, the market potential is subject to certain unknowns in terms of stimulated passengerdemand due to shorter trip times and decreased demand due to ticket price increases over subsonic
9

i
15
10
All-subsonicsystem(Mach 0.84)
High speed flightJ
Hours / _-- Transfer, 30 mln at each end All-supersonic......... / / --- _ system
5 ' Feed at Mach 0.84 (Mach 3 2)
__;j___:":'$"_........ .:_$_$___-_:_ ; ................. _ "_:_ ........_ - ,_........ :.-..:_._.._$:_.:_......_;_ .-----. ......... Superhub
system0
5 10 15 20 25Dedicated design Mach number
Figure 2-3. Average Trip Time- Superhub System5-UgOO27R4-6
prices. Stimulation, as such, was not included in the basic study; however, the effect of ticket pricewas examined.
Market Forecast. The market forecast is based on major market area passenger flows as defined
in the "Boeing 1987 Current Market Outlook" (ref. 2.1). The Market Outlook covers the period from
1987 through the year 2000 and projects that world air travel will grow at an average rate of 5.3% peryear. The market application for an HSCT is derived from the "international scheduled" portion of
this forecast that represents 22.8% of the total world demand for the year 2000 (fig. 2-4).Not all of this market is applicable for a long-range airplane, however. Figure 2-5 graphically de-
picts that portion of the international traffic allocated to the HSCT. All passenger demands less than300 passengers per day, less than 2,500 nmi in distance, and all intra-regional demands were excluded.
As a result, only 28% of the international demands (or about 6.4% of the world passenger forecast)are considered HSCT study markets.
The traffic forecast for year 2015 was developed by assuming the individual markets are maturing,and therefore grow at 85% of their average rates from years 1995 through 2000. This resulted in almost
3 --
2
1
Passengers/day,millions
Domestic
70.5%
Figure 2-4.
International scheduled
International6.7%chartered
World Air Traffic Demand Forecast-Year 20004-Ug(X)27R2-7
10

Legend:
[] HSCTstudymarkets Under 2,500 nrni,
26.5%
Figure 2-5.
Intrareglonal,45.9%
Year 2000 International TrafficDistribution Forecast Based on Totalof 1,100,000 Passengers�Day5-U_O27R4-8
doubling year 2000 demand, with the Pacific Rim area forecast increasing at a greater rate (53% of
the revenue passenger miles (RPM) in year 2000 and 60% in 2015) (fig. 2-6). The total HSCT passenger
demand potential (without allowances for stimulation) is forecast to be 315,000 passengers per day
by 2000 and 600,000 per day by 2015. This is certainly adequate potential traffic to justify a commercial-ly viable HSCT. However, if significant ticket price increases are required for HSCT configurations,
market elasticity could reduce the demand for an HSCT below acceptable levels.The resulting market forecast becomes the potential market for the HSC'E The fleet sizes discussed
in this report represent various degrees of penetration of the potential market. However, airlines willhave on-order subsonic aircraft that will satisfy a significant portion of the lift requirement. The HSCT
market is the "open" lift market, which is the total market less the market satisfied by on-hand or
on-order aircraft plus the market created by aircraft retirements or transfers (fig. 2-7). The economicviability of the HSCT can affect all the elements of the open lift market. An economically viable HSCT
can affect the total market by stimulation. It can also affect near-term purchases of new subsonic air-
craft; retirements of older, marginal subsonic aircraft; and transfers of subsonic aircraft to othermarkets.
Passenger Trip Distance and Airplane Design Range. Figure 2-8 shows the distribution of nonstop
passenger trips (no intermediate stops) and RPM. About half the passengers and 40% of the RPMwould be satisfied by a 4,000-nmi design range. Ninety percent of the passengers, representing 84%
of the revenue passenger miles, could be satisfied by a 6,000-nmi design range.The following discussion summarizes a detailed analysis of 10 specific market areas in which air-
plane productivity and HSCT passenger trip time savings were used to evaluate design-range
11

|
|_=_=
1,250
1,000
75ORevenue
passengermiles, billions
per year
50O
250
Year 20151,107 billion RPM
Year 2000572 billion RPM
17%
Figure2-6.
16%
Revenue Passenger Mile Forecast
Other
Pacific Rim
Europe to Asiaand Pacific
North America toAsia and Pacific
North Amerlca toEurope
5-Ug0027R2-9
Airplanefleet,number ofunits
//_ Total fleet
Open
F Year-2000 fleet marketJ less retirements
_/_ J plus airplanes on
........ jK orderqll _=ll q_ll maid =IIID
_ Market satisfied
by on-hand andon-ordarairplanes
II I
2000 2015Year
Figure 2-7. Potential Market for the HSCT
Totalpotentialmarket
5-UgO027R2-119
12

100_
75
Cumulativepercentage 50
25
Nonstoppassengertrips
Revenue passengermiles
o, I I I I I I1,000 2,000 3,000 4,000 5,000 6,000 7,000 8,000 9,000 10,000
Great Circle distance, nml
Figure 2-8. HSCT Traffic Distribution- Year 20004-ugoo27R2-10
capabilities. Design range is important because it affects the number of intermediate stops requiredto serve the airline's network. Stopovers reduce airplane productivity and increase travel time.
The market area groups used to evaluate design range capabilities are--
a. Eastern North America to Europe.b. Eastern North America to Asia/Pacific.
c. Mid-North America to Europe.d. Mid-North America to Asia/Pacific.
e. Western North America to Europe.f. Western North America to Asia/Pacific.
g. Europe to South America.
h. Europe to Asia/Pacific.i. Pacific Rim (intra-Asia/Pacific).
j. Miscellaneous.
As seen in figure 2-9, four of these ten markets have more than 85% of their routes over water and
the others range from 50% to 80% over water. Further, figure 2-10 indicates that these same four mar-
kets represent about half the passengers and about 41% of the RPM.This natural differentiation of markets (predominantly over water versus over land) provides a use-
ful division to evaluate the HSCT design-range requirements relative to productivity (number of air-
planes required) and passenger trip time. Using year 2000 technology, figure 2-11 reflects the number
of units (with 247 seats and a 2-hr through time) required to serve each "mostly overwater" marketat both Mach 2.4 and Mach 3.2 cruise speeds. Most of these markets do not show any significant pro-
ductivity gain beyond a design range of 5,000 nmi. This same trend is apparent in the relative trav-el-time analyses (fig. 2-12) for the Eastern North America to Europe and the Pacific Rim markets;however, travel time saved continues to improve with increased design range for the other two markets
and, most markedly, the Western North America to Asia arena.
13

100
9O
Legend:
[] Mostly over water
8O
70
6O
Percentage 50over water
4O
3O
2O
10
Eastern Western EuropeNorth North to South RimAmerica Amedca Americato Europe to Asia
l
Ii
I
I
m
Pacific Eastern Western Mid-North Mid-Norlh Europe OtherNorth North America America to AsiaAmerica Amedca to Europe to Asia and theto Asia to Europe Pacific
Figure 2-9. Overwater Distance4-U_OO27R2-11
Pe_nta_je
of total
Legend:PassengersRPM
East West Europe Pacific East WestNorth North to South Rim North North
America America America Amedca America to Europe to Asiato Europe to Asia to Asia to Europe
Figure 2-10. Major HSCT Markets-Year 2015
-/
Mid-North Mid-North EuropeAmerica America to Asia
and thePac_o
4-Ug(X)27R1-12
]4

Units
Units
4OO
3OO
2OO
100
!f2OO
100
U4,500 5.000
iM5.000
Math 2.4
5,500Design range.
6.000nml
Mach 3.2
6.000
Design range, nml
Legend:
[] Western North America to Asia
[] Europe to South Amedca
[] Pacifm Rim
[] Eastem North America to Europe
N6,500 7,000
6,500 7,000
Figure 2-11. Units Required- Overwater Markets4-UgOO27R t pk33-13
The remaining markets cannot use an HSCT as effectively as the mostly overwater markets if thereis a constraint forbidding any overland supersonic flight. This constraint is an inherent assumption
in all Boeing market analyses. Therefore, these markets require flying long distances subsonic overland and reflect the need, in many cases, to deviate from Great Circle routing to reduce overland flight
distances. These markets require about 65% of the total airplanes, while carrying only 50% of the
traffic. Figures 2-13 and 2-14 represent these markets and show that a design range of 6,500 nmi would
capture most of the productivity. However, even with a 7,000 nmi design range, the average time saving
over a subsonic airplane is barely 40%.
Specific Airlines. The two key benefits of an HSCT to an airline are increased utilization and reve-nue. The most important aspect of the scheduling portion of the marketing analysis is the determina-tion of utilization as a function of the various design parameters. The HSCT universal system was
created to exploit the benefits of HSCT long-range markets where the relative time savings are greatestand where dense markets allow excellent passenger flow opportunities. This is a good environment
15

lO0
75
Time saved versussubsonic. %
5O
25
100
75
Time saved versussubsonic. %
5O
25
Mach 2.4
m
Eastern NorthAmedca to Europe
Pacific Rim
Mach 3.2
Eastern North Pacific RimAmerica to Europe
Design Range, nmi:
[] 4.500
[] 5.000
• 5.500
[] 6.000
[] 6.500
• 7,0o0
Europe to South Westem NorthAmertca Amedca to Asia
Europe to SouthAmedca
Western NorthAmerica to Asia
Figure 2-12. Relative Travel Time - Overwater Markets5-UgOO27R2-14
16

Units
7OO
6O0
5O0
4O0
3O0
20O
IO0
5O0
4,500
Mach 2.4
5,000 5,5O0 6,000 6,5OODesign range, nml
Mach 3.2
Legend:
[] Miscellaneous
[] Europe to Asia
• Interior Asia
[] Interior Europe
[] West Europe
• East Asia
7.000
Units 400
3OO
2OO
100
4,500 5,000 5,500 6,000 6,500Design range, nmi
7,000
Figure 2-13. Units Required- Other Markets 4-ugoo27R1pk33-15
17

lO0
75
"lime saved versussubsonic, %
Mach 2.4
Design Range, nmi:
[] 4,500
[] 5,000
• 5,500
[] 6,000
[] 6,500
• 7,000
50 D
0Eastern North Western North Mid-North Mk:l-Nodh Europe to OtherAmerica to America to America to America to AsiaAsia Europe Europe Asia
IO0
75
Time saved versussubsonic. %
Mach 3.2
50
0Eastern North Western to Mid-North Mid-North Europe to OtherAmerica to North Arnedca America to America to AsiaAsia to Europe Europe Asia
F/gum 2-14. Relative Travel Time-Other Markets5-ugoo27R4-16
18

to examine design sensitivities and the resulting utilization levels are high. In the real world, however,
it is important to understand how an airline system might differ from the universal system, primarilyfrom the standpoint of utilization and workrate differences.
HSCT Universal Utilization. The HSCT universal system utilization levels were established by run-
ning the various HSCT configurations through the HSCT universal system. Figure 2-15 shows the utili-
zation levels for the following set of conditions:a. Year 2000 HSCT universal system.
b. Seating of 247 seats.
c. A 5,000-nmi design range (3,583-nmi average range).
d. Mixed waypoint routing for Mach numbers greater than 0.84.e. Two-hour turn time.
The trend of utilization (as indicated by the dotted lines in the figure) as a function of average stage
length is based on analyses of trends derived from Department of Transportation (DOT) Form 41scheduled U.S. international airline reported data. The trends indicate that, as average stage lengthdecreases, utilization increases. Notice that the utilization level of the Mach 0.84 aircraft is about 30%
greater than the Boeing standard level that represents actual airline utilization. This again reflects thefact that the HSCT system is specifically designed to exploit utilization. The results of alterna-
tive-design-range HSCTs are superimposed on the utilization trends. These results indicate that theutilization levels for the alternative design ranges follow the trend lines, except for the high Mach num-
ber-short design ranges where, because the climb and descent are a greater proportion of the total
mission, the resulting utilization levels are below trend.
2,500
2,000
1,500
CO
1,000
500
2,000
HSCT universal system
" -.. . . _,._. Cruise Machnumber
,... -.... -.-.; - .... "-.--,-.--..-__..__,; :_....-.. ."..".-- _.'-,..,. _. ..... _,- -
. - .
" " " " " " " - '"'"_ _""-- 1,2
- . Boeing ......subsonic° . _
standard .................. -- 0.84 .....
I I I ........ I..........
Trend,Machnumber
5.0
3.22.42.0
1.6
1.2
0.84
2,500 3,000 3,500 4,000
Average stage length, nml
F/gure 2-15. HSCT Utilization Results
4,500
5-ugoo27R2-17
19

HSCT Airline Utilization. The next steps were to (1) examine the schedules of seven airlines that
expressed interest in HSCT activity, (2) determine how an HSCT might fit into these airline networks,and (3) establish the resulting utilization levels. The general approach was to start with a recent wide
body schedule for each of the airlines as reported in the Official Airline Guide. The schedule was con-
verted to a daily schedule (each flight operating 7 days a week). Also short-range, overland domestic
flights were excluded. This resulting route structure is referred to as the modified schedule. A reducedroute structure was then created in which most of the short-range, tag-end segments were eliminated
to increase average range and to improve utilization.
The resulting HSCT utilization levels for a "typical" airline are shown in figure 2-16. Notice that
the average stage lengths for the typical airline are considerably less than for HSCT universal network.
While it is difficult to generalize airline systems because of the unique characteristics of each system,some general observations are appropriate. A key comparison can be made between the utilization
of an HSCT within an airline system with that of an HSCT operating within the HSCT universal
system. The Mach 2.4 HSCT results in figure 2-16 demonstrate that the HSCT "airline" utilization,as measured in terms of trips per year, is about 20% below the Mach 2.4 Universal trend for the modi-
fied airline systems and about 10% below the Mach 2.4 Universal trend for the reduced airline systems.As Mach number increases, the utilization shortfall also increases, because of the short average stage
lengths in the airline systems.The utilization levels for the specific airlines differ. The main causal variables are-
a. Average stage length. The greater the average stage length, the less the utilization shortfall.
b. System size. The more the system is pared back to routes that are suited to the HSCT, the closer theutilization will align with the trend. However, this lessens the requirement for an HSCT, and creates
a requirement for a complementary airplane.
¢-
Itl
0
N
2,500
2,000
1,500
1,000
500
2,000
". Typical" . _ airline "_
• .. -.. "- .. system
•.. .:::: .. "--... t"---"S°Tu°,versa,sy,,em---q" ". Cruise .. " - ._. Cruise Math
Mach " " -. _ numbernumber " " " "
"'''- 5.0'-. "'-,_._'_1,,,.,,..,,_ "--..._ --5.0
... ,_'-. ,,,,,,,_- .. _ ..... ,,_,," .." :- ."_ A A o ". .m= " .. -. _ ;,,e - ...
_.Z_ -. Q'_ ,z=,_..,-= =====, _,,. _-. •
2 0- ° "-_--=. ...... "_°-.. -" P'-'_ -.. _"l " - .
"'- _" _- _"" ,,, _ .... 20 ""
"_'_,,-,,e- = _ 1.61.2,-,,,,, - - .
• . . ==' == °m ,,=B,,._==-._. _r _.=,,.=,i, _ ,===, " . _ . . . . . _ . . .
" " - - . o0.84_.,,,,.,,,.,,,,"'_' 1.2 -
Boeing _ .....
subsonic . .
standard " - 0.84 .....
[ Modlfled l Reduced l ......... I..... . ....
2,500
Machnumbertrend,
5.0
3.22.42.0
1.6
1,2
0.84
F/gum 2-16.
3,000 3,500 4,000
Average stage length, nml
I-/SCT Uti/ization Resu/ts for Typica/ Airline System
4,500
5-ug0027R3-18
20

c. Short-range segments. The smaller the proportion of short-range segments, the more likely the re-
suiting utilization will be closer to trend.d. Overwater percentage. The greater the overwater percentage, the more likely the resulting utiliza-
tion will be closer to trend.
The results indicate that if an HSCT is directly substituted for a Boeing-747 mission, the resulting
utilization levels may be 20% below the levels achieved in the HSCT universal system. This is primarilybecause of the many short, overland, tag-end segments that the subsonic aircraft typically perform.
To minimize the utilization loss in an airline system, the HSCT should be used on routes more suited
to its capabilities. However it is a delicate balancing act because the more the system is tailored to
the HSCT, the less the requirement will be for the HSCT, and the less desirable the service becomesfrom a passenger service point-of-view (i.e., more connect stops). Only by working with the airlinescan a determination be made as to how far the system can be tailored to favor the HSCT.
Market Physics. One of the first study tasks was to scope or focus the airplane design effort through
parametric marketing applications. A universal airline system was postulated using the defined pas-
senger flow forecast. The airplanes flown in this system were varied in size (seats), design range, andcruise Mach number. Acceleration rates were varied between 0.1g and 0.5g, based on "Evaluation of
Routing and Scheduling Considerations for Possible Future Commercial Hypersonic Transport Air-
craft" (ref. 2.2). The turnaround and through stop times varied from 1 to 4 hr. Figures 2-17 through2-19 are indicative of the overall results for the best-case potential, unconstrained, supersonic, over-
land flight with Great Circle routing. These results indicate maximum gains in productivity between
Mach 2.0 and Mach 8.0 and, of course, using the longest design range and the higher number of seats.Of additional interest are the obvious trades between Mach number and the other parameters
Units
800
700
600
500
400 --
300 --
200 --
1000
• 7,000-nml design range• 2-hr turn/through time
400
600
l I I I I I I I I I I I I I I I I I2 3 4 5 6 7 8 9 10 11 12 13 14 15 16 17 18 19 20 21 22 23 24 25
Design Mach number
Figure 2-17. Fleet Size Versus Seats4-UgO027R1-19
21

Number of units
required
f700
600 f
500Numberof unitsrequired
400
90O
8OO
7OO
6OO
500 -
4OO
3OO
%
• 2-hr turn/through time• 283 seats
200 I I I I I I I I I 1 I 1 I I I I I 1
0 1 2 3 4 5 6 7 8 9 10 11 12 13 14 15 16 17 18
Design Mach number
Figure 2-18. Effect of Design Range on Fleet Size
O.
C-
I I I
19 20 21
Design range4,500 nml
5,500
7,000
I I I22 23 24 25
4-UgO027R1-20
• 7,000-nml design range• 283 seats
Turn/throughtime 4 hr
3 hr
300 2 hr
200 1 hr
1000 1 2 3 4 5 6 7 8 9 10 11 12 13 14 15 16 17 18 19 20 21 22 23 24 25
Design Mach number
Figure 2-19. Fleet Size Versus Turn�Through Time4-UgOO27R 1-21
(e.g., fig. 2-18 demonstrates that a 7,000-nmi design range, Mach 3.0 vehicle has the same productivity
potential as a 4,500-nmi design range Mach 10.0 vehicle).While figures 2-17 through 2-19 used an average acceleration rate of (0.02 x Mach) g, figure 2-20
shows that significant gains in average Mach number are possible (in the unconstrained environment)
by accelerating at high rates up to certain Mach limits. The prime explanation for the limitation liesin the climb and descent portions of the flight. For example, a Mach 25.0 airplane accelerating at 0.5g
22

5
System
average 4Machnumber
3
oo 1 2
Figure 2-20.
System operation
0 Unconstrained great circle
V Mach 0.9 overland great circle_mmmmm,m_
Acceleration0.5g
(0.02 xMach) g
SystemaverageMach =designMach
0.2g
0.1g
......0 lg --J _-- (0.02 x Mach)g
3 4 5 6 7 8 9 10 11 12 13 14 15 16 17 18 19 20 21 22 23 24 25
Design Mach number
Effect of Acceleration Rate on Average Mach Number (7,000-nmi Design Range)4-UgOO27R 1-22
requires 7,000 mi to climb and descend. That same airplane accelerating at only 0.1g (a more reason-able comfort level for the passengers) requires 35,000 mi to climb and descend. In either case, very
few city-pairs are far enough apart to allow proper use of the higher Mach numbers. When the "nosonic boom over land" constraint is applied (see lower curves in fig. 2-20) no gain is received from
the higher acceleration rates. Further, the average system Mach number never reaches Mach 2.0 evenfor a Mach 25.0 airplane. The explanation for this low average Mach number is that almost 50% of
the Great Circle routes are over land, and flying that percent of distance subsonically allows very little,
if any, cruise at the higher Mach numbers.One solution for this problem is to reroute appropriately to minimize the overland distances. This
application reduced the overland portion to less than 20% of the total distance and had a significant
effect. Figure 2-21 shows the result using a 7,000-nmi design range vehicle with 283 seats and 2-hr turn/through time (acceleration (0.02x Mach)g). However, system average Mach number still did not exceed
Mach 3.0 and these results indicate that design Mach numbers above 3.5 to 4.0 probably do not justifyfurther consideration for airline use.
Market Elasticity. HSCT revenues can be increased by charging more for the faster service;
however, air travellers (particularly economy class) are sensitive to ticket price. Any significant in-
crease in ticket price will result in loss in market share for the HSCT. A reduction in market sharemeans fewer units produced to serve the market with a subsequent increase in the price of each unit
to recapture the development and manufacturing costs. Therefore, the tradeoff between a ticket priceincrease and time savings becomes an important issue in the economic viability of an HSCT.
A determination was made for the market study of the class mix of passengers within the forecast
time period. This was accomplished by analyzing the DOT 10% U.S. ticket sample for 1985 and23

Number of unitsrequired
System averageMach number
800
7O0
6OO
500;
400
300
200
8
7
6
5
4
3
2
1
00
m
m
Reroute on Fleet Size
Mach 0.9 over land(Great Circle)
• _ .£__Mach 0.9 over land(rerouted)
_ ..El .... ,IE]--.-- ,...Unconstrained _reat
Circle (reference)
Reroute on Average Maoh Number
Unconstrained Great
Circle (reference)
Mach 0.9 over land
(rerouted)
Mach 0.9 over land Great Circle
1 2 3 4 5 6 7 8 9 10 11 12 13 14 15 16 17 18 19 20 21 22 23 24 25
Design Mach number
Effect of Reroute on Fleet Size and Average Mach NumberFigure 2-21.5-UgOO27R3-23
allocating the results to establish first, business, and economy passengers in each of 14 markets. Figure
2-22 shows that, as expected, the mix of classes varies widely by market with the proportion of economypassengers varying from 62% to 79% within each market. For the purpose of market evaluations, the
following class mix was assumed:a. First class 5.7%.
b. Business class 17.8%.
c. Economy class 76.5%.
It was then necessary to collate the results of previous passenger surveys conducted for or by The
Boeing Company relative to supersonic travel and the passenger's reaction to speed and ticket price.
Four surveys were reviewed with the consolidated results illustrated in figure 2-23. These data are fora 50-50 mix of business and personal travellers in economy class. The results are completely consistent
and indicate that the percentage of passengers choosing the supersonic flight decreases substantially
as the price is increased; however, the percentage also increases as the time saved increases. The
survey data were cross-plotted (with extrapolations to 40% time savings) to give the relationship of
ticket price to market share as a function of time saved (fig. 2-24). Note that for a 40% time savings,a 10% ticket price increase reduces the market share by over 65%.
In order to put this in perspective, figure 2-25 summarizes the time savings provided by year 2015,Mach 2.4, 247-seat airplane with a 5,000-nmi design range. Only 50% of the scheduled RPM have time
savings of 40% or more as compared to a subsonic airplane flying the same routes. While this seems
disconcerting, figure 2-26 shows that those markets would require over 500 airplanes by the year 2015,
which is certainly an adequate production opportunity.
Another view of the market share impact on units required is provided by figure 2-27. In this analy-sis, it was assumed that the HSCT would capture 100% of the first-class passengers. The number of
24

100
China
SouthAfrica
Australia
MiddleEast
Far East Caribbean South EuropeSouth Central
India America America Oceania
Southeast Japan NorthAsia
75
Percentageofpassengers
5O
Economy
100
25
Figure 2-22. Class Mix From the United States
Business
Firstclass
4-UgO027R2-24
75
Percentagechoosing 50supersonic
25
Market (time saved)
Los Angeles to Honolulu (50%)
I I I I I0 10 20 30 40 50
"_cket price increase, %
Figure 2-23. Time and Price Trades for High-Speed Air Travel
6O
4-UgOO27R1-25
25

lOO
8O
Marketshare, %
IO0
75
00
Percentageof RPM
50
25_
Time saved
7O%
6O%
5O%
40%
Figure 2-24.
10 20 30 40 50
Ticket price increase, %
Estimated Market Share Versus Ticket Price4-UgOO27R1-26
0
Figure 2-25. Impact of Time Savings on Traffic Carried- 1-Hour TumlThrough Time4-UgOO27R 1-27
26

Units
required
1,250
1,000
750
5OO
25O
All markets
Figure 2-26. Impact of Time Savings on Market Size3-UgOO27R1-28
Units
required
1,500
1.000
50O
00
Figure 2-27.
!i
f Jf J
J
Business class __ _'- _"- _'_
I 1 I25 50 75 100
Tourist class market share, %
Units Required Assuming 100% of First-Class Market- 1-Hour Turn Time3-UgOO27R1-29
2?

business- and economy-class passengers carried was varied in each market. The airplane seating mix
was changed to correspond with the assumed demand. The number of units required was then
determined by scheduling each configuration to carry the demand. As expected, the tourist market
share has a major impact on the number of units required (a 25% decrease in tourist-class marketshare results in a 230-unit decrease in airplanes while a like percentage decrease in business-class mar-
ket share only reduces the number of units by 50). If 100% of the first-and business-class passengers
and only 25% of the economy-class passengers are captured, there is a potential requirement for over600 Mach 2.4 vehicles. This is, again, an adequate production opportunity.
2.4 CONCLUSIONS
From a marketing standpoint, there is substantial potential for an HSCT. However, in order tocapture 100% of the available market, the vehicle must achieve operating cost levels that require no
increase in ticket price. Any increase in pricing will, in mature competition, reduce the number of pas-
sengers willing to choose the HSCT and could possibly repeat the Concorde experience. The vehicleshould exhibit the following characteristics:
a. Design range. Initial introduction should be mainly in the overwater markets with a range of 5,000nmi to be quickly increased to 6,500 nmi to minimize intermediate stops (which increase airlinecosts and passenger trip times) and to allow maximum flexibility of the airplane within an airline's
system.b. Seats. Initial target is 250 to 300 seats in a tri-class configuration. Final seat definition is a function
of productivity, which depends on Mach number and design range capabilities.c. Mach number. Between Mach 2.0 and 3.5, but consistent with minimum operating costs and maxi-
mum productivity when considering design-range tradeoffs.
28

3.0 PROPULSION TECHNOLOGY
The NASA contract provided for technical and economic viability assessments to be made on sev-
eral high-speed civil transport (HSCT) concepts over a wide Mach number range. The assessments
required the definition of appropriate engine concepts for each airplane configuration. The engineswere provided by three engine manufacturers, Aerojet General, General Electric Aircraft Engines
(GE), and Pratt & Whitney (P&W), who were subcontracted for specific support tasks. Two time-frames were considered: the year 2000, providing the earliest viable introduction date combined with
a favorable market assessment, and the year 2015, allowing for a maximization of technological ad-
vances. Descriptions of the engine concepts, and a summary of the performance results are provided
in the following sections.So that the technical and economic viability of each of the airplane configurations could be thor-
oughly evaluated, the engine manufacturers were required to supply performance, weight, geometry,and economic data for both the engine and the exhaust system. Technology projections for improved
performance and reduced weight beyond the initial certification date were also required to support
the airplane growth strategy.In the performance assessment of the airplane configurations it was necessary to scale both the
engine and the airplane to correctly size the airplane for the design range. It was, therefore, necessarythat scaling laws governing engine weight, dimensions, and economics also be provided by the enginemanufacturer.
An important factor in the overall viability of the airplane is the growth strategy for increased pas-
senger loads on the shorter Atlantic routes and decreased passenger loads for the longer Pacific routes.Here the technical projections for improved engine performance and reduced engine weight beyond
the initial airplane certification play an important part. This is where an early, extensive commitmentto research by NASA will play a significant role in the viability of a U.S. HSCT.
Performance and economic predictions were initially supplied for six engine concepts. In later
phases of the evaluation, three additional variations on these engine concepts and technology projec-
tions were provided at the lower Mach numbers. These engines were representative of a broad spec-trum of applicable cycles and fuel types as shown in table 3-1. Three engine concepts (representing
flight Mach numbers less than 4.0) are "conventional" kerosene-fueled, while the other three (for Mach
numbers greater than 4.0) are fueled by cryogenic fuels. The conventional-fueled and the
cryogenic-fueled engine concepts are discussed in the following sections.
Table 3-I. Engine Data Packs for Airplane Configuration Studies
Design Mach numberCompany
2.4 2.8 3.2 3.8 4.5 10.0CertificationDate
2015
Pratt &Whitney
6.0
ATR (LH 2)AerojetGeneral
General 2000 VCE (JET A) VCE (TSJF) IVCHJ (CH 4)Electric 2015 VCE (TSJF)
VCE/SJ2000 VCE (JET A) VCE (TSJF) VCE (TSJF)2015 TP TP (LH2)
_kbbrevlatlons:VCE variable cycle engine (JET A) kerosene typeVCHJ turbofan ramjet (TSJF) thermally stable Jet fuel
ATR air turbo-ramjet {CH4} liquid methaneSJ scramjet (LH2} liquid hydrogen
TP technology projections only
5-UgOO27R3-30
29

3.1 CONVENTIONAL-FUELED ENGINE CONCEPTS
The three conventional-fueled engine concepts are the variable-cycle engine (VCE) turbofan from
GE, and the turbine-bypass turbojet (TBE) and the afterburning turbojet from P&W. General features
of the engine concepts are discussed, and performance and weight comparisons are made in this sec-
tion. Additionally, the effects of technology improvement on engine performance and weight from theyears 2000 to 2015 is presented. Each of these engine concepts requires noise suppression technology
in order to operate from conventional airports. (A discussion of noise suppression technology is pres-ented in section 3.3.)
The GE VCE turbofan uses variable geometry front and rear flow diverters along with variablegeometry in the fan, low-pressure turbine, and exhaust nozzle to provide optimum performance
(ref. 3.1). The double variable-area bypass feature allows increased engine airflow for reduced noise
at takeoff, reduced inlet spillage drag at part power, and good inlet operation at approach. Low-pres-sure turbine-stator variable geometry increases core power and dry thrust at inlet scheduled airflow
during the climb-accelerate portion of the mission and reduces the augmentation required. This signif-
icantly reduces thrust-specific fuel consumption (TSFC) and noise (as a result of lower exhaust jetvelocities).
The VCE turbofan aft mixer operation provides increased climb thrust at the maximum powersetting by permitting the fan to be controlled to a minimum stall margin. The aft mixer also providesfor best fan operation at takeoff power and high-bypass duct bleed rates for reduced noise.
GE provided performance, weight, and economic predictions for the Mach 2.4 and Mach 3.2 en-
gines. Engine performance and weight predictions are based on overall engine dimensions and flow
path definition. The GE Mach 3.2 engine used in the aircraft speed study, is shown schematically infigure 3-1(a); the Mach 2.4 engine concept is similar. The Mach 3.2 engine is an augmented 0.3 bypassratio turbofan with a 14.6 overall pressure ratio (OPR) and a 3.8 fan pressure ratio. The Mach 2.4 en-
gine is a 0.35 bypass ratio turbofan with a 22.5 OPR and a 4.5 fan pressure ratio. This latter engine
was used to assess engine emission reduction technology. All of these engines use advanced technologyfighter engine military technology in the core components.
The P&W TBE, as the name implies, bypasses a percentage of the compressor flow around the
combustor and turbine to provide near optimum performance at high-power settings. Generally, a
turbojet operates with the turbine choked over a wide range of operating conditions. For variations
in turbine inlet temperature, the compressor will operate at pressure ratios and airflows to satisfy the
constant value of turbine-corrected airflow. For a prescribed compressor airflow, the compressor op-erates at increasing pressure ratios with increasing turbine inlet temperatures. The compressor surge
margin places an upper limit on the turbine inlet temperature. Consequently, the selection of a particu-lar compressor-turbine combination places limits on the turbine inlet temperature excursion that aturbojet engine can achieve. Matching a compressor to a large annulus-area turbine reflects a
high-temperature design that is capable of high thrust levels. For the same engine airflow, matching
the same compressor to a small annulus area turbine reflects a low-temperature design and low thrust.The smaller turbine could not be operated at the same high turbine inlet temperature as the large annu-
lus area turbine without surging the compressor.
One means of removing the restrictions associated with the choked turbine is by using a variablearea turbine (VAT). With the ability to vary the turbine area, the turbine corrected flow can vary, thus
permitting wider excursions in the operating turbine inlet temperature. Typically, at Mach 0.9 the tur-
bine area varies by 30% from low throttle to maximum climb thrust, while the compressor operating
points do not vary significantly.In practice, a VAT is difficult to achieve because of the complexities involved in providing variable
area capability in hot structures. The TBE varies the turbine airflow rather than the turbine area with
the same performance benefits as the VAT (ref. 3.2), but without the complexities.
P&W provided performance, weight, and economic predictions for the Mach 2.4 and Mach 2.8
TBE engines. Engine performance and weight predictions are based on overall engine dimensions and
30

Forward Takeoff mode
varlable area _--Aft variable area bypass Injector
bypass Injector_ , / _ _-_
/' /
S turome stator
Supersonic Cruise Mode
(a) GE Mach 3.2 Variable Cycle Engine
Supersonic Cruise Mode
Crossover duct
Takeoff mode
(b) P&W Turbine-Bypass Engine With NACA Nozzle
(c) P&W Afterburnlng Turbojet
Figure 3-1. Conventional-Fueled Engine Concepts5-UgOO27R4.-31
3]

flow path definition. A schematic drawing of the P&W TBE engine is shown in figure 3-1(b). The Mach
2.4 engine features a seven-stage, high-pressure compressor that is driven by a two-stage, high-pres-sure turbine with a turbine-bypass bleed capability; the engine OPR is 15.5. The baseline combustor
technology is similar to that employed on the PW4000 commercial engine. The Mach 2.8 engine is simi-
lar except that it incorporates a six-stage compressor with an OPR of 10.5. As with the GE study, theP&W Mach 2.4 engine was also used to assess engine emission reduction technology.
As the vehicle Mach number increases, a turbomachinery cycle becomes less efficient. The higherfreestream stagnation pressures and temperatures associated with the higher Mach numbers restrict
the amount of energy that can be added to the captured air and still meet the temperature limits of
the engine material. To assess the Mach number effect, P&W supplied performance and economics
predictions for an afterburning turbojet designed to operate at Mach 3.8. A schematic drawing of theP&W Mach 3.8 engine is shown in figure 3-1(c). The Mach 3.8 engine features a five-stage, high-pres-
sure compressor that is driven by a single-stage, high-pressure turbine; the engine OPR is 7.75. Thisengine was used in the initial aircraft screening study.
Installed performance variations for the conventional-fueled engines are shown in figure 3-2. Fig-
ure 3-2(a) presents the installed subsonic (Mach 0.9) cruise performance for each engine, while figure
3-2(b) presents the installed supersonic cruise performance for each engine at their respective cruiseMach numbers. Year 2000 technology is used for the Mach 2.4, 2.8, and 3.2 engines' performance, while
the Mach 3.8 engine uses the available technology of year 2015 (the turbine inlet temperature requiresthe later technology materials). Table 3-2 presents the engine size and weights for each hydrocar-
bon-fueled engine. The initial engine size and the final mission-sized engine are included.
Performance and weight sensitivities for technology improvement from the years 2000 to 2015 were
provided by the engine companies for the Mach 2.4 and 3.2 engines (fig. 3-3). The graphs illustratethe subsonic and supersonic cruise performance relative to the performance of the 1971 U.S. SST tur-
bojet, which is a good representation of the available technology at that time. The improved perform-ance of the year 2000 TBE is shown along with the projected year 2015 improvement. The performance
1.9
1.8
1.7
1.6
L3 ¢-
1.4
6I1_) 1.3I--
1.2
1.1
1.0
0.90
(a) Subsonic
_ . engine
-- , I
B
GE Math 3.2 engine
P&W Math
ach
glneI I.. I
20 40 60 80
(Fn-D)/q, ft 2
dLL
O_)--
2.8
2.6
2.4
2.2
2.0
1.8
1.6
1.4
1.25
(b) Supersonic
P&W-- Mach 3.8 engine
i
GE Mach 3,2 engine
-P&W
_ Mach 2.8 engine- P&W
Mach 2.4 engine
I I I I15 25 35 45
(Fn-D)/q. ft 2
55
Figure 3-2. Conventional-Fueled Engine Cruise Performance Comparison5-ug0027R4-32
32

Flight Machnumber
2.4
2.8
3.2
Note:
Table
Engine company
P&W
P&W
GE
3-2. Conventional-Fueled Engine Weights
Initial engine size Mission-sized engine
Wa, Ibis Weight, Ib Wa, Ibis Weight, Ib
630
650
700
650
13,770
15,400
15,927
10,200
604
745
870
8753,8 P&W
Engine weight Is per engine and Includes base engine + nozzle + reverser + suppressor.
13,150
17,890
20,320
13,730
4-UO0027R2-33
21-dU_(/3
I--
1.7(a) Subsonic Crulse Performance
1.6 --_SS
1.5
1.4 T--circa 1971/ I ;;1.3 --
1"2 _ /-Year 2000 technology _
0.9
0.8
0.7
o.5/ I I I I I10 20 30 40 50 60 70
(Fn-D)/q, ft 2
Figure 3-3.
__1__dI.L
¢/)I--
(b) Supersonic Crulse Performance1.60
1.50
1.45 1
1.35 Year 2000
1.30 i_
1.25
1.20
1.15 I I I I 18 12 16 20 24 28 32
(Fn-D)/q, ft2
Engine Technology Improvements5-UgO027R3-34
improvement from 1971 to 2015 is largely because of the variable-cycle improvement; the primary tech-
nological improvement is the materials used. The propulsion pod is projected to weigh 30% less with
year 2000 technology than a similar pod with 1971 technology would weigh. Technology in the year 2015reduces the pod weight by another 11%. Advanced lower weight alloys and composites will allow higher
temperature limits that, in turn, will yield improved performance from the reduced cooling flows. Ad-vanced combustor designs will be incorporated to reduce emissions and aerodynamic blade design
improvements will improve performance.The trend is toward increasing levels of TSFC with increasing flight Mach number at constant val-
ues of the ratio of thrust minus drag to the dynamic pressure. Engine performance and weight each
have a significant impact on vehicle takeoff gross weight (TOGW). Preliminary estimates indicate that1,000 lb of engine weight becomes 24,000 lb of TOGW for the Mach 2.4 aircraft sized for a 5,000 nmi
range. Additionally, 1% in TSFC is equivalent to 360 lb of engine weight, which yields 8,640 lb ofTOGW.
The engine weights for the initial engine concepts were estimated using aerodynamic flowpathmodels. The studies of emission reduction concepts and detailed engine designs in the third phaseof the contract had mixed results, and showed the need for indepth studies. The emission study by
P&W revealed the need to increase the length of the combustor section for the baseline Mach 2.4 en-
gine, requiring a moderate engine weight increase. The weight study by GE identified design ap-
proaches that achieved a significant weight reduction of their baseline engine.
33

3.2 CRYOGENIC-FUELED ENGINE CONCEPTS
Three cryogenically fueled engine concepts were analyzed for potential hypersonic cruise vehicles.
All three were year 2015 technology engines: a Mach 4.5 tandem turbo-ramjet from GE, a Mach 6.0
air turbo-ramjet (ATR) from Aerojet General, and a Mach 10.0 turbo-ramjet-scramjet from P&W.
Engine cycle thermodynamics and the properties of the engine material influence the choice ofengine cycle for each flight Mach number; the freestream stagnation temperature increases with Mach
number. In the Mach number range of 3.0 to 4.0, the gases entering the engine have such a high temper-
ature that no further energy can be added by turbomachinerywithout exceeding the temperature limitsof the projected engine materials. In that situation, no net thrust is possible. Eliminating the ability
to raise the material temperature limits leaves two possible modifications: (1) minimizing or cancelingthe turbomachinery work output requirements, or (2) making the turbomachinery work output inde-
pendent of flight Mach number.
As airplane Mach number increases, the inlet diffuser compression ratio becomes high enough
that mechanical compression can be minimized or eliminated. Minimizing the mechanical compres-sion ratio can lead to either a very low compression ratio, a variable mechanical compression process,
or a turbomachinery bypass process. The complete elimination of mechanical compression leads tothe ramjet, but because a pure ramjet is not effective at subsonic and low supersonic speeds, a second
turbomachinery engine is required. This combined engine cycle, known as a turbo-ramjet, is used forthe Mach 4.5 airplane. At this Mach number the heat sink capability of kerosene-type fuels may be
inadequate; therefore, cryogenic liquid methane was selected for use.
The second modification, having the turbomachinery work output independent of flight Machnumber, leads to the ATR engine. The exhaust energy from a source independent of flight speed is
expanded through a turbine; the turbine work output is used to drive a compressor. The thrust is pro-
duced by the combined expansion of the compressed air and the turbine exhaust products, which is
the engine cycle used for the Mach 6.0 airplane. At flight speeds above approximately Mach 7.0, thepressure losses incurred while decelerating the supersonic flow to subsonic speeds for combustion are
too high. This is overcome by burning the fuel in a supersonic stream, which removes the normal shock
losses; this engine cycle is known as a scramjet. To burn supersonically, it is necessary to use a fuel
with a high flame speed. For the Mach 10.0 engine, liquid hydrogen was selected for its improved heat
sink capability and higher flame propagation speed.
Performance and economic estimations for a liquid methane (CH4) fueled tandem turbo-ramjetwere presented by GE. A schematic drawing of the engine concept is presented in figure 3-4(a). At
takeoff and subsonic climb, the core intake-guide-vanes are open, and the engine operates as an after-burning turbojet engine. As the engine climbs transonically and at low supersonic speeds, the bypass
begins to open allowing a portion of the inlet flow to divert around the turbomachinery and to mixwith the core flow before the afterburner. At Mach 4.5 cruise, the intake guide vanes are closed, the
bypass is fully open, and the engine operates as a pure ramjet.
Aerojet General provided a liquid hydrogen (LH2) fueled, dual-regenerator ATR for a Mach 6.0aircraft. A schematic drawing of the engine concept is shown in figure 3-4(b). The ATR is a continuous
flow airbreathing engine that involves air compression (ram plus mechanical), constant pressure heat
addition, and expansion through a thrust nozzle. The unique feature of the engine is that the turbine
of the turbocompressor is driven by high-temperature, fuel-rich gas from a separate gas generatorrather than by the heated air from a fuel-air combustor as in a turbojet. After passing through the
turbine, this fuel-rich gas is mixed with the airflow from the turbocompressor and burned in a burner
before expansion through the nozzle. This gas is formed by heating and vaporizing the LH2 fuel in
a dual-regenerator process. The first heat exchanger is located at the turbine exit; the second uses wasteheat from the combustion chamber.
P&W provided an LH2-fueled turboramjet-scramjet for evaluation of a Mach 10.0 aircraft. A sche-
matic drawing of the engine concept is shown in figure 3-4(c). The concept employs a turbojet installed
above the ramjet-scramjet. Initially, the ramjet-scramjet is closed off and the turbojet provides the
34

guide vanes (open) Variable nozzle
VariableIntake
Low Mach number
Intake guide vanes (shut) Variable nozzleVariableIntake
--.. _ _ "
High Math number
(a) GE Math 4.5 Tandem Turbo Ramjet
Compressor Turbine Variable area nozzleIF /- /--
Tur'blne mlnlfold J_ L Fuel_ai r _ Regenerative
- mixture fuel heaterFue)-r_ch(Reac"_on, (-',-,----
(b) Aero et Math 6.0 General Air Turbo-Ramjet
,#
:':':_":':"_'_--"'-_ . ___ ._ _,,'"-
Turbojet modeTake off, climb, and accelerate to transonic speeds
_i_..._ ,,_:_ F--,¢_iii_i_. r " -":.:.::i::. =============================.... :::::::::::::::::::::::: __.:.:.:_. _.. ............................__ ._::._. =.......
.......i_._! .... :............................................ ...........................;:;_;::;_:
Turbojet-ramjet modeTransonic to supersonic speeds: climb and accelerate
Ramjet/scram jet modeSupersonlc climb, acceleration, and cruise
(c) P&W Math 10.0 Turbo-RamJet-ScramJet
Figure 3-4. Cryogenically Fueled Engine Concepts 5-Ug0027RS-41
35

thrust for takeoff, climb, and acceleration to transonic speeds. The inlet geometry is varied to provide
for combined turbojet/ramjet operation for initial supersonic climb. Between Mach 3.5 and 4.0 theturbojet is completely closed off, and the engine operates as a ramjet for climbing to Mach 6.0. Forthe remainder of the climb to the Mach 10.0 cruise altitude the engine operates as a scramjet.
Installed supersonic cruise performance variations are shown in figure 3-5 for the year 2015, cryo-
genically fueled engines studied. Table 3-3 presents the size and weight of each engine, including the
initial engine size and the final mission-sized engine.
2.8
xa
dIiCO
F--
2.6
2.4
2.2
2.0
1.8
1.6
1.4
1.2
1.0
0.8
0.6
Mach 10.0P&W STJRJS-876348 Ibis turbojetLHV 51,500 Btu/Ib
|
Mach 4.5
GE43/FZ3 Study B6700 IbisLHV 21,500 Btu/Ib
0
I10
J AeroJet ATRMach 6.0 • _" 730 Ib/sengine LHV 51,500 Btu/Ib
1 I I20 30 40 50
(Fn-D)/q, ft 2
Figure 3-5. Supersonic Cruise Installed Performance Comparison--Year 2015 Cryogenically
Fueled Engines s-uooo27_-_
Table 3-3. Cryogenically Fueled Engine Weights
Flight Mach number
4.5
6.0
10.0
Note: Engine weight Is
Engine company
GE
Aerojet General
P&W
Initial engine size
Wa, Ibis Weight, Ib
700 11,890
730 4,400
348 10,700
Mission-sized engine
Wa, lb/s
1,150
1,500
1,800
)er engine and Includes base engine + nozzle + reverser + suppressor.
Weight, Ib
20,730
9,720
55,340
3-U90027-36
36

The trends are slightly different for the cryogenically fueled engine concepts. The Mach 6.0 ATR
TSFC and weight are both lower than the Mach 4.5 turboramjet or the Mach 10.0 scramjet. Withinthe scope of this study it was not possible to determine whether the three engine companies involved
in these estimates examined the same level of detail for each projection. The engine performance and
weights were used in the vehicle performance studies as directed by the engine companies. It was de-cided that if the vehicle made economic sense, then an attempt would be made to update the results.
Results indicated that cryogenically fueled aircraft are unacceptable, so no further updating of theMach 6.0 or 10.0 aircraft was done. Additional studies were made of the Mach 4.5 aircraft to obtain
a more innovative configuration with reduced TOGW; the propulsion data for these studies were un-
changed, and the TOGW, while showing a small improvement, remained unacceptable.
3.3 ADVANCED JET NOISE REDUCTION CONCEPTS
For the initial screening there was no attempt to provide acoustic suppression devices for airplane
configurations at and above Mach 6.0. It was anticipated that special airports or "superhubs" would
be required for such designs. For the Mach 3.8 and Mach 4.5 configurations acoustic suppression de-
vices were not defined, but a weight increment was allocated. Acoustic suppression devices weredefined for the Mach 2.4 to Mach 3.2 engines, and the engine manufacturers also supplied turboma-
chinery noise data for assessing these noise suppression concepts. The objective was to obtain airport
noise levels that were comparable to the FAR36 Stage 3 limits.Jet noise can be diminished either by reducing the jet velocity, or through nozzle-noise-suppressor
technology. Thrust is proportional to the product of jet velocity and engine airflow. Hence, for the same
thrust, jet velocity can be reduced by increasing the engine airflow. This requires a larger engine with
increased weight. (Weight penalties are discussed in section 3.1.)
Effective noise suppression of jet and shock-cell noise is paramount to an acceptable HSCT. Signif-icant suppression is required (a minimum of 10 EPNdB relative to a round-convergent nozzle) for any
HSCT configuration. This section discusses various jet noise suppression techniques, the suppressor
concept used in this study, and the turbomachinery noise parameters received from the engine
companies.Detailed jet noise suppression techniques were considered in this study for the Mach 2.4, Mach
2.8, and Mach 3.2 configurations. A nozzle weight penalty for noise suppression was assessed for the
Mach 3.8 and Mach 4.5 configurations, but no detailed noise suppression technology was studied. It
was assumed that the Mach 6.0 and Mach 10.0 aircraft would operate out of special superhub airfields
where noise would be less critical. Consequently, no noise suppression was considered for thoseaircraft.
Jet noise suppression techniques were investigated in the Supersonic Cruise Research (SCR) study.Several of the various concepts studied are presented in figure 3-6. The benefit of coannular nozzlesrelative to conical nozzles was identified as well as the effects on noise of such parameters as nozzle
area ratio, radius ratio, velocity ratio, nozzle pressure ratio, temperature ratio, and the projection of
the inner nozzle from the outer nozzle. Other schemes, such as asymmetric nozzles and thermal-acous-tic shields, were studied, and the contribution of shock-cell noise was estimated.
A study integrating a thermal-acoustic shield into a GE engine was undertaken in the SCR studies.Estimates of the range penalties were made. Mechanical suppressor nozzles were also investigated;
figure 3-7 illustrates the thrust penalties associated with the mechanical suppressors.The naturally aspirated, coannular (NACA) nozzle is a high-radius-ratio plug nozzle system incor-
porating a crossover duct, which allows ambient (secondary) air to cross inside the primary streamand be aspirated through the inner annulus of the coannular nozzle. The aspirated ambient flow is
intended to provide rapid mixing on the inner boundary of the outer annulus primary stream to reduce
the jet noise. The NACA nozzle has been shown to provide significant aspiration of free stream air
with small performance penalties at takeoff conditions. A noise test of a generically similar nozzle
37

[ Outer stream _
Pneumaticoscl
Acoustic Lining Suppressor
Ejector
I P_" Primary _ . /
Subsonic cruise/takeoff
Inverted Velocity Profile Ejector
Supersonic cruise mode
Variable flapC /aKeorr mooe
Observer Shield stream (hightemperature, low velocity}
Thermal Acoustic Shield Turbine-Bypass Engine With NACA Nozzle
Figure 3-6. Jet Noise Reduction Concepts5-UgOO27RS-37
38

25
• Noise reduction versus performance loss
• Flight: 400 ft/s
Noise reduction
PNdB (flight)
_-_ 20--shallow chute _ _PNL _.t
20 L "X_ treated ejector _'_X_ _Cfg ....
__-- 57--tube wlth
_treated ejector
_ _-32--chute f _PNL _...
1_- \\ \ _ ..... _ 1,of_=':'_D.._ 104-20--shallow_ _ _"1-/ 40--shall°w _ _ tube
chute-_ "%'_ chute--7 \ / with
" yPlug _ / _-- 36--chute
z,o7 o- nozz,.
o _ I I I I I I i I I0 2 4 6 8 10 12 14 16 18
Thrust loss, %
Figure 3-7. Jet No/se Suppress�on Thrust Pena/ties3-U90027-38
showed significant noise reduction (7.3 dB relative to a reference plug nozzle). Consequently, it is be-
lieved that the NACA nozzle offers good potential for jet noise reduction with small thrust penalties.A NACA nozzle design for the P&W TBE engine is shown in the noise-abatement mode in figure
3-8. The turbine-bypass air is used to drive ejectors in the crossover duct to enhance the secondary
flow rate. This is included because noise attenuation can be enhanced by higher secondary flow rates.In cruise mode, some secondary flow may be used to fill the jet area to reduce nozzle boattail drag
during transonic climb. The plug doors are used as blocker doors for thrust reverse mode; cowl sleeve
translation exposes the reverser cascades. An estimate of the NACA nozzle noise reduction and sec-
ondary flow performance is presented in figure 3-9.P&W provided their Mach 2.4 engine performance estimates based on two performance levels:
an unsuppressed nozzle, and a mechanical chute-tube suppressor. Because data were unavailable on
t--" Secondary air
_ _ doors (open)/-- Ejector air on
// (turbine bypass) f Plug doors (open)
L- L,... _ L==[ "_''"_ C:h:::_ ar
Figure 3-8. Natura/ly Aspirated, Coannu/ar (NACA) Nozzle Configured in the Noise Abatement Mode3-ugoo27.-3g
39

-4 1 _ Naturally aspirated
-6 -- "_. Initial /_ Turbine
Jet noise _ NACA / bypass
reduction, -8--A EPNdB __. /injector
-1 o -- -_,-.,=--,,,--,,,_._. _L..........
mini,=,,,_, ,urn,l,
-12 -- • Turbojet engine "" ._ ..
• Boeing NACA nozzle
-14 -- • No shock cell noise
-is I I I I 1 I I0 10 20 30 40 50 60 70 80
Ejector-Induced flow,%
Engine flow
Figure 3-9. NACA Nozz/e Suppression Estimates3-U90027-40
NACA nozzle performance at conditions other than takeoff, it was assumed that the NACA nozzle
could be installed on the P&W TBE engines (Mach 2.4 and Mach 2.8) for the same performance penal-ties as the quoted P&W unsuppressed nozzle penalties. The unsuppressed data were used becauseperformance testing at takeoff showed minimal performance losses for the NACA nozzle. The NACA
nozzle weight is 90% heavier than the P&W unsuppressed nozzle (4,320 lb for the NACA nozzle versus
2,275 lb for the P&W nozzle for the same engine airflow size). Both nozzle weights include an estimatefor the thrust-reverser weight.
GE provided a suppressor nozzle similar to the NACA nozzle with their Mach 2.4 and Mach 3.2
engines (fig. 3-1(a)). It is an inverted velocity profile nozzle that ducts the fan air across the primary
stream to provide the enhanced mixing. The GE nozzle also employs mechanical chutes to further en-
hance the mixing of the streams, followed by a treated ejector. The GE nozzle performance and noisereduction levels were used directly in the engine thrust and noise calculations.
GE and P&W provided pertinent turbomachinery definitions to estimate noise for the Mach 2.4,
Mach 2.8, and Mach 3.2 engine concepts. Compressor and/or fan rotor-stator blade counts, rotation
speeds, and axial spacings were obtained as were the turbine rotor-stator spacings and blade counts.Combustor-generated noise, or core noise, was estimated for several programs and verified by meas-
ured levels on a PW4000 engine.
There are two major influences that drive an HSCT engine configuration: the compromise between
subsonic and supersonic performance as discussed in section 3.1, and jet noise suppression. Effectivejet noise suppression is an integral part of the propulsion system for an HSCT. The NACA nozzle
concept would require considerable development, however, to confirm its performance and qualify
it for use on a commercial airplane. This is an area where much further research and development
is needed, in which NASA could play a leading role.
3.4 EMISSION REDUCTION CONCEPTS
The emissions goal for the HSCT engine is to have no significant impact on the ozone layer. Assess-
ing the level of engine emissions is a key study area. The effect of these emissions on the ozone layer
will be determined by other NASA contractors. The peak concentration of ozone in the upper atmo-
sphere is in the cruise altitude range of the Mach 2.4 to Mach 4.0 airplanes. The most significant
40

offending emissions are believed to be NOx, but, because all of the emission radicals are competingin the reaction chain, all emissions must be evaluated. While the level of engine emissions needed to
meet the goal is currently unknown, it is believed that the current conventional combustor designs,
operating at year 2000 technology temperatures, may need improvement. The engine manufacturers
conducted studies of derated engine cycles and innovative combustor concepts to reduce emissions
from the Mach 2.4 engine. Both engine manufacturers judged that the innovative combuster conceptswould need an aggressive research and development program and that there would be high risks on
the road to achieving the emission goal.Table 3-4 presents the results of the derated engine cycle for the P&W Mach 2.4 TBE. This shows
that a moderate reduction in cruise NOx emissions can be obtained, but only with significant perform-
ance penalties. For example, a 41% reduction in cruise NOx emissions was predicted at a reducedcombustor inlet temperature (TI'3) of 170°F; however, TSFC penalties of 4% at supersonic cruise and
6.9% at subsonic cruise are incurred. Similarly, for a reduction in both combustor inlet and outlettemperatures (TT3 and TI'4) of 170°F and 300°F, respectively, a 45% reduction in cruise NOx is pre-dicted, but with a 11.8% takeoff thrust penalty. For both of these cases, the reduction in the NOx emis-
sions was accompanied by a corresponding increase in the carbon monoxide emissions, particularly
at the subsonic cruise conditions. The performance penalties of these engines would result in a signifi-cantly heavier gross weight airplane using more fuel at cruise, which would partially offset the effect
of the reduction in the NOx emissions index (pounds emission per 1,000 lb fuel).To reduce the NOx emissions further, both P&W and GE have identified combustor concepts that
they believe have the potential to achieve a cruise NOx emissions index level of 5 to 10 rather than
the 32 predicted for conventional combustor design. Development and validation of the innovativecombuster concepts will require a significant commitment to an aggressive research effort. Table 3-5
presents the incremental changes in performance and the NOx emission index reduction levels of threeP&W innovative combustor concepts when compared with the baseline conventional concept. These
concepts, which have varying degrees of complexity and development risk, have NOx emission index
reductions of 30% to 84% with only small, and generally favorable effects on engine performance.Figures 3-10 through 3-13 present sketches of these combustor configurations. Figure 3-10 presents
the P&W current technology baseline combustor. Figure 3-11 presents the staged-lean (SL) combustor
that has the potential for a 30% reduction in cruise NOx emission index from 32.1 to 22.6. Figure 3-12presents the rich-burn, quick-quench (RBQQ) combustor that has the potential for a 75% reduction
in cruise NOx index from 32.1 to 8.0. Figure 3-13 presents the lean premixed, and prevaporized (LPP)
Table 3-4. Pratt & Whitney Mach 2,4 TBE Emission Indexesend Performance for Dereted Engine Cycles
ConditionsBaseline 630
Ibis engine
Performance deltas
ReducedTT3, %
ReducedTT4, %
Fn, SLS takeoff 52730 -12.6 -0.8 -11.8
Fn, Math 0.9, 36089' 18850 -13.4 -0.2 -12.5TSFC 1.12 -4.5 +6.9 +1.6
Fn, Mach 2.4, 65,000' 14120 -21 +10 -9.6TSFC 1.307 -2.2 +4 +0.4
Subsonic emissionsMach 0.9, 36089'
NO x 7.0 +6 -37 -36CO + THC 13.5 -20 +122 +102
Supersonic ernlsslonsMach2.4, 65,000'NO x 32.1 -8 -41 -45CO + THC 1.3 0 +46 +43
Reduced TT3and TT4, %
3-u90027--41a
41

Table 3-5. Pratt & Whitney Mach 2.4 TBE Emission Indexesand Performance for Innovative Combustors
Baseline 630 Performance deltasCondition
Ib/s engine SL RBQQ LPP
Fn, SLS takeoff 52730 0% 0% 0%
Fn, Mach 0.9, 36089' 18850 0% +0.4% +0.4%TSFC 1.12 -0.11% -0.62% -0.06%
"-Fn, Mach 2.4, 65,000' 14120 0% +0.4% +0.4%TSFC 1.307 +0.05 % -0.39% -0.34 %Emissions, subsonicMach 0.9, 36089'NOxlndex 7.0 (base) 9.2 (+31%) 2.9 (-59%) 1.5 (-79%)CO index 13.4 (base) 5.2 (-61%) 2.0 (-85%) 20.0 (+49%)THC Index 0.1 (base) 0.9 (+800%) 0.5 (+400%} 2.0 (+1900%)Emissions, supersonicMach2.4, 65,000'NOxlndex 32.1 (base) 22.6 (-30%) 8.0 (-75%) 5.0 (-84%)CO index 1.2 (base) 3.6 (+200%) 1.5 (+25%) 3.0 (+150%)THC index 0.1 (base) 0.1 (0%) 0.1 (0%) 0.3 (+200%)
3-U00027-42
Figure 3- I0.
/Fuel Injectors (24)
Pratt & Whitney Current Technology Baseline Combustor
3-UgOO27R 1-43
combustor that has the potential for an 84% reduction in cruise NOx emission index from 32.1 to 5.0.Table 3-6 presents the engine weight and dimension penalties, relative to the baseline current technol-ogy combustor, for the three concepts. The additional engine length results in an increased nacelleweight, and both result in an increase in the associated aircraft structural weight. As figures 3-12 and3-13 demonstrate, the RBQQ and LPP combustors both require complex variable geometry to controlthe combustor airflow.
The GE innovative combustor was an LPP concept, and had the potential for a 61% reductionin cruise NOx emission index from a baseline of 31 to 9. GE reported that there would be negligible
weight and performance effects, but that it would be a high-risk development program with potentialbarriers to success being premixing duct flashback and auto-ignition; these potential problems are
applicable to the P&W LPP concept as well.The GE current technology baseline combustor is not pictured here, but is similar to the P&W
version shown in figure 3-10. Figure 3-14 presents GE's version of an LPP combustor that has the po-tendai for achieving the NOx emission index of 9. This concept does not have the complexity of variable
42

Secondary outer airflowIgnitor axial swlrler assembly
Floating nozzle guideCore airflow radial inflow swlrler assembly
Figure 3-11. Pratt & Whitney Staged-Lean Combustor 3-u90027R 1-44
45 deg (typical)
(125 places)
/ VlewA1ADQuenchSl°ts .- .
(typical)45 deg
(155 places)
View B 0D Slots
Figure 3-12. Pratt & Whitney Rich-Burn, Quick-Quench Combustor
3-Ug0027R1-46
43

I
Figure 3-13.
Holes (typical)
(48
Butterfly valve In
closed positionB
Pratt & Whitney Lean, Premlxed, and Prevaporlzed Combustor
Table 3-6.
3-Ug0027R 1-45
Pratt & Whitney Low-Emission Combustor Concepts: Engine Weight and DimensionPenalties Relative to Current Combustor Technology (for 630-ibis Engine)
Increased cornbuster Increased engine Increased bareCombustor concepts dlarneter, In length, In engine weight, Ib
i i ,ll ,=rm iml,_rF rlrl
Staged-lean +2.6 0 +760
Rich-burn, qulck-quench +2.6 +6 +570
Lean prernlxed, prevaporlzed +2.6 +8 +1,260
3-ugoo27-47
geometry for controlling combustor air. The impact of these various combustor concepts on the air-
plane maximum takeoff weight (MTOW) are reported in section 5.1, "Emission Reduction Impact."The results of the upper atmosphere ozone studies conducted by NASA should indicate the neces-
sary NOx emission index level to ensure that there is no significant impact on the ozone layer. The
significance of any impact will be determined by the environmental community and the responsible
regulating agency.
3.5 FUELS TECHNOLOGY
The fuel study objectives were to identify and evaluate production, cost, fuel properties, and other
nonaircraft system-related factors that would affect the use of both conventional and unconventional
fuels in high-speed commercial transports. The fuels examined included modified conventional, endo-thermic, cryogenic, and others such as slushes and gels. The studies emphasized--
a. The availability and costs associated with modified conventional fuels, referred to as thermally
stable jet fuels (TSJF).1. TSJF + 0 means that a fuel passed the American Society for Testing and Materials (ASTM)
Jet A Jet Fuel Thermal Oxidation Tester (JFTOT) minimum of 245°C (473°F).
2. TSJF + 50 (or + x) means that the fuel passed the JFTOT > 50°F (or + > °x) higher than
245°C (>__523°F).3. The 260°C International Air Transport Association (IATA) Jet A-1 minimum JFTOT --- TSJF
+ 270E
b. Liquid methane costs (liquid methane is assumed to be the same as purified liquefied natural gas
(LNG)).c. On-airport costs for both conventional fuels and liquid methane.
44

I
Figure 3-14. General Electric Lean, Premixed, and Prevaporized Combustor3-Ug0027R 1--48
From an economic and handling standpoint, the ideal fuel for a high-speed transport is the kero-
sene fuel used by currently operating commercial aircraft. The thermal stability of this fuel, as definedby existing commercial aircraft specifications, is marginal even for the operating conditions of today'sadvanced subsonic commercial aircraft. However, most jet fuel deliveries exceed the minimum ther-
mal-stability requirement. In fact, test data for samples of jet fuels delivered to airports throughoutthe world show that over 70% of these airports currently receive fuels that satisfy a stability require-
ment 50°F above the jet fuel specification minimum (fig. 3-15). This 50°F improvement (TSJF+ 50)
is expected to satisfy the thermal-stability requirement of aircraft to at least the Mach 2.8 cruise level.The cost of fuel is composed of all direct and indirect charges to the seller. Jet fuel price is con-
trolled by supply and demand, competition, and Government policy, as well as costs. Airlines are inter-
ested in the price rather than the cost of jet fuel. In recent history, the price of jet fuel, as well as most
other petroleum products, has been considerably higher than cost (fig. 3-16). Essentially, the price of
petroleum-based fuels is driven by supply and demand. Any petroleum refining cost differences result-ing from minor jet fuel property changes dictated by the HSCT are likely to be overwhelmed by price
changes generated by competition. Even if an added cost has been overlooked in estimating the
requirements for developing a supply of TSJF + 50 fuel, such a cost will certainly be lost in the market-
place price variations.Eight percent of the fuel samples from commercial airports were found to be thermally stable be-
yond the limit that can be established using standard test techniques (higher than TSJF + 150). These
fuels maintain their high thermal stability from the refinery to the aircraft without special handlingor additives and may even be as stable as natural gas or commercial-grade methane. Because these
45

o F
150
110
100
90
80
7O
6O
5O
40
27
I
.......... ._,1 I___:i'"_,_'_'i_:"_.__. ":.._.$_: _$" ._. ..
0 2O
Figure 3-15.
I I I 1
4O 60 80
Thermally Stable Jet Fuels, %
Thermal Stability of Currently Delivered Fuels
100
5-ugoo27R2-49
Price/cost ofFuel1987
$/gal
1.50
1.00
0.50 --
Price of jet
International
II Cost of Jet fuel II II I
I I I0.001970 75 80 85 90
Year
Figure 3-16. Cost Versus Price of Jet Fuel5-UgOO27R2-50
fuels can be duplicated using available process equipment and techniques, the costs have been estab-lished. The portion of these costs that would be directly chargeable to jet fuel has not been determined,
but would be considerably less than the 10¢/gal recently estimated for hydrotreating distillate fuels.
Additionally, Boeing test data indicate that fuels with very high thermal stabilities maintain their sta-
bility without costly special handling during transfer and storage as long as they still satisfy currentjet fuel purchase specifications.
More fuel property data and improved test techniques are required before a practical upper limitfor the thermal stability of conventional fuels can be established. Current thermal stability test meth-
ods are adequate for the gross screening of fuels, but do not allow a direct correlation between test
results and aircraft-engine requirements. Aircraft-engine fuel system simulations are needed to ensure
that a fuel selected for use in an HSCT behaves as predicted. This is particularly important if the re-
quired stability limits are increased significantly beyond today's limits, such as for use in a Mach 2.8 +aircraft.
46

In paststudies,availabledataindicatedthat increased thermal stability would require the accept-ance of fuels with other less desirable properties, such as low density and high vapor pressure. This
study demonstrated that there is no correlation between these properties and thermal stability. Forexample, the densities of fuel samples that satisfied a higher than TSJF + 100 requirement were withinthe normal scatter obtained with currently delivered jet fuels (Jet A and Jet A-I) (fig. 3-17).
New materials in HSCT aircraft and new processes producing jet fuel in modern refineries may
bring the fuels into contact with catalytically active metals. Fuel analyses for extremely low (part perbillion) levels of these metals will be required to ensure only an allowable level of trace contaminants
in engine emissions if these metals are shown to impact the ozone layer.
The petroleum product market is shifting away from residual fuel oils to diesel (distillates) andchemical feedstocks (other) (fig. 3-18). The ability to satisfy this shift using a wide variety of crude oilsand environmental considerations has resulted in a worldwide trend to increasingly sophisticated and
operationally flexible refineries. This sophistication, and the fact that fuels currently delivered to most
Density,
Ib/gal
I I I I6.0
50 60 70 80 90
Temperature, OF
Figure 3-17. Density of High-Therma/-Stabi/ity Fue/s
100
4-ug0027R2-51
Year
1985
Year
2000
Legend:
U.S.A. Canada Europe Japan
[] Gasoline m Jet [] Distillate I Residual [] Other
Figure 3-18. Worldwide Fuel Type Demand Change3-U90027-52
47

-ql__
airports are more thermally stable than required by subsonic aircraft, indicate that property changes
required for low Mach number high-speed transports could be made with little impact on fuel priceor availability. However, regardless of properties, an increase in jet fuel demand precipitated by the
introduction of an HSCT must be anticipated in advance to ensure that entry-year fuel demand can
be satisfied at a reasonable price. Therefore, it is recommended that now is the time to stimulate fuelsupplier interest in the increased market potential for jet fuel that would be created by an HSCT.
Heat-sink requirements for engine, airframe, and mechanical systems have often led to the conclu-
sion that cryogenic fuels, particularly hydrogen, were required for supersonic aircraft. The cooling re-quirements for the aircraft structure and engine inlet of these aircraft are strongly driven by Mach
number. However, the fuel flow required by HSCT engines drops considerably during the descentphase of the mission. This results in a mismatch between the fuel required as a coolant and fuel needed
for propulsion as indicated in figure 3-19. Therefore, in cases where the cooling capability of the
cryogen cannot be used, the reason for choosing such a fuel must be based on other considerations,such as thermal stability, burning characteristics, and cost. Cost is the most significant factor belowMach 3.8.
The production methods and costs of cryogenic fuels (liquid hydrogen and methane) for commer-
cial aircraft have been developed and updated as part of continuing Boeing fuel studies. This workresulted in the conclusion that cryogenic fuel costs were sensitive to demand as well as the cost of avail-
able energy (or raw material) as demonstrated by the cost sensitivities for liquid hydrogen (fig. 3-20).
The cost of cryogenic fuels escalates quickly at very low production quantities as shown in figure3-21. Areas of the world that could support only a few flights per day would need other cryogenic fuelusers to obtain an economy of scale benefit.
An important difference between the design and cost of cryogenic versus conventional fuel systemsis that, for cryogenic systems, sizing and cost are strongly influenced by losses of vaporized liquid fuel.
The design of a ground system is impacted by losses; the entire system must not only accommodate
the maximum required block fuel, but liquid to replace fuel vaporized in the storage and distributionsystem as well as the aircraft. Additionally, the design of the ground system must include a system
to safely collect and recover vaporized cryogen. The cost of vaporized cryogen must be accounted foras an added fuel cost. In some cases, this gas can be sold or used in ground equipment, and some of
the fuel cost can be recovered. However, the vent gases must be pressurized for storage and delivered
to a duty cycle and pressure level that will satisfy requirements of some, yet to be identified, user.
Math
number
and fuel
flow Mach Fuel flow
number required by
engines
Flight time
Figure 3-19. Typical Flight Profile
iI
4-UgOO27R2-53
48

Liquidhydrogen,S/equivalentgal of Jet A
Hydrogen 1,000production,tons/day
Figure 3-20.
2
2,000
L/quid Hydrogen Cost Senslt/vitles
Power cost,¢/kW hr
5-ug0027R2-54
Cost,$/gal
2 m
m
O,
0
1 flight/day Mach 10.0concept
1 flight/day Mach 4.5 concept
I I I I I I200,000 400,000 600,000
Gal/day
F/gum 3-21. Cryogenic Fuel Costs--Equ/va/ent Jet A
I I800,000
5-Ug0027R2-55
49

Cryogenic fuel losses, hence the cost and sizing of airport gas recovery systems, are directly in-
fluenced by aircraft duty cycle, as indicated in figure 3-22. In addition to airport-to-airport variations
in losses resulting from differences in duty cycles, losses are affected by aircraft venting and detankingrequirements. The design of a methane-fueled HSCT aircraft was not sufficiently advanced to deter-
mine its contribution to losses during this study. Methane losses, along with gas duty-cycle variationsshown in this report, are minimal.
A key consideration in the design of cryogenic systems is the trade between the cost of thermal
protection and the cost of losses. In the idealized cases shown in figure 3-23, a comparison betweenexpensive vacuum-jacketed insulations and less expensive nonvacuum solid insulations showed rela-
tively small differences in calculations. Even when different levels of liquid methane cost and typesof financing methods were considered, no clear choice between thermal protection systems was found.
However, results of this type of comparison are misleading in that vented gases are a direct
out-of-pocket cost to the airlines, while capital costs may be wholly or partially paid by municipalitiesor governments. In this respect, the trade is forced towards the minimization of losses.
The conversion of an airport for the use of liquid hydrogen would require the use ofvacuum-insulated transfer lines and support equipment unless significant advances are made in solid-
insulation technology. The cost of this conversion would be higher for hydrogen than for methane, asshown in figure 3-24.
The per unit (equivalent gallon) capital costs for fuels in this and most other studies is based on
100% customer use of facilities. Unless there is a ready market for this fuel during slack periods, there
will be a significant price penalty per gallon. No such markets have been identified for liquid methane.
The facilities for conventional jet fuel, however, can be used to produce diesel or heating oil.
It was determined that all participants in an HSCT study should use the same reference pricesand price ranges for thermally stable conventional fuels and liquid methane. Early study results wereused as support data to establish the prices and ranges shown in table 3-7. Later in the program it
was found that the penalties assessed to TSJF are unreasonably high and should be adjusted in futureaircraft studies.
1,000
80O0LL
r,,O
0oo
600
o;
o400
0C
I_ 200
Vacuum Jacketed --
2 4 6 8 10 Noon 14 16 18 20 22 24
Time
Figure 3-22.
7,000
5,000
3,000
1,000
The Influence of Aircraft Duty Cycle on Airport Losses--Los Angeles International
Airport Projection 3-Ug0027R1--56
"6
E
O"
UJ
50

F
2O
Methane 18
equipment 16and losses,
A c/equivalent 14gal of Jet A
12
10
8
6
4
2
0
Figure 3-23.
65O
m
m
,wl*,lll ,, ,_11,-,ill'
i _._. 'dlV"dll""lll"'dll,lllV'._lpl".,iIp",=tll
.dlI" .iXr .riP".1111
,dl_',lillr.,ilp",jIIq
,dI_",l[ll".,il[l'*,_il_
_._, 'dl".'IP".'iiP'.'_lll,dl_",ipg'.,liIP',_lll..... ........ • =............ . ,., J.,
100
Vacuum
Legend:Losses
LoadingDistribution and conditioning
Capital recoveryCommerclalPublic and utility
Liquid methane
Storage
Nonvacuum _ ;
:_:_:_:_:_:_:_
_'%_\ ii_I FI il_P'i_I_" il_ lI _ _ _
,_lW_i_l*'._l_p"d_ii _-_ _._._ I,11_'.dll".11111".111_'I
.,r" J ._r" .,," _._ ,,,li,,[dill,,i,_ii_,j,!
%_ ,Ifll'il,illi'ii,,lll"i,il li"
.'#'=!=:'_:;''l_' • _ _ _ %%_ .,,_'.,,,".,," ,,r,'
58 100 58
price, C/equivalent gal of Jet A
Liquid Methane Airport Costs--Sample Projections for Los Angeles International Airport5-ug0027R2-57
Cost,¢ Igal
4O
3O
2O
10
Buenos Aires
L_____0
\ Los Angeles
1 2
Figure 3-24.
3 4
Gal/day, millions
Airport Conversion Cost Comparison
Tokyo
Hydrogen
Methane
5 6
3-Ug0027R1-58
3.6 CONCLUSIONS
Engine performance parameters were received from three engine manufacturers for evaluation ofaircraft in the speed range Mach 2.4 through Mach 10.0. Uninstalled net thrust and TSFC predictions
from the engine companies were corrected to account for inlet bleed drag and nozzle boattail drags.
Bare engine plus nozzle weights for each engine were received. A preliminary propulsion pod wasconfigured to minimize installation interference effects. The results of these studies were incorporated
into the overall vehicle performance assessment.
From these studies, the following conclusions can be drawn:
a. There is nothing inherent in the conventional-fueled engine concepts that would prevent them be-ing developed for the year 2000 with current and projected available technologies. Consequently,
decisions relative to the merits of individual conventional-fueled aircraft configurations do not
51

Table 3-7. Study Fuel Prices
Fuels
Jet A
Thermally stable jet fuelTSJF + 50
TSJF + 100
TSJF + 150
Liquid methane
Demand tons/day
>7,000
2,000
5OO
Price of equivalent gallons of Jet A
02/04/88 (to airplane)
Range, $
0.50to0.75
0.50 to 0.85
0.60 to 0.95
0.70 to 1.10
0.50to 1.00
Reference, ¢
6O
62
71
92.5
68
73
83
5-UO0027R2-59
hinge on propulsion issues alone. Technical risks increase with increasing Mach number for the
conventional-fueled engine concepts.
b. None of the cryogenic concepts have been used, to date, for commercial aircraft. As a result, no
commercial experience exists. At this time, sustained scramjet propulsion has yet to be accom-
plished even in a laboratory. Consequently, significant research is required before attempting to
develop a cryogenic-fueled engine.
c. Engine weight and TSFC are significant contributors to vehicle weight.
d. Conventional-fueled engines produce higher TSFC to achieve the same level of thrust minus drag
for increasing vehicle Mach number.
e. Year 2015 technology represents a significant decrease in engine weight and TSFC compared to
year 2000 technology (3% to 8% in TSFC and 15% to 26% in weight).
f. Cycle selection studies are required to obtain optimum performance for any cruise Mach number
aircraft.
g. Vigorous research and development programs are needed, especially in the area of noise suppres-
sion and low-emissions combustors.
h. Operation out of conventional airports was found to be a requirement for achieving adequate
HSCT utilization.
i. Because of the airport requirement, a viable HSCT must produce noise levels no higher than its
subsonic competition.
j. Studies show that with projected suppression technology, achievement of FAR36 Stage 3 noise lev-
els is possible.k. The HSCT emissions goal is to have no significant impact on the ozone layer. While the level of
engine emissions needed to meet this goal is currently unknown, reduced emission combustors and
the effects of derating the engine cycle were studied. Derating the engine cycle resulted in signifi-
cant performance penalties (reduced thrust, increased TSFC and engine weight). The most innova-
tive combustor concept, and the one with the highest risk, was predicted to reduce NOx emmissions
from 30 to 5 Ib/1000 lb fuel.
The objective of the fuels evaluation was to identify and evaluate production, cost, property, and
other nonaircraft system-related factors that would affect the use of unconventional fuels in high-speed
commercial transports. The fuels studied included modified conventional, endothermic, cryogenic,
and others such as slushes and gels. The evaluation showed that--
a. Conventional kerosene-based jet fuels that can satisfy the requirements of up to Mach 2.8 aircraft
are likely to be available for use in both subsonic and HSCT aircraft at no price penalty.
b. The thermal stability of conventional fuels may be as good as that for liquefied natural gas.
c. No realistic scenario could be developed that would lead to the conclusion that a cryogenic fuel
could be price competitive with kerosene fuels on an equivalent-energy-loaded-on-aircraft basis.
52

4.0 VEHICLE DEVELOPMENT
The overall objective of this task was to evaluate the effects of technology advances on the viability
of the high-speed civil transport (HSCT). Information ranging from improvements in today's technolo-gy to that associated with the National Aero-Space Plane (NASP) were investigated. Design Mach
numbers from 2.0 to 25.0 were evaluated, design ranges from transatlantic to transpacific considered,
and both conventional and unconventional fuels were analyzed (fig. 4-1).The scope of systems technology applied to the study was to identify those systems characteristics
that were configuration drivers and to evaluate those characteristics only to the extent necessary to
validate configuration viability.
The large range of design cruise speeds, fuel types, and technology levels offered a wide varietyof aircraft design possibilities. It was necessary to evaluate the many possible design combinations,
screen out nonpromising concepts, and focus on the greatest potential payoffs. The approach taken
was to first make technology projections for years 2000 and 2015 certification (to bracket NASP tech-
nology). These projections were used to determine design Mach regions corresponding to the projectedlimits in technology.
Twenty-one preliminary concepts were developed through risk-benefit analyses to enable selectionof the most promising concepts in those Mach regions. This was then narrowed to six concepts, whichwere developed and analyzed. The results led to a discontinuation of work on the Mach 6.0 and Mach
10.0 cryogenically fueled airplanes. Further development and assessment of the remaining concepts
led to discontinuing work on the remaining cryogenically fueled Mach 4.5 airplane. Finally, a moredetailed assessment of the configurations designed for Mach 2.4, Mach 2.8, and Mach 3.2 led to theconclusion that the lowest Mach number demonstrated the most benefit and least risk. The results
showed that even at Mach 2.4 substantial technology improvements are required for a technically vi-able HSCT for year 2000 certification. The Mach 2.4 configuration was, therefore, selected for assess-
ment of the impact of meeting environmental goals. This overall study flow is illustrated in figure 4-2.
Mach
Supersonic Hypersonic
Mission Transport Transport
Fuel Conventional Cryogenic
Certification date 2000 to 2005 2015 to 2025
NASA contract
Phase I q[ Mach 2.4 to 10
2.4 to5Phase II 9 I_
2.4 to 3.2Phase III _ _.-
Figure 4-1. HSCT Activities3-UgOQ27R1-80
53

J Technology projections
IJ Design Mach regions
4rI Concept screening
Configurations 21
Aero
PropStructures/materialsFuelsSystems
3.24.06.08.08.0+
Year 2000
Year 2015
5 regions
Configuration development Environment -_assessment
_ 6 _ 4 _ 3 ==-=,---,,,,=,_I
prom'= I
Mach = 2.4 (3)
3.2 (2) Risk and3.8 (8) benefit
analyses4.5 (4)6.0 (2)
10.0 (2)
2.4 2.42.8
3.2 3.23.8
4.5 4.56.0
10.0
2.42.83.2
D
2.4
L_J
Figure 4-2. Technology Assessment and Configuration Development3-Ug0027R1-81
4.1 TECHNOLOGY PROJECTIONS AND DESIGN OPTIONS
T,vo technology windows that represent different airplane certification dates were selected. A year
2000 window provides an attractive commercial timing date, and precedes the application of newly
developed NASP technology.The second selected window, year 2015, would allow commercial use of technology developed in
support of the NASP program. This would be appropriate for a second generation of HSCTs. Thecorresponding technology readiness dates are 5 years before the certification windows. Aggressive
technology development programs will be required to provide a state of readiness for civil applications.A technology projection chart was developed to display the options in technology as a function of both
time and Mach number range (fig. 4-3).
The design Mach number band of 2.0 to 25.0 was divided into five discrete regions whose upperlimits correspond to projected limits for application of specific technologies or for major configuration
design options. The five regions (table 4-1) are--a. Region 1. Mach 3.2 is near the projected upper limit of using wing-integral fuel tanks for the cruise
fuel. This will require extensive development of fuels with higher thermal stability and fuel tank
designs with low thermal conductivity.
b. Region 2. Mach 4.0 is near the projected upper limit for conventional turbojet-fan engine cyclesand for thermally stable jet fuel (TSJF) use. This is also considered to be the upper limit for a year
2000 HSCT because of very high technology risks and formidable design complexities that wouldneed to be addressed in this relatively short development time period. For the year 2015, the contin-
ued technology development programs would provide more efficient configurations for Mach num-
bers up to Mach 4.0 (i.e., regions 1 and 2). In addition, the more advanced technology would open
up design options for even higher Mach numbers.c. Region 3. Above Mach 4.0, it is projected that cryogenic or endothermic fuels would be required to
satisfy heat sink demands. Mach 6.0 is near the upper projected limit for liquid methane, endother-
mic fuels, and the ramjet as the cruise propulsion system.
54

• Cruise cycle
• Turbojet/fan
• Air turbojet/fan
• Turbojet/ramjet
• Turbojet/ramjet / scramjet
• Turbojet�ramjet/rocket
• Fuel
• Petroleum --VVlng tanks
--Body tanks• Endothermlo fuel
• Liquid methane
• LH_
• Aluminum
• Aluminum MMC
• Titanium
• RSR titanium
• Titanium MMC
• Polymeric composites
• Advanced MMC
• Transparencies
• Insulation
• High temperatures
• Cryo.g.enic• Sealants
• Seals
• Airframe
• Cryogenic
• Trlbology• Bearings
• Lubricants
• Finishes
• Configuration cooling
• People and equipment
• Propulsion system
•Wlng leading edge
• Wing surface
• Body
• Electric power
• Turbojet accessibility• Gear box
• Cooled ram air APU
• LH2 + LO2--APU--Fuel cell
• Aero: wing• Arrow
• Delta
• Wave rider (caret wings)
• Lifting body
I I I I I
III I Ii I u u iI I I I I
' L',,,:",,_',,,'_,J_,_',,/',,,."4 I II i , I I
I tI II II I
I I I I
Polymeric I I I
ij ,',, '',,.'_",,,"h,',,I"',C",_"_'1. I
I I I I
II
Metalllc/ceraml
1I
? I Requirements determined by
7, .4., ,,I,,,,, ,, _ design, ,_,,, ,,, ,,, ,,, ,,,,,_,,_,,, ,,, ,, Requirements determined by material' " " i ....... - I' chosen
I I 1 , ,
I I __, _,_,_, .,_ ',. ,',,
I I I _, _,_",_ \_,_,_',I I I ,,:.,:,_>,,,,._..,:,,..,_,,...,:_<.,,:,,,...,-,<,,..,,:,,,,I I I II I I I 't ''''_°'J`'_'_''''°_:':'':'_':''_'_'_`_'J_'=_'=_J'I I I I II I I I I
,II -i i i II I II I II I II I I I I
Legend:Certification date: 2000
I Certification date: 2015
2.0 3.0 4,0 6.0 8.0
Mach number
Figure 4-3. Technology Projections
25.
3-Ug0027R2-82
55

Table 4-1. Design Mach Number Selections
Regioni
Mach range
2.0 to 3.23.2 to 4.0
4.0 to 6.0
6.0 to 8.0
8.0 to 25.0
Year of certification
2OOO
2000
2015
2015
2015
Limitation
Thermally stable Jet fuel in wing tank
Thermally stable Jet fuel
Turbofan/turbojet
Endothermlc fuel
Liquid CH4
RamjetUncooled structural materials
d.
e.
4.2
4-U90027R2-109
Region 4. Mach 8.0 is near the projected upper limit for uncooled structural materials. However, atMach numbers below this limit, areas such as the wing leading edges or nacelle inlets may require
various amounts of localized active cooling.
Region 5. At Mach numbers above 8.0, active cooling of structural materials is projected.
CONCEPT SCREENING
Twenty-one configuration definitions were developed to explore various major design options
applicable in regions 1 through 5. Figure 4-4 illustrates, as an example, the use of the technology projec-tion chart to determine the design options available in the range from Mach 4.0 to Mach 6.0. Possible
design options for this Mach range are listed in the far right column of the figure.
The design options investigated to narrow down the field of candidate configurations and the scope
of Mach number regions are as follows:a. Wing planform variations (delta, arrow, variable sweep, and caret wings).
b. Different fuels (liquid hydrogen, liquid methane, and conventional fuels).c. Different passenger, fuel tank, and body arrangements. The relative locations of fuel tanks and
passengers become increasingly difficult to place with the large volume requirements and safety
considerations associated with cryogenic fuels.d. Different engine cycles (turbojet, ramjet, scramjet).
e. Different propulsion pod arrangements (single, dual, integrated).
All of the prelimifiary configurations were designed for a maximum takeoff weight (MTOW) of
750,000 lb and 250 passengers. The configurations designed for cruise Mach numbers up to and includ-
ing Mach 6.0 incorporated features to enable operation from conventional airports. Configurations
for Mach numbers greater than Mach 6.0 were designed for dedicated superhub airport operation
because the compromises necessary for reducing takeoff and landing distances would have been
prohibitive.A concept screening process was developed to screen the candidate configurations for technical
feasibility, airport compatibility, and economics. This was done using an evaluation of their risks ver-sus benefits.
The objectives of the screening process were threefold:
a. Select configuration concepts for further study.
b. Identify the most critical technology and design areas.
c. Identify focus areas for technology development activities.
Table 4-2 summarizes the criteria used in the risk-benefit analysis. Each facet of the design was
graded on a number system to evaluate its value in meeting the criteria. This screening index is summa-rized in figure 4-5. As an illustration, figure 4-6 provides the results of this screening method applied
to a wing planform study for a Mach 2.4 configuration.
56

• Cruise cycle
• Turbojet/fan
• Air turboJetramJet
• Turbojet/ramjet
• Turbojetlramjetlscramjet
• Turbojet/ramjet/rocket
• Fuel
• Petroleum --Wing tanks--Body tanks
• Endothermlc fuel
• Liquid methane
• LH2
• Aluminum
• Aluminum MMC• Titanium
• RSR titanium
• Titanium MMC
• Polymeric composites• Advanced MMC
• Transparencies
• Insulation
• High temperatures
• Cryogenic
• Sealants
i• Seals
• Airframe
• Cryogenic
• Tribology• Bearings• Lubricants
• Finishes
• Configuration cooling• People and equipment
• Propulsion system
• Wing leading edge•Wlng surface
• Body
• Electric power
• Turbojet accessibility• Gear box
• Cooled ram air APU
• LH2 + LO 2--APU--Fuel cell
• Aero: wing• Arrow
• Delta
• Wave rider (caret wings)
• Lifting body
Legend:Certlflcatlon date: 2000
i Certification date: 2015
Figure 4-4.
i1__ _
,,, _ _!._%:_._:;_ ,
, , iiii+iii!i=J I i +ii_l+;i? t= _ +;iiiiiiiili!iii =
i I-_ .............. III I _''- ::::::::::::::::::::::I
mmmmmm.=, +_+_:::+_+P+_+_ I:_':_$:::::::_+_: I
I
_ N++i:iiTii:Jlt
. "%_ .,,,' ,i. ",,_ ',+,,. _,,+."_,_ '% ',_. _,.+. '%,. "%. ',,,.. '%. _,,J
i _-..:$::_:_$_I I _iii}iiii::i_!ii i L'.'.'.::':':':: :::: :'::':"
%. +'N. _%. "N_ +N,. _%, "+%.+%=._%, _% '%_ "%. "_%.+'% J
t ............................i? I•i+i##+._ t:_._:__.:_:2_:
::_:'_::::::::::_:_:_:Ji..i,,,,..,,,,..,,,.,,,.,.,,+,,,,,,,,:':':':':+:'i'li+_I I MetallIc/ceramIc
, , j+i?w+li , i _ ++++++_++.".,+++_+._+_++++++."++:++--
, ",,, ,,,,. ,, ",,, .,,,,., .,,,, .,,,, • ,... ",,, .,,,, +,,, "% .,,,, _ ?
? I Requirements determined by design
_!_ Requirements determined by_ material chosen_.ji_,,......_..._, .:.:,:.:.:.:.:.:,:...,:.|I I |i_ _____-__--']_]! I
,,_ "%. _,_ "%_",,,. "%. ",,_ "%, "% ",,+. %, ",,,. '%. +',,,."% '%. ",,,. ",,,. _..
I I
""!iii_i__!':'+_i
I I :.+:.:.:.:.:.............. ,
t i +++++I++
, , +_.+.+i!_+_+ ,_ ++i,..+++++_i',.',.',.,.,.,..",.,,,.',.,_,.,..',,,
I i iii!_!iiiiil;ii"i
i .,, ++W.++.+++i
_!o _to 4.0 _.o _!o 25.o
Math number
Use of Technology Application Chart
Mach 4.0 --_ 6.0
option
• Cruise cycle
• Air turbojet/ramjet
• Turbojet/ramjet• Fuel
• Endothermlc fuel
• Liquid methane
• LH2
• Materials
• RSR titanium• Titanium MMC
• Titanium alumldecomposites
• Advanced MMC
• Transparencies
• High-temperaturesInsulation
• Cryogenic Insulation
• Metallic/ceramicairframe seals
• Cryogenic seals
• Cooling
• People andequipment
• Propulsion system
• wing leading edge• Electric power
• Cooled ram air APU
• wing planform• Delta
• Wave rlder
• Lifting body
3-UgOO27R3-83
57

Table 4-2. Risk and Benefit Analysis Criteria
Configurationdesign and systems
• Safety In flight
• Emergency descentsafety crash
• Survivability airportcompatibility
• Cabin noise
• Configurationcomplexity
• Airframe growthcapability
• Passenger appealand comfort
• Passenger cabinaccessibility
• Cargo volume andaccesslbUlty
• Payload flexibility
• Cockpitconfiguration
• Thermalmanagement
• Fuel system
Flight controls
• Environmentalcontrols
• Electric powersources
Propulsionand noise
• Fire hazard
• Rotor bursthazard
• Foreign objectdamage hazard
• Intake unstarteffects
• Wheels uplanding effects
• Variablegeometrypracticability
• Materials
availability
• Cooling feasibility
• Performancepotential
• Maintainability
• Engine designpropulsion
• Propulsioncomplexity
Structures, materialswelght, and balance
• Wing/body/empennage/gear load pathIntegrity
• Wing/empenagestructurecomplexity
• Body structurecomplexity
• Structure materialavailability
• Nonstructuredmaterial availability
• Balance
• Center of gravitymanagement
• Loading flexibility
• Weight (OEW)
Stability and control
• Longitudinal stability
• Longitudinal control
• Longitudinal stabilityaugmentationrequirements
• Takeoff rotation andlanding derotatlon
• Landing approachtrim
• Directional stability
• Engine out control
• Lateral/directionalcontrol effectiveness
• Lateral/directionalstability augmentationrequirements
• Cross wind takeoffand landing capability
• CG control
requirements
• Failure states
redundancy
Aerodynamics
• High lift system failureImpact
• Pilot visibility
• Space available forhigh lift system
• Leading edge andtrailing edge cutouts
• Surface size andactuator requirements
• System aerocomplexity
• Test dependency
• Llftoff and touchdown
lift potential
• Climb and descentLID potential
• Reverse thrustavailability
• De-icing requirements
• Cruise LID
• Potential transonicLID
• Potential subsonic LID
• Potential sonic boom
L
Risk and benef_
screening index.,100 -,,
8O
4O
2O
0
58
Ii Very tow risks (design,
operational environmental) I.,
• High benef_s (performance TM
and econom c)
4-UgOO27R 1-84
Examples
l i Risk equivalent to new subsonic airplane program
Materials are proven and availableViable economicsMeets existing operational and environmental cdtedaServicing and maintainability equal to existing airplanes
e Moderate risks• Acceptable potential
benefits
l e Resolution of risks will require extensive research anddevelopment• Proba_y acceptable performance and economics
l e Probably acceptable for most major airports
Figure 4-5.
I
• Very high risk• Low potential benefits I
• Significant cost and weight penalties• Marginally acceptable for superhub operation and
highly restrictive flight paths• Very difficult to service and maintain• Poor economic and performance potential• Potential design fatal flaws
• Fatal, unacceptable designand operational flaw
Risk and Benefit Analysis Screening Index With Examples4-UgOO27R1-85

Risk andbenefit index
7O
65
6O
55
5O
Delta wing
Figure 4-6.
• ._._ _$.._::"=.._
Arrow wing, planforrn type
Concept Screening Planform Trends at Mach 2.4
Low sonic boom
4-ugoo27R1-87
4.3 CONFIGURATION AND PERFORMANCE ANALYSES
The six configurations chosen through concept screening for further development are listed below
according to their Mach number regions:
a. Mach 2.4. The configuration shown in figure 4-7 has a blended-wing body, double-delta planform
based upon Boeing model 733-633 for which an extensive database exists. The double- delta wing
planform provides a good compromise between supersonic cruise and low-speed requirements(field length and noise). TSJF is contained in wing tanks. Four variable-cycle dry turbofans are
aft-mounted on the lower surface of the wing in single nacelles for favorable aerodynamicinterference. The primary structural materials are polymeric composites for airplanes developed
for both year 2000 and 2015 certification dates.
b. Mach 3.2. The configuration shown in figure 4-8 also has a double-delta planform. The propulsionsystem includes four variable-cycle afterburning turbofans with two-dimensional inlets in
aft-located double pods. Primary structural material for the year 2000 vehicle is titanium; the year
2015 HSCT will be constructed of polymeric composites. Fuel tanks are in the wings of both mod-els. This requires development of TSJF with high thermal stability as well as fuel tanks with low
thermal conductivity.
c. Mach 3.8. The configuration shown in figure 4-9, also with a double-delta planform, has an ex-tended inboard wing leading edge to provide acceptable inlet flowfield characteristics for the rela-
tively long engine nacelles. The propulsion system includes four afterburning turbojets with
59

Scale, ft0 25 5O 100
l l I I
Figure 4-7. Mach 2.4 Configuration4-Ug0027R2-98
Scale, ft0 25 50 100
I l l I
Figure 4-8. Mach 3.2 Configuration4-U00027R2.-93
two-dimensional inlets for two single-pod and one double-pod arrangement located aft on thewing
to optimize the wing-nacelle interference effects. This configuration uses TSJE Climb fuel is con-
tained in wing tanks, and the cruise plus descent fuel and fuel reserves are contained in body tanksin the enlarged fuselage. Primary structural material for the year 2000 application is titanium, and
for 2015, a high-temperature metal-matrix composite.
60

Scale, ft
0 25 50 100
I 1 I I
Figure 4-9. Mach 3.8 Configuration4-Ug0027R2-g4a
d. Mach 4.5. The configuration shown in figure 4-10 also has a double-delta planform with a propul-
sion system consisting of four mixed-cycle, ramjet-turbofan engines contained in aft-mountedsingle pods. Liquid methane fuel is contained in caterpillar-type fuel tanks located in the fuselage
and in the wing-body fairing area. This configuration would have a high-temperature metal-matrix
composite structure. All concepts with cruise speeds greater than 4.0 were assumed to have a
certification date in the year 2015.
Scale, ft
0 25 50 100
I I I I
Figure 4-10. Mach 4.5 Configuration4-Ug0027R2-g5
61

e.
f.
Mach 6.0. The multibody configuration shown in figure 4-11 was designed to separate the passen-
gers from the liquid hydrogen (LH2) fuel tank while retaining most of the features of a delta plan-
form. Passengers are located in the center body with the LH2 fuel contained in the two outer bodies.
The propulsion system consists of four single-pod air turboramjets. Primary structural materials
are high-temperature, metal-matrix composites.Mach 10.0. The configuration shown in figure 4-12 was designed to incorporate a very highly swept,
blended-lifting, long-body arrangement that is characteristic of an optimum cruise configuration.
Its low span implies operation from existing airports would be impossible. Large LH2 fuel tanks
are located in the body both fore and aft of the passenger compartment for balance considerations.
The propulsion system includes four scram jet-ramjet-turbojet multicycle engines located in a clus-
tered pod arrangement below the fuselage. An actively cooled, high-temperature, metal-matrixcomposite material is used for the primary structure.
These six final configurations were sized to determine the required MTOW for the West Coast to
Tokyo range (4,500 nmi). The results shown in figure 4-13 illustrate a significant increase in MTOWwith increasing design Mach number. The relative increase would be even more dramatic with longer
design ranges or higher payloads.Sensitivity trade studies were made on an arbitrary 10% improvement in lift/drag ratio (L/D), spe-
cific fuel consumption (SFC), and weight for the higher Mach numbers. The gains in performance,
as indicated by reduced MTOW, are very sensitive to these technology improvements for the higherMach numbers.
Figure 4-14 shows average flight Mach number variations for the mission-sized airplanes. Theseresults show that average mission Mach number increases slowly beyond a design of Mach 3.0 because
of a relatively greater percentage of time spent in climb and in descent.Candidate structural materials were selected by (1) surveying published research, material suppli-
ers, and aerospace contractors to identify commercial or developmental materials with potential appli-cability; (2) estimating mechanical properties based on available published data and development
Scale. ft0 25 50 100
1 I I I
Figure 4-11. Mach 6.0 Configuration4-UgOO27R2.-g6
62

=
Scale, ft0 25 50 100 / li
_._,.-_-_-,,_._.--_-_ .........i_:_...........l _:.::lP. --"_'l I
..... _...;_....._ !J::!R .....I.II
_ o _
Figure 4-12. Mach 10.0 Configuration4-UgOO27R2.-97
MTOW,Ib x 1,000
3,000
2,500
2,000
1,500
1,000
500
I-I
III
-III
-IIII
II
_1
II Year2
_,,
I ' I2 3
JP fuel _ _--III
Superhub design _ I
Cryogenic fuel _i
Io
Initial analysis I--__
L/D, wt, TSFC/
improvements /= 10%
4 5 6
Mach number
10
I I 17 8 9
Figure 4-13. Maximum Takeoff Weight Versus Mach Number--Year 2015, 250-Seat Airplane3-UgO027Rl-118
63

100%
Percentage of missions flown J . 80%
r hum.Average
flightMach
number 2
1
0 I I I I0 2 4 6 8 10
Cruise Mach number
Figure 4-14. Average F/ight Mach Number Versus Cruise Mach Number--West Coast to Tokyo3-U0002_Rl-104
goals; and (3) forecasting availability by assessing progress in development versus goals, determiningtechnical complexity in achieving these goals, and estimating process scaling necessary to support alarge production program. A significant development effort to assure availability of technology wasassumed. Potential materials, maximum use temperatures, and predicted availability are summarizedin figure 4-15.
After screening and assessment of candidate materials on study configurations, the structural ma-terials judged to be available for year 2000 certification with the most potential are toughened thermo-setting, high-temperature thermoplastic or polyimide polymeric composites for Mach 2.8 and below
Polymer matrix composites
• Epoxy
• Polyetheretherketone
• Toughened BMI
• Thermoplastic polylmlde
• Polylmide
• Fluorinated polylmlde
Metals
• Aluminum
• Aluminum lithium
• RS aluminum
• Titanium
• RS titanium
• Intermetallics
Metal matrix composites
• Aluminum matrix
• Titantum matrix
• Intermetalllc matrix
L.1
Figure 4-15.
Legend:
Year 2000 availability
Year 2015 availalolllty
_....,......._.,.._.,
I 1 l I I0 300 600 900 1,200 1,500
Temperature range, °F
1,800
Structural Material Candidates and Projected Temperature Range for HSCT Application5-UgOO27R4-113
64

and ingot titanium alloys for the higher Mach numbers. Even though they have the most potential for
a lightweight cost-effective HSCT, polymeric composite systems for high-temperature service have in-adequate processibility and unproven long-term, thermal and environmental resistance for
application in a commercial program. Significant development is required to optimize these materials,
develop automated processing methods, and evaluate their long-term performance in the severe HSCTenvironment.
By the year 2015, it is projected that the maturation of metal matrix composite and rapid solidifica-
tion (RS) technology will make them available for application on the HSCT. Current material forms,processes, and production equipment available in the industry are not adequate to produce the large
structure required for an HSCT program. Development is necessary to scale processes and evaluate
long term, high-temperature performance of these materials.Support materials compatible with the selected structural materials are required for a viable com-
mercial program. Support materials include adhesives, seals and sealants, finishes, and lightning pro-tection materials. Generally, support materials are available with thermal stability applicable to a
cruise speed of Mach 2.8 or below. The performance and long term durability of current support mate-rials are necessary for application of these support materials to the HSCT. Development of improved
temperature resistant materials is required for higher Mach number configurations.Structural weights for performance calculations are based on the structural concepts and arrange-
ments and on the procedures used in the study reported in "Study of Structural Design Concepts foran Arrow Wing Supersonic Transport Configuration" (ref. 4.1). A number of potential materials were
selected for years 2000 and 2015 as described previously. Based on the projected mechanical propertiesof these materials, panels taken from ten locations on the fuselage and six locations on the wing were
redesigned and resized for strength, making allowance for the change in operating temperature at the
higher Mach numbers. These locations were selected to represent the range of typical design load con-ditions on the airframe structure. Based on the weights of these structural elements, the weight of the
airframe for each airplane configuration was estimated for use in the performance calculations.
Study Results. The results made from the studies of the initial-concept configurations and per-
formance analyses are-
a. Aircraft size and design complexity increase significantly with increasing design Mach number.b. The airplane MTOW is very sensitive to projected technology improvements for the higher Mach
numbers.
c. Average flight Mach number increases slowly (average block time decreases) above a design Machnumber of approximately Mach 3.0 to Mach 4.0. This suggests that economic gains (i.e., productiv-
ity) will not increase proportionally with design cruise Mach number.
d. Significant technology and design integration advances are required for an efficient long-range
HSCT, even at lower supersonic Mach numbers.
4.4 ALTERNATIVE MACH 4.5 CONFIGURATIONS
Based on the study results, subsequent configuration studies focused on Mach numbers below 4.5,
but further evaluation of the configuration possibilities was needed. The baseline year 2015, Mach 4.5methane-fueled configuration is shown in figure 4-16(a). The configuration concept is similar to the
Mach 2.4 configuration: a double-delta wing planform with an efficient high-lift system and trimming
aft tail for good takeoff and landing performance as well as low community noise. The Mach 4.5 base-
line departs outwardly from the Mach 2.4 configuration only with the much larger propulsion pods
and the much increased inboard wing and body volumes required to accommodate the low-densitymethane fuel.
Analyses indicated that the MTOW for the Mach 4.5 methane-powered configuration was about
2,500,000 lb, which is 300,000 lb greater than the concept screening estimate of about 2,200,000 lb. Twoalternative configurations were examined in an attempt to lower the MTOW. The configuration in
65
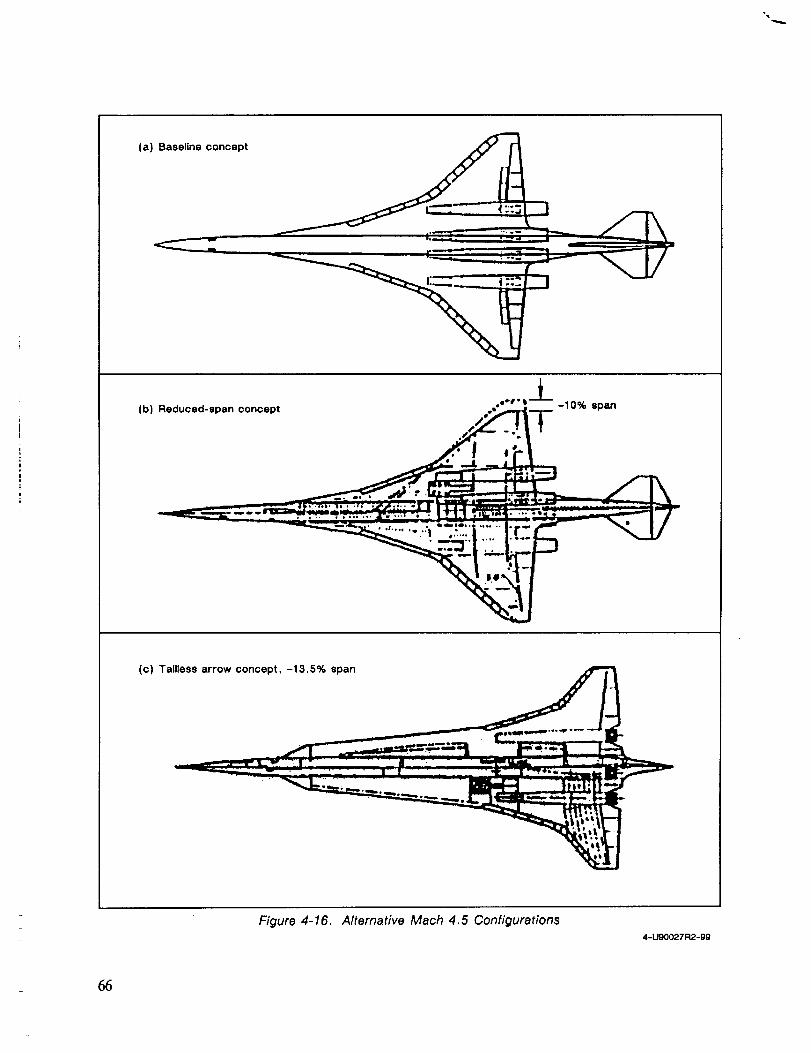
(a) Baseline concept
"**'_"_ -10% span[b) Reduced-span concept - 1
(c) Tailless arrow concept, -13.5% span
Figure 4-16. Alternative Mach 4.5 Configurations
4-U90027R2-99
66

figure 4-16(b) simply reduced wing span 10% and increased wing thickness 10% at the root in an at-
tempt to save operating empty weight (OEW) at the expense of takeoff and landing performance, andnoise characteristics. The configuration in figure 4-16(c)was an optimum-cruise designed "tailless-ar-
row," with 13.5% less span, aimed at both reduced OEW and high-cruise L/D, with the same negative
side effects as the reduced wing span configuration.The results are shown in figure 4-17. MTOW reductions of 100,000 and 500,000 lb were indicated,
but even so, the lightest concept, the tailless-arrow, has a MTOW of 2 million pounds. Further, very
large technology improvements of 10% to 18% in all three areas (L/D, SFC, and OEW) would be re-quired to achieve an MTOW below 1 million pounds. Because of the very high MTOW of even the
most optimistic alternative configuration, the Mach 4.5 methane-fueled airplane was dropped from
further study.
4.5 FINAL STUDY CONFIGURATIONS
The evaluation was narrowed to the region between Mach 2.4 and Mach 3.2 for further detailed
study. This speed region was investigated to assess configurations for their technical feasibility foryear 2000 and 2015 certification. The approach taken was to update the design requirements and objec-tives and then to reassess the technology projections. Following these steps, new baseline configura-
tions were developed at each Mach number. Studies conducted at Mach numbers 2.4, 2.8, and 3.2 wereused to determine the cruise Mach number with the greatest benefit and least risk. Further trade and
sensitivity studies were conducted to aid in the selection of configuration features with the greatest
benefit (sec. 5.0, "Environmental Evaluation").
The updated design requirements and objectives used in sizing each airplane are given in table 4-3.
Figure 4-18 illustrates the flight profile used to evaluate mission performance. These design require-ments and objectives are used to define an "initial delivery" airplane. The initial delivery airplanes
are part of the growth strategy shown in figure 4-19. The vehicle meets all performance constraints
given in table 4-3. The initial delivery airplane forms the basis of an HSCT family concept designed
3,000
2,500
2,000
MTOW, 1,500Ib x 1,000
1,000
500
Baseline delta-10% span delta
K_x_\\\\\\\\\\\\\\\\\\\'_
IJ
_\\\\\\\\\\\\\\\\\\\'_,
-13.5% spantailless arrow
N\\\\\\\\\\\\\\\\\\\ _,*\_1 Maximumweight
0Baseline -10% span -13.5% span
Figure 4-17. A/temative Mach 4.5 Configuration Study Resu/ts--247-SeatAirplane With 5,000-nmi Design Range
3-Ug0027R 1 -Sg
67

Table 4-3. Design Requirements and Objectives
i
Design requirements
Payload
Range
Takeoff fieldlength
Approach speed
Climb thrustmargin
Climb time
Fuel volume
Range growth
Payload growth
Subsonic cruise
Community noise
Sonic boomlimitations
Pavementloading
Design payload of 247 passengers plus baggage with a trl-olass configuration (10% first class,20% business class, and 70% economy class); the low-sonic-boom design airplane is theexception with a design payload of 268 passengers with the same service distribution
Design range Is 5,000 nml with the design payload at 210 Ib per passenger Including baggage
FAR field length not to exceed 12,000 ft at sea level, 86°F at MTOW
Not to exceed 160 kn at maximum landing weight
30% transonic (acceleration through Mach 1.1) ; 10% supersonic (top-of-climb)
Time to climb to initial cruise altitude not to exceed 45 rain
Fuel for the design range at design payload plus reserves plus 20,000 Ib of additional fuel
Design objectives
Fuel volume for long-range, reduced-payload, thtn markets, 6,500 nmi with advanced engines
Provisions for high-payload, short-range, North Atlantic market with advanced englnes
Efficiency equal to supersonic ¢rulse
FAR36 stage 3 or equivalent
Subsonic flight over land
Equivalent to DC-8-50, at a MTOW of 350,000 Ib operating on flexible pavement subgrade Bplus 10%
i!-°
3-ug0027R2-110
ih,
Flight profile
@
@_1 _" Range
I _= Trip fuelJ= Block time and fuel
®
o(_)_
Reserves
NI
. ®260 nml --_
i-|7 =
Legend:
10 min taxi out
Takeoff
Accelerate and climb to best cruise altitude
Supersonic cllmblng cruise
Descend and decelerate
Instrument Landing System
6% trip fuel
Subsonic cruise at 37,800 ft
30 rain hold at 15,000 ft
5 rain taxi In
Figure 4-18. Flight Profile and Reserves
3-Ug0027R1- 103
68

7,000
Range,nml
6,000
5,000
4,000
3,000
Los Angeles to Sydney _j_ • 200 passengers,advanced engines
New York to Tokyo • 250 passengers,
_ Improved engines- Initial delivery, • Increased payload
Los Angeles 250 passengers with improved andto Tokyo advanced enginesHonolulu to Sydney _.
New York to Rome
B
• 300 to 350 "__ • 350 to 400
New York to Paris
I I I
passengers, passengers,Improved advancedengines engines
1995 2000 2005 2015
Year
Figure 4-19./-/SCT Growth Strategy3-ugoo27R 1-105
to take advantage of improvements optimizing payload-range characteristics occurring after initialdelivery.
The study approach was to use the Mach 2.4 configuration and modify it for Mach 2.8 and
Mach 3.2 only when changes were necessary for the higher cruise speeds. Hence the Mach 2.8 and
Mach 3.2 configurations are very similar in general appearance to the Mach 2.4 baseline. The basicdouble-delta planform was retained at Mach 2.8 and Mach 3.2 because it remains an acceptable com-
promise between high supersonic cruise efficiency, light weight, and low-speed requirements for per-formance and noise characteristics.
Externally, the most visible change is an increase in vertical tail size as Mach number is increased
and the use of a different nozzle-suppressor on the Mach 3.2 airplane powered by the GE VCE. The
vertical tail increases were required to meet directional stability requirements as Mach number rises.The increased stagnation temperature with increased speed had a major effect on the airplane's mate-
rials and systems. The resin used in the composite primary structure was changed from bismaleimideat Mach 2.4 to polyimide for Mach 2.8 and Mach 3.2. In fact, the high-temperature polyimide required
at Mach 3.2 is not projected to be available until sometime after year 2000 certification. Fuel tank pres-surization and inerting (with nitrogen gas) was required at Mach 3.2, and some pressurization was
required at Mach 2.8.Technology assumptions in each of the key areas of aerodynamics, structures, materials, propul-
sion, noise, and airplane systems were reviewed and updated for year 2000 and 2015 certifications.
Table 4-4 shows key elements in each technology for the study Mach numbers.
The results of the speed studies are shown in figure 4-20, and listed in table 4-5. MTOW increasessteadily as design Mach number is increased from 2.4 to 3.2. The Mach 3.2 configuration exceeds the
69

Speed regime
Fuel and fuel system
Propulsion
Structure
Table 4-4. Key Technology Elements for Study Mach NumbersMath 2.4 Mach 2.7 Mach 3.2
TSJF TSJF + 50 TSJF + 100Fuel tank pressurization with Inerting
TBE with NACA nozzle TBE with NACA nozzle GE VCE with treated ejector + chute nozzle
Carbon/blsmaleimide Carbonlpolyimide Carbon/polyimide
3-LIgOO27R 1-88
MTOW,Ib x 1,000
1,100
1,000
900
800
700
6OO
Engine P&W TBE P&W TBE GE VCE
Fuel
type Jet A TSJF TSJFI I l I I
2.4 2.6 2.8 3.0 3.2
Mach number
Figure 4-20. Airplane Size Speed Trends
Maximumweight
3.4
3-UgOO27R1-gO
maximum weight limit substantially, even with the advanced high-temperature composite structure
not currently projected for year 2000 certification.As table 4-5 shows, Mach 2.4 has the lowest MTOW, OEW, and block fuel while Mach 3.2 has the
lowest block time. Technical risks are evaluated on the relative levels of high, medium, and low. The
table shows Mach 2.4 has the lowest technical risks in all categories; therefore, the Mach 2.4 configura-tion was selected as the baseline for the detailed environmental-impact studies described in section
5.0, "Environmental Evaluation."
The updated Mach 2.4 baseline uncycled airplane configuration is shown in figure 4-21. The influ-ence of the various design requirements on the choice of MTOW, wing area, and engine size is shown
in the sizing chart in figure 4-22. If there were no limitations imposed by climb time, thrust margins,fuel volume, approach speed, or takeoff field length, then the wing area and engine size chosen would
limit the MTOW to the minimum possible level to satisfy the mission range requirement. However,these design limits do exist in that the airplane is sized by fuel volume and the transonic thrust margin.
Climb time would Size the airplane at a weight very close to that of the transonic climb margin.
These relationships changed for the different configurations studied, but the Mach 2.4-baseline sizing
chart (fig. 4-22) provides an illustration of the technique used in the study. The Mach 2.4 baseline air-
plane selected from the sizing chart is defined as--a. MTOW = 745,000 lb.
b. Aerodynamic reference wing area = 7,466 ft 2.
c. Engine airflow = 582 lb/s.
70

Table 4-5. Technical Benefits and Risk Assessment
Range = 5,000 nmi, 247 passengersBenefits
Mach 2.4 2.8 3.2
Certification year 2000 2000 2000Material C/T-BMI C/TPI C/TPI
Fuel Jet A TSJF TSJF
MTOW, Ib 745,000 877,000 1,025,000
OEW, Ib 323,200 385,900 442,500Block fuel, Ib 325,100 382,700 461,800
Block time, hr 4.5 4.0 3.7
Risk
AerodynamicsStability and consols
PropulsionNoise
Emissions
StructuresMaterials
Weight and balance
Systems
Configuration
Low to medium Low to medium
Low to medium Low to medium
Medium Medium to high
High High
High HighMedium Medium to high
Medium Medium to highLow to medium MediumLow tomedium Medium
Low tomedium Medium
MediumMedium
High
High
High
High
HighHigh
Medium to high
Medium to high
4-ug0027-86
Figure 4-21. Mach 2.4 Baseline Configuration4-Ug0027R2-94
"/1

640
620
6OO
580
Engineairflow,Ib/s
560
54O
520
• Design range 5,000 nml• Design payload 247 passengers
"_ I _\\ 740
- \',.X730 \
_'1 \ _ \,/_ " \ Sized [
_. -_ I airplane I
\ ', \\I \ \\ \
\\
\
710
\X
\X750\
\
\
\ \\ \
\\
S MTOW 1,000 Ib
\ / \(
't,,_o _,7_0 f 10'000-ft FAR TOFL
/'. y\ -\ _ f (transo111c)
\ / \ \ "_\ \\ 45-mln climb timet, ,1 ,/
t
Fuel volume
I_t -=_ 11,000-ft FAR TOFL
I
I
IIII
I
I II /
soo I I I I I I5,400 5,800 6,200 6,600 7,000 7,400 7,800
Reference wing area, ft a
Figure 4-22.
... =_ ,,,_12,000-ftFARTOFL/// 10% thrust margln
(top-of-climb)
I I I8,200 8,600 9,000 9,400
Sizing Chart ModeI--Mach 2,4 Baseline
5-U90027R3-73
4.6 AERODYNAMICS
a.
b.
C.
The aerodynamic tasks included--
Aerodynamic design integration of the study configurations.
Integration of a compatible high-lift system for each concept.
Evaluation of the aerodynamic characteristics of all concepts to provide necessary resizing data for
the airplane performance calculations. These included both flaps-up cruise configuration analyses
as well as flaps-down takeoff and landing evaluation.
The aerodynamic design of the study configurations included optimized camber/twist distribu-
tions and area-ruled fuselages. The wing spanwise thickness distributions and airfoil shapes were con-
strained by structural depth requirements. The planform, thickness, and twist distributions from a
previous study were used for the baseline configuration. The wing designs for the innovative and the
low-sonic-boom configurations were developed using the methods that had been used to develop thebaseline double-delta configuration.
72

==
The fuselage of each configuration was area-ruled to minimize volume wave drag by use of thetransfer rule (refs. 4.2 and 4.3). The Mach number for area ruling was chosen to be 0.3 less than the
cruise Mach. This provides a good compromise between transonic and cruise drag levels.
Nacelle shape, size, location, and operating conditions all influence the nacelle interference withother configuration components. The dominant interference effect is between the nacelles and the
wing. To arrive at an acceptable nacelle configuration requires a balance between the isolated dragof the nacelle and the interference drag induced by the nacelle. The nacelles of each of the study config-
urations were placed below the wing and aft to (1) provide the inlet with a uniform flow field throughout
the angle of attack range, (2) take advantage of the precompression caused by the wing shock, and(3) achieve significant favorable aerodynamic interference.
High-speed aerodynamic characteristics for all of the concepts were developed using the methodsdiscussed in reference 4.4. Projections for year 2000 technology improvements have been included in
the drag build-ups. These projections include--
a. A 5.4% reduction in skin friction drag resulting from the use of an outer surface treatment such asriblets over 90% of the vehicle wetted area.
b. A 3.5% reduction in volume wave drag and drag-due-to-lift resulting from design methodology im-
provements.c. The incorporation of a 1.5% wind tunnel to flight test drag improvement.
The drag breakdown for the baseline airplane is shown in figure 4-23, and lift/drag versus Machnumber shown in figure 4-24.
The high-lift system is designed to increase wing lift for liftoff and touchdown. It must be designed
to minimize drag during climbout and approach to reduce airport noise levels. In general, the
leading-edge and trailing-edge flaps are simple hinged surfaces. Low-speed performance is improvedby repositioning the flaps relative to the conventional low drag position for higher lift. For liftoff and
touchdown, leading edge flaps were raised to increase vortex lift. After liftoff, the flaps were positioned
for minimum drag.
Takeoff and landing speeds were based on set margins from the pitch attitude limits with the land-ing gear oleos fully extended at liftoff and fully compressed at touchdown. The selected minimum
all-engine tail clearance margin at liftoff is 2 deg and at touchdown is 1.5 deg. Such features as a tail
skid or an attitude limiting system would be required for aircraft structural protection. Approach
speed was selected to be 3% faster than touchdown speed.
Totalcruisedrag, -%
100
5O
Friction
_t_¢'".""'_'_.'_.:_. _._: :: '>_i_i_!' .':'.?._:_:_._:._!_:_8_!_-.'-;..-x F ".:_F.'2:::_::::_:_.:_:.::_::':
:¢_:_.:.._:_.x_..::._:_'_.:_$._'.._:_:_::._._._,_.%¢_!
_';_'_.':'_:.'_::_,'_ _'_-".',:"_':_":'._i_
Figure 4-23.
Volume wave
_.,.:.-.:_._..._..:.$_- -.-_ . .
Drag Breakdown--Mach 2.4 Base/ine
Drag due to lift
:::.__:_:_::..:..:_...._ ._:"_:._:" : ,_. _:::._. _,
___ii..'._"":_:_""":':"_"" ":""":"_'_" !::':'::"_':'_
_ "_ .:
4-Ug0027R 1-112
73

\
2o
Lift/drag
16
12
8 m
4
0.4I I I
0.8 1.2 1.6
Mach number
Figure 4-24. Lift/Drag Versus Mach--Mach 2.4 Baseline
2.0 2.4
4-Ug0027R 1-111
4.7 STABILITY AND CONTROL
The primary task for stability and control has been the estimation of horizontal and vertical tailsize and center-of-gravity (CG) limits that satisfy critical stability and control criteria. HSCT configu-
rations are designed using a control-configured vehicle design approach that employs the flight control
system to stabilize as well as control the airplane, which results in a more efficient aerodynamic andstructural configuration. The required stability augmentation system will be of sufficient capability
and reliability to provide acceptable handling qualities. Handling qualities will be as good or better
than existing Boeing airplanes over the operational flight envelope up to the maximum useful angleof attack. The flight control system will be used to limit or prevent excursions outside this envelope.
Longitudinal Axis. The main consideration for a control-configured vehicle design approach is the
provision of adequate control capability at aft and forward CG limits. The provision of acceptablehandling qualities affected by airplane stability levels will be accomplished through the use of the
stability augmentation system.Satisfactory stall recovery control determines the aft CG limit. The available pitching moment
must be adequate to produce an airplane nose-down angular acceleration of-0.08 rad/s x at the mini-
mum demonstration speed corresponding to lg flight. The forward CG limit is determined by takeoff
rotation requirements. Adequate control must exist to provide sufficient pitch acceleration at the
rotation speed to achieve the required liftoff speed. Full deflection of the geared stabilizer/elevatoris assumed.
74

No critical longitudinal control or stability conditions should exist at the supersonic aft CG limits.
However, the horizontal-tail design hinge moments could become critical at the forward CG limit for
some supersonic flight conditions.
Lateral-Directional Axis. The vertical stabilizer/rudder is sized to provide engine out control and
high-speed directional stability. The design objective following engine or intake failure(s) is to providegood controllability using normal control techniques. Rudder inputs are used by the pilot to maintain
heading following an engine failure on takeoff.Rudder effectiveness directly affects the degree to which stability can be augmented by the stability
augmentation system. At the design cruise Mach number of the Boeing 2707-300, a 65% loss in tail
(rudder) effectiveness occurred because of bending in the vertical tail and aft fuselage. Stability char-acteristics are strongly dependent on both sideslip angle and angle of attack. The effect of increasing
angle of attack is to rapidly decrease directional stability. For this reason, directional stability is lower
in maneuvering flight and must be accounted for in the design of the stability augmentation system.Lateral-directional characteristics of supersonic-hypersonic configurations are sensitive to
changes in Mach number, dynamic pressure, and load factor. This is because of strong nonlinearities
in key stability derivatives and large reductions of control effectiveness caused by structural flexibility.It must be demonstrated that the airplane possesses good handling qualities and adequate control
to recover from emergency situations in all flight conditions.
4.8 WEIGHT AND BALANCE
Weight Analysis Approach. The primary source for the airplane technical definition is the general
arrangement drawing. The weights databases of the Boeing 2707-300 and other studies (ref. 4.2) havebeen used for baseline structural sizing, loads, systems and equipment definition, design criteria,
design requirements, and payloads system definition. Passenger comfort level requirements accordingto the current Boeing and airline companies' definition were substituted for the definition used on
the model 2707-300. Advanced technology materials were applied for concepts projected to be certified
in years 2000 and 2015.
Using the Boeing 2707-300 and 733-633 weight databases, a method of weight and balance analysis
was developed. The independent parameters described above were input for an uncycled airplane at
one specific gross weight, wing area, and engine size. The weight outputs were combined with weight"scalars" (weight increment versus parameter) in order to meet the design requirements.
The uncycled weights were analyzed for the uncycled airplane configurations, and the ballast re-
quired to meet the available CG limits was defined. This alternative for meeting balance requirementswas selected because time was insufficient to reconfigure the design to achieve no ballast (i.e., relocat-
ing the wing on the body and resizing the empennage and main landing gear). Performance data were
based upon the zero ballast weight data. In most cases, this was conservative for the "status" weightdefinition because the airplanes typically require forward wing shifts, which results in smaller
empennages.
Weight Methodology. Using the weight databases for Boeing models 2707-300 and 733-633, para-
metric methods of component weight, balance, and moment of inertia analyses were developed. The
algorithms apply parameter ratios to baseline absolute data. The input data required are primarily--
a. Geometry.b. Component centroids.
c. Fuel quantities and tank centroids.
d. Design weights.e. Structural weight factors for composite structure.
f. Systems requirements.
75

_x
The output weight definition comprises the following elements:
a. Functional group weight breakdown with corresponding longitudinal CG.b. Balance requirements that assume--
1. Ballast or wing shift required (zero ballast) to meet the available CG limits; or
2. Required CG limits for zero ballast without shifting the wing.c. Pitch moments of inertia for three design (gross) weights.
Wing structure strengthening required for passive flutter stiffness up to Vmo speed is incremented
as a function of (1) propulsion pod weight and longitudinal CG, and (2) wing geometry. The stiffnesspenalty is nonlinearly proportional to propulsion pod weight and location (i.e., "overhang" moment,
which causes wing box torsion).
Expected improvements in weight technology from the present to the year 2000 are listed intable 4-6.
Table 4-6. Weight Improvements From Current Technology to Year 2000 Certification
Item Weight improvement
Participating structure (skin panels, body frame, etc.)
Active full-time flutter suppression system
Maneuver and gust load limiting
Stability augmentation
Flight deck, two versus three station
Flight deck, space provisions
Hydraulic system pressure, 5,000 versus 4,000 Ib/In 2
Hydraulic system redundancy, three versus four systems
Hydraulic fluid operating temperature, 500 ° versus 350°F
Fly-by-wire
Thermal management
40% to 50% savings compared to 1978 definition with titanium
OEW Increment = -1,200 Ib
No change*
No change*
OEW Increment = -200 Ib
No change*
OEW Increment = -300 Ib
OEW Increment = 0 to -1,000 Ib
OEW Increment = 0 to -500 Ib
No change*
OEW Increment = 0 to +500 Ib
* Included in 773-633 baseline4-Ug0027R2-111a
Weight and Balance Data. Weight and balance data for the 12 uncycled airplanes analyzed duringthe last phase of the contract are shown in table 4-7.
4.9 IMPACT OF TECHNOLOGY
To assist in the selection of the airplane configurations to be studied further, design trends were
determined for the Mach 2.4 configuration as a function of technology level. Again, the primary index
was the MTOW. Design ranges were parametrically changed from 3,000 to 6,000 nmi, with the results
shown in figure 4-25. Advanced technology is essential to achieve the desired range capability
(5,000 nmi) within a realistic size limit (MTOW = 900,000 lb). These data show that at 5,000 nmi therequired MTOW is about 745,000 lb, well below the size limit. Figure 4-25 shows that the MTOW for
year 2015 certification to be 585,000 lb at 5,000 nmi.The results of a design payload sensitivity study are shown in figure 4-26. These data indicate a
capability of about 320 passengers at a 900,000 lb MTOW for a design range of 5,000 nmi.
Figure 4-27 shows the impact of the technology advances projected for year 2000 certification ver-
sus that currently available for year 1995 certification at Mach 2.4. These data show that, collectively,
advanced technology reduces the MTOW from 1 million pounds to 745,000 ib (about 25%) with ad-vanced structures and materials providing the largest single benefit. The figure also shows the same
data plus the impact of further technology improvements projected for year 2015 certification. The
required MTOW is reduced from about 745,000 Ib to about 585,000 lb (about 20%), with advances
76

t_
"oq_
0
-o
O.
E
0r"
r--I
EE0
OoE
O.
E0c-ON
o
00')_co
O__--00
COCOOt'_
00P_O_
_0_0OO3_cO
00_00o3
¢0
O.
E0
(D
0 0 0 _ 00 0 0 0 0
C3 0 0 0 C30 0 0 0 0
_ 03 _ 0
0 0 0 0 C30 0 0 0 0
• .- 03
0 0 0 0 00 0 0 0 0
0 0 0 0 0C3 0 0 0 0
0 0 0 0 0
0 C3 0 0 00 0 0 0 0O_ ¢0 'I,- 0 ¢')
03
0 0 0 0 00 0 0 0 0
o _ d ,_ o_0 03 O0 T- P_
0 0 0 0 C30 0 0 0 0
P-. O0 _3 _ U3
0 C) 0 0 00 0 0 0 0
_ o° oo ooO0 .-- 03 0 ¢'q
e.-
-_ E
E ®
_oo v
0 ._
0e-
"0
0 t_ 0 u3
0 P_ _0
0 0 C3 _00 0 h_
0 r'_ P_
0 0 0 t_
0 0 00 0 0 _0
0 P_ P_
0 C_ 0 o30 _'3 00
o e.2 _
0 0
0 P,_ P_
o o o _ot_C_
0 0 ¢0 0_1
0 r_ P_-U3
0 00 00 P--
0 0C3 00
0 00 00 P_
0 h-
P_
C3 C)0 tnC) 0
tnCO
b3
p_
C)O3CO
C)O'3CO
C)
J_
_o L_ --_® _
_ o
_r_d
_D
"6
C
Ez
77

1,800
Legend:Titanium
Composite -,.. --
Mlnlmum
range
Concorde
technology,
year 1971
certification
1,600
1,400 Present
technology,
year 1995certification
Maximum
takeoff
weight,Ib x 1,000
1,200
1,000
800
600
Projected
technology,
year 2000certification
Maximum Iweight
Projected
technology,
year 2015certification
Francisco Los Angeles New York
to Tokyo to Tokyo to Tokyo
400 •
3,000 4,000 5,000 6,000
Range, nml
Impact of Techno/ogy--Mach 2.4 BaselineFigure 4-25.
San Francisco
to Hong Kong
5-UgOO27RS- 106
in propulsion technology providing the largest single benefit. A year 2000 certification airplane could
conceivably use this technology improvement for the range growth strategy of the HSCT family con-cept (fig. 4-19).
The influence of systems technology on the results of the study supported the major conclusion
that there were benefits in designing to low Mach numbers. Because the studies were driven signifi-
cantly by weight considerations and because systems constitute only a small percentage of the vehicleweight, only those systems features that could be identified as configuration drivers were evaluated.
Particularly important was the thermal analysis of the aspects of "heat sink," which showed that only
the lower Mach number configurations using TSJF were practical.
In summary, a 250- to 320-passenger airplane cruising at Mach 2.4 in the 750,000- to 900,000-1b
MTOW region appears technically feasible for year 2000 certification, providing the technology ad-
vances are validated at the requisite time.
78

m
1,000
950
900
TOGW,Ib x 1,000
850 --
800 --
750 --
70O2O0
I I I I I I I220 240 260 280 300 320 340 360
Number of passengers
Figure 4-26. Design Payload Sensitivity--Mach 2.4, 247-Seat Airplane With Year 2000 Certification4-UgO027R3-g I
1,100
1,000
900
Maximumtakeoffweight, 800Ib x 1,000
700
600
500 1
1995 status
Propulsion
Propulsion
Aerodynamics
Compositematerials
Aerodynamics Systems
Compositematerials
Year 2000
projections
Year 2015projections
Figure 4-27. Impact of Technology--Mach 2.4, 247-Seat Airplane With Year 2000 Certification,5,000-nmi Design Range 5-UgO027RS-g2
'79

This Page
Intentionally Left Blank
80

7-
5.0 ENVIRONMENTAL EVALUATION
The objective of the environmental evaluation was to address key questions regarding the environ-
mental acceptability (upper-atmosphere engine emissions, airport and community noise, and sonic
boom overpressure) of the HSCT. The study focused on the requirements for acceptability and thepenalties incurred for meeting them (i.e., Are these requirements technically and economically
feasible?). Because the vehicle development studies (sec. 4.0, "Vehicle Development") indicated the
most technically viable HSCT to be a Mach 2.4 configuration, the environmental evaluations were
based on an updated Mach 2.4 baseline.
The approach taken to determine the acceptable environmental requirements was as follows:
a. Upper-atmosphere engine emissions. The study provided NASA with emissions data for represen-tative fleets of airplanes for analyses with math models of the Earth's atmosphere. Airplane mis-
sion studies would determine the impact on the airplane size from using reduced-emission engine
combustion technology. (In sec. 4.0 no assessment was made of the impact on the configurationmaximum takeoff weight (MTOW) for meeting possible reduced emission level requirements.)
b. Airport and community noise. Community noise levels no greater than the current FAR36 Stage 3
requirement were assumed to be required for an HSCT. Analyses determined the impact of meet-ing current noise requirements with projected suppression technology. (sec. 4.0 used the most opti-mistic projection for noise-suppression technology, but assumed that no significant engine/
wing-area oversizing would be required for meeting required noise levels.)c. Sonic boom. The assumption that an acceptable sonic boom acoustic disturbance from HSCTs can
be defined and achieved such that supersonic flight is permitted over populated areas. This should
lead to an assessment of the potential for supersonic overland flight. (sec. 4.0 assumed supersonic
flight over water only.)
The approach taken in evaluating the penalties for meeting reduced emissions, low sonic boom,and community noise was to first establish a Mach 2.4 "baseline" performance-sized airplane. This
airplane was then modified to reduce emissions, noise, and sonic boom to determine the effect on air-plane size (MTOW) and, consequently, technical and economic feasibility. Figure 5-1 illustrates the
particular environmental issue that each model was designed to address. This baseline airplane is pow-
ered by Pratt & Whitney (P&W) engines. An alternative General Electric (GE) powered baseline wasestablished for the reduced emissions impact study only.
5.1 UPPER ATMOSPHERE EMISSIONS-OZONE IMPACT
A technically viable HSCT must be designed so that its engine emissions have no significant impact
on the ozone layer. The impact will be determined by NASA, the environmental community and theresponsible regulating agency. It is possible that engine emissions (NOx) may affect the ozone layer,but much additional scientific knowledge must be acquired before the true relationship between NOx
and ozone depletion is known. In this study Boeing evaluated several airplane fleet scenarios incorpo-rating reduced emission concepts to define possible global patterns of HSCT fleet emissions. Addi-
tionally, this study determined the resulting effects of using innovative engine-combustor technology
to reduce NOx emissions on airplane size and economic feasibility. These emission concepts and their
penalties are presented in section 3.4, "Emission Reduction Concepts."Emission levels for the scenarios have been supplied to NASA who will, along with their subcon-
tractors, use one- and two-dimensional atmospheric models to assess the effects of these global emis-
sion levels on the ozone layer.
Ozone Evaluation Matrix. A matrix of seven airplane fleet scenarios and engine-emission charac-teristics for utilization in math models of the Earth's atmosphere were selected (table 5-1). The first
scenario, case B4, is the baseline for the current 1987 subsonic fleet. Two additional subsonic baselines,81
P__fI _N'i'IOtlALL¥ _LA_K
PRECEDING PAGE BLANK NOT FILMED

Baselines (Mach 2.4) Reduced emissions impact
_ P&W low-emissions_ engine_._m
I .n0,..Noise impact
Low sonic boom Impact
J .,,
GE low-emissions
3% air flowincrease
17% air flowincrease
32% air flowIncrease
17% air flowincrease- 12 %W/S decrease
Evaluation objective
The impact of usingengine combustiontechnology to reducenitrogen emissions intothe upper atmosphere
The effect of changingengine size and wingloading on communitynoise
The Impact of lowsonic boomconfigurations oneconomics and airplaneperformance
Figure 5-1. Environmental Impact Study Approach
3-Ug0027R2-72
B5 and B6, were also developed for the years 2000 and 2015. These scenarios account for projectedfleet growth, retirement, and replacement of some of the current fleet, together with projections on
the emission levels of their future engines. It was assumed that the increased emissions for the year
2015 fleet would come from fleet growth only, and that the average engine NOx would remain constant.
This would be achieved by introducing reduced NOx combustors to offset any increase in engine oper-
ating temperatures.
Four supersonic scenarios are presented for a fully developed year 2015 airplane fleet. EvaluationB7 is a Mach 2.4 fleet flying subsonic (Mach 0.9) over land and using the most innovative combustor
design (lean, premixed, and prevaporized (LPP)) for emission reduction presented by P&W. Evalua-
tion B8 is for the same fleet scenario, but using the most innovative combustor concept (LPP) pre-
sented by GE. In evaluation B9, the airplane cruise speed was lowered to Mach 2.1, which results ina lower average cruise altitude that, in turn, reduces the impact on the ozone. The final evaluation,
B10, accounts for the airplane flying Mach 1.5 over land, rather than Mach 0.9, which impacts the
ozone slightly more because it occurs at a higher altitude.
Each scenario requires the appropriate size and mix of aircraft to satisfy the projected demand
for air transportation of each specified time.

Case l Date Fleet type
B4 1987 Current subsonic
B5 2000 Estimated year-2000subsonic
Table 5-1. Ozone EvaluationsNOx technology
Estimated NOx for current fleet
Estimated NOx for year-2000 fleet
B6 2015 Estimated year-2015 Average estimated NOx for year-2015subsonic only fleet
B7 2015 Estimated year-2015sub/supersonic mix
B8 2015 Estimated year-2015sub/supersonic mix
B9 2015 Estimated year-2015sub/supersonic mix
B10 2015 Estimated year-2015sub/supersonic mix
Supersonic NOx emission Index = 5(P&W data) for Mach 2.4 airplane, alt =60K average subsonic NOx from B6
Supersonic NOx from emission Index = 9(GE data) for Mach 2.4 airplane, alt =58.5K average subsonic NOx from B6
Supersonic NOx from B7 for Mach 2.1airplane, alt = 56.7K average subsonicNOx from B6
NOx for Mach 1.5 over land (46K) andsupersonic NOx from B7 Mach 2.4, alt =60K average subsonic NOx from B6
Comments
Estimated NOx for current fleet
Reflects retirements,replacements, and growth
Reflects retirements, replace-ments, and growth; assumes Im-plementation of low NOx combus-tot technology; no HSCT
Subsonic fleet size to
complement supersonic fleet
Same as evaluation B7second dataset
Modified sub/supersonic fleet mixto reflect Mach 2.1 utilization
Modified sub/supersonic fleet mixto reflect Mach 1.5 over land;modified from B7
4-UgOO27R2-76
The projected emission levels from the seven scenarios will be evaluated for their impact on theozone layer by NASA in 1989. The results will be used to determine the level of emissions required
to achieve the objective of no significant impact on the ozone layer, with the significance of any impact
being determined by the environmental community and the responsible regulating agency.Figure 5-2 provides sample results for case B7, the subsonic, supersonic mix, presenting the total
emissions of the oxides of nitrogen, with distribution at every 10 deg of latitude. The 26,000-ft altitude
data represent subsonic airplanes flying missions of 400 statute miles or less. The 37,000-ft altitude
data represent both the subsonic fleet for missions above 400 statute miles, and the subsonic legs ofthe HSCT. The 60,000-ft altitude data represent the cruise emissions of the HSCT.
Emission Reduction Impact. The impact of using engine combustion technology to reduce NOxemissions was evaluated by comparing the Mach 2.4 baseline vehicle with configurations powered by
engines designed for reduced emissions. Both P&W and GE, as their most innovative approach tothe problem, proposed an LPP combustor to reduce the NOx emissions. Details of these innovative
combustor concepts are reported in section 3.4, "Emission Reduction Concepts."The GE-proposed LPP combustor is predicted to reduce the NOx emission index from 31 to 9
(NOx index units are pounds of emission per 1,000 lb of fuel burned). GE estimated that there would
be negligible change in engine performance, weight, and economics penalties. They emphasized the
high risks in combustor development associated with premixing duct flashback and autoignition.The P&W LPP-type combustor had an estimated NOx emission index reduction from 32 to 5. This
combustor was also considered by P&W to require an aggressive research and development program.
P&W also emphasized the high risks in attempting to achieve the emission goal, and had the same
concerns as GE on the possible operating limitations caused by duct flashback and autoignition. Neg-
ligible changes in performance and economics were estimated, but an increase in engine length, com-bustor diameter, and weight were projected. These changes resulted in an increase in nacelle weightand associated aircraft structure, with a resultant growth of 3.7% in the airplane MTOW as shown
in figure 5-3. The figure also shows the results for the GE engine with no change in MTOW or any
83

\
Altitude:
26,000 ft37,000 ft60,000 ft
Total oxides
of nitrogen, 2.0Ib/day x 106
!
=
5-Ug0027R2-114
other performance-related item. The two other P&W concepts were considered to have lower develop-
ment risks and have MTOW increases of approximately 2.2% and 2.7%.While the LPP combustor shows promising reductions in NOx levels, it must be emphasized that
the development of such a combustor would require a significant research commitment, and that, as
mentioned, the high risk of premixing duct flashback and autoignition could make the concept unac-
ceptable. The staged-lean (SL) combustor provides a smaller NOx reduction for a significant MTOW
penalty, but is considered a lower risk technical challenge. The rich-burn, quick-quench (RBQQ) com-
bustor may prove acceptable with a significant NOx reduction for a smaller MTOW increase thaneither the LPP or the SL eombustor.
5.2 COMMUNITY NOISE
One objective of the current study is to explore the potential for an HSCT to be as quiet as subsonicairplanes designed to meet FAR36 Stage 3 noise levels. An evaluation must be made concerning how
this will affect the airplane size and the unique characteristics of an HSCT. Unlike the other airplaneconfigurations described in this section, the noise-impact airplanes are intentionally oversized in en-
gine airflow and, in one case, the wing area. Three models were defined that retain the same takeoff
wing loading as the baseline airplane, with increases in the engine airflow. Two models retained the
same engine airflow (680 lb/s) and decreased the original wing loading by 11.8%. Because none of these
airplanes are sized by thrust-related requirements, the only limitation on the airplane size is the range
requirement.
84

=
m_
High
risk
Abbrevlatlons:CC conventional combustorLPP lean premlxed, prevaporlzedMTOW maximum takeoff weightRBQQ rich burn, quick quenchSL staged lean
A MTOW, %2
1 --
I I I I I I I I I0 5 10 15 20 25 30 35 40
NOx emissions Index, Ib emlsslon/1,000 Ib fuel
Maximum Takeoff Weight Penalties for Combustor
Concepts With Reduced NOx Emission Index
Figure 5-3.
5-ug0027R2-116
Community Noise Goals. Two goals were persued for the analysis of community noise and the
HSCT. The first was to achieve compliance with FAR36 Stage 3 noise limits; the second was to produce
the same overall effect on the community as the Boeing 747-200 (with JTgD-7Q engines), which is certi-fied to meet the Stage 3 criteria. The latter case used the ground area enclosed by a contour (footprint),
which receives a minimum of 85 dBA of aircraft noise. The 747 airplane was selected because of simi-
larities in MTOW, number of engines, and compliance with the FAR36 Stage 3 noise requirements.
The target 85 dBA footprint area of this 747 model, using FAR36 takeoff procedures, is 4.6 mi 2.
Community Noise Summary. The FAR36 sideline noise requirement is the most difficult to meet
in that Stage 3 sideline noise limits cannot be met using maximum takeoff thrust throughout the takeoffand climbout, or even using a derated engine with sufficient thrust for a 12,000-ft takeoff field length.
The best procedure for reduction of sideline noise for the baseline airplane is a programmed lapserate (PLR) that reduces takeoff thrust after liftoff. The PLR procedure shown in figure 5-4 employs
maximum takeoff thrust during takeoff roll, then progressively reduces thrust between the 35-ft alti-tude and the end of landing gear retraction by an automatic means invisible to the flightcrew. The
airplane accelerates and climbs from the gear-up point to the thrust-cutback point 689 ft above the
runway at a horizontal distance that results in the FAR36 cutback-thrust level being achieved 21,325ft from brake release. The cutback is a full FAR36 cutback, where the airplane meets or exceeds a 4%
climb gradient with all engines operating or the airplane achieves level flight with an inoperative engine.
C " _ 85

Height aboverunway (h), ft
1,200
1,000
800
600
400
200
08,000
jVutbao:;2,,32s.
-- _ h = 689 ft
n=_n=_=_-h=_35 _ Gear up
I I I12,000 16,000 20,000 24,000 28,000
Distance parallel to runway (x), ft
Correctednet thrust,Ib/englne
52,000
48,000
44,000
40,000
36,000 m
32,000
28,000 i8,000
=_Gear up
I12,000
Cutback
h = 689 ft
Measuring point
= 21,325 ft
1 I I16,000 20,000 24,000
Distance parallel to runway (x), ft
28,000
Figure 5-4. Takeoff Profile3-Ug0027R1-75
An automatic takeoff thrust control system (ATTCS) is required in the airplane design to ensure
minimum FAR25 takeoff climb-gradient capability in the event of an engine failure. It is estimatedthat approximately a 4% thrust reduction below that necessary to meet minimum takeoff climb gradi-
ent capability is required for 20% PLR.For the Configurations using increased airflow, sideline noise was reduced by derating the takeoff
thrust so that takeoff field length is equal to that of the baseline at maximum takeoff thrust, and then
applying a 20% PLR procedure. Stage 3 limits were met nominally without trades with a configuration
that has an engine oversized by 11.7%, from the baseline of 582 to 650 lb/s (fig. 5-5). Sideline noise
is reduced by approximately 4 EPNdB, and the MTOW increases by 4.7%. The 20% PLR profile re-sults in an increase in the cutback noise level because cutback height is being traded against the thrust
reduction for sideline noise. The performance-sized airplane meeting the equal footprint area
86

930
TOGW,1,000 Ib
900
870
840
810
780
750
7204.7% Increase
to meet stage 3
114
112 --
110 --
108 --
106 --Sideline,EPNdB
104 --
102 --
100 --
98 --
96 --
94550
Figure 5-5.
!
I
Stage 3I
-_Jl1.7% airflow Increase
Full power
Derate to provide12,000-ft field length
20% PLR
I I I I I I I I580 610 640 670 700 730 760 790
Engine airflow, Ibis
Noise Impact Study Results--Penalty To Meet Sideline Stage 3 Noise Rule,
Constant Wing Loading5-UgOO27R2-100
87

objective has a 28% oversized engine (582 to 745 lb/s) with a 12.1% MTOW increase (fig. 5-6). Theprocedure that obtained the target footprint area with the smallest engine was to use the thrust derated
to that required for a 12,000-ft takeoff field length.
The effect of an 11.8% wing loading reduction was accomplished at 88 lb/ft 2 using a 680 lb/s engine
size. The resulting MTOW increase (lower thrust/weight (T/W)) more than offset the lift/drag (L/D)
benefit from the larger wing; consequently, the takeoff noise increased rather than decreased (fig. 5-7).
Airport Community Noise Environmental Study. In the airport study, residential noise exposure
was evaluated at 18 airports with the assessment made with 85 dBA noise contours (footprints). Three
930
TOGW,1,000 Ib
Area. rnP
900
870
840
810
780
750
720
8
;50
Figure 5-6.
r:,:'o',
I
, /'- 20% PLR_\./u _= TM jr /- Derate to provide I
I,,.'-, I
l ---..._.._. /- _o,,powe_ '
_,,_ _ o .
Goal _ _ _ _1_
L q-,-28% airflow Increase
I I I I I I I580 610 640 670 700 730 760 790
Engine airflow, Ibis
Noise Impact Study Resu/ts--Pena/ty To Meet 747-200 Footprint Area,
Constant Wing Loading5-Ug0027R2-101
88

r
930
TOGW,1,000 Ib
Sideline,EPNdB
9OO
870
840
810
780
750
720
112
110 --
108 --
106 --
104 --
102 --
Small wing,100 Ib/ft =
Large wing, !
88 Ib/ft = I
|
[!
_mm m _ e _ o _ _ _ • _ _mmm ° _ ° _ en em_
100 --
98 I7,500 7,700
I I I I I I7,900 8,100 8,300 8,500 8,700 8,900
Wing area, ft 2
Figure 5-7. Noise /mpact Study Resu/ts--Effect of Wing Area (Wing Loading),Constant Thrust Loading
5-Ug0027R2-102
HSCT footprints were compared to the Boeing 747 footprint. Characteristics of the HSCT configura-
tions-takeoff procedures are as follows:a. Engine sized to 650 lb/s and 20% PLR takeoff procedure (meets Stage 3).
b. Engine sized to 650 lb/s and maximum takeoff thrust (to the FAR36 cutback point).c. Minimum size engine (582 lb/s) and maximum takeoff thrust (to the FAR36 cutback point).
Footprints for the 650-1b/s-size engine are shown in figure 5-8. The HSCT footprint with the 20%
PLR procedure is very similar to the Boeing-747 footprint. The residential area exposure at levelsgreater than 85 dBA was nearly the same as the Boeing 747 (actually 6.5% less because the HSCTfootprint is slightly shorter). The maximum takeoff thrust was found to expose 43.2% less residential
89
J

00
o@4
9O
0t.O
II
0
C
I'-
UCO
"I-
|
o*
I ICOi- I I
I I
! ! -! !! !
0
0
0 ID

area based on an average of the 18 airports. It was found that, at most airports, larger residential com-
munities are downrange of the runway and the shorter footprint more than makes up for the increasedwidth. Thus, to meet Stage 3 sideline noise levels a takeoff procedure was required that increased total
airport community noise exposure and therefore inhibits using the best solution for the airport
community.
Community Noise Study Conclusion. The study indicated that Stage 3 noise levels are technically
feasible with the current projections for noise suppression technology. Stage 3 can be accomplished
by oversizing the engine and using the 20% PLR takeoff procedure.A preferable solution would be to make improvements to the suppression design, and also, the
implementation of regulatory changes to permit higher sideline noise at the airport so that lower com-munity noise levels may be achieved. A supersonic Stage 3 noise rule that takes into account the
HSCT's unique ability to climb away from the community would have the dual benefit of reducing
the impact on the community and improving the economics of the airplane.
5.3 SONIC BOOM
A further objective of the study was to determine what combination of design technology and op-erational constraints will allow a variation of the baseline HSCT to cruise over land at supersonic speed
without causing public objections. The Concorde was not designed with any direct consideration ofminimizing sonic boom. Current laws, inspired by the Concorde experience, prohibit supersonic com-
mercial flight over many countries. Because the baseline HSCT of this study produces an unacceptable
sonic-boom overpressure of about 2.4 lb/ft 2 at the start of cruise, it would be limited to supersonic
cruise only over water. The productivity reduction would be significant compared with unrestricted
HSCT flight. This study examined several options for reducing the sonic boom shock wave amplitude
to an arbitrary target (1.0 lb/ft2). It is recognized that sophisticated criteria must be developed to ac-
count for the combined effect of the shock-wave amplitude and waveform on humans, animals, andstructures. Further, the more complex case of supersonic segments of climb and descent must alsobe considered.
Sonic Boom Loudness Study. Before an HSCT can fly supersonically over land, acceptable acoustic
disturbance criteria and an acceptable acoustic level must be defined. Within the scope of this con-tract, Boeing has not conducted human response testing to establish acceptable criteria. Therefore,
design goals were based on previously published human response testing (ref. 5.1), using perceivednoise in terms of dBA level as an indication of loudness, and is defined as follows:
a. Noise levels must be equal to or less than 72 dBA for restricted overland flight (corridors).
b. Noise levels must be equal to or less than 65 dBA for unrestricted overland flight.c. Pressure fluctuations in the infrasound frequencies (10 to 20 Hz) must be equal to or less than that
proposed during the Paris Colloquium, 1973 (ref. 5.1).
The loudness of various sonic boom overpressure signatures was evaluated by reducing them to
their spectral content and then to a dBA level.Wave shape parameters (i.e., overpressure, duration, and rise time) were assessed to determine
their effects on loudness. It was found that rise time and overpressure had the largest impact. Current
prediction methods for sonic boom propagation assume rise times of zero, but data have indicatedthat rise time increases as cruise altitude increases. It is believed that atmospheric absorption and/or
turbulence are the reasons for a finite rise time. For this study, only the nominal acoustic disturbance
was studied. The effects of atmospheric propagation, such as the variations in wind, density, and
low-altitude turbulence were not considered. Consideration was given to a range of rise times.
91

Low-Sonic-Boom Design Results. The performance of an airplane designed for low sonic boom
was evaluated against the Mach 2.4 baseline. Configuration changes necessary to reduce thesonic-boom impact have had some effect on the MTOW, wing size, and engine size required to meet
the design objectives.
The low-sonic-boom design approach used in this study is an "inverse design" process. A target"acceptable" sonic-boom waveform was defined with shock wave amplitudes of approximately 1.0 lb/
ft 2 (but with maximum overpressure greater than this), and a "rational" configuration was derived that
produced the target waveform. The sonic boom constraint has a significant effect on the configuration
design and flight conditions allowed.Two low-sonic-boom configurations were initially investigated, one for cruise at Mach 1.5 over land
and another for cruise at Mach 2.4 over land. Both configurations could cruise at Mach 2.4 in unre-
stricted operations (over water).The limiting criterion is dBA, not infrasound, and the level chosen for the low-sonic-boom design
study was 72 dBA for limited overland flight (corridors) instead of the 65-dBA unrestricted criterion.
The shock wave amplitudes must be less than 1.0 lb/ft 2 with a rise time of 6 ms to achieve 72 dBA.
Acceptable low-sonic-boom waveforms were explored with respect to cruise conditions, aerody-namic lifting length requirements, and configuration design at Mach 1.5 and Mach 2.4. The particular
sonic-boom waveform chosen as a design goal permits designs with realistic fuselage lengths and wing
planforms. This waveform is the "peaky" or minimum shock waveform (fig. 5-9), which allows for heavygross weight, and has a relatively short lifting length (about 250 ft at Mach 1.5). The "flat-top" wave-form (fig. 5-9) has been considered for application to low-sonic-boom design, but requires significantly
longer lifting length and fuselage length (or lower weight) to achieve 1.0 lb/ft 2 shock wave amplitude.
Low-Sonic-Boom Configurations. The configuration studies focused on a Mach 1.5 overland de-
sign because of the more reasonable fuselage length requirement and because only minimum changesto an arrow wing were required. The resulting airplane is shown in figure 5-10. Compared to the
Overpressure, Ib/ft z
0
-1_ Distance or time
Peaky or minimumshock waveform
t A = 1.0 Ib/ft =
1
Overpressure, Ib/ft= -i
IDistance or time
Flat-top or minimumoverpressure waveform
92
Figure 5-9. Target Waveforms
3-Ug0027R1-77

Scale, ft
0 25 50 100
I I I I
-, 0
Figure 5-10. Low-Sonic-Boom Configuration4-ug0027R3-107
baseline, the forebody was lengthened by 10 ft and widened slightly, a wing strake was added, nacelles
were staggered, and an arrow planform was used for both the wing and horizontal tail.
This design concept provides an airplane configuration that produces no strong shock waves ex-cept at the aircraft nose and tail. This requires that the lift disturbance must be spread over approxi-
mately 250 ft length (at Mach 1.5) to minimize its effect and must be located properly with respectto the aircraft nose.
The actual pressure signature and resulting loudness predictions at Mach 1.5 are shown in figure5-11. The loudness is shown versus shock-wave rise time, because rise time is such an important factorin loudness calculations. The intermediate shocks and the tail shock must be reduced to achieve the
target loudness.The buildup of the configuration in an equivalent cross section for the Mach 2.4 overland design
results in a forebody that is long and wide, resulting in increased drag. The wing is located so far back
on the body that balance becomes an issue. Because of the severe design problems, this configuration
was not pursued further. Additional work would be required to reduce the tail shock and to eliminatethe intermediate wing shocks by tailoring both volume and lift distributions more accurately.
Operational Considerations. The current low-sonic-boom configuration design is a "cruise pointdesign"; that is, it must be flown at a specific Mach number, altitude, and gross weight to achieve thelow-sonic-boom waveform at the ground. Off-design operations that require significant variation in
cruise altitude, Mach number, or gross weight may result in a significant increase in shock intensity.
The sensitivity of these designs to such variations needs to be studied before the viability of these con-
figurations can be evaluated.The cruise procedure will also affect the sonic-boom waveform. For example, for constant altitude
cruise, the lift decreases as gross weight decreases, and the waveform will approach the fiat-top wave-form at the end of cruise. There is a smaller change in the waveform for constant CL cruise (fig. 5-12).
93

Overpressure,Ib/ft 2
Baseline at Mach 2.4
-'_ Target
I _c¢,_ _. _ Low-sonic-boom
o_ -,o'o ; ,_o _ ' "_" _o
-2Pressure Waves at Ground
Calculatedloudness, dBA
85--
80--
75--
70 m
%%%% Baseline at Mach 2.4
%% B /'- Low-sonic-boom
/_ I """,,_'_,,_ °n"gura"°n
Goal
65_
I I I I I I0 2 4 6 8 10 12
__. Real atmospheretypical varlatlon
Shock wave rise time, msec
14
Resultlng Loudness
F/gure5-11. Mach 1.5 Pressure Signature and Loudness Predictions
4-UgOO27R2-78a
94

Overpressure,Ib/ft= 0
-1
-2
650,000 Ib
_ 550,000 Ib
I I _ /---450,0001b
-)oo - ' = I\ ' ,n=-J--o lOO ,oo\ lil-x=ft X I,,
i s
e. Constant Altitude Cruise
I500
Overpressure,Ib/ft = 0
--2_
2 w
I-100
h,_k 650,000 Ib, 48,000 ft
_ _--550,000 Ib, 51,400 ft aC L 0.2
I5000 100 200 \\ 300 F
X=ft
b. Constant CLCrulse
Figure 5-12, Effect of Cru/se Procedure on Pressure Wave at Mach 1.54-UO0027R1-78
95

Performance Impact. The airplane was sized with 268 passengers because the elongated body re-quired for reduced sonic boom had space for an additional 21 passengers. Comparison to the Mach2.4 baseline airplane is shown in figure 5-13. These data show that the increase in MTOW for the
low-sonic-boom airplane is about 3% at constant payload.
Sonic-Boom Study Conclusion. The results of the low-sonic-boom configuration design studies areas follows:
a. Low-sonic-boom design features include an arrow wing for long lifting length, long forebody, stag-gered nacelles, lifting arrow wing horizontal tail, and a smooth overall area distribution.
b. At Mach 1.5, only minor changes to a Mach 2.4 arrow-wing configuration are required to approach
the desired sonic-boom waveform. Significant weight, length, and balance penalties are expected atMach 2.4.
c. An arrow-wing configuration may have the potential for Mach 1.5 cruise over land with signifi-cantly reduced sonic boom and Mach 2.4 cruise over water.
d. Further design study is required to achieve the loudness level goal (reduction of intermediate and
tail shock intensities). Additional work is required to define the optimum overland supersonic
Mach number to determine performance-weight penalties, and to understand the effect of opera-tion at off-nominal design conditions.
e. Because of the preliminary nature of these results, subsonic operation over land should continue tobe assumed.
MTOW, Ib
880,000
860,000
840,000
820,000
800,000 --
780,000 --
760,000 --
740,000230 240
Low boom
arrow wing -_
" 24,000 Ib
I/
//
/
I I250 260
,,o/
//
//
//
//
//
//
/
Figure 5-13.
//
/
Mach 2.4 baseline
I I I I270 280 290 300
Trlclass passengers
Parametric Payload--Gross Weight Trends
310
I320 330
4-Ug0027R 1-79
96

6.0 ECONOMIC EVALUATION
The high-speed civil transport (HSCT) has one primary benefit to offer the travelling public--areduction in the often tedious time spent on longer range flights. The idea that trip times of over 10
hr could be cut by half or more is an appealing prospect. Time savings of this magnitude offers the
business traveller increased opportunity for productive work and the pleasure traveller increased timeat his or her destination. Cities now 12 to 18 hr apart would become closely linked, with traffic stimu-
lated by the ease of flying between them.Future HSCTs must be both environmentally acceptable and economically competitive with the
subsonic fleet. Past ventures into supersonic transports have not met these requirements, and, as a
result, have not met with great market success. The economic evaluations of the HSCT concepts devel-
oped under this contract are founded on the belief that the HSCT must be able to survive in a competi-
tive marketplace alongside advanced subsonic transports.
6.1 THE EVALUATION CONCEPT
For the HSCT to attain economic success, it must be able to earn a return on investment (ROI)
at least equal to the return that could be earned by operating a subsonic airplane on the same route
system. This concept is fundamental to the analysis methods used in evaluating the economic worthof the HSCT designs produced in this study.
Life-Cycle Operating Costs. The concept of life-cycle operating costs has been developed to satisfythe need for an economic comparison method that accounts for the actual cash direct and indirect
costs incurred in operating an airplane as well as including all "ownership costs."Cash direct cost elements include--
a. Flightcrew costs.b. Fuel burned.c. Airframe maintenance.
d. Engine maintenance.e. Hull insurance.
Cash costs incurred in servicing the airplane and the passengers are usually referred to as indirect
costs. They may be separated into airplane-related costs (cleaning and fueling costs, aircraft handling,
maintenance, and ground-handling equipment), and passenger-related costs (passenger food, passen-
ger handling, agency commissions, and passenger insurance). Indirect costs can contain 14 to 15 sepa-rate accounts. Figure 6-1 schematically shows the cash operating costs that an airplane would incur
over its operating life. These costs will probably escalate over time, but it is the usual practice to repre-
sent the operating cost of an airplane by a value that is the estimate of the operating cost in the first
year of operation.Ownership cost is defined as the dollar amount needed to pay off principal and debt on the air-
plane, provide for growth and eventual airplane replacement, and pay dividends to stockholders. Anairline that earns enough revenue to cover both cash costs and ownership costs can be expected to
remain a "going concern."With the economic environment assumed for this study, rather than calculating each of these own-
ership cost items explicitly for each airplane comparison, Boeing has found that a revenue level that
provides a 12% ROI is sufficient to satisfy the going concern requirements. This ROI is calculated
using a discounted cash flow, "internal rate of return" process.The incremental revenue (beyond that required to cover all cash costs) needed to meet the ROI
target is the ownership-related portion of life-cycle operating costs.
97

Cumulativeoperatingcosts
Toal llfecycleoperating cost _ _ _ _
Total cash
operating
-- Representativefirst year value(operation only)
Revenue Incrementrequired to provide desiredreturn on investment
Passenger-relatedIndirect costs
Airplane-relatedIndirect costs
Enginemaintenance
Airframemaintenance
Fuel
Flightcrew
0 1 2 3 4 5 6 7 8 9 10 11 12 13 14 15 16 17 18 19
Year of operation
Figure 6-I. Example of Operating Cost History and Revenue Required To Cover All Cost Elementsand Provide Des/red Return on Investment
3-UgOO27R2-60
Given the cash operating cost stream and the airplane investment (price plus initial spares), the
incremental revenue stream required for the airline to earn the desired ROI can be calculated. Thisincremental revenue is the ownership-related portion of life-cycle operating cost. The total revenue
stream (cash coverage plus ownership-related revenue), when represented by its first year value, is
defined as the total life-cycle operating cost (fig. 6-1). Airplanes with equal life-cycle operating costsare seen as equally competitive economically, although the total life-cycle operating cost may be com-
posed of quite different cash cost and ownership-related portions. (A low-operating-cost airplane with
a high price may have the same life-cycle operating cost as a high-operating-cost airplane with a low
price.)
The Economic Horizon. The airplane in each size category with the lowest value of life-cycle operat-
ing cost becomes the competitive target for other new airplanes within that size category. When taken
across size categories, the collection of airplanes with the lowest life-cycle cost form the "economic
horizon." This is the level that new airplanes must meet to be economically competitive. For the HSCT
study, two advanced subsonic airplanes were chosen to anchor the ends of the competitive horizoncurve. These aircraft, the 767-XXX and the 747-XXX, are both advanced derivatives of present sub-
sonic airplanes that span the size and range categories defined for the HSC'£
98

Figure 6-2 shows the economic horizon plotted on a "fan chart" of a life-cycle operating cost; thehorizon curve connects the two advanced subsonic airplanes. (The connecting curve is linear when
plotted as life-cycle operating cost versus seats, and becomes hyperbolic on the fan chart.) With theanchor points defined, an advanced subsonic baseline airplane can be created with any number ofseats between the 767-XXX and 747-XXX. Because most of the HSCT designs to be evaluated have
247 seats (triclass), the figure shows a 247-seat airplane defined on the horizon line. The operating cost
elements and price of this baseline airplane are linear interpolations between the two "anchor"
airplanes.
Defining the Economic Evaluation Model. With a 247-seat, baseline advanced subsonic airplanedefined on the economic horizon, a base fleet economics case can be created. The subsonic airplane
was run on the HSCT scheduling model to define the parameters of the subsonic fleet necessary to
serve the forecast city-pair demand. Several of the assumptions used in the model are important tothese definitions:a. Constant demand. The demand in each city-pair market is held constant as each airplane type
(subsonic or HSCT) is "flown" on the route system. As a result, total system revenue is constant.b. No "spill." All the demand in each city-pair market must be carried, but no single flight can exceed
the target load factor. If the demand for any flight causes the load factor to exceed the target,
another flight is added.c. All airport curfews must be observed. Curfews now in force are observed, but new curfews are not
projected.
Given the operating cost elements, price, and fleet size (required for the advanced subsonic base-line to serve the market), the revenue level required to earn an airline a 12% ROI can be computed.
With the fleet revenue now fixed (and set by the 12% ROI requirement of the advanced subsonic
baseline fleet), the relationships among the fleet cost, revenue, and fleet-investment variables can be
Life cycleCOSt,
¢/ASM
/ / /200 250 300seats
767-XXX)sonic
_asellne
/ /350 400
50
Economic horizon
500
/747-XXX
S/statute mile
Figure 6-2. Life Cycle Cost4-U90027-62
99

r ....
FZ
_p
defined. For any airplane serving the same demand on the system, the airplane investment allowed
while still retaining the 12% ROI target can be expressed in the form:
MV = (K1 + K2 x FC + K3 x OC + K4 x RF)/units
where MV
K1 =K2 =
FC =
K3 =OC =
K4 =RF =
units =
- market value (the investment that will meet the 12% ROI)constant (market value with zero costs)
slope of market value with fuel costfleet fuel cost in millions of dollars
slope of market value with nonfuel costsfleet nonfuel cash costs in millions of dollars
slope of market value with revenue level
factor applied to base revenue level (%)airplane units required to serve the demand.
The linear form of the market value equation allows the HSCT designs to be evaluated in termsof airplane market value at the base revenue level (RF = 0), or the revenue factor required to make
the market value equal to the airplane investment given a price estimate for the airplane. With price
plus initial spares for the fleet substituted for MV in the above equation, RF can be easily computed.The graphical analogue of this mathematical process is to define the HSCT airplane price or revenue
level that places the HSCT life cycle operating cost on the defined economic horizon curve.A higher revenue level for the HSCT, such as that which would result from an increase in HSCT
route ticket prices (RF > 0), adds a third dimension to the life cycle operating cost fan chart, effectively
(and rapidly) raising the economic horizon for the HSCT.
6.2 RESULTS OF THE ECONOMIC MODEL
The economic evaluation model was used in all phases of the contract to define the market valueof the HSCT designs, as well as the revenue factor required to attain the desired ROI for those designs
for which prices were estimated.
The HSCT airplanes evaluated in this contract were products of three phases of design effort. The
early screening examined a set of airplanes designed for cruise Mach numbers of from 2.0 to 10.0. Thesecond design phase concentrated on airplanes with cruise Mach numbers of 2.4 to 3.8, and the third
phase focused on cruise Mach numbers of 2.4 to 3.2. The fleet revenue level set by the subsonic baseline
changed slightly from one phase to the next, as refinements were made in the scheduling model, the
airplane routings, and the underlying cost forecasts. The results shown here reflect the final resultsof the airplane evaluations.
The revenue required for the subsonic baseline to meet the 12% ROI target is 9.07e/revenue pas-
senger miles (RPM) (1986 dollars). This revenue level defines the base revenue environment for all
247-seat HSCT airplanes. Figure 6-3 shows this derived value compared with the reported average
yields from seven U.S. carriers. The reported average yields are much lower than the published farebecause of (1) the traffic mix (the majority of passengers are paying economy or excursion fares),
(2) fare dilution (nonpaying airline personnel and frequent flyer bonus trips), and (3) prorata revenue
sharing (sharing of the total fare by two or more carriers on the passenger's itinerary, but not propor-tional to the distance the passenger is carried).
In the initial commercial value study, application of this model to HSCT vehicles designed forMach 2.0 to Mach 10.0 cruise revealed that the high- Mach-number (Mach > 4.0) vehicles could not
possibly compete economically with an advanced subsonic airplane. Market values computed for thesevehicles in the base revenue environment were very large negative values, requiring increases in reve-
nue of 300% to 500% to be competitive. The high values of cruise Mach numbers did not result in
large increases in productivity, given the limits on supersonic flight over land, design-range
100

12
11
10
Averageyield, 9¢/RPM
8 m
7 --
6 --
52,000
Figure 6-3.
• United Airlines (Pacific)
Pan American (International)• • Continental (Pacific)
• Pan American (Atlantic)
• Northwest (Pacific)
• Northwest (International) I HSCT system
I baseline revenue• Trans World • Delta O
(International) (Atlantic)
Northwest (Atlantic) • American (Atlantic)
• Continental (Atlantic)
I I I I I I
2,500 3,000 3,500 4,000 4,500 5,000 5,500
Average passenger trip distance, SM
HSCT System Baseline Revenue Required Compared With Reported Yield--Yield Data
of September 19874 -U90027 R 1-63
constraints, and acceleration limits. The slightly higher productivity of these vehicles could not over-
come the high gross weights, fuel consumption, and maintenance costs associated with them.
Figure 6-4 shows the results of applying the economic evaluation model to the initial airplanes,all designed for year 2015 certification. The combination of very high takeoff gross weight needed for
the 4,500-nmi mission and the high price of cryogenic fuel results in a -$1.5 to -$2.0 billion market valuefor the highest speed airplanes. Gross weights ranged from 1.6 million pounds at Mach 6.0 to 1.75 mil-
lion pounds at Mach 10.0. Cryogenic fuel prices ranged from 16.8¢/1b for liquid methane at Mach 4.5
to $1.02/1b for liquid hydrogen at Mach 6.0 and Mach I0.0. This evaluation provided the evidence need-ed to justify restricting the Mach number range studied during the remainder of the contract period
to 2.4 to 3.2 (3.8 for year 2015 certification).
This model was used as the final screening tool to determine the economic acceptability of eachHSCT design, and also, to define the sensitivity of the economic measure (revenue required to meet
the ROI target) to variations in design Mach number.
Value of Speed and Seats. A set of airplanes was designed to meet common requirements of pay-
load and range (247 seats, 5,000 nmi) at 2.4, 2.8, and 3.2 cruise Mach number. Evaluation of these air-planes provides an economic assessment of the value of speed when traded against the penalties of
higher speed design (weight and cost). In figure 6-5, the fleet size and investment requirements of the
airplanes are shown, assuming a year 2000 certification. A single Mach 2.4 airplane of 301 seats and
5,000-nmi range was designed to show the effects of adding seats. The data shown in the figure are
normalized using the 247-seat, Mach 2.4 airplane with a 5,000-nmi design range as a base. The effect
of skin temperature as a function of design Mach number is reflected in the fleet operational assump-
tions, with turn-through time set at 1 hr for the subsonic baseline and the Mach 2.4 airplane, 1.5 hr
for the Mach 2.8 airplane, and 2 hr for the Mach 3.2 airplane.The design penalties associated with Mach numbers above the Mach 2.4 baseline (increased
weight, engine size, and price) and the associated operational penalties assessed (increased turn time
101

+ 2.0 billion
Airplanemarketvalue, $
Fuel type
/--- JetA
/ /-- TSJF+ 50"F
/ / /--'TSJF+IOO'F
l / / /--TSJF+ 50"F
_ f Uquid CH4
Subsonic baseline
S LH2
-20_,lo_ I I I I I I I I I !0 1 2 3 4 5 6 7 8 g 10 11 12 13
Design Mach number
Figure 6-4. Airplane Market Value in Revenue Environment Set by Subsonic Baseline-Early Screening
14 15
5-UgOO27R3-64
,-i-
Relative fleet size
5O
40 --
30 --
20 --Speed studyairplanes varying
10 --_
0 t
-10 -
-20 .... I
2.4 2.8
Design Mach number
3.2
Figure 6-5.
30
d
I 10 I
0q
-10
-202.4
Relative airplane investment
50 [40-
Speed study-- airplanes varying j L
turn gm_
I2.8 3.2
Design Mach number
Relative fleet investment
50L spe_u_y j40 | airplanes /
| varying turn _"
10
"1°_ 1_ 1-20
2.4 2.8 3.2
Design Mach number
Fleet Size and Investment Relative to Baseline Speed Study Airplanes - Optimistic Prices
Based on 500 Units
4-Ug0027R1-65
102

1
because of skin temperature) combine to give a fleet-investment penalty of 45% for the Mach 3.2 de-
sign. The Mach 2.8 airplane fleet investment penalty is more modest at only 27%.The advantage of more seats is obvious, with the higher price of the airplane offset by the lower
fleet size needed. Fleet investment is roughly 2% below the base 247-seat airplane.The ability of the HSCT designs to compete in the market is measured by the yield level required
to earn a 12% ROI. The amount of increased yield required above the subsonic fleet baseline yield
is a measure of the amount of restriction imposed on the HSCT market by the requirement to chargehigher than normal (subsonic) fares. The effect of design Mach number, design range, and number
of seats on the required yield level is shown in figure 6-6. Figure 6-6(a) shows data for the three 247-seat
airplanes from figure 6-5 designed for a 5,000-nmi range. The most effective of these is the Mach 2.4
design, with a required yield level of I=I.8¢/RPM, a 30% increase over the subsonic fleet yield. As acontrast, the Mach 3.2 design requires a yield level of 15.9¢/RPM to earn a 12% ROI, an increase of75% over the baseline level.
Figures 6-6 (b) and (c) show the effects of design range and number of seats on the Mach 2.4,5,000-nmi-range airplane. Figure 6-6(b) illustrates how reducing the design range requirement to4,500 nmi reduces the yield required from 11.8¢ to ll.4¢/RPM; increasing the range to 5,500 nmi in-
creases the yield requirements to 12.2¢/RPM. Designing for a lower range reduces the required weight,
price, and operating cost. More airplanes and more trips are required to serve the market, however,with a resulting penalty in the yield required per passenger. An airplane with a 4,500-nmi design range
still requires a yield increase of 26% over the baseline level.
Figure 6-6(c) shows that increasing the number of seats to 301 reduces the required yield toll.3¢/RPM. The design penalties of the heavier airplane are offset by the fact that fewer units and trips
are required, lowering the required yield per passenger.
Sensitivity Studies. As part of the economic evaluations, airplanes were designed that departed
from the optimum use of given technology and a target- based design philosophy so that other goals
could be met. Figure 6-7 shows the yield required to meet the 12% ROI target for a group of airplanes
designed for lower community noise by either oversizing the engine or oversizing the wing. The year
2000, Mach 2.4 "point design" airplane (247 seats with a 5,000-nmi design range) is used as a compari-
son point. The community noise of each design is noted on the figure. The point design requires ap-proximately a 30% increase in revenue over the subsonic baseline; the largest of the community noise
airplanes requires approximately a 41% revenue increase.
_aX
oee
#04v-
-I
(a) Effect of speed
15 --
14
13
12( r'- airplanes varying
I turn time
10 Subsonic fleet
baseline _eld9
8 I2.4 2.8
Design Math number
Figure 6-6.
16(b) Effect of design range
16
14
13
12
"I
(c) Effect of seats
Subsonic fleet w Subsonic fleet
baseline yield 9 ='_ baseline yield
I I s 1 I I3.2 5,000 5,500 225 250 275 300 325
Design range-nml Seats
Sensitivityof Required Yield to Design Parameters Mach O.9, Overland Waypolnt Routing-Optimistic Prices Based on 500 Units
4-UgOO27R2-66
103

18
17
16
15
14
Yield requiredfor 12% ROI, 13¢/RPM
12
11
10
9
8TOGW, IbEngine airflow, Ib/sWing area, ft2Afrom stage 3, S/L
Notes: Legend:• 1-hr turn time _ Designed for lower community
noise from oversizing engine
Designed with oversized wing
11.81
Mach 2.4baseline
11.8412.3
12.76 12.79
745,000 751,849 796,466 850,480 852,389582 600 680 770 68O
7,466 7,534 7,981 8,523 9,680+ 1.7 + 1.1 -0.8 -2.6 + 3.9
9.07
Subsonicbaseline
Figure 6-7. Sensitivity of Revenue Required for 12% Return on Investment to Requirement forReduced Community Noise
5-UgOO27R24B7
Two airplanes designed for low emissions (using special low-emission engines)were evaluated. Us-
ing figure 6-7's same Mach 2.4, 247 seat, 5,000-nmi range design as a baseline, figure 6-8 shows theseresults as the yield required for 12% ROI. The innovative engine combustors obtained their low-
emission characteristics by the premixing and prevaporization of fuel and by burning lean. For the
Pratt & Whitney (P&W) powered vehicle, there are penalties in engine weight and length that result
in a vehicle maximum takeoff weight (MTOW) penalty of 28,000 lb. This results in 10% more revenue
being required. General Electric (GE) imposed no penalties for their reduced emission combustor,
so no takeoff weight or revenue penalties are assessed.The sensitivity of economic measures to operational and design assumptions was also evaluated.
A basic assumption of the contract study was that supersonic flight over land was prohibited. This
requires that avoidance paths be flown between cities, keeping the airplane over water as much aspossible. Those overland portions of the flight path were flown subsonically (Mach 0.9). This first-or-
der rerouting was quite successful, reducing the overland portion of the total route system from 50%
to 20% with only a 9% increase in total miles flown. However, many individual key routes (particularlyEurope to the Far East) either retained a large percentage of overland flight or incurred large increasesin miles flown.
An evaluation of the economic effect of restricting overland flight is shown in figure 6-9. The com-
parison shows the revenue required to reach the 12% ROI target for the Mach 2.4, 247 seat, 5,000-nmi
range design airplane. The first bar shows revenue (yield) set by the subsonic baseline fleet. The second
bar illustrates the yield required at the standard HSCT flight path condition: sonic boom avoidance,
waypoint routing, and Mach 0.9 cruise over land. The third bar shows the yield required if the HSCTcould fly with no restrictions, taking Great Circle paths and cruising at Mach 2.4 over land. The fourth
bar shows theyield required for a Mach 2.4 tow-boom airplane designed to fly at Mach 1.5 over land
with waypoint routing. This airplane can accommodate 268 passengers because of its reshaped
104

/
18
17
16
15
14Yield requiredfor 12% ROI, 13cents/RPM
12
11
10
9
8TOGW, IbEngine airflow, IbisWing area, ft 2TOFL, ft
Figure 6-8.
m
Legend:
_ Designed for loweremissions (newengine design)
B
m
m
m
11.81
P&WMach 2.4baseline
12.08
N.N
N12.78
GEMach 2.4baseline 9.07
12.78
INW
812,700671
8,23311,769
I I745,000 773,000 812,700 Subsonic
582 600 671 baseline
7,466 7,648 8,23310,695 10,890 11,769
Sensitivity of Revenue Required for 12% Return on Investment to Requirementfor Reduced Emissions 4-Ug0027R2-3
15
10
Revenue requiredfor 12% ROI, ¢/RPM
9.1
11.8 11.7
11.5
(268passengers)
10.4
11.1
m _ m mm
Subsonic HSCT HSCT HSCT HSCTbaseline baseline baseline low boom low boom
TOGW, Ib 400,000 745,000 745,000 816,000 816,000Mach over water 0.84 2.4 2.4 2.4 2.4Mach over land 0.84 0.9 2.4 1.5 0.9Overland boom level NA NA Unacceptable ? NAPassengers 247 247 247 268 268
Figure 6-9. Revenue Required for 12% Return on Investment--Low-Sonic-Boom Design4 -U9OO27 R 1-68
105

x
fuselage, and so gains from both the increased passenger revenue as well as the added productivity
of higher speed over land. The yield level required for this airplane is lower than the yield required
for the Mach 2.4 HSCT baseline airplane (with 247 or 268 seats). The fifth bar reveals the worst case;
in spite of designing the low-sonic-boom airplane for acceptable overland flight, the sonic boom signa-ture turned out to be unacceptable, and the airplane had to be flown at Mach 0.9 over land. The higher
weight is now not offset by higher productivity, and the yield required is almost the same as the baseline
HSCT in spite of the extra 21 seats on board.In another sensitivity study, the design and operating assumptions of a year 2000, Mach 2.4 airplane
(247 seats with 5,000-nmi design range) was varied parametrically to determine the effect on the eco-
nomic measures. Figure 6-10 shows the results of one set of parametricvariations in the airplaneweight
(a decrease of 10% in the operating empty weight (OEW), in airplane price (25% reduction assumed),
and in operating load factor (a 5% increase)). Again, the measure is revenue required to reach a 12%
ROI target. The changes are cumulative left to right, and bring the required revenue increase from11.8¢ to 9.7¢/RPM, a decrease of 18%.
Study ground rules stipulated that a single-fuel-price environment be used when determining the
potential HSCT market. While it is recognized that a high-fuel-price environment could substantially
reduce the market size for an HSCT, fuel price sensitivities were not performed in this study. Basedon continuing inhouse studies, the study team believes the HSCT market is resilient to moderate in-
creases in energy prices.
Economic Closure by Market Segmentation. The division of seat class and revenue from each classin the standard 247-seat HSCT configuration is shown below:
First Class Business Economy
Seat percentage 6.8 19.3 73.9Revenue percentage 16.1 23.4 60.5Demand served: 100% of all fare classes.
Average yield: 9.07¢/RPM (subsonic fleet baseline without ticket price increase).
Revenue increase required to meet ROI target = 30%.
Revenuerequired for 12%ROI. ¢/RPM
13
12.5
12
11.5
11
10.5
10
9.5
9
8.5
8 --
Flgure 6-10.
106
Revenue level set by subsonicbaseline airplane at 9.07 ¢/RPM• 1-hour turn time
11.8
11.2
Legend:
I_ Technology
Operations
Base HSCT -10% OEW
10.2
9.7
25% price +5% loadreduction factor
Sensitivity of Revenue Required for 12% Return on Investment to Design,Operational, and Price Assumptions
4-Ug0027R 1-69

i-
f
This seat-percentage split reflects the actual split in passenger demand of the different fare classes,
with the majority of the demand being for economy-class seats. The revenue from economy seats,although taking up almost three-quarters of the airplane, provide only just over 60% of the revenue.
If a modest increase (10%) was made in the first- and business- class fares, and if the first- and busi-ness-class sections of the airplane were expanded so that the economy-class demand was not entirely
accommodated, then the average revenue level would be enriched by the enlarged percentage of the
higher priced fare classes. (This approach assumes that the increase in fares will be reflected directly
as an increase in yield.)
Figure 6-11 illustrates how the average yield can be increased by raising first- and business-classfares by 10%, and raising the economy-class fares by the percentage indicated. The percentage of econ-
omy-class seats is decreased with a resulting reduction in the percentage of market share captured
by the HSCT. The yield-available curve does not include deep discount fares. The per passenger yieldlevel required to meet the ROI target increases as market share drops, because there are fewer passen-
gers on any given flight and the physical airplane remains the same. With about an 18% economy ticket
price increase and a 22% economy market share, the yield required for 12% ROI equals the yield avail-able, (given a year 2000 certification technology level); the airplane is economically viable with a 49%market share and a worldwide sales base of 650 to 750 units. While this would be an adequate demand
for a single manufacturer, it is not adequate for two or more.
The tactic of yield enrichment by excluding economy-class passengers brings with it operational
problems from the airlines' point-of-view, and problems of design and marketing philosophy from themanufacturers' point-of-view. For example, an airline operating an HSCT that was designed to accom-
modate less than half the total demand would have to provide another (subsonic) airplane type on the
same route to carry the remaining demand, probably consisting of mostly low fare economy- and excur-sion-ticket classes. The "fleet efficiency" of the high-utilization HSCT is reduced by the requirement
to provide two airplane types to serve a single market.An HSCT designed with today's technology (1995 certification) (curve in fig. 6-11) requires more
than a 40% increase in economy-class fares, and a 10% increase in first- and business-class fares. The
2O
18
16
Average 14yield, ¢/RPM
12
10
Figure 6-11.
• 65% load factor
• Based on 50% tlme savings
Yieldavailable
20%
Today' s technology
Economy classfare Increases
Yield
requiredfor 12% ROI
Year-2000 certification
10%
Year-2015 certlflcatlor
1_ Subsonic 250 to 350 650 to 750 950 to 1,050fleet units units unitsyields ] I
0 25 50 75 100
Market captured by HSCT, %
Economic Viabi/ity--Techno/ogy Impact on F/eet Size Based on Mach 2.4, 247-SeatDesign With 5,000-nmi Range
4-UgOO27R3-70
107

marketdecreasesto thepointthatonly250to 350unitsarerequiredto serveit. A productionforecastofthissizeisriskyfor anysinglemanufacturer,andcouldbedisastrousif morethanonemanufacturerenteredthemarket.
Theprojectedtechnologyavailablefor year2015certificationcaptures75%of thetotal passengermarketwithonlyaboutan8%increaseineconomy-classfares,anda 10%increasein first- andbusi-ness-classfares.The950to 1,050unitsrequiredto servethis marketis aworthygoalfor oneor twomanufacturers.Theyear2015technologyprojectionalsoshowshowaderivativeof anHSCTmodelintroducedin theyear2000mighttakeadvantageof improvedtechnologyto betterits economicandcompetitiveposition.
Theimpactof designMachnumberon theyieldrequiredto earna 12%ROI andon themarketcapturedbytheHSCTisshownin figure6-12.Year2000certificationisassumedfor allHSCTdesignsin figure6-12aswellasaconstant10%fareincreasefor first- andbusiness-classpassengers.Theecon-omy-classfare increase,marketcaptured,and unitsrequiredto servethat marketareshownin thefigure.Increasingthespeedfrom Mach2.4to Mach2.8booststheeconomy-classfareincreaseto over25%andreducesthemarketcapturedto 30%,requiring400to 500units.TheMath 3.2designdoesnotclose,asthefare increaserequiredto earnthe12%ROI reducesunitsrequiredto thepointthatthepriceperunit is risingmoresteeplythantheyieldavailable.
Thekeyassumptionbehindtheeconomicclosuretrendsshownin figures6-11and6-12is thetradeof marketshareagainstticketpricefor a50%timesavings(discussedin section2.0;fig.2-24).If thedeclinein marketsharewith higherticket priceis steeper,thenthe"yield available"curveof figures6-11and6-12mayhavealowerslopewithdecreasingmarketshare.Thiswouldmovetheclosurepointto evenlowervaluesof marketshareandsalesbase.
Figure6-13showstheimpactof technologydevelopmentonthetotalHSCTfleetrequiredfor theyear2015market.Thetechnologyimprovementfor theMach2.4designsfrom thepresentto ayear2000certification airplane more than doubles the fleet required, and continued technologydevelopmentfor theyear2015airplanealmostdoublesthefleetagain,asrequiredfare levelsfor a12%ROI decrease.A Mach3.2designis penalizedbyhigherweightsand complexity,which is not
2O
Averageyield, ¢/RPM
18
Yield16 mavailable
14
12
10 --
Subsonic
_ fleet
8 yields
Figure 6-12.
• 65% load factor
• Based on 50% time savings
30% Economy class "_]fare Increases Yield
requiredfor 12% ROI
Mach 2.8
10%Mach 2.4
400 to 500 650 to 750units units
I I I25 50 75 100
Market captured by HSCT, %
Economic Viability--Impact of Speed Based on 247-Seat Design With
5,000-nmi Range4 -UgO027 R2-71
108

iJ
1,200
1,000
800
Total fleet size,year 2015 600market
400 --
200 m
0
Revenue for12% ROI
Figure 6-13.
Mach 2.0I I
Concorde
Impact oftechnology
/Mach 2.4
!;;i!iiiiiiii;i!iiiiiiiiiiiiiiii!iiiiiiiiiiiiiiiii;i8i:i:i:;:i_iSiSi#'i:i;i:i;_;_:i818!:;:
Presenttechnology
Impact of /technology
Mach 2.4
iiiiiiii!iii!iiiiiiiiiiiiiiiiiii!ii!iiiii!iiiiiiiiiii.:.:.:.:.:.:+:.:+:.:+x+:.:.:.:.:.:.:,:.:
Mach3.2
Mach3.2 _-_
Mach 2.4
iiiiiiiiiiiiiiiiiiiiiiiiiiiiiiiiiiiiiiiiiiiiiiiiiiil
Year 2000 Year 2015certification certification
(87) 14 to 15 12 to 13 10 to 12
Impact of Technology Development on HSCT Fleet Size5-ugoo27R4-72a
offset by large increases in productivity. As a result, the Mach 3.2 market is much reduced, being lessthan half the market size of the year 2015, Mach 2.4 airplane. The higher speed airplane is then a much
greater risk for both manufacturer and airline.
6.3 CONCLUSIONS
The evaluation requirement that an HSCT survive in a competitive marketplace quickly eliminatedthe high Mach number design concepts (Mach numbers of 4.5 and up). The high weights, high operat-
ing costs, and high prices for these designs were not offset by increases in economic productivity. The
range of design Mach numbers from 2.4 to 3.2 shows the most economic promise, with the highestprobability of success at the lower end of this range. All of the designs evaluated required increasedticket prices to meet the airline ROI target of 12% in a revenue environment set by an advanced sub-
sonic airplane.Increases in ticket prices rapidly reduces passenger demand, reducing the total market for the
HSCT, perhaps to the point where a manufacturer would not be willing to undertake an airplane
program.The sensitivity of the key economic measure (revenue required to meet the 12% ROI target) to
parametric variations in the HSCT design provides a glimpse of the improvements needed in HSCT
technology to meet the economic goals. Increases in cruise efficiency, both supersonically and subsoni-cally, better weight efficiency, and developments in composite production and manufacturing tech-
niques are a few of the technological improvements needed that will allow an HSCT to meet its primary
economic objectives. Improvements in these technology areas will do much more to improve the eco-
nomic viability of the HSCT than increasing cruise Mach number.
109

This PageIntentionally Left Blank
110

7.0 CONCLUSIONS AND RECOMMENDATIONS
7.1 CONCLUSIONS
Market and Competition. The market results show that a viable HSCT could acquire a significant
portion of the growing, long-range, worldwide market. However, to achieve this result, the airplane
must have the following characteristics:a. Environmentally acceptable (no special operating limits other than subsonic flight over land).
b. Adaptable to the year 2000 airport system (i.e., no superhubs for the HSCT alone).
c. From about 250 to 300 seats (in triclass seatings). Final seat definition is a function of productivity,
which depends on Mach number and design range capabilities.
d. A range of 5,000 nmi initially with growth to over 6,000 nmi. This increase will occur through weightgrowth; the use of improved engines; minimizing intermediate stops, which increase airline costs
and passenger trip times; and allowing maximum flexibility of the airplane within an airline's sys-
tem. Maximum flexibility will be reached only if the HSCT is used on routes suited to its capabili-ties, rather than as a direct substitute for 747 missions.
e. Economically competitive with a year 2000 subsonic fleet (i.e., increases in utilization must over-
come increased operating and ownership costs).f. Cruise Mach number should be consistent with minimum operating costs and maximum produc-
tivity when considering design-range tradeoffs.
An HSCT with these characteristics could justify a total fleet size of over 1,200 aircraft betweenthe years 2000 and 2015, serving primarily the long-range (2,500 nmi and greater), high-density market.
Environmental Concerns. The primary areas of environmental impact identified by this studywere--
a. Engine emissions. Projections of advanced low-emissions burner technology indicate that an NOxemissions reduction from 30 + lb to approximately 5 lb of nitrous oxide emissions per 1,000 lb of
fuel burned is possible. A clearer understanding of the effect of engine emissions on the atmos-phere is being investigated using the best atmospheric models available and data from the current
HSCT studies. This knowledge is essential to understanding the design requirements for an envi-
ronmentally acceptable HSCT.b. Community noise. The study shows that with projected suppression technology, achievement of
FAR36 Stage 3 noise levels may be possible. The primary issues involved in achieving Stage 3 levelsare-
1. Development of projected jet-noise suppressor technology.2. Possible modifications to the Stage 3 rules. The unique characteristics of an HSCT could justify
a different trade between sideline noise and takeoff noise, which could further reduce noise to
the majority of the community. Requirements could also focus on the area exposed to a givensound level to take into account the operating characteristics of an advanced HSCT in reducing
residential area exposed to noise.
c. Sonic boom. Subsonic, boomless overland flight was assumed for the basic technical and economic
viability estimates. However, a preliminary low-sonic-boom-design study suggests that a combina-
tion of fuselage shaping, wing planform choice, and a cruise at reduced supersonic Mach has poten-tial for reducing boom overpressure levels. Acceptable sonic boom levels have not been estab-
lished. Therefore, committing a design to a reduced sonic boom level is premature at this early
stage. Continued effort must be made toward developing a low-boom configuration.
PRECEDING PAGE BLANK NOT FILMED111
p f'_ii_)_.,,LL_t_ ;._v
Technical Feasibility. Within the Mach 2.0 to 3.2 speed range, vehicles can be operated with kero-
sene-based fuels, engine cycles using conventional turbomachinery, an uncooled high-temperature
composite, or a titanium primary structure. These vehicles would be capable of operating from existing
airports.Based on the results of the contract studies and other independent studies focusing on lower cruise
speed vehicles, maximum potential for an environmentally sound, technically feasible HSCT exists for
a vehicle designed to cruise at Mach 2.0 to Mach 2.5 over water and Mach 0.9 over land.
Economic Viability. Preliminary estimates of the response of the projected HSCT market to in-
creases in ticket cost have been measured against the revenues needed for the airplanes studied in
this and other independent studies to provide adequate profit margins to the manufacturer and theairlines. Based on this evaluation, the following conclusions can be drawn:
a. Present technology is not adequate.
b. A year 2000, Mach 2.0 to 2.5 HSCT shows promise (potential total market of 650 to 750 airplanes).While this would be an adequate demand for a single manufacturer, it is not an adequate marketfor two or more.
c. A Mach 2.0 to 2.5 HSCT with the advanced technology projected to be available for a year 2015airplane (either as an all-new airplane or an advanced derivative of a year 2000 airplane) is more
encouraging. With this technology, the potential total market is estimated at 950 to 1,050 airplanes,which clearly represents a business opportunity for two manufacturers.
d. Technology that reduces the weight and cost at Mach 2.0 to 2.5 has a much greater impact on eco-
nomic viability than technology that enables higher cruise Mach numbers.
Key areas of improvement that would directly impact economic performance are-
a. Reduced structural weight.
b. Improved engines available for year 2000 vehicles.c. Increased aerodynamic performance through improved wing planforms and hybrid laminar flow.
Finally, while the development costs of vehicles in the preferred Mach range may be considerably
higher than the costs of a similar-sized subsonic vehicle, Government support of the production pro-gram for an HSCT would not be required if such a vehicle were economically viable.
7.2 RECOMMENDATIONS
Technology Development Program. Potential for a successful U.S. commercial high-speed trans-
port exists for the year 2000 market if aggressive technology development is undertaken in the near
term. It is recommended that a joint NASA-industry technology development and validation program
be undertaken to address key technology areas. This program would optimize the likelihood of achiev-ing environmental acceptability for, and economic viability of, an HSCT cruising between Mach 2.0
and 3.0. The cost of this program would be a small fraction of the total development and production
costs, but could be key to receiving the commitment from airframe and engine manufacturers neces-
sary to achieve the timely development and production of a successful HSCT and, ultimately, to ensurethe HSCT's success in the worldwide marketplace.
Technology Needs. Many technology development needs are enabling, meaning that they are essen-
tial to achieve viability, and others are high-leverage items that offer significant payoff in risk reduction
or economics. The list of required and/or desirable technology developments covers virtually all tech-
nology areas and disciplines and must be prioritized. One of the basis for prioritization is the develop-
ment of technology to demonstrate environmental acceptability, without which the HSCT programcannot be launched. (Examples of these technologies are low-emission burners and noise suppression
112 _

t
technology.) Other factors that set priorities are the degree to which the technologies that are
time-critical, high-risk, or high-cost, or are potentially high in value in economic payoff.
Based on maximum potential for environmental and economic viability, the highest near-termpriorities for technology development are-
a. Low-emissions technology.
b. Noise-suppressor technology.
c. Variable-cyle engine technology.
d. High-temperature, durable composite structures and materials.e. High-lift aerodynamics.
f. High-temperature metals compatible with lightweight composite structures.
These are all high-value, high-cost items that will make critical contributions to the environmental
and economic factors and they are time-critical to the aircraft certification date of year 2000. Seriousresearch and development of each of these items should be initiated by 1990.
Technology development needs for longer term, higher risk vehicles have been identified. These
are considered of secondary priority to the Mach 2.4, year 2000 vehicle, but could provide enhance-
ments in economics and possibly speed. They are applicable to a later timeframe for certification.Those areas needing development include--
a. Advanced engine concepts.b. Advanced vehicle concepts.c. Laminar flow control.
d. Higher temperature materials for higher speed vehicles.e. High-thermal-stability fuels.
113

This PageIntentionallyLeft Blank
=
r
114

REFERENCES
2.1 Boeing Commercial Airplanes, "Current Market Outlook," February 1988.2.2 Feir, Jack B., "Evaluation of Routing and Scheduling Considerations for Possible Future
Commercial Hypersonic Transport Aircraft," NASA CR-132632, 1974.
3.1 Steinmetz, R.B., and B.G. Hines, "Engine Variable Geometry Effects on Commercial
Supersonic Transports," AIAA-87-2101, July 1987.
3.2 Klees, G.W., "Supersonic Jet Engine and Method of Operating Same," U.S. Patent #4287715,
September 1981.
4.1 "Study of Structural Design Concepts for an Arrow Wing Supersonic Transport
Configuration," Volume 1, NASA CR-132576-1, August 1976.
4.2 Sheppard, L.M., "The Wave Drag of Nonlifting Combinations of Thin Wings andNonslender Bodies," R.A.E. R&M No. 3076, March 1957.
4.3 Sheppard, L.M., "Methods for Determining the Wave Drag of Nonlifting Wing-BodyCombinations," R.A.E. R&M No. 3077, April 1957.
4.4 Middleton, W.D.; Lundry, J.L. ; and Coleman, R.G. : A System for Aero-
dynamic Design and Analysis of Supersonic Aircraft. Part 2 - User's Manual.
NASA CR-3352, 1980.
5.1 Brown, J.G. and Haglund, G.T.,"SonicBoom Loudness Study and Airplane Configuration
Development," AIAA Paper 88-4467, presented at the AIAA/AHS/ASEE Aircraft Design,
Systems, and Operations Conference, September 7-9, 1988, Atlanta, Georgia.
PRECEDING PAGE BLANK NOT FILMED
115

Nabona[ Aeronaul,c5 and
SPace Adrn;nls_ra_on
1. Report No.NASA CR-4233
4. Title and Subtitle
Report Documentation Page
2. Government Accession No, 3. RocIplent's Catalog No.
High-Speed Civil Transport Study
7. Author(s)Boeing Commercial Airplanes
_.New Airplane Development
9. Performing Organization Name and AddressBoeing Commercial AirplanesP.O. Box 3707
Seattle, Wa 98124-2207
12. Sponsoring Agency Name and AddressNASA Langley Research CenterHampton, Va 23665-5225
5. Report Date
September 1989
6. Performing Organization Code
8. Performing Organization Report No.
10. Work Unit No.505-69-01-01
11. Contract or Grant No.HAS 1-18377
13. Type of Report and Period CoveredContractor Report
14. Sponsoring Agency Code
15. Supplementary Notes
NASA Program Manager:Boeing Program Manager:Boeing Contract Manager:Final Report
Charles E. K. Morris, Jr.Michael L Henderson
Danella E. Hastings
16. Abstract
A system study of the potential for a high-speed commercial transport has addressedtechnology, economic, and environmental constraints. Market projections indicated a need forfleets of transports with supersonic or greater cruise speeds by the years 2000 to 2005. Theassociated design requirements called for a vehicle to carry 250 to 300 passengers over a range of5,000 to 6,500 nautical miles. The study was initially unconstrained in terms of vehiclecharacteristic, such as cruise speed, propulsion systems, fuels, or structural materials. Analysesled to a focus on the most promising vehicle concepts. These were concepts that used a kerosene-type fuel and cruised at Mach numbers between 2.0 to 3.2. Further systems study identified theimpact of environmental constraints (for community noise, sonic boom, and engine emissions) oneconomic attractiveness and technological needs.
Results showed that current technology cannot produce a viable high-speed civil transport;significant advances are required to reduce takeoff gross weight and allow for both economicattractiveness and environmental acceptability. Specific technological requirements have beenidentified to meet these needs.
17. Key Words (Suggested by Author(s))High-Speed Civil TransportEnvironment
Vehicle Development r
MarketEconomics
18. Distribution StatementUnclassified - Unlimited
Subject Category 05
19. Security Classlf.(of this report)
Unclassified
20. Security Classlf.
(of this page)
Unclassified
21. No. of pages
132
22. Price
A07
NASA-Langley, 1989
For sale by the National Technical Information Service, Springfield, Virginia 22161-2171