high speed railway productivity: how does organizational
TRANSCRIPT

1
High Speed Railway Productivity:
How Does Organizational Restructuring Contribute to HSR Productivity Growth?
By
Ryusuke Sakamoto
Bachelor and Master of Engineering, Hokkaido University, 2005
Submitted to the Department of Civil & Environmental Engineering, in partial fulfillment of the
requirement for the degree of
Master of Science in Transportation
At the
MASSACHUSETTS INSTITUTE OF TECHNOLOGY
June 2012
© 2012 Massachusetts Institute of Technology. All Right Reserved.
Signature of Author……………………………………………………………………………………..
Department of Civil & Environmental Engineering
May 11th
, 2012
Certificated by……………………………………………………………………………………………..
Joseph M. Sussman
JR East Professor of Civil & Environmental Engineering and Engineering Systems
Thesis Supervisor
Accepted by………………………………………………………………………………………………..
Heidi M. Nepf
Chair, Departmental Committee for Graduate Students

2

3
High Speed Railway Productivity:
How Does Organizational Restructuring Contribute to HSR Productivity Growth?
By
Ryusuke Sakamoto
Submitted to the Department of Civil & Environmental Engineering on May 11th, 2012, in partial fulfillment of
the requirements for the degree of Master of Science in Transportation
Abstract
The institutional reform of Japan National Railway (JNR) in 1987 has been considered as a
great success. After the Japanese railway reform, European countries introduced vertical
separation management. However, the question whether the new companies’ railway business has
been improved by the privatization and vertical separation is still not well known.
To evaluate the effect of the privatization and vertical separation, this thesis applied
“productivity analysis”. First, we set Tokaido Shinkansen and the Paris-Lyon line as our research
object because that these lines introduced the latest technology when it had been constructed. This
means the technological development which increases the productivity has been very limited.
Second, these lines have been profitable railway lines for a long time.
This thesis used multi-factor productivity (MFP). We set passenger-km and revenue as output
separately, and personnel, non-personnel, and capital related expenses as input data. As a result,
this thesis found that the JNR privatization has contributed to increase MFP of Tokaido
Shinkansen after 1987.
This thesis reviewed the previous research. As a result, we figured out that their research
model has difficulties showing the effect of introducing the vertical separation. From the Swedish
railway data, we judged even the small market competition has more relationship with increased
productivity than the style of vertical separation.
We believed that the future NEC HSR should introduce private sector’s funds, and be operated by private
sectors with competition within operators.
Thesis Supervisor: Joseph M. Sussman
Title: JR East Professor of Civil & Environmental Engineering and Engineering Systems

4

5
Acknowledgements
First and foremost, I would like to express my sincere thanks to my supervisor Professor Joseph
Sussman for his kind support and invaluable intelligent guidance these two years.
I would also like to thank all of MIT HSR research group members. Your insightful opinions,
supports, and feedback help me significantly in my two years’ study.
I am indebted to many of my colleagues and friends who support me a lot: my family, Rie, my
parents, Henning Colsman-Freyberger, his wife Anja, David Gerstle, Naomi Stein, Joel Carlson, Andrés
Felipe Archila, and Maite Peña Alcaraz, etc. You guys have helped me complete thesis.
I also want to express my thanks to MIT productivity research group members, Rebecca Cassler
Fearing, we call Becky, Robert Powell, Veiko Paul Parming, and David J Donatelli. I do not think I
complete this thesis without your helps.
Last but not least, I would like to thank my company, JR East. They gave me a great chance to
study in MIT. I cannot achieve anything here without their help.

6
Table of Contents
List of Abbreviations………………………………………………………………………………….….10
List of Figure…………………………………………………………………………………………......11
List of Tables……………………………………………………………….………………………….....15
1. Introduction………………………………………………………….……………………………...17
2. Japanese Railway Industrial Reform……………………………….………………………………21
2.1 Introduction……………………………………………………..……………………………….21
2.2 Before Tokaido Shinkansen Line……………………………..………………………………….24
2.3 Tokaido Shinkansen……………………………………………………………………………...26
2.4 Beginning of the JNR financial crisis……………………………………………………………30
2.5 Law of HSR…………………………………………………………………………….………..33
2.6 Reform of JNR…………………………………………………………………………..……….36
2.7 Law amendment for JRs………………………………………………………………………....41
2.8 HSR Holding Company…………………………………………………………………….…....43
2.9 Definition of Privatization……………………………………………………………………….46
2.10 HSR construction scheme after 1987……………………………………………………….…..47
2.11 Conclusion of Japanese railway reform…………………………………………………….…..49
3. Europe and France………………………………………………………………………………….50

7
3.1 Introduction………………………………………………………………………………………50
3.2 Before HSR………………………………………………………………………………………51
3.3 Paris-Lyon line…………………………………………………………………………………...53
3.4 Public view of SNCF and TGV project………………………………………………………….56
3.5 Birth of vertical separation management………………………………………………………...58
3.6 Role of European Union………………………………………………………………………....62
3.7 French Reform…………………………………………………………………………………...64
3.8 Competition in HSR market……………………………………………………………………..67
3.9 Conclusion……………………………………………………………………………………….69
4. Productivity………………………………………………………………………………………….71
4.1 Introduction………………………………………………………………………………………71
4.2 Single factor productivity………………………………………………………………………..71
4.3 Developing history of MFP analysis…………………………………………………………….74
4.4 Importance of productivity growth………………………………………………………………78
4.5 Productivity analysis in transportation…………………………………………………………..81
4.6 Objective of research…………………………………………………………………………….89
5. Data of Tokaido Shinkansen and Analysis…………………………………………………………..92
6. MFP………………………………………………………………………………………………...101

8
6.1 Analysis of Tokaido Shinkensen………………………………………………………………..101
6.2 Decomposed single factor productivity………………………………………………………...103
6.3 TFP of French railway industry………………………………………………………………...105
7. The US HSR Project………………………………………………………………………………..111
7.1 Introduction……………………………………………………………………………………..111
7.2 Conception of the US HSR……………………………………………………………………..117
7.3 California case………………………………………………………………………………….121
7.4 The difference between the US HSR project and HSR in other countries……………………..122
7.5 NEC……………………………………………………………………………………………..124
7.6 Constructing a completely new HSR on NEC………………………………………………….132
7.7 Conclusion: appropriate management structure in NEC……………………………………...135
8. Conclusion...………………………………………………………………………………………..138
Afterword: HSR competition in Italy…………………………………………………………....…145
Reference…………………………………………………………………………...………………150

9
List of Abbreviation
HSR High speed railway
TFP Total factor productivity
MFP Multi factor productivity
JRCentral Central Japan Railway Co.
JR East East Japan Railway Co.
JR West West Japan Railway Co.
JRC Central Japan Railway Co.
NEC Northeast corridor
JNR Japan National Railway
JRTT Japan Railway Construction Transportation and Techology Agency
MITI Ministry of International Trade and Industry
JITI International Transportation Institute
EPR Expenditure per revenue
PPR Profit per revenue
EPD Number of personnel per operation-km
IBRD International Bank for Reconstruction and Development
SJ Statens Jarnvagar
BV Banverker
EC European Commision
NTV Nuovo Transpori Viaggiatori
CN Canadian National Railway
CP Canadian Pacific Railway

10
List of Figures
Figure 1.1 Image of vertical separation………………………………………………………………….18
Figure 2.1 Passenger-km and ton-km operated by JNR…………………………………………………24
Figure 2.2 Japanese inflation transfer……………………………………………………………………27
Figure 2.3 Line map of Tokaido Shinkansen…………………………………………………………….30
Figure 2.4 Mode share of passenger travel………………………………………………………………31
Figure 2.5 Mode share of freight………………………………………………………………………...31
Figure 2.6 Line map of Sanyo Shinkansen………………………………………………………………33
Figure 2.7 Annual deficit of JNR………………………………………………………………………...36
Figure 2.8 Japanese current railway business areas map………………………………………………...40
Figure 2.9 Current HSR finance scheme………………………………………………………………...48
Figure 3.1 Transfer of passenger transportation mode share in EU……………………………………..53
Figure 3.2 French TGV Network………………………………………………………………………..56
Figure 4.1 National GDP growth ratio…………………………………………………………………..80
Figure 5.1 Tokaido Shinkansen passenger-km…………………………………………………………..93
Figure 5.2 Ticket price between Tokyo and Osaka………………………………………………………94
Figure 5.3 Tohoku, Joetsu and the other Shinkansen lines………………………………………………95
Figure 5.4 Personnel Expense……………………………………………………………………………97

11
Figure 5.5 Non-Personnel Expense………………………………………………………………………98
Figure 5.6 Capital related expense……………………………………………………………………….99
Figure 5.7 Average interest rate of the debt in JR Central……………………………………………...100
Figure 6.1 Year to year revenue and passenger-km MFP………………………………………………102
Figure 6.2 Passenger-km and revenue based MFP……………………………………………………..102
Figure 6.3 Single factor productivity…………………………………………………………………...104
Figure 6.4 Productivity if passenger railway in Europe………………………………………………..107
Figure 6.5 TFP of European railway industry…………………………………………………………..108
Figure 7.1 The US transportation mode share………………………………………………………….113
Figure 7.2 Comparison of the population density………………………………………………………113
Figure 7.3 Japanese HSR network……………………………………………………………………...115
Figure 7.4 French HSR network………………………………………………………………………..115
Figure 7.5 Future US HSR network drawn by US HSR Association…………………………………..116
Figure 7.6 US HSR corridor designations……………………………………………………………...118
Figure 7.7 The US railway industry mode share……………………………………………………….125
Figure 7.8 Population in the big metropolitan areas along the NEC…………………………………...125
Figure 7.9 Estimated cities’ GDP………………………………………………………………………126
Figure 7.10 Distance and cities’ size on each corridor…………………………………………………127

12
Figure 7.11 Ownership of NEC and commuter rail operations………………………………………..128
Figure 7.12 Passenger train movements by segment of the NEC……………………………………..129
Figure 7.13 Average number of operation per day of the five Amtrak-owned movable bridges in
Connecticut, 1993……………………………………………………………………………………..130

13
List of Tables
Table 2.1 Japanese HSR extension history………………………………………………………………21
Table 2.2 Transfer of the financial indices of JNR………………………………………………………25
Table 2.3 Comparison between the first HSR projects in each country…………………………………29
Table 2.4 Data of each HSR construction cost and length………………………………………………35
Table 2.5 The difference between two acts………………………………………………………………41
Table 2.6 Amount of money for buyout of each HSR infrastructure……………………………………45
Table 2.7 Financial indices after 1987…………………………………………………………………...45
Table 2.8 Process of the privatization……………………………………………………………………46
Table 2.9 Levels of ownership of passenger railway companies………………………………………..47
Table 3.1 Change of French transportation mode share…………………………………………………52
Table 3.2 Expansion of the European HSR network……………………………………………………55
Table 3.3 Railway debt in Europe in 1997………………………………………………………………57
Table 3.4 Analysis of reform in two European countries……………………………………………….62
Table 3.5 State financial support to rail………………………………………………………………….67
Table 3.6 Rail organization in Western European in 2004………………………………………………69
Table 4.1 Comparison of US and Canadian railroad…………………………………………………….84
Table 4.2 MFP growth: US-Canadian rail industries competition 1981-1988…………………………..85

14
Table 4.3 Average growth in airline productivity………………………………………………….……86
Table 6.1 Annual average growths of MFPs……………………………………………………….…...103
Table 6.2 Types of separation of infrastructure from operations…………………………….…………106
Table 7.1 HSR network and line around the world…………………………………………………..…112
Table 7.2 Operation frequency and travel time on NEC and Tokaido Shinkansen…………………….112
Table 7.3 Current ridership and daily trains…………………………………………………………….129
Table 7.4 Federal government funds for FRA………………………………………………………….132
Table 7.5 Estimated future travel time of NEC…………………………………………………………133
Table 7.6 Expressed travel time and speed by HSR……………………………………………………133

15
Chapter 1
Introduction
This thesis has a main research objective and some suggestions for the potential US high-speed
railway (HSR) from the main research result. The main part is whether the railway industrial reforms
-privatization in Japan and introducing vertical separation in Europe- have contributed to improve the
productivity of their railway. After that, we suggested what type of management structure could be
appropriate for the future Northeast corridor (NEC) HSR. For judging these problems, this thesis applied
productivity analysis.
As Kasai (2007), said the reform of Japan National Railway (JNR) in 1987, known as
privatization, has been considered a great success. The abandonment of unprofitable lines, layoff of
excess personnel, and permitting the newly privatized railway companies to do the non-railway
businesses, which had been forbidden before the reform, have contributed somewhat to the increase in
new private railway companies’ profits. On the other hand, whether the new companies’ railway
operation managements, which were taken over from JNR, have been improved by the new private
railway companies is still not well known empirically. Chapter 2 explains what actually happened before
and after the Japanese railway industrial reform and why the government needed to privatize JNR.
About 10 years after the Japanese reform, European countries had also introduced the new railway
management structure, known as vertical separation. Fig 1.1 shows the image of vertical separation.

16
Fig 1.1 Image of vertical separation
The original idea of introducing the vertical separation was to stimulate the competition among
the railway operators. It is, however, difficult to say that the current European railway industry has
developed that competition. Each country introduced its own vertical separation systems, this makes the
definition and analysis of the European vertical separation management difficult. Chapter 3 explains the
European railway reform in detail.
For evaluating the effect of the privatization and introduction of the vertical separation in the
railway industry, this thesis applies productivity analysis. Chapter 4 explains what productivity is by
introducing the historical important previous research of Solow, Krugman, Trethwaym Oum, and Cowie.
We set Tokaido Shinkansen and the Paris-Lyon line as our research objects. This was because the
Tokaido Shinkansen line and the Paris-Lyon line introduced the latest technology when these were
constructed. This means the technological development which could increase the productivity after the
institutional reform has been very limited. In addition, Tokaido Shinkansen and the Paris-Lyon line were
a profitable railway line even when JNR and pre-reformed SNCF operated these.

17
This thesis applies the multi-factor productivity (MFP). We set passenger-km and revenue as
output separately, and we set personnel, non-personnel, and capital related expenses as input data. This
research scheme is definitely different from previous research, which set the number of the personnel
and the total length of their railways as input data. After we obtained the results of MFP, we also applied
the single factor productivity (SFP) analysis. As the result of the SFP, we could see what type of
expenses had a significant impact on the MFP growth. Data of Tokaido Shinkansen and Paris-Lyon line
are shown in Chapter 5, and the data analysis procedure is shown in Chapter 6.
In addition, this thesis reviews some previous research evaluating the European vertical
separation by productivity analysis. We determined that the previous research had significant difficulties
analyzing the effect of the introducing the vertical separation management because of lack of data.
Chapter 6 also shows the previous research’s data graphs and conclusions.
This thesis finds that the JNR privatization has contributed to an increase in MFP for Tokaido
Shinkansen after 1987. Furthermore, this thesis shows that the most significant source of the increased
MFP is the capital related expense. Although an object of this thesis was to show whether the vertical
separation management in European countries has improved the railway industries’ productivity, not
enough data were available. Thus, this thesis uses the previous findings about the productivity analysis
of European railway as one of the sources in the analysis. As a result, we found that their research
models had difficulties showing the effect of introducing the vertical separation. From the limited
Swedish and German data, we judged even the small market competition, rather than the type of the
vertical separation, has stronger relationship with increased productivity.
Chapter 7 compiled the information about the US high speed railway project, especially Northeast
18
corridor (NEC) HSR project. There are several reasons why the US has not yet introduced HSR into
their transportation system. However, generally people may agree with the idea that NEC has a good
potential to be the first HSR line in the US. This thesis analyzes the current NEC situation to suggest the
appropriate industrial management structure to implement the NEC HSR.
As conclusion, this thesis suggests that the NEC HSR should introduce the private sectors’
management and capital into the construction and management of its infrastructure by analysis with the
Tokaido Shinkansen. Although also the well regulated competition among the future HSR operators
could be recommended, it is still difficult to judge whether the competition among the operators on an
infrastructure could increase the entire productivity.
As a first step, in the next chapter, this thesis discusses the detail of Japanese railway industrial
reform.

19
Chapter 2
Japanese Railway Industrial Reform
2.1 Introduction
When JNR started the commercial operation of the world first HSR, known as Shinkansen, on
October 1964, Tokaido Shinkansen between Tokyo and Osaka, passenger railway industry opened the
door of the new era. Since then, the Japanese HSR line has continued extending. According to Japan
Railway Construction Transportation and Technology Agency (JRTT), Japan now has 2387.7 km
(1492.3 mile) of HSR. Table 2.1 shows the history of the expansion Japanese HSR.
Table 2.1 Japanese HSR extension history
Source: Visual Railway (2011)
There were several reasons why Japan has been eager to construct new HSR lines. Takatsu (2007)
compiled the advantages of HSR in Japan;
1. Shortened passenger travel time
2. Capacity
Distance (km) Opening YearTokyo-Shin Osaka 515 1964Shin Osaka-Okayama 161 1972Okayama-Hakata 393 1975Omiya-Morioka 466 1982Omiya-Nigata 270 1982Ueno-Omiya 28 1985Tokyo-Ueno 4 1991Takasaki-Nagano 125 1997Shin Yashiro-Kagoshima 128 2004Morioka-Shin Aomori 194 2011Hakata-Shinyashiro 121 2011

20
3. Frequency
4. Safety
5. Punctuality
6. Environmental thoughtfulness
The first is the shortened travel time; HSR has been able to reduce people’s travel time between
two or more large cities. Takatsu shows one example that “Hokuriku Shinkansen from Takasaki to
Nagano cut the time required to travel from Tokyo to Nagano by more than 50% from 2 hours 56
minutes to just 1 hour 23 minutes”.
The second is capacity; Takatsu’s report said that the latest HSR trains operated in the Tokaido
line can accommodate as much as 1323 passengers. He said this number is more than “twice the
capacity of a Boeing 747”.
The third is frequency; Central Japan Railway Company (JR Central), the current operator and
infrastructure owner of the Tokaido Shinkansen line, reported that more than 300 trains run in a day on
the Tokaido line in FY2006. Takatsu also said that the Shinkansen minimum headway is just 3 minutes
with an average of 15 runs per hour.
Fourth is regarding safety; not a single accident involving loss of life has occurred since Japanese
HSR began the operation in 1964.
The fifth is punctuality; JR Central reported that the average delay per service of Tokaido
Shinkansen is 36 seconds in FY2005. Japan International Transportation Institute (JITI) said that

21
Japanese airline’s average delay per service is roughly 3 minutes. This gap can be a strong advantage for
HSR.
The sixth is environmental thoughtfulness; with the increasing attention for the global warming,
HSR is now considered as a more energy efficient and environmentally thoughtful transportation mode
than automobile and airline transportation. Takatsu reported that the amount of CO2 emission per
passenger-km from the Tokaido Shinkansen is now about 16% of air transportation and 11% of
automobile transportation. Of course the amount of CO2 emission depends on the production of the
electric power for HSR.
For the several reasons mentioned above, HSR is the transportation mode of recognized standing
in Japan. Japanese Ministry of International Trade and Industry (MITI) showed the new growth strategy
which exhibited that HSR has a great potential to be a profitable export product.
However, it was not an easy task to continue constructing HSR and establish its high status as a
great transportation mode. The official web page of the Ministry of Land, Infrastructure, Transport and
Tourism (MLITT) reported that JNR, completely government owned company which previously owned
and operated all of Japanese HSR until 1987, almost went through bankruptcy, and the original HSR
construction project, which was defined by Act for Construction of Shinkansen Railway Across the
Country (1970), had been delayed several times and abandoned partly.
Understanding what actually happened in the management of the operation and construction of the
Japanese HSR and why JNR was divided and privatized can help us to understand the problems in the
current US passenger railway industry and potential future HSR project.

22
2.2 Before Tokaido Shinkansen Line
Japan National Railway Chronology (1995) issued by Japanese Railway Statistics Foundation
shows the data of passenger-km of passenger railway service and ton-km of freight railway service from
1875 to 1995. Imashiro (1999) compiled some of these data, shown in Fig 2.1.
Fig 2.1 Passenger km and ton km operated by JNR (billion)
Source: Imashiro (1999)
JNR had operated both passenger railway service and freight railway service. After World War II,
JNR’s passenger-km and ton-km had increased through 1965 with the developing postwar economy.
After 1970, ton-km, freight traffic volume had been decreasing constantly, as contrasted with still
increasing passenger-km. Imashiro also compiled the data from Railway Statistics Annual Data issued
by Japanese Ministry of Transportation, current MLITT.
Table 2.2 shows the JNR’s financial health level between 1950 and 1980 by the ratio of operating
0
50
100
150
200
250
1945 1950 1955 1960 1965 1970 1975 1980 1985
Passenger km Ton km

23
expenditure per revenue (EPR), profit per revenue (PPR), and the number of personnel per operation km
(EPD) From the data table, Imashiro concluded that JNR’s financial status was good until 1960. At least
between 1950 and 1960, the revenue of JNR had exceeded their operating expenditure. Also they had
received profits from their business until 1960.
Table 2.2 Transfer of the finance indexes of JNR
Source: Imashiro (1999)
On the other hand, after 1970, JNR’s operation expenditure had exceeded its revenue, and the
profit had gone negative. Generally specialists, including Ministry of Transportation, said that the
biggest reason for JNR bankruptcy was the problem of excess personnel. However, it is not correct in a
narrow sense. As Table 2.1 shows, the number of personnel per operation km had been decreased from
1950 to 1980.
If new railway lines which had been constructed after 1970 could have same level of EPR as the
lines which had been already operated before 1970, they would not have run into financial difficulty.
From these points, we can say that the railway lines, including HSR lines, constructed after the 1970s
had not earned enough revenue compared to the existed lines.
EPR(%) PPR(%) EPD(%)1950 97.9 3.5 23.91960 98 1.3 21.91970 113.5 -0.1 221980 133.8 -34 19.4
EPR=(operating expenditure)/(revenue)PPR=(current profit)/(revenue)EPD=(number of employee)/(operating km)

24
2.3 Tokaido Shinkansen
Suda (1994) reported what actually happened to the construction project of the Tokaido
Shinkansen line from the late 1950s to the early 1990s. Even before the project was started, JNR had
realized that the rapidly increasing passenger demand for Tokaido local line between Tokyo and Osaka
would be a serious problem soon. The Annual Transportation Report Book issued by Ministry of
Transportation in 1956 said that “even though Tokaido line was just 2.9% (569.5 km) of total railway
length in Japan, it carried 26% (36.2 billion passenger km) of total passenger km and 23% (13.1 billion
ton km) of total ton km in 1955…So, there was no room to increase frequency”.
As the first action of JNR for this problem, Suda said that JNR formed a research group to study
the problem. Takatsu said that there were two plans. One was to improve the frequency in the existing
local line by expanding its gauge from narrow (1067mm) to standard (1435mm). This is because they
expected if they would expand the gauge, they could make their railway operation speed faster.
The other was the “bullet train project”: constructing the exclusive line for only high speed
passenger railway. Suda said that finally the CEO of JNR Sogo and Executive Chief Engineer Shima
decided in 1957 with their strong leadership to construct the new exclusive bullet train, named
Shinkansen, between Tokyo and Osaka.
On March 1959, the government approved the budget for the project. Suda explained that the
project finance scheme was that the government loan the money to JNR for constructing HSR annually
as long term indebtedness, and JNR pay it back from the revenue from the new line.
Even though JNR decided to construct new dedicated line for high speed passenger train and the

25
government approved the first year budget for it, this fact would not guarantee the total project success.
Suda mentioned that the biggest problem was one year budget system in Japanese Diet.
Nam (2009) also said that it was difficult for JNR to pass the long term project budget bill through
Congress. Nam explained that then JNR’s budget had to be approved by Minister of Transportation and
Minister of Finance every financial year. In addition, then Japan was in a period of inflation. The
inflation ratio is shown in Fig 2.2.
Fig 2.2 Japanese Inflation transfer (1964=100)
Source: Bank of Japan
Under such a rapid inflation, estimating the total project cost was very difficult. Sogo and JNR’s
HSR project team actually estimated the probability of budget shortfall after the project would start
(indeed the total project cost was much higher than they estimated in FY1959). Then, Minister of
Finance, Sato, one of the strong supporters of the HSR project among politicians, raised the idea that
0
50
100
150
200
250
300
350
400
450
19641966196819701972197419761978198019821984198619881990
Inflation Ratio

26
JNR would take out a loan from the International Bank for Reconstruction and Development (IBRD),
known as World Bank.
According to Takahashi (2000), Sato suggested that even if the entire government was reappointed,
the agreement between the government and IBRD would guarantee the completion of the project. Indeed,
the article of agreement between IBRD and JNR required the government’s guarantee of completing the
project. In 1961, JNR and IBRD signed an agreement with the financial loan program. Takahashi
explained the details; total amount of the loan was $80 million, annual interest was 5.75%, and
reimbursement term was 20 years. Later, JNR completely paid off the loan from World Bank in 1981.
After JNR received the loan from IBRD in 1961, the HSR project went well. Table 2.3 shows the
construction terms and distances of the first HSR projects in each country. Compared to the other
countries, short time span of Japanese HSR construction is outstanding.

27
Table 2.3 Comparison between the first HSR projects in each country
Source: UIC data web page
The average annual construction length of Tokaido Shinkansen was more than 100 km. This is the
longest in the data shown in Table 2.3. Of course the construction pace depends on some factors, such as
geological formations and construction technology level. However, the guaranteed budget from the
government and World Bank might support the trouble-free construction of Tokaido Shinkansen. As
evidence, Miura showed, after JNR had run into financial difficulty in the 1980s, JNR needed much
longer term to construct Tohoku Shinkansen, the average annual construction length of Tohoku
Shinkansen was about 45 km.
JNR started the commercial operation of Tokaido Shinkansen line on October 1 1964. Fig 2.3
shows the line map of Tokaido Shinkansen.
Japan France Germany Spain Italy Korea Taiwan ChinaThe year ofthe fullopeningoperation ineach first HSRline
1964 1983 1991 1992 1992 2004 2007 2008
The first linename
Tokaido-line Southeast-line Seville-line Direttissima KTX
Citiesbetween
Tokyo-Osaka Paris-Lyon *Mannheim-Stuttgart*Hannover-Wurzburg
Madrid-Seville Firenze-Roma Seoul-Pusan Taipei-Kaohsiung
Beijing–Tianjin
constructionperiod
1959-1964 1976-1983 1973-1991 1987-1992 1970-1992 1992-2004 1999-2007 2005-2008Constructionterm (years) 5 7 15 5 22* 12 15 3
First HSR linelength (km) 515 417 426 471 248 330 345 120
*German case started two standoff HSR constructions simultaneously
* The first Italian HSR construction terms were devided into three stagesFirst stage has 150km (1970-1981)Second stage has 74km (1981-1984)Third stage has 24km (1984-1992)

28
Fig 2.3 Line map of Tokaido Shinkansen
Source: JR Central
In FY1964, Tokaido Shinkan line carried 3.9 billion passenger-km and 10.7 billion passenger-km
in FY 1965. From the first operation year, its speed, punctuality, comfort, and safety were highly
appreciated by passengers. After the opening year, JNR had increased the number of passengers in
Tokaido Shinkansen line every year until 1974. On the other hand, the path to the JNR bankruptcy had
already started in 1964.
2.4 Beginning of the JNR financial crisis
In FY1964, the opening year of Tokaido Shinkansen, JNR posted first-ever loss in its long history.
Imashiro mentioned that after 1964, JNR had carried on the deficit operation until 1987, year of the
reform of JNR. The web page of MLITT shows the reasons for JNR bankruptcy. The first is
motorization. Fig 2.4 and 2.5 show the mode share changes between transportation modes in passenger
and freight.

29
Fig 2.4 Mode share of passenger travel
Source: MILTT web page
Fig 2.5 Mode share of freight
Source: MILTT web page
From 1960 to 1970, passenger transportation mode share of JNR had been reduced from about
55% to 35%. At the same time, the share in the individual automobile had been increased from about

30
25% to 50%. The freight business of JNR had also same problem as its passenger business. JNR had lost
more than 20% freight transportation mode share from 1960 to 1970. Imashiro mentioned that it was
difficult to get a receptive attitude from tax payers to cover the deficit made by JNR, especially by its
freight sectors because just two years before the reform of JNR, in 1985, JNR mode share in freight
transportation was less than 10%. People were not happy about supporting such a tiny mode share
transportation system with taxpayer’s money.
Along with the problem of the decreasing passenger and freight mode share, JNR also had
problems in their management. The web page of MLITT said that JNR did not have the authority to
make decisions about their ticket price and freight service price at all. If they needed to change the
passenger ticket and freight prices, it was required to change the act in Diet. And indeed, the government
of that time was unwilling to increase the prices because they worried about increasing the public
transportation cost could cause further inflation. However, this policy actually furthered the financial
crisis in JNR later. After 1974, JNR had increased the passengers’ ticket prices to cover the vast amount
of deficit. This process accelerated the passengers and freight customers to avoid using the service of
JNR.
MLITT explained that the reason why it happened was that JNR did not have an independent
management. JNR was restricted in its service price decision making process, its authority of top
personnel issue, and its investment planning process by administrations and Congress. As a result, the
relationship between JNR management and several labor unions in JNR was problematic. Indeed Kasai
mentioned that there was almost no productive negotiation between JNR’s labor unions and JNR
management sector because there were too many constraints in the decision making process of JNR.
Thus, Akiyama (2004) mentioned that these labor unions planned strikes to win concessions not from

31
the JNR management but from the administration in the 1970s many times. However, these strikes
accelerated loss of the passengers using JNR services as a result.
2.5 Law of HSR
Even before the opening year of Tokaido Shinkansen, JNR already had planned to expand the line
from Osaka to Hakata. Japan National Railway History (1995) said that the administration approved the
construction project in 1965. As shown in Table 2.1, JNR started the commercial operation between
Osaka and Okayama in 1972. Finally the line between Okayama and Hakata was opened in 1975. Fig
2.6 shows the line map of Sanyo Shinkansen line, between Osaka and Hakata.
Until the construction of Sanyo line, the projects had followed the original investment idea that
JNR needed to increase the main line’s capacity to respond to the increasing passenger demands.
However, after the accomplishment of the construction of Sanyo line, Japanese HSR project would have
been almost controlled by the government without JNR’s cost revenue analysis.
Fig 2.6 Line map of Sanyo Shinkansen
Source: JR West web page

32
Kado (2001) discussed this change in detail. During the construction term of Tokaido Shinkansen
line, politicians had realized that the HSR project could stimulate local job markets and economics.
Actually, after the administration approved the first HSR project, a lot of HSR lobbies had appeared and
spread throughout Japan. In response, the government passed Act for Construction of Shinkansen
Railway Across the Country in 1970. This act fundamentally changed the process of the HSR planning
and construction.
Before the act, JNR had planned the construction projects of Tokaido and Sanyo Shinkansen, and
the government just approved the projects. However after the act, planning, adjustment, and construction
order had been under the control of Minister of Transportation. This means that, after the act, Japanese
HSR project had been controlled by political sector. However, the financial and demand risks had
remained in JNR.
Just after the act passed, Congress approved the new HSR projects, Tohoku and Johetsu
Shinkansen. These HSR’s construction costs were financed by the JNR’s loan from the national budget.
On November 13 1972, Minister of Transportation ordered JNR to start the construction of the two new
lines.
After these construction projects started, the financial condition of JNR went into a tailspin. Table
2.4 shows the construction costs of each Shinkansen line.

33
Table 2.4 Data of each HSR construction cost and length
Source: Kasai (2009) and MILTT web page
The construction cost of Tohoku Shinkansen per km was almost eight times as much as the
Tokaido Shinkansen. Kado mentioned the two reasons for such a high cost. The first is that Ministry of
Finance cut down the budget of annual Shinkansen project in 1975. This budget cut affected the delay of
the project, and the delay also had increased the total construction cost. As shown in Table 2.3, Tokaido
Shinkansen had been constructed in 5 years. On the other hand, Tohoki shinkansen had needed 11 years
even the length was slightly shorter than Tokaido Shinkansen.
The second is the negativeness for the project in JNR. Indeed, the CEO of JNR, Isozaki explained
that “the current HSR projects, Tohoku and Johetsu Shinkansen, would be unprofitable lines” in
Congress on May 1973. Fig 2.7 shows the transition of financial balance in JNR. After the Act for
Construction of Shinkansen Railway Across the Country was passed in 1970, the annual deficit of JNR
had gone up by about six times from 1970 to 1975 by the construction costs of Tohoku and Joetsu
Shinkansen.
Length (km)Construction
Cost (billio Yen)cost per km(billion Yen)
Tokaido 515 330 0.64Sanyo 553.7 910 1.64Tohoku 469.5 2660 5.36Johetsu 269.5 1630 6.05

34
Fig 2.7 Annual deficit of JNR
Source: MILTT web page
Although the deficit had not come only from the HSR construction projects but also from
unprofitable local lines and freight business, the steep increasing in this term shows how much the
construction of these HSR, Tohoku and Johetsu Shinkansen, had been financial burden to JNR.
2.6 Reform of JNR
In the early 1980s, the huge amount of annual deficit in JNR was a very hot issue in Diet. Ministry
of Transportation annual reports in 1981 said that Nakasone administration set up the study group, Ad
Hoc Commission on Administrative Reform, which would powerfully advance the reform of JNR. In
1982, the study group issued the Opinion to the Reform of JNR. Conclusively the reform of JNR was
done in line with it. This was the first official opinion which required JNR to be privatized and divided.
While, on the other hand, JNR also delivered its reform plan by itself in the same year.
-2000
-1800
-1600
-1400
-1200
-1000
-800
-600
-400
-200
0
19
64
19
65
19
66
19
67
19
68
19
69
19
70
19
71
19
72
19
73
19
74
19
75
19
76
19
77
19
78
19
79
19
80
19
81
19
82
19
83
19
84
19
85

35
JNR’s reform plan said that JNR should be a special company wholly owned by the government
and keep it as one national railway company. However, the reform plan from JNR was not approved by
customers and politicians. Kasai (2007) discussed this topic. He said this was because JNR already made
some reform plans from the late 1970s, and all of these already failed then. Indeed that reform plan,
issued in 1982, was the fifth attempt. Eventually, the administration chose the idea from the study group.
It might be that the opinion from the study group was more rational. The opinion had divided the JNR’s
problems into two parts; its institutional structure and its size of management. And each part had four
more detailed explanations.
1. Institutional Structure
1.1 Intervention from the outside of JNR
1.2 Loss of its authority
1.3 Problematic relationship with labor unions
1.4 Constraints in its business field
2. Management Area Size
2.1 Inappropriate branch size
2.2 Standardized management
2.3 Cross subsidization
2.4 No competitive consciousness
Source: web page of MLITT
In the institutional structure, the study group pointed out four problems. The first was that JNR
management was likely to be affected from outside of its management. As this thesis will explain in
Section 2.7, the CEO of JNR had been chosen by the government. It was almost impossible to reject the
construction offer from government sectors.

36
The second was JNR management sector already lost its management authority after the
government passed Act for Construction of Shinkansen Railway Across the Country in 1970, which
defined that the decision whether any new HSR line would be construct would be decided by Ministry
of Transportation.
The third was the problematic relationship with labor union. As this thesis mentioned above,
Although several labor unions had struck many times between 1970 and 1980, the management sector of
JNR could not negotiate with them because they did not have almost any decision making power.
The fourth was strict constraints in its business area; JNR’s business field was strictly constrained
by Japan National Railway Act, and they could do only railway business and subordinate businesses of
railway, such as ferry operation between the main island and Hokkaido.
In the management area size, they also pointed out four problems. The first was inappropriate
branch size. In some areas, some branches had to manage the urban area and countryside area. Actually
there were characteristic difference between management of urban area and countryside area. But the
JNR’s branch size just ignored the difference.
The second was the standardized management in the different areas which had different economic
situations. This means JNR used the single-price system in their all area. In addition, JNR had used the
same compensation package in all their management area, even though the countryside employees’
amount of work was much smaller than the amount of works of employees in urban areas.
The third was the unreasonable cross subsidization. Indeed, the cross subsidization had happened

37
between passenger and freight, urban area and local area, and profitable and unprofitable HSR. Saito
(2001) explained that generally micro economists teach us that the cross-subsidization could reduce the
efficiency of management of almost all industries because it reduces the management incentive from
especially profitable part of business.
The fourth was no competitive consciousness in each branch. This means a profitable branch used
to lose their incentive easily because any unprofitable branches used to use the revenue from the
profitable branch as cross subsidy. Whether working in profitable blanch or unprofitable blanch, there
was no difference in their salaries.
After the study group showed the problems of JNR, the administration accelerated the reform of
JNR with its strong leadership. Kasai (2007) said that, first, the Nakasone administration changed the
CEO of JNR from Nisugi, who supported the reform idea from JNR side, to Sugiura who was supported
by the Nakasone administration.
Second, the administration passed the Act on Temporary Measures Concerning the Reform of
Japan National Railway in on May 1983. In addition, to promote the reform of JNR and oversee the
actual reform of JNR, the administration set up the Administration Committee of JNR Privatization on
June 10 1983. On July 26 1985, the committee submitted the final proposal to the administration. It
suggested that on April 1 1987, all JNR’s business rights would be taken over by JNR Settlement
Corporation, and six passenger railway companies, JR Hokkaido, JR East, JR Central, JR West, JR
Shikoku, and JR Kyushu would take over the each area of passenger railway business, and JR Freight
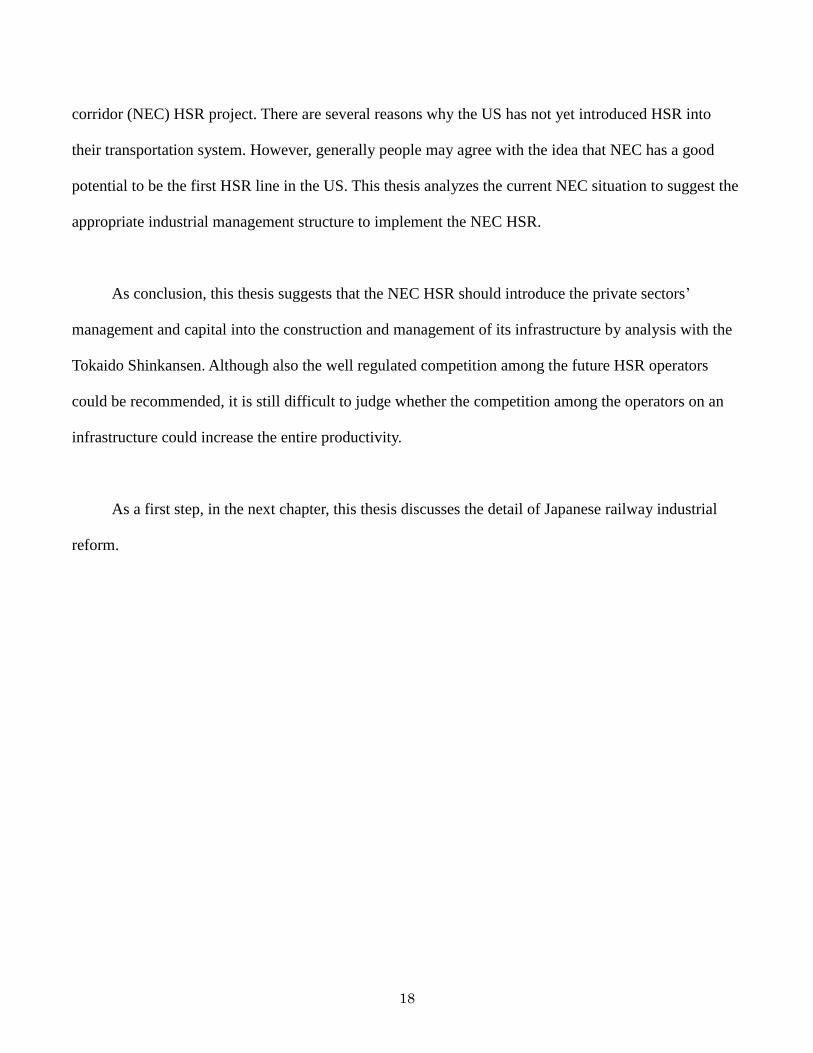
would take over the nationwide freight business Fig 2.8 shows the business area of the each passenger
railway company.
38
Fig 2.8 Japanese current railway business area map
Source: JR East
Third, the administration forced JNR to transfer more than ninety thousand employees to the other
government owned companies, such as post service and telephone business, by April 1 1987, and each
new railway company could employ the appropriate number of employees.
Fourth, 20 .6 trillion yen deficit, made by JNR, would be taken over by the new railway
companies, JR East, JR Central, and JR West, and 16.7 trillion yen would be taken over by the
government budget, national burden, of totally 37.3 trillion yen (about $263 billion in the currency
exchange rate at the time). After the order, the government passed Act of the Japan National Railway
Reform on December 1986 that forced JNR to follow the suggestion.
Kasai explained the part of JNR divided scheme more in detail. Correctly we cannot say that JNR

39
was divided into JRs because JNR could not sort its employees to JRs in a legal way. This was because
they were public officers who had been protected from layoff. That was the reason JNR had an excess
personnel problem. Thus, the administration set up JNR Settlement Corporation which took over all of
the JNR personnel, and the new JRs employed the number of personnel they actually needed. As
mentioned above, the fact that JNR was government owned company had made the reform of JNR
difficult until just before the privatization.
2.7 Law amendment for JRs
The biggest change that happened in 1987 was the regulation reform. Before 1987, JNR was
mainly regulated by Japan National Railway Act (JNR Act). The act was abolished in 1987, and the new
act, Japanese Passenger Railways and Freight Railway Company Act (JR Act) came into effect. Nam
compiled the difference between those two acts, and the differences are shown in table 2.5. Generally
the new act approved JRs to have management flexibility, and JRs were independent from the influence
of government sectors.
Table 2.5 the differences between two acts
source: Nam(2009)
Act JNR Act JR Act
Selection of board membersAppointed by Ministry ofTransportation (appointive system)
Approved by Ministry ofTransportation (approved system)
Budget processRequired to get permission fromMinistry of Transportation,Finance, and Congress annualy
Obligated to submit annualfinancial statement
Revising fee Need to revise actneed to get permission fromMinistry of Transportation
Personnel Public officer Private company's staff
Business Area Restricted only in railway business Basically free

40
There were four main points of differences. The first is the procedure of selecting board members;
in JNR Act, the CEO had been chosen by the administration. And their compensation was determined by
the act. This part had accelerated the government’s intervention. On the other hand, JR Act says that the
JRs need to get permission about their selecting of board members. This means the appointive system in
JNR Act was revised to be the approval system.
The second is budget making process; JNR Act had required JNR to submit its budget plan to
Ministry of Transportation annually, and Ministry of Transportation had needed to negotiate with
Ministry of Finance. After that, the budget plan had to be approved in Congress. When JNR wanted to
issue its bonds, they need the permission from Ministry of Transportation. Conversely in JR Act, almost
all budget planning processes is same with the other private railway companies, even though JRs still
needed the permission from Ministry of Transportation when they issue the company bonds and new
stocks.
The third is the service price revising process; in JNR Act, when JNR wanted to revise its ticket
fee and freight service price, the revising plan needed to pass Diet because JNR’s ticket fee had been
regulated by Public Finance Act. While in JR Act, it said that JRs need to get permission from Ministry
of Transportation. This means the process was changed from that had been required to revise the part of
act to that was required to get permission. Actually since JR Central started the new special HSR service,
which only stop at Nagoya between Tokyo and Osaka, JR Central has charged the extra cost for the
express service.
Fourth is the position of personnel; JNR Act defined that the personnel of JNR were public
officers. Thus, their position had been guaranteed by Public Corporation and National Enterprise Labor

41
Relations Act (1950). Thus, JNR almost had not had the right to shed them. On the other hand, now each
JR’s employees are just staff of private companies in JR Act.
The fifth is the constraint in their business areas; JNR Act had strictly regulated its business areas.
JNR could manage only railway business. This means JNR had been forbidden to manage almost all
non-railway business even though they had lot of potentials. Conversely JR Act required Ministry of
Transportation to accept JRs’ new businesses if their business plan is rational. Currently there are almost
no constraints about the JR’s business filed. For example, JR East had managed the affiliate company
which did the automobile sales.
As mentioned above, we can say the biggest change in 1987 was deregulation. The new JR Act
relaxed a lot of regulations which were set by JNR Act. However, is that privatization? Then, what is the
privatization? This topic is discussed in Section 2.9.
2.8 HSR Holding Company
As explained in the previous section, a lot of regulations were changed between before and after
April 1st 1987. Above all, introducing the vertical separation management, one company or government
sector owns transportation infrastructure, and the other company or government sector manages the
operation of the railway by using the infrastructure, in HSR operation by HSR Holding Company was
the most complicated and still controversial topic. Aida (1992) mentioned about what was the role of
this company and what actually happened around the Japanese vertical separation management.
HSR Holding Company was funded by the government on the basis of Act of HSR Holding
Company. The holding company had owned every HSR infrastructure, and they leased it to JR East, JR

42
Central, and JR West. The holding company had received the usage fee from the three JRs. The holding
company took over the JNR deficit of about 8.1 trillion yen. The HSR usage fee was dedicated to pay it
back. Imashiro mentioned the each company’s ratio of the usage fee was about JR East (Tohoku and
Johetsu Shinkansen) 30%, JR Central (Tokaido Shinkansen) 60%, and JR West (Sanyo Shinkansen)
10%.
This ratio was definitely different from the actual construction cost shown in Table 2.4. Imashiro
concluded that HSR Holding Company undertook a role that redistributed HSR profits from Tokaido
Shinkansen to Tohoku and Johetsu Shinkansen. Indeed, the ratio of HSR passenger was JR East 20%, JR
Central 50%, and JR West 22%. That ratio is closer with the ratio of usage fee than the construction cost
ratio.
At the same time, Act of the Japan National Railway Reform also demanded the government to
open JRs’ stock to the public after the market would recognize that each JR had enough financial
stability. Obermauer (2001) mentioned that although 1987 was generally recognized as the privatization
year of JNR, still the government owned all JRs’ stocks then. If the meaning of privatization is that
previously government owned company would be owned by private sectors, then JR East, JR Central,
and JR West were not privatized in 1987, and the rest of JRs, JR Hokkaido, JR Kyushu, JR Shikoku, and
JR Freight, are still not privatized in 2012. When the government started preparing for the offering of
stock to the public, the presence of HSR Holding Company was regarded as an obstacle.
Kasai explained that why the holding company would be the obstacle; the CEO of Tokyo Stock
Exchange contested the validity of the stability of usage fee. Indeed, the contract between JRs and HSR
Holding Company said that the term of leasing was thirty years. However, they did not explained that
the forward markup and what they would have to do after the contract would be expired in 2017.
Eventually, the government decided to abolish the vertical separation management system, and they sold

43
each HSR infrastructure to JR East, JR Central, and JR West in 1991. Table 2.6 shows the amount of
each payment for HSR infrastructure.
Table 2.6 Aount of money for buyout of each HSR infrastructure
Source: MILTT web page
Imashiro also mentioned that just after the buyout, the financial indexes of JR East, JR Central,
and JR West dropped off, shown in Table 2.7.
Table 2.7 Financial indexes after 1987
Source: Imashiro (1999)
However, after we calculated the productivity of Tokaido Shinkansen’s management, we found
that the ownership of HSR infrastructure by the operator, known as integrated management, has
contributed to increase MFP of Tokaido Shinkansen, shown in Chapter 6.
Buyout fee(billion Yen)
Ratio
JR East Tohoku and Johetsu 3094 34JR Central Tokaido 5096 56JR West Sanyo 1001 11Total 9100 100
1987 1990 1993JR East 81.1 83.9 78.1JR Central 91.3 87.9 64.8JR West 90.6 86.5 85.9JR East 4.5 8.1 5.2JR Central 7 11.7 5.8JR West 1.1 9.8 5.8
EPR=(operating expenditure)/(revenue)PPR=(current profit)/(revenue)
EPR (%)
PPR (%)

44
2.9 Definition of Privatization
The significant difference between Japanese and EU vertical separation management was their
intents. As this thesis discussed in Chapter 3, EU originally intended to stimulate the competition within
HSR operators to improve passengers’ benefit and operators’ management efficiency. On the other hand,
the role of Japanese HSR Holding Company was just to redistribute the revenue from the highest
profitable line, Tokaido Shinkansen, to the lower profitable lines.
Kasai explained that after the government and JRs cleared the obstacle, the government cashed
out part of JR East’s stock in 1993, JR West in 1996, and JR Central 1997. Since 2001 on the eve of
completing privatization, JR East, JR Central, and JR West no longer have been under the regulation in
JR Act. Now they are just regulated by Railway Business Act which regulates all Japanese private
railway companies. Finally, the government cashed out the rest of JR East’s stock in 2002, JR West in
2004, and JR Central in 2006, shown in Table 2.8
Table 2.8 Process of the privatization
Source: Kasai (2007)
Year Event
1987
JNR's business right was taken over by JNR settlementcorporation.HSR infrastructure was taken over by HSR holdingcompanyNew 6 passenger railway companies and a freight railwaycompany started their businesses
1991 HSR holding company was deactivated1993 The government released the part of JR East's stocks1996 The government released the part of JR West's stocks1997 The government released the part of JR Central's stocks2001 JR East, West, and Central was released from JR Act2002 All JR East stocks were released into the market2004 All JR West stocks were released into the market2006 All JR Central stocks were released into the market

45
As this thesis mentioned above, even though the JNR was recognized to be privatized in 1987
generally, it is not correct. At least when JNR was privatized depends on what is privatization. Starr
(1988) defined and categorized privatization. He said that privatization is very “ambiguous” word.
However, the most important point is “ownership” of the organization. Obermauer set the five levels in
the railway ownership and Table 2.9 shows that. She defined that the complete privatization means the
companies’ almost all stocks should be owned by private sectors or individual stock owners, level 5.
Table 2.9 Levels of ownership of passenger railway companies
Source: Obermauer (2001)
At this point, JR East was entirely privatized in 2002, JR West was in 2004, and JR Central was in
2006.
2.10 HSR construction scheme after 1987
Until the entire privatization, each JR (JR East, JR Central, and JR West) have been still stuck in
constraints by the public sector’s control, such as the system of HSR Holding Company and JR Act.
From this point of view, how to alleviate the intervention from the public sectors has been significant
issue to JRs. Especially, the project of new HSR construction, which needs huge capital cost, was a very
Railway Companies
Level 1State-owned companies withoutcommercial statutes
None
Level 2State-owned companies withcommercial statutes
Luxembourg Railways, Irish Railways, Portuguese Railways,Danish State Railways, Austrian Federal Railway, RENFE,SNCF, SNCB
Level 3Joint-stock companies, majoritystate owned
JR Freight, JR Hokkaido, JR Kyushu, JR Shikoku, DB,Trenitalia,
Level 4Joint-stock companies, majorityprivately owned
None
Level 5Fully privately owned joint-stockcompanies
JR East, JR Central, JR West, TOCs in the UK, Italo
Levels

46
sensitive topic to each JR. Thus, the government revised Act for Construction of Shinkansen Railway
Across the Country. MLITT shows the construction financial scheme in its official web page. Fig 2.9
shows the image of the financial scheme.
Fig 2.9 Current HSR finance Scheme
Source: web page of MLITT
After the revision of the act, MLITT has been required to make an agreement with operators, JR
East, JR Central, and JR West, and local governments to start any HSR projects. In addition, the local
governments have to finance about roughly one third of total construction costs. The financial
responsibility of operators for the HSR projects became much smaller than before 1987. Although JRs
needs to finance the part of initial construction cost of HSR which they would operate, the burden is
suppressed less than the profit from the new HSR.
Imashiro mentioned that the new financial scheme increased the burden of local governments and
decrease the burden of operators. However, he also concluded that the taxpayers have recognized that
HSRs have contributed to their social benefits very well over a long period of time since 1964. From this
point of view, JNR going bankrupt was a great lesson about “who should finance the social
infrastructure.” Indeed, almost the same thing happened in EU countries in the 1990s and 2000s. The
first HSR in France and Germany were completely financed by their national railway companies, SNCF

47
and DB. However, each country already introduced the public money to continue constructing their HSR
network. This thesis explains more detail about it in Chapter 3.
2.11 Conclusion of Japanese railway reform
As this thesis shows above, the financial situation of JNR in the 1950s and early 1960s were good.
After 1964, JNR had been deficit-ridden company until 1987, reform year. The deficit was mainly from
the imposed financial burden when the government had continued constructing uneconomic, but socially
important, HSR lines. Simultaneously JNR’s management had been restricted in many areas, and they
did not have a withdrawing right from any railway businesses.
It is difficult to say that JNR had failed its business alone. In addition, HSR lines, which were one
of the reasons that compounded JNR’s financial difficulty, are appreciated as the great transportation
mode nowadays, as this paper mentioned at the beginning. Imashiro explained that the JNR reform and
new HSR finance scheme were constructed through the great “tried and error” processes, which acquaint
taxpayers and politicians with what they need to distinguish public sector’s and private sector’s role,
responsibility, and risk.
In the next chapter, this thesis discusses what actually happened in Europe, especially France,
after Sweden introduced vertical separation management in their railway management in 1988.

48
Chapter 3
Europe / France
3.1 Introduction
When JNR lost its transportation mode share in the 1970s, as shown in Chapter 2, the European
passenger railway transportation also lost its mode share too. This is explained in detail in Section 3.2.
At the same time, the success of the Japanese HSR, Tokaido Shinkansen, made the European railway
industries recognize that HSR could be the main transportation mode in the next several decades.
According to the International Union of Railway (UIC) web page, the Pompidou administration
decided to introduce HSR in France in 1974, ten years after the opening of Tokaido Shinkansen. Finally,
in 1983, France completed the first European HSR between Paris, the capital city of France, and Lyon,
the city which has the second largest economy. In general, the Paris-Lyon line has been highly
appreciated as a successful investment.
Vickerman (1996) said that after the Paris-Lyon line’s operation was started, travel time was
reduced from around four hours to two hours, and “total rail passengers on the corridor increased from
12.5 million in 1980 to 22.9 million in 1992, 18.9 million being TGV passengers.” This suggests the
TGV Paris-Lyon line has not only reduced the existed passenger’s travel time, but also created the new
demand of passengers between these cities.
We can say that the other developed European countries also recognized the French investment in
HSR as a significant success. This is evidenced by the fact that Germany, Italy, and Spain have followed
France in developing HSR. Germany started its first line in 1991, Italy in 1992, and Spain in 1992.

49
Subsequently, all of these countries have continued to extend their HSR networks. We can say that HSR
has been one of the most important passenger transportation modes in Europe. On the other hand, the
development of HSR networks has almost exclusively happened domestically, not as international
transportation, in which one train operation crosses the national borders.
Nash (2004) said that although the European railway industry has had a profitable international
passenger railway market, they could not manage its operations well. This problem has been because
each country’s railway industry was owned by each government, and they had independent regulations,
signal systems, and requirements for staff, including for licenses. Thus, the process of unification of
railway management structure in Europe has not progressed well.
On the other hand, European Union (EU) has wanted to improve the European railway industries’
management efficiency. Thus, they forced European countries to introduce vertical separation, which
could lead the competition within the railway operators, as discussed in Section 3.5 in detail. However,
although EU originally expected the vertical separation management to stimulate the operators’
competition, it has not happened well. This chapter explains what has actually happened in European
passenger railway industry, and discusses what the obstacles to introduce the effective competition in the
railway operations market.
3.2 Before HSR
Historically each European country had owned each national railway company, Deutsche Bahn
AG (BD) in Germany, Société Nationale des Chemins de fer Français (SNCF) in France, Ferrovie dello
Stato S.p.A. (SF) in Italy, Red Nacional de los Ferrocarriles Españoles (RENFE), and so on. Their
national railway systems started in the early 20th century. According to the SNCF annual report (2010),

50
SNCF was founded in 1938 when the previous national railway company, Chemin de Fer, amalgamated
the other five private railway companies.
In the 1970s, SNCF lost its transportation mode share gradually due to the increasing motorization
just as happened in Japan. From 1970 to 2000, French railway industry lost about two percent
transportation mode share. Table 3.1 shows the mode share transformation from 1970 to 2000.
Table 3.1
Change of French transportation mode share (passenger km %)
Source: The Public Purpose (2004)
The motorization happened not only in France but also in all European countries. On average, the
European railway industry lost about four percent mode share from 1970 to 2000. Fig 3.1 shows the
change of passenger transportation mode share in the European Union.
1970 1980 1990 2000Auto (%) 81.7 82.45 83.94 85.05Bus (%) 6.34 6.67 5.78 5.41Tram & Metro (%) 1.64 1.35 1.36 1.21Railway (%) 10.32 9.53 8.93 8.35

51
Fig 3.1 Transfer of Passenger transportation mode share in EU
Source: Nash (2004)
On the other hand, the demand on the most congested intercity passenger line in Europe, which
was between Paris and Lyon, was reaching capacity. Vickerman explained that the fundamental rationale
for constructing the new HSR line between Paris and Lyon was to improve “the inadequacy of capacity
on certain critical stretches of line where only two tracks were in operation.”
As this thesis already showed in Chapter 2, this rationale was the same with Japanese Tokaido
Shinkansen. Vickerman said that French national railway company, SNCF, started to negotiate with the
French government to allocate the enough budget to the HSR project between Paris and Lyon.
3.3 Paris-Lyon line
As described above, the idea for constructing the new line between Paris and Lyon to increase its
transportation capacity was developed by SNCF in the early 1970s. At that time Japan already had had
more than five years HSR operation experience. So it was reasonable that SNCF planned to construct
73.8 76.4 79.2 78.3
12.6 11.6 9.1 8.5
10.2 8.2 6.6 6.3
0
10
20
30
40
50
60
70
80
90
100
1970 1980 1990 2000
Auto (%) Bus (%) Air (%) Tram & Metro (%) Rail (%)

52
HSR in the most congested corridor. According to Miura and Akiyama (2008), SNCF conducted
in-depth research about Tokaido Shinkansen’s technology, operation planning, profit ratio, and so on.
They decided to call their HSR TGV and started the TGV project. In 1974, the Pompidou administration
approved the new HSR project.
In the financing of construction cost, we can see the commonality with Tokaido Shinkansen.
Vickerman said that “TGV Paris-Lyon was financed entirely by SNCF on the basis of an expected
minimum 12% financial rate of return”. This means SNCF originally believed that the TGV Paris-Lyon
line would have a positive outcome on the finances of SNCF. They had constructed the almost exclusive
HSR line between Paris and Lyon from 1976 to 1983. The meaning of “almost” is that TGV system uses
the common lines with local railway operations near the station areas to reduce the initial construction
costs, in costly urban areas.
This is the biggest technical difference from Tokaido Shinkansen, which runs on the completely
exclusive line and the platforms in the stations. In 1981, SNCF started the limited operation between St.
Florentin and Lyon (301km). Two years later, in 1983, they started the full TGV operation between Paris
and Lyon (417km).
The first European HSR, the Paris-Lyon line, has been appreciated as a significant new
transportation mode which has potential to be profitable. Vickerman said that the actual financial rate of
return has been higher than SNCF expected. After this success, SNCF accelerated to extend its TGV
network. Vickerman also explained that the success of the Paris-Lyon line in terms of both traffic and
revenue confirmed the citizens’ view that investing in HSR would be an appropriate choice, not only for
SNCF but also for all citizens. Table 3.2 shows the HSR construction pace in each European country
53
from 1981 to 2002.
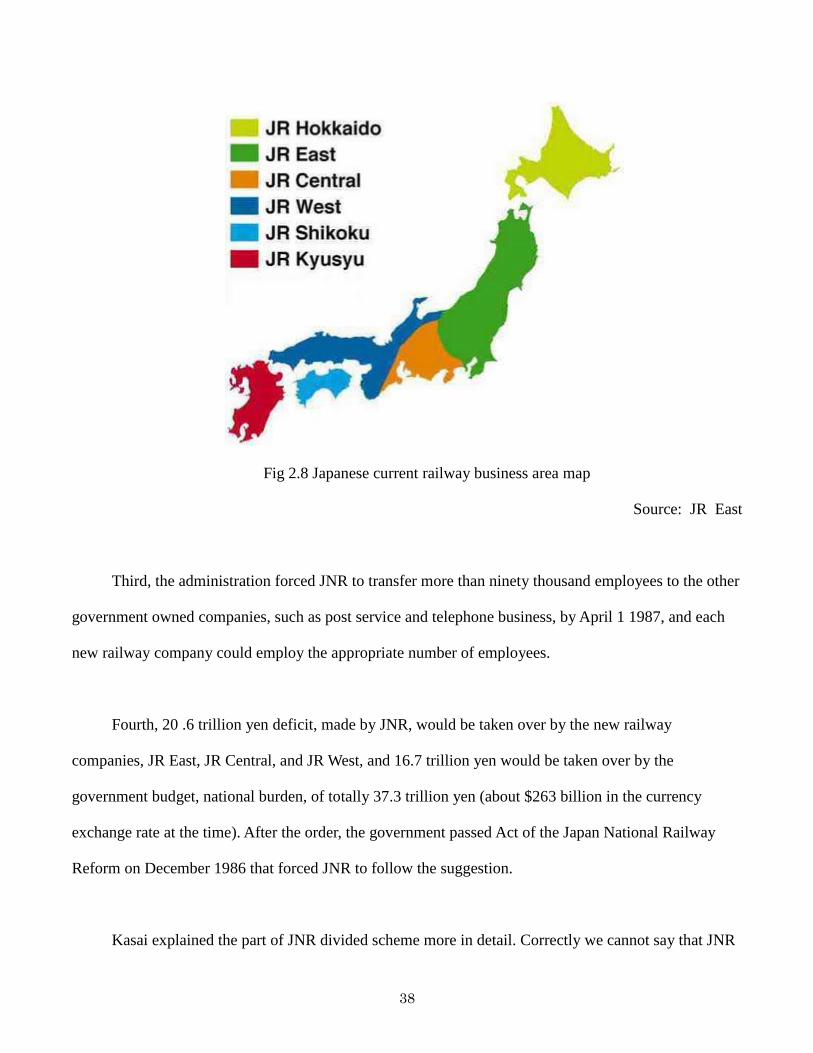
Table 3.2 Expansion of the European HSR networks (km)
Source: Union International des Chemins de Fer
Transportation Policy Journal, internet news site, said that “from its TGV service, SNCF has made
significant profits, which have reached 900 million euro annually in recent years, much of which has
been used to cross-subsidize losses on slower intercity trains serving smaller cities…and regional rail.”
SNCF has been using the same approach with JNR to continue the operation of unprofitable local and
intercity lines.
Quinet also said that “the most profitable TGV lines have already been built and that the future
ones will be less profitable.” This means that SNCF and the French government have intentionally used
cross-subsidization to spread TGV network, with subsidies from the Paris-Lyon line to the construction
costs of the other unprofitable or less-profitable TGV lines. The entire TGV network map is shown in
Fig 3.2.
1981 1982 1983 1988 1990 1995 1996 1997 1998 1999 2000 2001 2002Germany 434 434 486 491 510 510 687Spain 377 377 377 377 377 377 377 377France 301 301 417 417 667 1124 1147 1147 1147 1147 1147 1395 1395Italy 237 259 259 259 259 259 259

54
Fig 3.2 French TGV Network
Source: Parisbytrain.com
3.4 Public view of SNCF and TGV project
The finance scheme of French TGV project introduced public money from the second TGV line,
TGV Atlantic, between Paris and Le Mans. Vickerman said that the French government paid for 30% of
total construction costs in the line. This was because the government understood that construction of

55
TGV could contribute to developing the regional economy. This part was completely different from the
Japanese case: however JNR, rather than the government, had financed HSR infrastructure until JNR
was reformed in 1987, as explained in Chapter 2 in detail. As shown in Table 3.2, SNCF had continued
extending its TGV network energetically with financial support from the government.
On the other hand, in the 1990s, after they constructed three more TGV lines since the Paris-Lyon
line, the Atlantic line in 1989, the Rhone-Alpes line in 1992, and the Northern Europe line in 1993,
SNCF was heavily in debt. Table 3.3 shows the amount of railway debt in European countries.
Table 3.3 Railway debt in Europe in 1997
Source: Mercer Management Consulting (1998)
Although Vickerman said “SNCF regards its TGV investment as hugely profitable taken on their
own”, continuing constructing the TGV network had made its debt (mainly loans from the government)
large. Quinet (2005) said that a significant amount of the debt was mainly from the investment in new
lines between the 1980s and 1990s, and “that large investments had been made in the first three
high-speed rail lines during this period.” We can say that the financial situation of SNCF and the reason
of its significant amount of debt in 1997, shown in Table 3.3, were very similar to JNR in the early
1980s.
Railway Debts(Million Euro)
Railway Debtin % GDP
Austria OBB 2892 1.7Belgium SNCB 3539 1.8Netherland NS 2807 1.0France SNCF 28731 2.6Germanny DB, AG 5795 0.3Italy FS 42067 4.9Spain RENFE 8140 2.0

56
Even though the amount of debt in SNCF was significant, politicians, citizens, and SNCF did not
think that SNCF was almost bankrupt like JNR. This was because SNCF was considered as the public
organization which should achieve social equity in France. Indeed, SNCF’s management has been
originally supported by the subsidies from the government and other state bodies.
Henry and Quinet (1998) shows that the ratio of subsidies to their total income was about 32% in
1994. Quinet also explained the people’s feeling for SNCF. He said that “the concept of public service is
deeply rooted in French attitudes. It is extensively defined in French legislation: there is a special body
of laws for public service and special courts to interpret them. The French view public service as a tool
not just to address the basic needs and failures of markets, as seen from an economic point of view, but
also to achieve equity or distribution goals.” For this reason, SNCF had the political support to continue
extending TGV network even with significant amount of debt.
3.5 Birth of vertical separation management
While France had continued its traditional railway management system, some countries were
skeptical about the sustainability of the traditional railway management. Sweden was one of these.
According to Uekusa (1991), the national railway company of Sweden, Statens Jarnvagar (SJ), had run
into financial difficulty in the 1960s. Then SJ had survived with subsidies from the government and
states. In addition, SJ had used cross-subsidization: the revenue for some profitable lines would cover
the debt from unprofitable lines.
As shown above already, JNR and SNCF also used this approach, and it was the fundamental
management scheme in almost all national railways around the world at that time. However, generally
speaking that cross-subsidization forces the income reallocation between urban residents and rural

57
residents, and reduces the incentive from national railway companies, which should rationalize its
unprofitable lines.
To solve the problem, the Swedish government approved Act of Transportation Policy in 1976.
Jansson, Owen and Cardenbring (1989) explained the important parts of the act. The act differentiated
legally between the lines which had profitability and the lines which did not have profitability but had
necessity for the society. SJ would have a responsibility to operate profitable lines. On the other hand, SJ
would be absolved of responsibility for operating unprofitable lines. Instead of SJ, the go/no-go decision
for the unprofitable lines would be under the government’s responsibility.
If the government or state governments wanted SJ to continue operating these unprofitable lines,
they had to buy the operation service for the unprofitable lines from SJ. This means that even though the
government had still paid money to SJ, this was not subsidy but compensation for the social equity
service by SJ. In addition, the government allowed SJ to introduce the marginal cost pricing system into
the profitable lines.
Now all railway industries appreciate this act as an epoch-making experiment. Nilsson (1988)
explained that the act differentiated between “business economy and social economy”. In fact, almost all
national railway companies and the governments who were owners of these companies misunderstood
the role of railway industry until then. These public sectors mixed up the business economy with the
social economy in their national railway companies historically.
In the business economy, which was represented by the profitable lines in Sweden, SJ had
responsibility to earn revenue to improve its service and customer satisfaction to compete with other

58
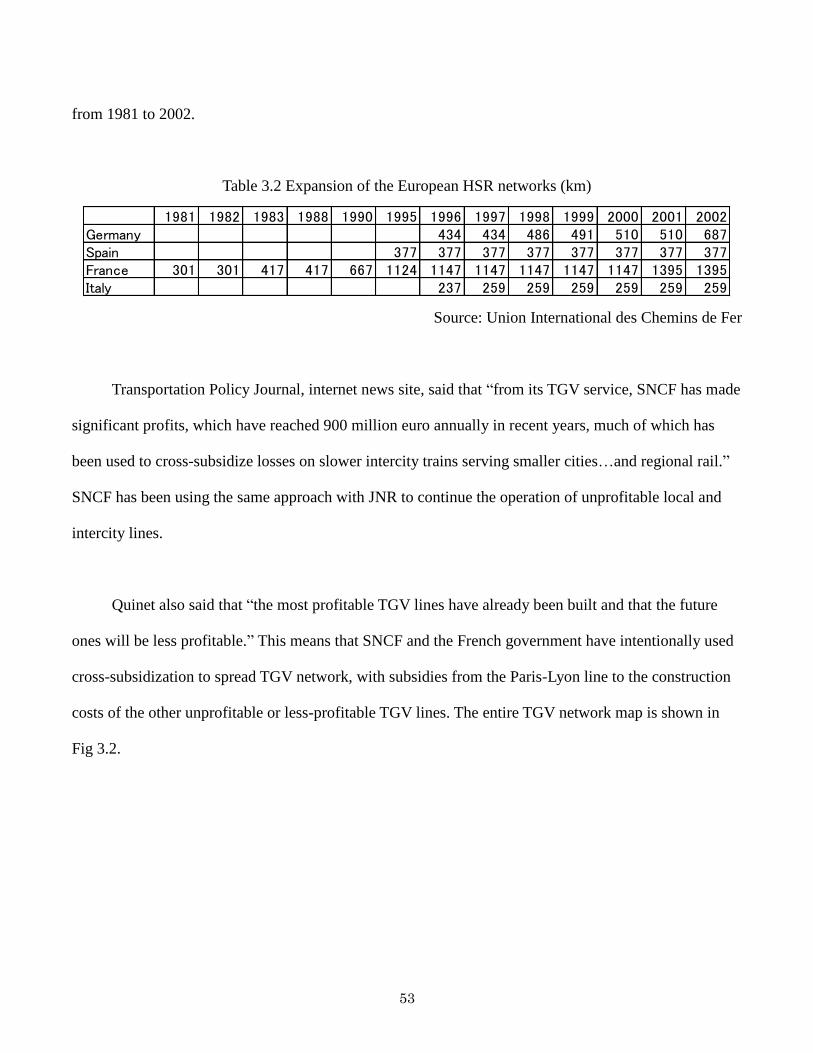
transportation modes. On the other hand, in the social economy, which was represented by the
unprofitable lines, SJ could not discontinue these operations even though these operations were quit
unprofitable because people believed that SJ had a responsibility for the social equity. We can say that
Act of Transportation Policy in 1976 differentiated these two roles clearly. Then, the remaining concern
was how the government would introduce the principle of market competition into the business
economy.
The Swedish government approved the Act of Transportation Policy in 1988 to solve the
remaining problem. According to Imashiro, the act funded Banverket (BV), Ministry of Railway, to
introduce the vertical separation management system: SJ would have to participate in the bidding if the
other railway operators also want to operate any railway line, and BV owns all Swedish railway
infrastructure. This means BV has to open the all railway operation market to any other candidates who
want to operate any railways on BV’s infrastructure. The government and state governments have to
solicit bids to decide operators.
Indeed, in 1990 three states collectively funded the new railway company, BK-Tag, because these
three states realized that the amount of payment for the SJ’s service in their states was not reasonable.
Geukler (1991) said that BK-Tag started the 500 km operation in 1991 instead of SJ. In addition, Fujioka
(1992) mentioned that in some “social business” lines, the local government could reduce the operation
cost by about twenty to thirty percent by the bids.
As mentioned above, two acts approved by Sweden in 1979 and 1988 made great impacts on
European railway industry. Traditionally, the national railway companies had two roles in their services;
the first is the competitive transportation service against any other transportation modes. The second is

59
the social equity service. In the first role, railway companies have to compete against automobile, bus,
and sometimes airline transportations. Then, they have to improve their service quality to keep or
increase the number of customers, and they should introduce the marginal social pricing system. In this
role, national railway companies were exposed to the market competition.
On the other hand, they did not discontinue social equity services even though these would
probably have been unprofitable. This was because people believed that they had public responsibility.
However, the social business aspect had reduced national railway companies’ market competition power
in business economy area by cross-subsidization.
In Sweden, the first act differentiated the first and second roles. SJ would have the responsibility
only for the first role, and the public sectors took over the responsibility of the second role. In the second
act, which was approved in 1988, SJ got relief from the responsibility of the infrastructure management.
However, instead of this, SJ came under the principle of market competition in all domestic railway
lines. This restructuring of the railway industry, which happened in Sweden, has been appreciated
generally and recognized as vertical separation management. This new management structure inspired
EU to feel the necessity of restructuring of European railway industry.
Rivera and Trujillo (2004) showed the example of how Swedish railway restructuring was more
thorough compared to German one, shown in Table 3.4. German reform is shown in the next section.
Table 3.4 said that before Sweden introduced the vertical separation management with competition, they
needed more than 8 times operating staff as much as Germany. However, after they introduced the
competition, Sweden just needs the half number of operating staffs of Germany needs, even though
Germany also introduced the vertical separation management and minimal competition in their operation
60
market.
Table 3.4 Analysis of reform in two European countries (annual average rate of growth in %)
Source: Rivera-Trujillo (2004)
Rivera and Rtujillo judged the operation efficiency difference between Germany and Sweden
came from the degree of the competition in their operators’ market.
3. 6 Role of European Union
As shown in the previous section, the vertical separation introduced in Sweden inspired EU and
the other European countries. This was because the European railway industries, both passenger and
freight, noticed that the vertical separation management could be a key to solving the chronic problem in
the international railway transportation mode in European countries, and it could achieve the open
access; all railway infrastructure is opened to all railway operators.
According to Nash (2004), the railway industry had the serious border problem compared to
automobile and airline transportation. Nash said that when one passenger or freight railway operation
would pass the border, they had to clear several problems.
First, passengers had to switch trains at the border city because sometimes each country used an
independent signal system. Second, each country had an independent train drivers’ license system. The
Pre reform Post reform(Train km)/(Train operating staff)Sweden 0.45 10.15Germany 3.98 5.73

61
operators sometimes needed to change train crews at the borders. Third, the national railway companies
could deny the access request from the other railway companies who want to use their infrastructure.
This was because they owned infrastructure, and there was not unified regulation about international
railway operations.
The national railway company could charge unreasonable railway usage fee to the new entries.
Nash said that although the EU of course noticed this problem before Sweden introduced the vertical
separation management, and they noticed that vertical separation management could make open access
possible, they could not reconcile the conflicting interests of different countries concerning the open
access.
However, after the success of vertical separation management in Sweden, Introducing the vertical
separation management and open access became the realistic policy. European Commission (EC),
executive body of EU, adopted 1893/91 Council Regulation of 20 June 1991 Amending Regulation
(1991). This regulation required the governments to absolve their national railway companies from the
obligation of unprofitable public service. Shortly after that, EC also adopted 91/440/EEC Council
Directive of 29 July 1991 On the Development of the Community’s Railways (1991).
First, this directive stipulated the national railway companies to separate their management from
their governments. Second, the national railway companies were forced to divide the railway operations
from the management of railway infrastructure. The regulation and directive showed that EU concluded
that the vertical separation management could accelerate the open access, and the open access could be a
good catalyst for the international freight and passenger railway operations. This happened three years
after Sweden introduced the vertical separation management.

62
By following these regulations, each country started the restructuring of their railway industries.
However, the speed of the restructuring process and final organizational structure were different. The
first case was Germany. According to Link (2004), after the reunion of German in 1990, the government
amalgamated Deutsche Bundesbahn (DB), former West German national railway company, and
Deutsche Reichsbahn (DR), former East German railway company. The name of new unified national
railway company was DBAG, a public limited company with share capital owned by the German federal
government completely, in 1994. Nash (2009) said that Germany was the first country which opened
their passenger railway operation market for new entries after EC forced member countries to introduce
the vertical separation management.
However, Nash also pointed out that DBAG still holds both the operation company, DB Bahn, and
the infrastructure management company, DB Netz, in one organization. The German federal government
just separated them within the group holding company. Indeed, Link said that DBAG remains very
dominant. She said that this was because organizational arrangements favor the incumbent. She showed
that the new entries had just got eight percent of train km in the regional railway services, not in the
HSR operation market.
As mentioned above, German passenger railway business, especially HSR operation market, was
still monopolized by the former national railway company. And this not only happened in Germany but
also happened in France, Italy, and Spain. This thesis explains, in the next chapter, why these countries
which have large railway market, especially France, did not want to introduce the open access.
3.7 French Reform
Quinet explained that “France was probably one of the most reluctant countries to provide open

63
access.” This section explains why the French government does not appreciate the EC regulations.
Quinet talked about the French railway reform. The French government founded Reseau Ferre de
France (RFF) in 1996 to separate the railway infrastructure ownership from SNCF to obey the EC
regulations. Then, RFF took over 20.5 billion euro debt from SNCF. However, Quinet showed several
evidences that they, SNCF and RFF, are still almost vertically integrated. First, RFF offered the
infrastructure maintenance jobs to SNCF. Indeed, RFF paid about 2.6 billion euro for its infrastructure
maintenance jobs to SNCF, and also received about 2.3 billion euro from SNCF as infrastructure usage
fee in 2004.
RFF does not need to open its infrastructure maintenance market to other than SNCF. Second,
RFF has only about five hundred employees to manage French nationwide railway infrastructure. On the
other hand, SNCF still has the infrastructure division. They can negotiate about the maintenance fee and
infrastructure usage fee exclusively. In fact although the main purpose to introduce vertical separation
management was to improve railway industries’ management efficiency, the amount of debt from the
railway system rose from 35 billion euro to 41 billion euro between 1997 and 2003.
Quinet said that the half of this debt was from new TGV infrastructure investment financed
mainly by RFF, and SNCF has operated TGV on the new and existing lines exclusively. Quinte said that
no new entry has come into French railway operation industry. He explained the reason for this that
there are too much complicated relationship and legal contracts between the French government, SNCF,
and RFF.
Now the French government released the information that they are planning to reunify SNCF and
RFF. International Railway Journal said that “The government plans to unify the operation of the

64
national rail network by bringing together functions currently carried out by French Rail Network (RFF)
and French National Railways (SNCF).” This action is counter to EU regulations. This means the French
government officially showed that they were not willing to introduce the vertical separation management
into SNCF.
Putting aside the morality of French rebel stance to the vertical separation, quitting it would make
sense for them. Quinet said this is because the current assumed vertical separation would produce the
transaction cost within SNCF and RFF.
Quinte also expresses understanding partly for the French policy. He said that originally the
national railway, SNCF, had a responsibility to achieve the social equity. Hence, SNCF constructed a
mega-TGV network with a significant investment. Now SNCF has to earn the revenue from the network
to pay back the debt with its monopoly power. However, if SNCF would accept any new entry operators
in the operation of TGV, SNCF would probably lose its monopoly power and high profit. Nash
explained that German and France already have invested significant amount of money in their HSR
infrastructure.
Now they have to recover the costs by the revenue from these HSR. Thus, the idea of the open
access to HSR is almost “cherry picking” for them, said by Nash. The French and German governments
also support the monopoly of DB and SNCF passively. Community of European Railway shows how
much each government had paid for each railway infrastructure by 2006. French spending on rail
infrastructure was 10.1 billion euro, and German was 8 billion euro. On the other hand, Sweden was 1.5
billion and Finland, which also already introduced the open access, was 0.5 billion euro, shown in Table
3.5

65
Table 3.5 State Financial Support to Rail
Source: Community of European Railway (2006)
From this data, we can say that the relatively small countries that have the small railway market
and small amount of debt from the railway infrastructure were willing to introduce the vertical
separation. On the other hand, the countries that already have the mature railway market and significant
amount of debt from the railway infrastructure were passive to introduce the vertical separation
management. This is because that the vertical separation management might give the operators of small
countries chances to join the large market, and oppositely it might give the countries that have mature
railway market risk of losing its market, and monopoly power in the market, by the new entries.
As shown above, the real market competition that EC expected has not happened yet in European
HSR industry. On the other hand, some new completely private railway operators, such as Veolia and
Nuovo Transpori Viaggiatori (NTV) are now planning to join the HSR operation market. Furthermore,
SNCF contribute to these projects.
3.8 Competition in HSR market
In contradiction to the current French and German domestic market, some new competition is
going to happen in the European HSR operation market. Nash said that in Italy, NTV is trying to enter
into the HSR operation business between Napoli to Rome from April 2012. Interestingly, SNCF
2006 DataState spending on rail infrastructure(in million euro)
Track length(km)
France 10100 52820Italy 5126 23193Germany 8001 64219Finland 1415 13496

66
capitalized 20% of NTV. On the other hand, the former Italian national railway company, Trenitalia,
made a contract with Veolia, the private transportation company, to incorporate to operate the HSR
between Paris and Brussels, and London and Strasbourg.
However, Nash concluded that “it is doubtful as to the extent of potential new entry elsewhere.”
The first reason is that European countries still have some different management structures respectively.
This is because they could not unify the management system. Table 3.7 shows the organizational
structure in Europe.
In addition, EU could not force these former national railway companies to be privatized. Nash
pointed out that this was one of the fundamental reasons why EU has been failing to introduce the true
competition. These national railway companies still have obligation to do “social service”. Thus, they
need their monopoly power in their profitable lines to continue the cross-subsidization. Nash concluded
that just introducing the vertical separation management was not enough to stimulate the competition
within the operators.

67
Table 3.6
Rail Organization in Western European Railways in 2004
Source: Nash and Rivera-Trujillo (2004)
The other reason why actually true competition did not happen in European HSR operation market
is that some infrastructure owning companies, RFF in France, DB nets in Germany, and ADIF in Spain,
are charging too high an infrastructure usage fee to operators. According to International Transportation
Forum (2005), RFF charged much higher infrastructure usage fee to SNCF to operate the TGV network
than the estimated marginal cost of it. The reason why RFF set such a high usage fee is that just they
want to eliminate the competition from the TGV network.
3.9 Conclusion
As mentioned above, the competition within operators in HSR market has not happened yet at
least in France. This is because fundamentally France believes that the open access idea is not fair to the
countries that already have the mature passenger railway market, especially HSR network. On the
surface level, although French passenger railway industry introduced the vertical separation
CountryDegree of Separation of
Infrastructure fromOperation
Degree ofCompetition
Main Operator Infrastructure
Belgium Only accounting separation None SNCB state ownedSNCB stateowned
France Institutional separation None SNCF state owned RFF state owned
Germany Organizational separation All marketsDV AG Verticallyintegrated railway dividedinto groups and divisions
DB Nets AGstate owned
Italy Organizational separationFreight and regionalpassenger service
FS state owned RFI state owned
Spain Institutional separation None RENFE state ownedADIF stateowned
Note: The term institutional separation is used to denote totally separate institutions; Organizational separationis used where infrastructure and operation are separate subsidiaries of the same holding company.

68
management technically, there is no real competition. In addition, German, Spain, and Italy, countries
which have HSR networks and large debt from these, also still monopolized their HSR operation market
by their former national railway companies. Chapter 6 introduced the previous research which analyzed
whether introducing the vertical separation management contributes to improve the productivity of
entire French railway operation management by SNCF.
In the next chapter, this thesis explained the history of productivity analysis and how this thesis set
our research objectives and why our research objectives are appropriate to evaluate the effect of the
railway industrial reforms.

69
Chapter 4
Productivity
4.1 Introduction
When people evaluate an industry or company, there are several indices, such as revenue, profit,
and total capitalization. On the other hand, the previous research which analyzed the industrial reforms,
including privatization, deregulation, and price freedom, applied productivity analysis. Especially
multi-factor productivity (MFP) or total-factor productivity (TFP) have been used effectively to evaluate
the effect of these industrial reforms.
Although people often use the words productive or nonproductive to explain job quality and
efficiency, the academic meaning of “productivity” is very different from such a general meaning. So we
need some steps to understand what the academic meanings of productivity and multi-factor
productivity (MFP) are. In this chapter, we show an intuitively understandable example of the
introductory level productivity definition.
4.2 Single factor productivity
The most commonly used example of introductory level productivity analysis is one that evaluates
the factory’s labor efficiency. In this example, imagine a small factory in arbitrary year 1. The factory
employed five workers, and they produced 100 widgets in that year. In the next year, year 2, the factory
added five employees, and they produced 200 widgets. It is intuitive. Twice the number of employees
could produce twice the amount of widgets. However, at the same time, the labor productivity growth of
the factory is 0. The formula is

70
∆P =
{
(
𝑠𝑡𝑢𝑓𝑓𝑠𝑦𝑒𝑎𝑟2
𝑒𝑚𝑝𝑙𝑜𝑦𝑒𝑒𝑠𝑦𝑒𝑎𝑟2)
(𝑠𝑡𝑢𝑓𝑓𝑠𝑦𝑒𝑎𝑟1
𝑒𝑚𝑝𝑙𝑜𝑦𝑒𝑒𝑦𝑒𝑎𝑟1)
⁄
}
− 1 (1)
Where ∆P is the change of productivity from year1 to year2.
In actual numbers,
∆P =
{
(200
10)
(100
5)
⁄
}
− 1 = 0 (2)
In the next year, year 3, the factory also employed new 5 workers. In this year, they produced 330
widgets. If we could estimate from the past data the amount of widgets that would be produced by
fifteen employees in year 3, our calculation result might be 300 widgets. However, we can intuitively
understand that this gap between our estimation and the actual result sometimes may happen. At that
time, the growth of labor productivity is
∆P =
{
(
𝑠𝑡𝑢𝑓𝑓𝑠𝑦𝑒𝑎𝑟3
𝑒𝑚𝑝𝑙𝑜𝑦𝑒𝑒𝑠𝑦𝑒𝑎𝑟3)
(𝑠𝑡𝑢𝑓𝑓𝑠𝑦𝑒𝑎𝑟2
𝑒𝑚𝑝𝑙𝑜𝑦𝑒𝑒𝑦𝑒𝑎𝑟2)
⁄
}
− 1 (3)
In actual numbers,
∆P =
{
(330
15)
(200
10)
⁄
}
− 1 = 0.1 (4)
The result of equation (4) means that the factory got 10% labor productivity growth from year 2 to
year 3. The important thing we need to know is that there was no definition of each year’s productivity.
We cannot know the productivity of the factory in year 1, year 2, and year 3. We can only know that the
productivity growth between year 1 and year 2, and between year 2 and year 3 in this case. The general

71
function of the factory’s labor productivity in this case is
∆P =
{
(
𝑠𝑡𝑢𝑓𝑓𝑠𝑦𝑒𝑎𝑟𝑇
𝑒𝑚𝑝𝑙𝑜𝑦𝑒𝑒𝑠𝑦𝑒𝑎𝑟𝑇)
(𝑠𝑡𝑢𝑓𝑓𝑠𝑦𝑒𝑎𝑟𝑇−1
𝑒𝑚𝑝𝑙𝑜𝑦𝑒𝑒𝑦𝑒𝑎𝑟𝑇−1)
⁄
}
− 1 (5)
Where year T is an arbitrary year, T-1 is a year before year T
For the next step of analyzing productivity, we want to know why the productivity of the factory
improved from year 2 to year 3. Of course there were a lot of candidates of sources of improved, and
usually multiple sources work simultaneously. For example, if the factory introduced a role limitation
working system, one employee works in only one role, his or her degree of maturity in the job could be
increased. Then, the factory could get the productivity growth without new financial input.
This is completely positive productivity growth because there was no other increased input. On the other
hand, if the factory introduced the new expensive machines to increase the amount of output, widgets,
we have to consider the new cost from the machines. Then, we need to consider multi-factor
productivity.
In this case, in year 2, if the salary of each employee was $50,000, the total personnel expense the
factory paid was $500,000. In year 3, if the salary was not changed, the total personnel expense the
factory paid was $750,000. In addition, the factory needed to pay for the depreciation of the machines. It
was $100,000, and they also needed to pay $50,000 for the maintenance of the machines. Then, the total
cost the factory paid in year 3 was $900,000. In this case, the economic productivity change of the
factory from year 2 to year 3 was

72
∆P =
{
(330
900000)
(200
500000)
⁄
}
− 1 = −0.08333 (6)
The result of the equation (6) shows that the factory lost its productivity by about 8.3%, after they
introduced the new machines, even though their amount of widgets produced was increased.
As shown in the above examples, the single factor productivity analysis shows the intuitively
understandable equation and result. It was useful to check the simple relationship with “input”, the
number of laborers, and “output”, the number of the widgets they produced in this case. On the other
hand, there are more complicated cases which have the multiple inputs we need to consider in the real
world. The next section shows how previous research was developed productivity analysis.
4.3 Developing history of MFP analysis
As shown in the previous section, sometimes single factor productivity, which has an input index
and an output index, cannot explain the reality we need to know. This is because many industries need
multiple inputs to produce an output. Thus, even though the analyzing process could be more
complicated, researchers prefer to use MFP analysis.
Actually, previous research called their research TFP, even though they dealt in single output. For
the avoidance of confusion, this thesis defined that MFP has multi input data and single output data, and
TFP has multiple input data and multiple output data.
Solow (1957) made significant progress in the MFP research field. His research field was national

73
gross domestic products (GDP) growth, and he was interested in what kind of factors could increase the
national GDP. Solow said that there were two factors which could be input indices. The first is labor, and
the second is capital. The importance of the two factors is easy to understand. If one country increased
the number of people who could work, the country could increase their GDP. If they increased the total
capital they have, the country may also increase their GDP.
However, the same thing happens in the national GDP growth with the factory example shown in
Section 4.1. This means that even if one country exactly doubled their capital investment and labor
population respectively, the GDP might not be doubled exactly because of what Solow called
“technological change.”
Solow said that the technological change includes “any kind of shift”. He also showed some
examples of “any kind of shift”, such as “improvements in the education of the labor force”. This means
that if one country increased their GDP without increased labor or capital, this increased GDP was from
“technological change”.
Solow defined the fundamental TFP function. First, he set “the aggregate production function”
as
Q = 𝐴(𝑡)𝑓(𝐾𝑡, 𝐿𝑡) (7)
Where 𝐾 is capital input, 𝐿 is labor input, 𝑡 is time, and 𝐴 is accumulated effect of shifts over time
When we differentiate the equation (7) totally with respect to time and divide by Q, we obtains
�̇�
𝑄=
�̇�
𝐴+ 𝐴
𝜕𝑓
𝜕𝐾
�̇�
𝑄+ 𝐴
𝜕𝑓
𝜕𝐿
�̇�
𝑄 (8)
Dot above the variables indicates time derivatives (e.g.�̇�), which is 𝑑𝑄
𝑑𝑡

74
Now Solow defined that 𝑤𝑘 =𝜕𝑄
𝜕𝐾
𝐾
𝑄 and 𝑤𝑙 =
𝜕𝑄
𝜕𝐿
𝐿
𝑄 as the relative share of capital and labor.
When we substitute in the above equation, we have the following results:
�̇�
𝑄=
�̇�
𝐴+ 𝑤𝑘
�̇�
𝑘+ 𝑤𝑙
�̇�
𝐿 (9)
Solow said that �̇�
𝐴 represents the technological change. By this equation, Solow surveyed what were
the main factors of the US GDP growth.
Now empirically, Solow concluded that the “Gross output per man hour doubled” from 1909 to
1949 in the USA, and he estimated that “87.5 percent of the increase was attributable to technical
change and the remaining 12.5 percent to increase use of capital.” This was a surprising result that
almost all increased output was from technological change, not from labor or capital increasing.
However, most researchers have agreed with the result.
Due to Solow’s achievement, research about GDP growth with TFP has become active. On the
other hand, the productivity function developed by Solow was just an arbitrary function. Thus,
researchers introduced Cobb-Douglas production function to apply it to analyze their research
objectives.
f(𝐾𝑡, 𝐿𝑡) = 𝐾𝑡𝛼𝐿𝑡
1−𝛼 (10)
Where α is an arbitrary variable.
When we take the natural logarithms in the equation (10),
ln𝑌𝑡 = 𝑙𝑛𝐴𝑡 ∙ 𝐾𝑡𝛼 ∙ 𝐿𝑡
1−𝛼 (11)
And differentiating the function above with respect to t
𝜕
𝜕𝑡𝑙𝑛𝑌𝑡 =
𝜕
𝜕𝑡𝑙𝑛𝐴𝑡 + 𝛼 ln𝐾𝑡 + (1 − 𝛼)
𝜕
𝜕𝑡𝑙𝑛𝐿𝑡 (12)

75
ln (𝑌𝑡𝑌𝑡−1
) = ln (𝐴𝑡𝐴𝑡−1
) + 𝛼 ln (𝐾𝑡𝐾𝑡−1
) + (1 − 𝛼) ln (𝐿𝑡𝐿𝑡−1
) (13)
ln (𝐴𝑡
𝐴𝑡−1) = ln (
𝑌𝑡
𝑌𝑡−1) − 𝛼 ln (
𝐾𝑡
𝐾𝑡−1) − (1 − 𝛼) ln (
𝐿𝑡
𝐿𝑡−1) (14)
Then, (𝐴𝑡
𝐴𝑡−1) represents the growth of productivity between year (t-1) and year t.
After that, many researchers have applied the equation to analyze the transportation industries’
productivity. This thesis adopted the equation (15) defined by Cowie (2001) that was developed to
analyze the effect of the reform in the UK passenger railway industry.
ln (TF𝑃𝑘𝑇𝐹𝑃𝑙
) = ln (𝑦𝑘𝑦𝑙) −∑𝑆𝑗ln (
𝑁
𝑗=𝑖
𝑥𝑗𝑘/𝑥𝑗𝑙) (15)
“Where N is the number of inputs. Sj indicates the cost share of input xj between year k and l, and y is
output.”
For example, again imagine a small railway operation company in 2010. The company paid $1
million to the personnel costs, $1 million to the non-personnel costs, such as electrical power, diesel fuel,
and maintenance costs, and $3 million to their depreciation. In 2010, they had 100 million passenger-km.
In the next year, 2011, the company purchased the several new vehicles and employed new personnel
because they believed the number of passengers was increasing. So the company paid $2.3 million to the
personnel costs, and paid $ 1.5 million to the non-personnel costs, and $ 4 million to their depreciation.
In 2011, indeed, the company had 140 million passenger-km. For the sake of shorthand, this thesis
abbreviated million. In this case, the actual numbers in equation (15) are
ln (TF𝑃2011
𝑇𝐹𝑃2010) = ln (
140
100) − {[
2.3
(2.3+1.5+4)] × ln (
2.3
2) + [
1.5
(2.3+1.5+4)] × ln (
1.5
1) + [
4
(2.3+1.5+4)] × ln (
4
3)} =
0.0697… (16)
The result of equation (16) shows that the railway operation company improved their total factor

76
productivity by 6.97% from 2010 to 2011.
4.4 Importance of productivity growth
Generally speaking, the most valuable research about GDP growth was done by Krugman (1994),
and his result of the research showed why analyzing productivity growth was important and what we can
say from the result. Krugman made a prediction in his famous research paper that the incredible pace of
Asian countries’ GDP growth would come to a halt soon because their GDP growth was almost
completely from the rapidly increased capital input and labor input, not from the productivity growth.
The economists in Western Europe and US had been concerned about the other countries’
economic growth during two different periods. The first time was in the 1950s, and the concern was
about socialist countries, especially USSR economic growth. The second one was in the 1990s about
East Asian countries and the region, such as Singapore, Taiwan, South Korea, and Hong Kong. The first
time, some people believed that the rapid growth of Soviet Union’s GDP would become a danger to the
US.
They also believed that the planned economy in the Soviet Union could overwhelm the market
economy in the Western Europe and the US. However, it turned out that it was a needless fear. The
Soviet Union could not continue its high GDP growth after the 1960s.
Krugman concluded that this was because the GDP growth of the Soviet Union in the 1950s
depended almost completely on the rapid increased capital and labor inputs. Practically, it is impossible
to continue GDP growth which is enhanced by only increased inputs. This is because that each country
has a limitation of the available supplies of capital and labors. After the market was saturated, they could

77
not increase their GDP without technological change.
On the other hand, the technological change almost does not have any physical limit. Nakajima
(2001) showed an interesting example of this. When the mailing service had been developed in Japan,
the industry had increased the number of employees and invested capital in the new post offices and so
on. However, even though their market had been expanded, their productivity growth was very low
because the mailing service company had very small technological improvement during the expansion
phase. They are still using manpower to deliver any mails in the last part of their logistics chain.
On the other hand, the technological change in the internet industry has been significant and rapid.
Just ten years after the specialists started using e-mail, people can send e-mail without any limit in the
number of mails, and people also send pictures and sometime voice mail and movies via e-mail. This
improvement has come not only from the capital and labor investments but also from the technological
changes, such as the high speed internet and high performance personnel computers.
Krugman concluded that we could not continue expanding our economy if the economic growth
just relied on the increased input. Thus, after Kim and Lawlence (1994) pointed out that East Asian
countries growth had been enhanced almost completely by the increased input, Krugman predicted that
the growth of these countries would be halted soon. Indeed, his prediction was correct. Taiwan, Hong
Kong, Singapore, and South Korea, in which the countries Kim and Lawlence showed that their
economic growth have relied only on the increased input, lost their high GDP growth ratio between 1997
and 1998, shown in Fig 4.1.

78
Fig 4.1 National GDP growth ratio
Source: World Bank
Fig 4.1 shows that developing countries and area, Korea, Singapore, Taiwan, and Hong-Kong lost
their GDP from 1997 to 1998 steeply. On the other hand, the US, France, and Japan continued to
increase their GDP constantly.
From the result, Krugman said that if we want to continue economic growth, we need to improve
productivity. This is because although the increased input could increase the output, it would not be a
sustainable growth. This is because there are physical limits of the increased input. On the other hand,
there is almost no limit in the technological change. Thus, productivity growth analysis is very important
for industrial viability, especially very mature industries.
As shown above, originally Solow pointed out that there are “residual” between input, labor and
capital, and output, GDP, and he call the residual “technological change”. Later, the researchers call
-10
-5
0
5
10
15
1993 1994 1995 1996 1997 1998
Korea (%) Singapore (%) Taiwan (%)
Hong Kong (%) USA (%) Japan (%)
France (%)

79
“technological change” productivity or “Solow residual”. However, these words, technological change,
productivity, and Solow residual, were still too ambiguous. These words include a lot of sources. The
previous research had been trying to define which actual sources could improve the productivity. This
thesis provided a review of previous research about the MFP and TFP analysis of the transportation
industry.
4.5 Productivity analysis in transportation
After Solow’s contribution to the productivity analysis, many economic researchers have
developed the MFP and TFP analysis. Some of these introduced TFP to analyze the inefficiency of the
regulated market. Indeed, although the inefficiency in the regulated economy compared to the
unregulated market economy was intuitively credible, there were not enough empirical examples.
Capron and Noll (1971) said that “the performance of regulated industries falls far short of the
ideal and even of a reasonable target for public policy. But they (general researchers) also agree that
only in a few exceptional instances can the inadequacy of the performance be clearly documented.”
Thus, the first goal for the economists was to find two cases, one regulated and the other almost
unregulated. The significant example was the comparison between the US and Canadian freight and
passenger railway industries.
Caves, Christensen, and Swanson (1981) used the example to evaluate the inefficiency in the
regulated market. In their research, the Canadian railway industry represented the market economy, and
the US railway industry represented the regulated economy.
The two cases need to have enough common parts, such as market size, objectives, and market

80
peaks and troughs to do a reasonable comparison. This means we cannot compare the productivity
between a company in the internet technology industry and a company in the infrastructure industry to
evaluate the inefficiency in the regulated market. Even though the information technology company
could represent the unregulated market and the infrastructure company could represent the regulated
market, the background of these companies would be too different.
However, the background of the Canadian and the US railway industry was enough alike, and
almost the only important difference between these two was the market regulation. To demonstrate the
inefficiency in the regulated market, they chose Canadian Pacific (CP), Canadian National (CN), Santa
Fe (SF), and Southern Pacific (SP) railroads as the research objects.
Caves et al. explained that the railway industries had substantial monopoly power in the 1920s,
before World aor II. The government needed to give attention to the industries because they were likely
to use the monopoly power to decide service prices. Thus, they were substantially regulated by the
governments at that time. However, they lost a lot of transportation mode share since the 1930s because
of the motorization and competition from trucks and water carriers.
Their research said that “in the United States the railroads’ share of freight ton-miles supplied by
rail fell from 78 percent in 1945 to 60 percent in 1955. The share in Canadian fell from 74 percent in
1944 to 61 percent in 1956.” As the data shown above, these industries had lost these monopoly powers
in the transportation industry.
However, Cave et al. said that the solutions which the US and Canadian government took were
completely different. In Canada, the government had relaxed the regulation, especially pricing regulation,

81
in the Canadian railway industry. This was because that the competitors of the railway industry, such as
trucking and water carrier industries were really unregulated industry. The government might believe
that deregulating the railway industry to increase its competitive power. In other words, the government
wanted to introduce the market competition to the entire transportation market, and “level the playing
field”.
On the other hand, the US government had regulated the competing industry more, similar to the
railway industry. Concretely speaking, the government expanded Interstate Commerce Commission
(ICC) regulation into the trucking industry in 1935 and into the water carriage industry in 1940. Cave et
al. explained that the regulation expansion was “largely as an attempt to protect the railroads.”
Thus, Cave et al. hypothesized that the Canadian railway industries’ productivity had to be higher
than the US railway industries’. They applied TFP analysis. They set “(1) ton-miles of freight, (2)
average length of freight haul, (3) passenger-miles, and (4) average length of passenger trip” as output
data, and they set “(1) labor, (2) fuel, and (3) equipment and materials” as input data. The important
difference from our research model is that they applied TFP, not MFP because, then, freight railway
industries in the US and Canada had also operated passenger railways. This means they had two output
indices, passenger-km and ton-km. The result of their calculation clearly said that the Canadian railway
industries’ TFP had been higher than the US railway industries’, shown in Table 4.1.
As Table 4.1 shows, although CN and CP had lost output between 1956 and 1963, they had also
reduced their input. Thus, they could keep positive TFP growth during the period. Since 1963, CN and
CP’s output had been positive even though they had almost completely reduced their input. On the other
hand, although SF and SP’s input growth ratios were slight or negative, their output growths were also

82
slight. Caves et al. explained that the difference was due to the deregulated pricing in Canadian railway
industry. Also Heaver and Nelson (1977) said that CN and CP set up “Traffic Research Department”,
which was expected to analyze the competitive market. Indeed, the departments gave CN and CP pricing
techniques to compete with mainly trucking industry.
Table 4.1 Comparison of U.S. and Canadian railroads
Source: Caves et al. (1981)
As a conclusion, Caves et al. said that the Canadian policies, which gave CN and CP pricing
freedom and forced them to face the market competition, improved TFP of the Canadian railway
industry. This research consolidated the new survey area of TFP so that researchers could evaluate the
effects of deregulation, policy change, and reform of industry by MFP and TFP. In their conclusion,
Cave et al. made the prediction that the productivity of the US railway industry would increase after
1980. This was because the US government also gave the US railway industry greater pricing freedom in
the Impact of the Staggers Rail Act (1980).
Indeed, Tretheway, Waters and Fok compared the MFP growths between the US freight railway
industry and the Canadian freight railway in the 1980s. The reason why they researched only the freight
year CN CP SF SP CN CP SF SP1956-1963 -2.8 -3.6 -1.3 0.3 -1.1 -2 0 3.41963-1974 0.3 -0.6 -0.1 0.7 4.6 2.7 0.8 1.11956-1974 -0.9 -1.8 -0.6 0.5 2.4 0.9 0.5 2
CN CP SF SP1956-1963 1.8 1.7 1.4 3.11963-1974 4.3 3.3 1 0.41956-1974 3.3 2.7 1.1 1.4(percent per year)
Aggregate input Aggregate output
Total factor productivity Average annual rate of growth of inputs,outputs, and total factor productivity forCanadian National (CN), Canadian Pacific(CP), Santa Fe (SF), and Southern Pacific(SP) Railroads

83
industry was that the all US interstate passenger railway businesses were taken over by Amtrak in 1971.
Thus, they set only “ton-mile” as output. The result of MFP growth of the US freight railway industry
between 1981 and 1988 was higher than the CN and CP’s, shown in Table 4.2.
Table 4.2 MFP growth: US-Canada rail industry comparison 1981-88
Source: Tretheway et al.
After the comparison between the regulated and unregulated market economy in the railway
industries, Caves, Christensen, and Tretheway (1982) applied TFP analysis to evaluate the effects of
deregulation in the US airline industry. In November 1978 President Carter signed the Airline
Deregulation Act. Before the act, the US airline industry had been highly regulated. There was a high
entry barrier for the new companies. Thus, the existing airline companies had enjoyed the oligopoly
market. The act enabled new entries into the industry, and gave the airline industry more pricing
freedom.
Thus, the trunk airline companies, which had enough market shares, could not continue their
monopoly power in the market. Indeed, Cave et al. said although the trunk and local airline companies
had higher TFP between 1976 and 1980 than from 1970 to 1975, the average of TFP growth in the local
airline companies after the deregulation was 6.3%. This was higher than the trunk airline companies’
average, 4.9%, shown in Table 4.3.
US CN CP5.2 4.6 3.5
TFP growth percentage 1981-88

84
Table 4.3 Average growth in airline productivity (percent per year)
Source: Caves (1982)
As shown above, TFP can be very useful to evaluate the efficiency of reform in various
transportation industries although sometimes researchers faced the problem of data availability. Oum,
Tretheway, and Waters (1992) constructed the productivity analysis scheme in the transportation sector.
First, they defined what kind of “cases” we can evaluate with productivity analysis. They showed eight
cases. The previous research shown in this chapter analyzed two cases. One is “the relationship between
productivity and pricing policy”, and the other is “comparing performance of firms/industries under
alternate public policy regime, e.g. regulation and/or government ownership.”
In addition, Oum et al. decomposed the sources of increased TFP. They showed ten sources of
Airline 1970-1975 1976-1980TRUNKSUnited 1 6American 2 3TWA 2 6Pan American 2 7Eastern 2 5Delta 2 4Northwest 6 4Western 4 3Continental 2 1Braniff 1 5
Total Trunks 2.6 4.9LOCALSAllegheny 4 6Airwest 8 8Frontier 4 5Ozark 2 5Piedmont 2 7Texas International 1 14
Total Locals 4 6.3
Combined 2.8 5.1

85
productivity gains. Oum et al. said that regulated companies and public sector often use the
cross-subsidies, and “they may be simply lazy, or otherwise not motivated to control costs.” Thus,
usually industrial reform aimed to eliminate the inefficiency from the cross-subsidies, low motivation
for the revenue, and public sectors’ low motivation for the management efficiency; public sectors are not
under pressure from stock holders.
The previous research described in this chapter evaluated the effect of “elimination of technical
inefficiencies” as Oun et al. defined, and this thesis will also evaluate this effect by using MFP
analysis in Chapter 6. Any deregulations may be able to “eliminate the technical inefficiencies” in the
transportation industries. However, Oum et al. alerted that these sources could overlap. This means if
the producticity growth in one case had more than two sources, we might not count one of the sources.
Even if our research cases showed the significant MFP growth, it might be very difficult to say which
factor contributed to the result of MFP growth. Thus, when we want to evaluate only the source,
“elimination of technical inefficiencies”, we need to scrutinize the object, and know what actually
happened in the industry and why the other sources were limited.
Generally speaking, even though there are difficulties in the logic, productivity research about the
efficiency of the deregulation has been well. This is because it is reasonable to conclude that the
deregulation and pricing freedom improved the productivity of the transportation industry. On the other
hand, there are a few researchers who denied the effect of the deregulation on improved productivity.
One example is Martland (2011). He concluded that the contribution of the US freight railway industry’s
increased TFP by deregulation was very limited. He pointed out that other factors, such as technological
advance, new labor agreement, improved logistics system, and developed management system have
contributed to TFP growth more than deregulation. Of course, he also acknowledged that the US freight

86
railway industry had improved its TFP after deregulation. However, he said that the indications of TFP
growth had already begun before deregulation.
Martland decomposed the TFP growth into the expected sources which contributed to the
increased TFP in the US freight railway industry. He concluded that the most significant factor was fuel
efficiency. He said that this source, “increased quality of inputs”, made significant impact on TFP.
Indeed, the US freight railway industry improved an average revenue ton-miles per gallon (RTM/gallon)
from 188 to 373 between 1966 and 1995, and “another 20% gain had been achieved by 2008.” The
significant contribution was achieved by the improved vehicle technology and new logistics system, not
by deregulation. Martland said if RTM/gallon remained at the same level as the level in 1966, TFP
would also remain at the same level as in 1966.
Of course Martland’s conclusion is not the only final conclusion about the importance of the
deregulation in the US freight industry. However, his counterargument at least alerted us that we have to
carefully select the research object and need to know what actually happened. As Martland pointed out,
even if we could find the TFP growth in one industry which was deregulated, we could not determine
that the growth came only from the deregulation, industry reform, or privatization easily.
Thus, when we would set the research object to analyze the effect of any industrial reform, such as
vertical separation in European railway industry and dividing and privatization in Japanese railway
industry, if the object had too much large scale, we could not evaluate the effect well. For instance, as
shown in Chapter 2, we should not compare the MFP of JNR and MFP of all new JRs to evaluate the
reform of the Japanese railway industry. This is because JR Hokkiado, JR Shikoku, JR Kyushu, and JR
freight are not privatized yet. These non-privatized companies are under the preferential taxation system,

87
guarded by the JR law, and subsidized.
We also should not compare all national railway industries in Europe between before and after
they introduced vertical separation. This was because one country, such as Sweden, was really eager to
introduce it with competition. On the other hand, other countries, such as France, Spain, and Italy, might
be passive as shown in Chapter 3. Thus, using total or average MFP growth in European railway
industry to evaluate the efficiency of introducing vertical separation management does not make sense.
So we need to optimize the object scale to evaluate the effect of the alternative policy regimes. In other
word, we need the objectives to evaluate the effect of these reforms.
4.6 Objective of research
This thesis studies the effect of the reform in Japanese and French railway industries. As shown in
Chapter 2, Japanese government privatized JNR “partly”, and European Commission forced French
railway industry, SNCF, and the government to introduce vertical separation management and open
access. As this thesis explained above, when we research the effect of these management structure
changes, we need research objectives. If we set too large scale industry as our research objectives, we
cannot eliminate the effect from manifold changes, such as technology development, demand change,
and introduction of IT. To evaluate the effect of these two reforms, we chose the highest profitable HSRs,
Tokaido Shinkansen line and the Paris-Lyon TGV line, in each country. The reasons why we narrowed
down the object scales to only these are that these lines:
i. have been very profitable
ii. are using the latest technology since the beginning of the operation
iii. almost exclusively used by HSR, no local trains and freights
iv. have enough long management terms before and after the reforms.

88
About i, as shown in Chapter 2 and 3, Tokaido Shinkansen line and the TGV Paris-Lyon line have
been profitable; at least JNR and SNCF planned these lines to be profitable lines. Thus, fundamentally
JNR, JRC, and SNCF have continued to put enough inputs into these lines. This is because they
expected to get enough output back from the inputs. This is considerably a healthy economic activity.
About ii, Tokaido Shinkansen and the TGV Paris-Lyon line introduced the latest technology in
these vehicle, signal system, and infrastructure. Indeed, JRC had used the proto-type HSR vehicle until
2008, and SNCF is still using the proto-type HSR vehicle. These HSRs are moved by electrical power,
not fossil fuels such as freight railways and airlines. Of course they have also improved technology in
their HSR. However, the degree of technological change in these HSR is very limited.
About iii, these lines have been used by only the passenger HSRs. Even though JNR, JRC, and
SNCF have improved their operation plans, this degree was much smaller than developed logistics
system which was introduced by freight and airline industries. For these reasons, this research chose the
two HSR lines to evaluate the industrial reforms, privatization and vertical separation in Japan and
France.
About iv, we cannot evaluate the reform effect just from a year data after the industry was
reformed. This is because the amount of the transportation industries’ output, such as passenger-km,
ton-km, and revenue, could be influenced the economic situation of the countries, gas prices, and
indefinable reasons. However, if we could analyze the enough long term data before and after the reform,
these external factors would be reduced significantly.
In the next chapter, we shows the input data and output data of Tokaido Shinkansen and the

89
Paris-Lyon line, which we used, with some analysis. In Chapter 6, we applied these data to the
productivity function we adopted.

90
Chapter 5
Data of Tokaido Shinkansen and Analysis
As shown in Chapter 4, for calculating productivity, we need input and output data. We chose
passenger-km and revenue as two separated output data respectively, and personnel expense,
non-personnel expense, and capital related expense as input data. This means each output has three
inputs. We call our productivity result passenger-km based productivity and revenue based productivity
separately; both are multi-factor productivity (MFP), one output and multiple input. This thesis gathered
data of Tokaido Shinkansen from Japan National Railway year book (from 1964 to 1987), White book of
Transportation (from 1964 to 2010), Suda (1994), Kasai (2007), Central Japan Railway Fact Sheet
(2010), JITI Statistics data of railway (2010).
Fig 5.1 shows the passenger―km of Tokaido shinkansen from 1964, opening year, to 2010. The
data shows that the passenger km had been sometimes decreased, such as from 1974 to 1978.

91
Fig 5.1 Tokaido Shinkansen Passenger-km (million km)
We can say that naturally the passenger km had increased from 1964 to 1974 because of the new
entry effect. JNR lost the passenger km between 1974 and 1978. This was because that JNR had
increased the ticket price of Tokaido Shinkansen at the same time. Fig 5.2 shows the change of the ticket
price. The blue graph shows the actual ticket price change between Tokyo and Osaka, and the red graph
shows the adjusted ticket price by Consumer Price Index (CPI) which is released by Japan National
Bank.
0
5000
10000
15000
20000
25000
30000
35000
40000
45000
50000
19
64
19
66
19
68
19
70
19
72
19
74
19
76
19
78
19
80
19
82
19
84
19
86
19
88
19
90
19
92
19
94
19
96
19
98
20
00
20
02
20
04
20
06
20
08
20
10

92
Fig 5.2 Ticket Price between Tokyo and Osaka (Yen)
The actual ticket price had increased more than 100% from 1974 to 1978. Even the ticket price
adjusted for inflation had increased more than 40% at the same time. Nam (2009) explained that the
reason why JNR had increased the ticket price was that the Department of Transportation required them
to do it. As we already discussed in Chapter 2, JNR’s ticket prices had been decided very politically, and
JNR did not have the power to reject the request from the government to increase the ticket prices. The
Department of Transportation wanted JNR to earn more money from Tokaido Shinkansen because they
wanted to continue constructing the HSR network.
Indeed, JNR extended the HSR line to Okayama in 1972 and Hakata in 1976, named Sanyo
Shinkansen line, shown in Fig 2.6. After the construction of Sanyo Shinkansen, JNR was also forced to
construct Tohoku and Joetsu Shinlansen, shown in Fig 5.3. JNR had to capitalize the cost of the new
HSR line’s infrastructure. This means JNR had been forced to use the cross-subsidization to continue the
construction of the HSR network, as explained in Chapter 2 in detail.
0
2000
4000
6000
8000
10000
12000
14000
16000
19
64
19
66
19
68
19
70
19
72
19
74
19
76
19
78
19
80
19
82
19
84
19
86
19
88
19
90
19
92
19
94
19
96
19
98
20
00
20
02
20
04
20
06
20
08
20
10
Ticket Price Adjusted Ticket price for Inflation

93
Fig 5.3 Tohoku, Joetsu and the other Shinkansen lines
Source: Densha de Japan (2010)
One of the reasons why JNR lost passenger-km between 1974 and 1978 was the rapid increased in
ticket price. As a result, JNR had continued the high level income revenue from Tokaido Shinkansen
between 1974 and 1978 even though JNR had lost passenger-km at the same time.
Fig 5.3 shows the revenue from Tokaido Shinkansen. It shows that the revenue increasing pace of
Tokaido Shinkansen is gradual.

94
Fig 5.3 Revenue from Tokaido Shinkansen (millions of Yen)
The actual revenue of Tokaido Shinkansen had increased constantly from 1964 to at least 1983.
On the other hand, the increased pace of the revenue after the JNR reform had been slower. We
estimated that the market of Tokaido Shinkansen is going to be saturated. Thus, JR Central has to
increase their productivity. This is because even if JR Central increased the input to increase the output,
its effectiveness is very limited. Unfortunately, the data between 1983 and 1986 were not available.
We also needed the input data. As we said above, we set three input data. Fig 5.4 shows the
personnel expense of Tokaido Shinkansen. The personnel expense had increased from 1964 to 2000
constantly.
0
200000
400000
600000
800000
1000000
1200000
19
64
19
66
19
68
19
70
19
72
19
74
19
76
19
78
19
80
19
82
19
84
19
86
19
88
19
90
19
92
19
94
19
96
19
98
20
00
20
02
20
04
20
06
20
08
20
10
Revenue Adjusted Revenue for Inflation

95
Fig 5.4 Personnel Expense (millions of Yen)
On the other hand, after 2000, JR Central has decreased its personnel expense. After 1987, JR Central
has strong incentive to operate Tokaido Shinkansen line with an optimal personnel expense.
The next input data are non-personnel expense which includes energy cost, maintenance cost, and
other operation costs, shown in Fig 5.5.
Fig 5.5 Non-Personnel Expense (millions of Yen)
0
20000
40000
60000
80000
100000
120000
140000
19
64
19
66
19
68
19
70
19
72
19
74
19
76
19
78
19
80
19
82
19
84
19
86
19
88
19
90
19
92
19
94
19
96
19
98
20
00
20
02
20
04
20
06
20
08
20
10
Personneel Expense Adjusted Personnel Expense for Inflation
0
50000
100000
150000
200000
250000
300000
350000
19
64
19
66
19
68
19
70
19
72
19
74
19
76
19
78
19
80
19
82
19
84
19
86
19
88
19
90
19
92
19
94
19
96
19
98
20
00
20
02
20
04
20
06
20
08
20
10
Non Personnel Adjusted Non Personnel for Inflation

96
Interestingly, the increasing pace of the non-personnel expense between the JNR operation, from
1964 to 1986, and the JR Central operation, from 1987 looks approximately similar. We can say that the
industrial reform effect for the non-personnel expense part was very limited in the HSR operation. This
might be because that they have to purchase almost all vehicles and maintenance parts from the other
industries. JR Central is a railway infrastructure owner and the railway operator, but they are not a
vehicle or parts supplier, and they need to buy electrical energy from electrical power companies. Thus,
it is very difficult to control or reduce the non-personnel expense even after 1987.
The third input data are capital related expense which includes interest payment of debt,
depreciation of the infrastructure and vehicles, and taxations. As shown in Fig 5.6. We need to explain
about the significant gap between JNR term and JR Central term.
Fig 5.6 Capital related expense (millions of Yen)
0
100000
200000
300000
400000
500000
600000
700000
19
64
19
66
19
68
19
70
19
72
19
74
19
76
19
78
19
80
19
82
19
84
19
86
19
88
19
90
19
92
19
94
19
96
19
98
20
00
20
02
20
04
20
06
20
08
20
10
Capital related Adjusted Capital related for Inflation

97
The amounts of capital related expense which JNR had paid and the one which JR Central has
paid are very different. This was because the actual construction cost of Tokaido Shinkansen which was
capitalized by JNR, 380 billion Yen, and the price which was paid by JR Central to take over the
infrastructure, 5.2 trillion Yen, are very different. This is about three times as much as the original
construction cost adjusted for inflation. As this thesis said in Chapter 2, the government decided that JR
Central, JR East, and JR West would take over the infrastructure of Japanese HSR lines from the HSR
holding Co., they allocated the debt to each JR in accordance with the current value of each HSR line,
not actual construction cost of each HSR line.
This means even though the actual construction cost of Tokaido Shinkansen was the cheapest
among Japanese HSR lines, JR Central took over about 60% of total construction cost of Japanese HSR
network. Thus, after the Japanese railway industrial reform in 1987, known as privatization, the payment
for the capital related expense of Tokaido Shinkansen jumped up. This was very unfair trade for JR
Central. However, when this debt distribution was decided, Japanese government owned 100% of JR
Central’s stocks. Thus, JR Central could not reject any proposal from the government.
After they took over the 5.2 trillion Yen debt from the HSR holding company, JR Central seriously
care about the interest rate of the debt. This is because the amount of the interest payment is significant
in the total expense of Tokaido Shinkansen management. JR Central has tried to reduce the average
interest rate of the debt by the loan refinancing. Fig 5.7 shows the average interest rate of debt which JR
Central has paid. JR Central achieved decreasing their average interest rate of debt from about 6.5% to
3.5% between 1992 and 2010.

98
Fig 5.7 Average interest rate of the debt in JR Central (%)
On the other hand, the white book (1987) issued by the Department of Transportation said that the
interest payment rate which had been paid by JNR had been almost fixed in 8%. This might be because
JNR did not have strong incentive to reduce the interest rate of their debt. JNR was the government
owned organization and they had borrowed from the public treasury. In Chapter 6, we show the
calculation result of MFP and analysis for it.
In the next chapter, this thesis calculate MFP by using the data which shown in this chapter. After
the calculation, this thesis analyzes the effect of the railway industrial reforms.
0
1
2
3
4
5
6
7
Average interest rate

99
Chapter 6
MFP
6.1 Analysis of Tokaido Shinkansen
As explained in Chapter 4, we applied MFP to analyze the effect of the Japanese and European,
mainly French, railway reform. The MFP equation we adopted is
ln (TF𝑃𝑘𝑇𝐹𝑃𝑙
) = ln (𝑦𝑘𝑦𝑙) −∑𝑆𝑗ln (
𝑁
𝑗=𝑖
𝑥𝑗𝑘/𝑥𝑗𝑙) (15)
“Where N is the number of inputs. Sj indicates the cost share of input xj between year k and l, and y is
output.”
The equation was used by previous research. The most valuable research which applied the
equation was done by Cowie (2001), he analyzed the effect of the UK railway privatization by the
equation.
From the data in Chapter 5, we calculated the year to year MFP of Tokaido Shinkansen
management. Fig 6.1 shows the result. Fig 6.2 shows the cumulative graph of Tokaido Shinkansen’s
MFP.

100
Fig 6.1 Year to year revenue and Passenger-km MFP (%)
Fig 6.2 Passenger-km and revenue based MFP (%)
The blue graph shows the revenue based productivity; its output is revenue. The red graph shows
the passenger-km based productivity; its output is passenger-km. In the first several years, passenger-km
based and revenue-based MFP had increased rapidly. As explained in Chapter 5, we judged this was
from the new entry effect: the time passengers have been recognizing the HSR as useful and convenient
-0.1
-0.05
0
0.05
0.1
0.15
0.2
0.25
19
64
19
66
19
68
19
70
19
72
19
74
19
76
19
78
19
80
19
82
19
84
19
86
19
88
19
90
19
92
19
94
19
96
19
98
20
00
20
02
20
04
20
06
20
08
Revenue-MFP PK-MFP
0
0.2
0.4
0.6
0.8
1
1.2
1.4
19
64
19
66
19
68
19
70
19
72
19
74
19
76
19
78
19
80
19
82
19
84
19
86
19
88
19
90
19
92
19
94
19
96
19
98
20
00
20
02
20
04
20
06
20
08
20
10
Revenue-MFP PK-MFP

101
transportation mode even compared to the alternative modes. During this first decade, JNR could get
new passengers easily. However, in the revenue based TFP, after 1970, the growth ratio had been zero or
sometime negative until the reform in 1987. Also in the passenger km based MFP, after 1974, the growth
ratio had been negative. After the industrial reform in 1987, the revenue based MFP and passenger-km
MFP both has been increased moderately. Table 6.1 shows the annual average growth of each MFP.
Table 6.1 Annual average growths of MFPs (%)
From 1975 to 1984, before the privatization, JNR’s average growth of revenue based productivity
was negative, -0.27%, and the average growth of the passenger km based productivity was 0.11%. On
the other hand, after the privatization, JR Central has made more than 1% annual growth in
passenger-km based productivity, and positive average in the revenue based productivity.
We can say from the result that the railway industrial reform in 1987 contributed the JR Central’s
Tokaido Shinkansen management.
6.2 Decomposed single factor productivity
As Fig 6.2 shows, Passenger km based and revenue based multi-factor productivity both have
been increased after the privatization. The next question is what kind of the factor or factors contributed
to increase the MFP after the industrial reform. Now we calculated single factor productivity to analyze
which change of input had a strong impact on the MFP. Fig 6.3 shows the six single factor productivity
graphs, personnel-passenger-km, personnel-revenue, non-personnel-passenger-km,
From 1975 to 1984 From 1987 to 1996 From 1997 to 2006Passenger km MFP 0.11 1.74 1.39Reenue MFP -0.27 0.48 0.89

102
non-personnel-revenue, capital related-passenger-km, and capital related-revenue productivity.
Fig 6.3 Single factor productivity (%)
Fig 6.3 shows that capital related-passenger-km and capital related-revenue productivity have
been increased after the industrial reform constantly. As shown in Fig5.6, JR Central is very eager to
reduce the capital related expense after the industrial reform, and they could do. This was because the
amount of payment for the capital related expense is significant for JR Central’s management. We can
say that JR Central has a strong incentive to reduce the capital related expenses.
In addition, after 1999, JR Central has been also succeeded in increasing the personnel-passenger
and personnel-revenue productivity both slightly. As shown in Chapter 2, in 1999, the government
released the part of JR Central’s stocks to the market. We judged that the privatization effect, pressure
from the market to optimize the management cost, has improved personnel-passenger-km and
-50
0
50
100
150
200
250
300
350
Capital-Passenger-km Productivity Capital-Revenue Productivity
Personnel-Passenger-km Productivity Personnel-Revenue Productivity
Non-P Passenger-km Productivty Non-P Revenue Productivty

103
personnel-revenue MFP.
On the other hand, even after 1987, privatization, JR Central has lost non-personnel passenger-km
and non-personnel-revenue productivity. As we judged in Chapter 5, JR Central has difficulty improving
non-personnel based productivity because JR Central cannot control the price of energy, maintenance
parts, and anything which has been supplied by the other industry to JR Central.
As conclusion, the Japanese railway reform, which was started from 1987 known as dividing and
privatization, has improved the productivity of Tokaiso Shinkansen. This improvement has been from
the continuing capital expense reduction after 1987 and the reduction of personnel expense from 1999.
6.3 TFP of French railway industry
This thesis also tried to calculate the multi-factor productivity of the French first HSR, the
Paris-Lyon TGV line. However, the particular line’s data is not available. Instead of calculating the
Paris-Lyon line’s MFP, this thesis reviewed the previous research about European Railway reforms,
known as the vertical separation. Evaluating the effect of introducing the vertical separation
management is more difficult than Japanese case. There are many complicated factors.
First, the European railway industrial reform did not happen all together, and did not introduce the
same vertical separation system. As examples, Friebel et al. (2008) said that German national railway
company DB capitalized new railway infrastructure owner company as one of the affiliate company of
DB group. On the other hand, as we explained in Chapter 3, the French government capitalized the
completely new infrastructure owning company, RFF. Thus, there were some railway reform styles
within the vertical separation in European countries. Table 6.2 shows the types of separation of

104
infrastructure from operators and years when they introduced it.
Table 6.2 types of separation of infrastructure from operators
Source: Friebel (2003)
Second, the European railway companies still manage the freight railway business. This means we
cannot differentiate the personnel expense between staffs who work in the passenger railway business
and staffs who work in the freight railway business. It’s the same with non-personnel expense and
capital expense. Thus, even though the previous research calculated the TFP of passenger railway
industry, input data they adopted was influenced by freight business.
Third, the current financial relationship between operators and infrastructure owner companies is
too complicated to apply our MFP model. As mentioned in Chapter 3, for example, SNCF has paid the
railway usage fee to RFF, and RFF paid the maintenance fee to SNCF exclusively, and these data are not
available. Thus, finding the correct data of the non-personnel expense which includes the maintenance
cost and the capital related expense is very difficult. Indeed, Friebel et al. chose passenger-km as output,
Organizational separationwithin a company
Full institutional separation
Austria From 1997Belgium From 1998Denmark From 1997Finland From 1995France From 1997Germany From 1994Italy From 1998Netherland From 1995Portugal From 1997Spain From 1996Sweden From 1988

105
and route-km and the number of staff as input data. Quinet (2005) also calculated the TFP of European
large countries’ railway industry. Quinet set passenger traffic and freight traffic as output, and rolling
stock, infrastructure stock, and labor as input. His research was TFP, more than two output indices.
However, he did not show the data he used, and he did not explain how he figured out the complicated
relationship between SNCF and RFF.
Friebel et al. used “efficiency” to explain the effect of introducing the vertical separation in
European countries. They said “the efficiency measure takes the value 1 (or 100%) for the country with
the highest performance.” This means in the Fig 6.4, Germany’s passenger railway productivity in 1999,
which is the best within the data, is 1.00. We can see how inefficient the other countries and years were
compared to German productivity in 1999.
Fig 6.4 Productivity of passenger railways in Europe
Source: Friebel (2003)
0
0.2
0.4
0.6
0.8
1
1.2
19
80
19
81
19
82
19
83
19
84
19
85
19
86
19
87
19
88
19
89
19
90
19
91
19
92
19
93
19
94
19
95
19
96
19
97
19
98
19
99
20
00
France Germany Italy Spain Sweden

106
Fig 6.4 shows that Germany had continued improving the productivity of the passenger railway
after they introduced the vertical separation management in 1994, and Sweden had also improved the
productivity after they introduced it in 1988. On the other hand, France, Spain, and Italy had reduced
productivity after they introduced the vertical separation management. This is the very ambiguous result.
This is because as we mentioned above, each country introduced the very characteristic separation
system. As conclusion, Friebel et al. said that “building the reform of network industries on a
one-size-fits-all model of separation of infrastructure from operations may not be a fruitful way to
enhance productivity.”
Quinet also calculated the productivity of European railway industry. He showed the only data
graph, Fig 6.5.
Fig 6.5 TFP of European Railway industry, 1995=1
Source: Quinet (2005)
The result of Quinet is slightly different from the result of Friebel. However, Quinet also said that

107
the French railway reform in 1996 has made a negative impact on their productivity. He said that “the
rate of railway productivity growth in France was comparable to or better than the rates in Germany,
Sweden, Italy, and Spain during the period from 1980 to 1995 but was the lowest of the five countries in
the period from 1995 to 2001.”
As we said above, the research of Quinet and Friebel was seriously constricted by data availability.
Thus, Friebel used route-km and the number of staff as input data, and Quinet used TFP which included
freight business data. Indeed, these data were not enough to evaluate the industrial reform, effect of
introducing the vertical separation. This is because the railway industry could reduce the number of staff
and reduce the route-km if they would abandon the local line services which had very small number of
passenger-km. However, these are not from the effect of introducing the vertical separation
management; these were just the effect from the layoff and abandonment of tracks.
Although Friebel’s research model had a difficulty to evaluate the effect of introducing the vertical
separation, at least he figured out that the German and Swedish railway industries could improve their
MFP compared to France, Italy, and Spain as shown in Fig 6.4.
Germany and Sweden, which introduced the competition in the railway operation business even
the scale was very small, had improved their productivity. On the other hand, France, Spain, and Italia,
which did not allow the new entries to join the railway operation business, have lost their productivity.
From these data, we can at least say that the European railway industries’ productivity has a relationship
with the degree of competition.
In the next chapter, this thesis shows the current US HSR program and problems, and this thesis

108
tries to suggest the future appropriate management structure of NEC HSR.

109
Chapter 7
The US HSR Project
7.1 Introduction
In this chapter, we compiled information about the US HSR programs to gain some insight on the
appropriate structure of the future Northeast corridor (NEC) HSR: privatization of operators, vertical
separation with competition, or integrated operation by the private sector. There are many common
problems between the US and earlier Japanese and European railway industries, and also there are
significant difference between them. So we need to be careful when we compere these countries with the
US.
First, we present the reasons why the US has not introduced the HSR technology, unlike Japan and
European countries. Since 1964, when the JNR started the operation of Tokaido Shinkansen, several
developed countries have continued to expand their HSR networks. However, to be precise, there is no
common definition of “high-speed” that all of these countries share. Several previous research papers
determined that high speed means the maximum train speed is at least 150 mile per hour and the trains
run almost always at more than 120 miles per hour. According to this definition, currently six countries
have HSR networks and five countries have HSR lines, shown in Table 7.1.
Even though there is no rigorous distinction between networks and lines, this thesis roughly
defined that HSR network has a radial structure or at least a main line and some branch lines. On the
other hand, HSR line has almost only main line.

110
Table 7.1 HSR network and line around the world
Source: UIC
However, the US does not have HSR yet. Although the closest railway line to the HSR definition
is the Acela Express which runs on NEC, the average speed is still much lower than the definition of the
HSR, shown in Table 7.2, and also it achieves its maximum speed for a very short segment of the trip.
General information about current NEC is explained in Section 7.5 in detail.
Table 7.2 operation frequency and travel time on NEC and Tokaido Shinkansen
Source: NEC IMP (2010) and JR Central Fact Sheet (2010)
Generally speaking, there are many reasons why the US did not introduce HSR technology. For
example, the US already had a highly developed highway transportation system and widespread airport
network instead of HSR network. Indeed, the mode share of the US passenger railway is less than 1%
shown in Fig 7.1. This is much lower than Japan and France, Japanese 28.7% in 2007and France 8% in
2000, shown in Chapter 3: Japan, and Chapter 4: France.
Countires which haveHSR network
First lineopen year
length(km)
countries which haveHSR line
First lineopen year
length(km)
France 1981 1893 Belgium 1998 120Italia 1981 866 UK 2003 113Germany 1988 881 Netherlands 2008 120Spain 1992 1585 Korea 2004 330Japan 1964 2405 Taiwan 2007 345China 2007 4175
Distance(mile)
Weekdayround trips
AverageTravel Time
Average Speed(mile/h)
Boston-NY 220 10 3:31 62.7NY-DC 238 15 2:45 86.5
Tokaido Shinkansen Tokyo-Osaka 322 150 2:25 133.2
NEC
Line

111
Fig 7.1 The US Transportation Mode Share (passenger mile base)
Source: Bureau of Transportation Statistics
Thus, improving and expanding the existing highway and airport network has been considered a
better idea for the almost all US citizens and politicians. In addition, the US population density is lower
than the average of countries which have HSR networks and lines, shown in Fig 7.2.
Fig 7.2 Comparison of the population density (person/km2)
Source: United Nation Department of Economic and Social Affairs
87.4
11.4
0.4 0.7
Automobile Airline Bus Railway
0 100 200 300 400 500 600 700
USA
World…
Spain
France
China
Italy
Germany
UK
Japan
Belgium
Netherlands
Korea
Taiwan

112
Generally, HSR is considered the efficient transportation mode between the cities that have high
population density and the distance between these two cities is between about 100 km and 700 km. This
is because the high initial construction cost of HSR requires high passenger demand to cover the debt
from its construction.
In addition, the US geographic scale is much bigger than the countries which have already
introduced the national HSR network. Fig 7.3 shows the Japanese HSR network and Fig 7.4 shows the
French HSR network. Japanese HSR, Shinkansen, network has 2387.7 km railway lines, and French
HSR, TGV, network has 1895 km. Generally, HSR has an advantage against airline and automobile
transportation in the trip distance between 100 km and 700 km. If the travel distance is less than 100 km,
automobile transportation may be the first choice, and if the travel distance is more than 700km,
passenger may prefer to use airline to reduce their travel time. The country size of Japan and France are
very appropriate for the HSR.

113
Fig 7.3 Japanese HSR network
Source: Ministry of Land, Infrastructure, Transport and Tourism
Fig 7.4 French HSR network
Source: SNCF

114
On the other hand, the US country size is not appropriate for a nationwide HSR network. The US
High Speed Rail Association, one of the HSR advocacy group, shows the future US HSR network
picture, and the network would have about 17,000 miles (23877 km) shown in Fig 7.5. This is 10 times
as long as Japanese HSR network. This is unfeasible when one considers the very low population
density in many part of the US.
Fig 7.5 Future US HSR network drawn by US HSR Association
Source: US HSR Association
However, there are also counterarguments to these reasons why the US does not have HSR at all.
First, Germany and Japan have the highly developed highway networks as well as highly developed
HSR networks, and at least NEC has enough population and density. As Fig 7.1 shows, the French
population density is lower than Germany’s one. However, generally speaking, the French TGV network
is more profitable than the German ICE network. This is because France has Paris as the hub of TGV

115
network. Paris is bigger than any German city. Thus, the French TGV network has the radial structure
from Paris. This suggests even though the national population density is very low, if there is at least a
city which has the very large population size, HSR can be an appropriate passenger transportation
mode.
The current environment surrounding the US HSR project is very political. This thesis does not
discuss the political conflict around the HSR project in detail. This thesis, however, discusses why the
US HSR program has not been done at all.
7.2 Conception of the US HSR
In April 2009, US Department of Transportation (2009) and President Obama declared Vision for
High Speed Rail in America. This was the first US nationwide HSR program. The President also
allocated $8 billion to the project from the fund of American Recovery and Reinvestment Act (ARRA),
which had $787 billion in total. In December 2009, Congress approved the suggestion that on additional
$2.5 billion would be allocated for the HSR project in FY2010. In January 2010, the Federal Railway
Administration (FRA) chose 79 projects from 31 states to allocate the $8 billion fund, show in Fig 7.6.

116
Fig 7.6 US HSR corridor designations
Source: US DOT
The US railway industry and supporters of the HSR might have a positive feeling about the many
of projects were approved then. However, because of the large number of projects, the average amount
of fund each project could receive was about $130 million. This is a very small amount in the HSR
world. This means that some of the projects which were approved in January 2010 were not planning to
construct the world standard level HSR, which was defined in Section 7.1.
Since the second half of 2010, the US HSR projects have slowed down or partly halted. In
November 2010, the Democrat party lost many seats in the House of Representatives in the midterm
election, and lost its majority in the House. Subsequently, the newly elected Republican governors,
Governor Walker in Wisconsin and Governor Kasich in Ohio, decided to return the fund which was
allocated to the HSR project in these states. HUFF Post Chicago, internet news web site, reported that
Ohio Governor “Kasich has said that the top speed of 79 miles per hour (about 126 km per hour) on the

117
proposed Ohio project is too slow and questioned whether enough people would ride it.” This slow
speed has been a major concern about the US HSR project. As the report said, originally some of the US
HSR project did not expect to construct the latest world standard HSR.
However, the Obama administration did not reduce their interest of the project. President Obama
declared that the US would complete by 2025 the HSR network that could be accessed by 80% of all US
citizens. So his administration suggested the US would invest $53 billion in the project for 6 years, from
FY2012. Of course, some of the US transportation specialist, such as Ken Orski, a former federal
transportation official, opposed the project. December 6th
, 2011, TFI news, internet web news source,
said that Orski explained his opinion for the project: “Instead of identifying a corridor that would offer
the best chance of successfully demonstrating the technology of high-speed rail, and concentrating
resources on that project, the Administration has scattered its nine billion dollars on 145 projects in 32
states, and in all regions of the country.”
In February 2011, a critical negative event happened in Florida. The newly elected Florida
Republican Governor Rick Scott refused to accept the $2 billion HSR fund, which was from initial $8
billion fund, for the Florida project. This case had a strong impact on the total HSR project in the US.
After the rejection of the project in Florida, in April 2011, Congress decided to reduce the $2.5 billion
HSR fund in FY2011 to 0, and they also reduced the $2.5 billion HSR fund in FY2010 to $2.1 billion.
Several sources showed the reasons why the new Florida governor refused to accept the federal
HSR fund. St. Petersburg Times, internet news web page, said that the governor showed three reasons
why he rejected the HSR project.

118
First, Florida would have to pay from $540 million to $3 billion if the construction cost overran
the expected cost. Second, the ridership was considered to be wishful thinking because the federal
prediction used Amtrak’s NEC case. Third, Florida would have to pay back the initial $2.4 billion
federal subsidy if the HSR project failed completely. This thesis does not evaluate whether the
Governor’s view of the Florida HSR project is correct. However, we can at least say that the project was
originally proposed by the political sectors, not from the national railway company, Amtrak.
As shown in Chapter 2 and 3, Japanese and French first HSR projects were suggested by their
national railway companies, JNR and SNCF. JNR and SNCF both took the risks of construction cost,
demand, and management.
However, in Florida case, as the Governor said, the state of Florida would have to take almost all
risks of the HSR project. In addition, nobody knew who could be the railway operator, how much the
future railway operator would pay for the usage fee, and whether the state of Florida would accept
private sectors’ investment in the infrastructure.
After the failure of the Florida HSR project, people might start to have negative feelings about the
US HSR programs. Since 2009, the total amount of the fund that the HSR project has received was
$10.1 billion, which has come from the first $8 billion from ARRA and $2.1 billion from the budget of
FY2010. The fund which was returned from Ohio, Wisconsin, and Florida was re-allocated to the other
projects, including NEC and the California HSR.
As shown above, introducing the entire national HSR network into the US is an unreasonable idea.
However, as Taiwan and Korea, if the countries have an area which has at least high population density

119
cities, constructing HSR line, not network makes certain amount of sense. This thesis discusses about
California HSR project, in the next section, and NEC HSR projects, in Section 7.5, which have enough
population, population densities and an appropriate distances between two or more cities. We call these
HSR structure “lines” in this thesis.
7.3 California case
The California HSR project is one of the projects which received the fund that was returned from
Ohio, Wisconsin, and Florida. This section explores the California HSR project; the California HSR
project has characteristic differences from the other US HSR projects.
In November 2008, before President Obama was inaugurated, California took the vote that would
decide whether California would construct HSR, and the citizens approved “Safe, Reliable High-Speed
Passenger Train Bond Act for the 21st Century”, known as Proportion 1A. The act approved issuing
state bonds to help constructing the HSR between San Francisco and Los Angeles, about 400 miles, of
international standard HSR. This means that the California case was approved by the citizens legally.
This is one of the important points of the project. This means it is difficult to easily abandon the project
because the project was officially authorized.
The other important point is that the California project has been planning to construct the world
standard HSR from the ground up, not just improving an existing local line. As mentioned above,
several other projects have been planning to improve the existing lines.
In addition, the California case has an official authority, California High-Speed Rail Authority
(CHSRA). CHSRA is a state agency that was established by the California High-Speed Rail Act in 1996.
120
So in the California project, the organization that has the responsibility of the project is clearer than
other US projects, such as NEC HSR project, discussed in Section 7.5. This is a important character of
the California case and commonality with the first Japanese and French HSR project. As explained in
Chapter 2 and 3, at least Tokaido Shinkansen and the Paris-Lyon TGV line were planned and capitalized
by JNR and SNCF. On the other hand, most of the US HSR projects did not have strong authorities.
7.4 The difference between the US HSR project and HSR in other countries
However, the California and the other US programs still have a fundamental difference from
Japanese and French cases. The difference is that CHSRA is not a business operator or a railway
operator. They have planned, organized, but they have not had financial risks, and they have not
considered being the railway operator.
On the other hand, the countries which already have HSR have the business operators, such as
JNR and SNCF. Also JNR and SNCF believed that their first HSR lines could earn profit for them. Thus,
they had strong responsibility, interest, and obligation for the project. At the same time, they also faced
the financial risks. This means even though they were public sector, these HSR projects made the
investment case that they expected to get enough financial return.
If they failed to construct the profitable lines, there would be no HSR networks in Japan and
France. However, as this shown in Chapter 2 and 3, these first HSR lines, Tokaiso Shinkansen and the
Paris-Lyon TGV line have succeeded to be significant profitable HSR lines.
CHSRA made a modification about the budget and the project term once. Originally, they
estimated that the project needed $43 billion, and the project would be completed in 2020. However,

121
November 2011, they revised their estimations. The new budget they are requiring is $98.5 billion, and
the project term is extended to 2033. The budget they need has doubled and the term of the project was
extended by 13 years. Furthermore, in April 2nd
2012, Reuters news article said that CHSRA showed
their new cost of the construction plan which said they need $68.6 billion. Within less than two years,
they changed the estimated construction cost twice. The California HSR project is in crisis, like the other
US HSR projects.
This thesis concludes that the US HSR program has mainly three fundamental problems. First,
each project’s financial scheme was immature. As Florida governor complained, some projects imposed
the financial risk on the states. This has not happened in the other countries. Thus, many projects have
just invested the federal grant in the existing local railway lines to improve the speed a little bit, and
certainly not approach world standard HSR. This is fundamentally different from the idea of Japanese
and French HSR network project, shown in Chapter 2 and 3.
The second reason has a strong relationship with the first reason. As shown in Chapter 2 and 3, at
least Japan and France have had nationwide national railway companies, JNR and SNCF, that could
finance the first HSR lines. However, in the US, each case does not have an eligible business operator.
Even now, nobody knows who will be the operator of the California HSR, and nobody knows who
would take the financial risks if the project finance crashed. This means, there is no business operator
who has an incentive to drive the project forward.
Third is too much spreading of funds for political reason. As explained in Section 7.1, the US
DOT accepted too many projects, and some of these are not high speed passenger railway project. They
were just planning to improve the existing railway infrastructure.

122
However, JNR had constructed only Tokaido Shinkansen line between 1959 and 1964, and SNCF
had also constructed only the Paris-Lyon TGV line between 1976 and 1983. Their focused financing and
construction process were completely different from the US program, as it exists today
7.5 NEC
The US most profitable and congested railway corridor, known as Northeast corridor (NEC), is a
457 mile multi-track rail line between Boston and Washington DC, via New York. Cambridge
Systematics (2011) reported that the intercity-passenger railway service operated by Amtrak carries
approximately 13 million passengers within the area. This number of the passengers represents 5% of all
intercity trip passengers by all transportation modes on NEC. The report said that NEC is one of the ten
busiest railway corridors in the world.
First, this thesis estimated the potential of the future NEC HSR. This is because there are enough
big cities, which have large enough populations, along NEC. Even compared to Tokaido Shinkansen line
and the Paris-Lyon line, we can see the effective potential in NEC. Fig 7.8 shows the main cities’
populations along the three lines.

123
Fig 7.8 Population in the big metropolitan areas along the NEC (millions)
Source: US Census Bureau,
Besides, the economic scales of cities along the NEC are also appropriate for the HSR. Generally
speaking, high initial construction cost of HSR requires a business operator to set a high ticket price.
This means if the business operator wanted to succeed in the HSR business, they need enough
passengers who can pay the high ticket prices. The business operators need customers who believe that
the travel time reduction and comfort values are worth high ticket cost of HSR. This thesis uses the
estimated city GDP to evaluate the size of the economy in each city, shown in Fig 7.9
0
5
10
15
20
25
30
35

124
Fig 7.9 Estimated Cities’ GDP ($ billion)
Source: PricewaterhouseCoopers UK Economic
Distance between cities is also similar to the Tokaido Shinkansen. Fig 7.10 shows the image of
distances and population size of the cities along Tokaido Shinkansen line and NEC. The total length of
Tokaido Shinkansen line is 322 miles, and the distance between Boston and New York is 220 miles, and
the distance between New York and Washington DC is 238 miles. The length of the Paris-Lyon TGV
line is 260 miles. From the data, each distance between cities along with NEC is very appropriate for
HSR.
0
200
400
600
800
1000
1200
1400
1600

125
Fig 7.10 Distance and cities’ size on each corridor
Source: Amtrak and JR Central web pages
The ownership of the NEC infrastructure has particular structure. Fig 7.11 shows the ownerships
of each segment on the NEC and the areas of commuter railway services operating on the corridor. As
discussed in Chapter 2 and 3, infrastructures of Tokaido Shinkansen line and the Paris-Lyon line are
exclusively owned by JR Central and RFF, French railway infrastructure owning company, respectively.
On the other hand, the total infrastructures of NEC corridor are owned by four independent public
organizations, Amtrak, Massachusetts Bay Transportation Authority (MBTA), Connecticut DOT, and
Metro-North. Amtrak owns approximately 80%, 363 miles of the NEC railway line. For the other part,
MBTA owns 38 miles, Connecticut DOT owns 46 miles, MTA Metro-North Railroad (MNR) owns 10
miles.

126
Fig. 7.11 Ownership of NEC and commuter rail operators
Source: NEC Infrastructure Master Plan
Amtrak operates two types of intercity passenger railway service on NEC, Acela Express and
Regional between Boston and Washington DC, via New York. Amtrak National Factsheet (2010) said
that these two services have annual ridership of 8.107 million and 3.219 million passengers respectively.
Currently, Amtrak manages 10 daily operations of Acela Express between Boston and New York, and 15
daily operations between New York and Washington DC. Table 7.2 shows the comparison of the service
frequency and speed between NEC and Tokaido Shinkansen line.

127
Several freight railway companies also have trackage rights on the NEC. Currently, there are
Conrail Shared Assets Corporation, Providence and Worcester (P&W), Pan Am Southern, Canadian
Pacific (CP), Connecticut Southern, Norfolk Southern, and CSX Transportation. They operate
approximately 50 trains per day on the NEC. This is not a small number compared to the number of
operations managed by Amtrak, shown in Table 7.1.
Indeed, the intercity passenger transportation operated by Amtrak is not the majority of the service
in NEC. This means the major business player on NEC is short range commuter railway business.
Amtrak only has 5% of total ridership. In the share of train operation, Amtrak has only 6.7 % share. This
means Amtrak also recognized that the main operator on the current NEC is definitely not Amtrak, but
the other short distance commuter railway operators.
Table 7.3 shows the current ridership and the number of operations by each passenger railway
operator.
Table 7.3 Current ridership and daily trains
Source: NEC IMP (2010)
Annual Riders(millions)
% of total Daily Trains % of total
Amtrak 13 5 154 6.8MBTA 23 8.8 296 13.0ConnDOT/SLE 1 0.3 23 1.0MNR 49 18.8 345 15.2LIRR 86 33.1 581 25.6NJT 58 22.3 387 17.0SEPTA/DelDOT 18 6.9 374 16.5MARC 8 3.1 83 3.7VRE 4 1.5 29 1.3TOTAL 260 2272

128
As shown in Table 7.3, the total ridership of MBTA, Metro-North Railroad (MNR), Long Island
Railroad (LIRR), and New Jersey Transit (NJT) is more than 83% of total NEC ridership. They are
basically short-distance commuter railway operators.
The Amtrak NEC master plan (2010) said that they expected that the ridership would be 23
million and the daily trains would be 210 services by 2030. However, these numbers represent only
5.6% and 6.4 % of the total ridership and daily trains, respectively, in 2030. This means Amtrak knows
that the intercity passenger railway service would not be the major service on NEC, even in the future.
Fig 7.12 shows the volume of the train movement on the NEC. The main volume zones are around
the big cities, Boston, New Haven, Stamford, New York, Philadelphia, and Washington DC.
Fig. 7.12 Passenger train movements by segment of the NEC
Source: NEC IMP (2010)

129
Besides, Amtrak has other physical constraints in the NEC infrastructure. On the NEC, there are
several movable bridges in Connecticut. During the summer months, the Connecticut Department of
Energy and Environmental Protection limits the operation of Amtrak to 39 trains per weekday and 25
trains per weekend day over the five bridges in the state. The operation limited by the Connecticut
regulation makes a major bottleneck in the railway service between Boston and New York. Fig 7.13
shows how many times the movable bridges were operated in 1993.
Fig. 7.13 Average number of operations per day of the five Amtrak-owned movable bridges in
Connecticut, 1993
Source: FRA 1994
According to the NEC master plan, Amtrak stated that they would need $52 billion to improve the

130
bottleneck of the NEC. The shortened travel time between Boston and New York would be 3 hours and 8
minutes from 3 hours and 31 minutes, and the travel time between New York and Washington DC would
be 2 hour and 21 minutes from 2 hours and 45 minutes. It is very difficult to evaluate the cost and
benefit of the investment exactly. However, at least we can say that the amount of the fund, $52 billion,
is an extraordinary amount compared to the annual subsides from FRA to Amtrak. Amtrak has received
annually $1.5 billion subsidies from Federal Railway Administration (FRA), shown in Table 7.3.
Table 7.4 Federal Government Funds for FRA ($ million)
Source: DOT
This means the Amtrak’s improving NEC project required the government to invest 35 years’
worth of the subsidies. Besides, the result from the gigantic subsidies would shorten the travel time
about 25 minutes. The author believes that justifying the $52 billion budget just for improving the
existing NEC is very difficult.
7.6 Constructing a completely new HSR on NEC
Amtrak also published “A Vision for High-Speed Rail in the Northeast Corridor” (VHSR). This
paper suggested that Amtrak would construct a new exclusive HSR; only HSR vehicles run on it, and the
train operation speed would be 220 miles per hour. Amtrak suggested two potential lines, southern
alignment and northern alignment. The advantage of southern alignment is that Amtrak can use part of
existing NEC infrastructure. On the other hand, the advantage of northern alignment is that Amtrak can
year 2008 2009 2010 2011 2012
FRA 1581 11098 39660 1860 1632Amtrak 1325 2790 1565 1565 1418
HSR 0 8000 2100 0 0other 256 308 295 295 214

131
construct the new HSR along the existing highways, Interstate 84 and 91, owned by Connecticut, and
Intercity 90, owned by Massachusetts. These highway infrastructures and real estate are owned by
public sector organizations. The report said that if they constructed the new HSR alongside the highways,
they could save some of the capital construction cost. However, the choice of the alignment need same
amount of construction cost. Amtrak estimated that they need $117 billion.
“Amtrak Vision for HSR” also explained the shortened travel time in the future. The proposal
paper shows the “HSR and Super HSR”, Super HSR’s total travel time would be shortened by reduced
time of staying in the stations. Table 7.4 shows the estimated future travel time.
Table 7.5 Estimated future travel time of NEC
Source: Amtrak VHSR (2010)
From the travel times and distances, we can estimate the average travel time, shown in Table 7.5;
this is close to the current speed of Tokaido Shinkansen.
Table 7.6 Expected travel time and speed by VHSR
Source: Amtrak VHSR (2010)
Distance(mile)
HSRAverage(mile/h)
SuperHSR
Average
DC-NYC 238 1:55 124.6 1:36 148.7NYC-Boston 220 1:46 124.5 1:23 159.4DC-Boston 448 4:06 111.7 3:23 135.5Tokyo-Osaka 322 2:25 133.2 133.2
HSRAverage(mile/h)
Super HSR Average
DC-NYC 1:55 124.6 1:36 148.7NYC-Boston 1:46 124.5 1:23 159.4DC-Boston 4:06 111.7 3:23 135.5Tokyo-Osaka 2:25 133.2 133.2

132
Although Amtrak did not mention the frequency of the services, we assume that the new HSR
could have the same level of operations frequency as the Tokaido Shinkansen line.
For this exclusive new world standard HSR, Amtrak requires $117 billion. Actually estimating the
future construction costs is an important and difficult problem. However, Rus (2008) compiled the
survey financial data about HSR in Europe, and he said that “the average cost per km of a HSR line
ranges from 9 to 40 million of euros with an average of 18.” The average exchange rate between euro
and dollar was about 1 euro equals $1.5. Thus, the average of European HSR construction cost per km
was $27 million. Amtrak’s proposal, VHSR, said they need $163 million per km to complete the HSR
infrastructure on NEC. This is six times as much as the European average, and more than twice the cost
of the most expensive European HSR infrastructure.
We could not find out how Amtrak estimated the total construction cost, and why the cost was 6
times as much as the European average HSR construction cost. However, from the discussion in this
thesis, one possibility is there is less motivation for reducing the construction costs in Amtrak, which
does not have any risk about the construction of the future exclusive NEC, might lead to increase in the
construction cost.
Again, each HSR case has its own geographical problem. Thus, estimating the total construction
costs from other existing HSR system is very difficult. However, if we compare the amount of an annual
subsidy, about $1.5 billion, which Amtrak has been receiving, and the total construction cost, $117
billion, which Amtrak estimated, we can say the feasibility is very low. There are several reasons why
the project did not make enough progress even though the potential market is huge. As this thesis
already mentioned, we concluded that there is no organization which has a responsibility to the US HSR

133
projects. Thus, there are little incentive to promote it compared to Japanese and French cases we already
explained in Chapter 2 and 3.
As shown in Table 7.4, Amtrak has been a heavily subsidized government owned company. Since
the beginning, in 1971, they have continued a deficit operation in their finance. The financial statements
that have been released by Amtrak annually stated that all of the railway operations by Amtrak need the
subsidies, except for the NEC operation.
Train Journal (2011) said that “the NEC trains covered all their direct and indirect costs, with $61
million left over.” This means Amtrak has two business constraints. One is that they need subsidies to
operate the social public services. This was the original reason that the government capitalized Amtrak
in 1971. The other is that they need to do competitive business on NEC. There are other transportation
modes, such as automobiles and buses service on a highway and airlines. However, the current Amtrak
fiscal structure might decrease the ability to achieve the appropriate management and financing for the
world standard HSR project.
7.7 Conclusion: appropriate management structure in NEC
As this thesis already showed in Chapter 6, the productivity of the operation management of
Tokaido Shinkansen has been improved after JNR was divided into 6 areas and partly privatized. From
the result, introducing the completely new HSR operator, not Amtrak, may be able to improve the
management efficiency of the future NEC HSR.
The advantage of the private sector is that first, they can set an appropriate ticket price without or
at least a minimum level of cross-subsidization. As shown in Chapter 2 and 3, JNR was forced to use

134
cross-subsidization to continue unprofitable railway lines, and SNCF is still using cross-subsidization to
continue their “social service” parts. Generally cross-subsidization makes the operators’ management
incentive weaker. Although we cannot determined if Amtrak is using the profit from NEC to continue
their unprofitable lines, at least the current Amtrak, deeply subsidized public company, has less
management incentives compared to the private operators.
Also as show in Chapter 6, the significant improvement of Tokaido Shinkansen’s MFP has been
from the reduction of the capital related expense. Thus, this thesis recommends that any private sector,
including the HSR operation company, should capitalize and manage the construction of the future NEC
infrastructure, even partly. This suggests that financing entire NEC infrastructure by a private company
is impossible in reality. However, there are some feasible cases. For example, some private companies
make a consortium to capitalize the NEC infrastructure.
Currently, many countries have already introduced private sectors’ funds to construct HSR
infrastructure. As shown in Chapter 2, current Japanese HSR project is partly financed by JRs. In Taiwan,
they constructed the first HSR line by BOT, Build-Operate-Transfer. Chang (2001) explained the
Taiwanese HSR case financed by BOT. He said that “Taiwan High Speed Rail (BOTHSR) developed a
model for financial planning and evaluation of bidders’ proposals”. BOTHSR is a pure private company
which was capitalized five Taiwanese private companies to start the domestic HSR project.
This thesis cannot conclude that the Taiwanese case works well because there is not enough
available data. However, we can say that utilizing the private sector’s funds to construct HSR
infrastructure was feasible. If there is financial difficulty to construct exclusive NEC HSR line, at least
the US government has to consider utilizing the private funds.

135
In addition, the private sector can be very eager to reduce the total construction costs. This is
because they are also capitalized by private companies and individual stock holders. To satisfy them,
their investment should be very rational.
About introducing the vertical separation and competition within the operator, we do not have
enough empirical data. Some researchers favor the Swedish public bidding system, which has improved
personnel productivity, shown in Table 3.4. Thus, this thesis suggests that the future NEC HSR operator
should consider the public bidding.
True competition in the transportation field already exists in airline and automobile transportation.
On the other hand, this true competition had not happened in HSR market. There are some reasons why
it had not happened, for example, safety problem, cross-subsidization, and national railway system.
However, NTV in Italy, which is also capitalized by some pure private companies, started true
competition against Trenitalia, former Italian national railway and still state owned company, from April
28th
2012. Although there is not enough data to evaluate the effect of the true competition within the
railway operators, this Italian case could be a fine test case for the future NEC. This thesis shows
information of the current Italian HSR competition in the afterword that follows Chapter 8
This thesis researched about Japanese and French HSR productivity to evaluate the effect of
privatization and vertical separation, and we suggested that introducing competition within the private
sectors can improve the potential US HSR market well. However, each country has characteristic
problems. We have to be careful about introducing the privatization and competition into the US
potential HSR market even though these have improved the productivity of railway industries in some
countries. In the next chapter, we show the conclusion of our research.

136
Chapter 8
Conclusion
This thesis mainly analyzed the effect of privatization and dividing of JNR, so-called JNR
privatization, and vertical separation of SNCF by applying multi-factor productivity (MFP). Thus, we
need to know what actually happened during the privatization of JNR and introducing vertical separation
into SNCF to guarantee that our research objectives are appropriate to evaluate the effect of these
railway industrial reforms. We set Tokaido Shinkansen and the Paris-Lyon lines as research objectives to
evaluate the reforms.
First, this thesis introduced what actually happened in Japanese railway industrial reform, known
as JNR privatization in Chapter 2, and in European railway industrial reform, known as vertical
separation management in Chapter 3.
The privatization and vertical separation had been introduced in part because of the change of
railway mode share in these countries. As shown in Chapter 2 and 3, in Japan and European countries,
the national railway companies lost significant amount of their mode share. These national companies
had an obligation to operate a number of unprofitable lines. They had been forced to use
cross-subsidization to cover the deficit from these unprofitable lines.
However, after World War II, the rapid spread of motorization made continuing the
cross-subsidization difficult. In the 1980s, Japan and European countries decided to reform their national
railway companies. In 1987, JNR was divided into six passenger railway companies, a freight railway
company, and a high speed railway infrastructure owning company. At this point, Japan introduced the
vertical separation in their HSR management as well. However, the Japanese vertical separation system

137
was over about 4 years later, 1991. This was because the system forced JR Central, which has operated
Tokaido Shinkansen since 1987, to continue the cross-subsidization to support the other JRs financially.
After the Japanese vertical separation was terminated, the government began releasing JR Central’s
stocks from 1996 and finished releasing the stocks in 2006. Now JR Central is a completely private
railway operation company which also owns Tokaido Shinkansen’s infrastructure.
In Europe, although Sweden introduced vertical separation management in 1988, the countries
which had large scale national railway companies, such as France, Italy, and Spain, were very slow to
introduce vertical separation management. As a result, in these countries’ vertical separation
managements were not rigorous. For example as shown in Chapter 3, France introduced the “rhetorical”
vertical separation. The French government divided RFF, railway infrastructure owner company, from
SNCF, national railway company. However, Quinet (2005) noted that SNCF and RFF have a special
relationship that precludes any new entries into the HSR operation.
This thesis evaluated the effect of the successive railway industrial reform in Japan by using
productivity analysis. In Chapter 4, this thesis introduced the earlier important research of productivity.
First, Solow (1957) developed the procedure which applied total-factor productivity (TFP) to analyze
US GDP growth. He figured out that 87.5 % of the US GDP growth from 1909 to 1949 was from TFP
growth.
This thesis also introduced the GDP growth analysis by Krugman (1994). He pointed out that the
Asian countries’ high GDP growth had been supported by the increasing input rather than improved TFP.
So he predicted that these countries’ GDP growth would slow down soon. Actually in the late 1990s,
these countries GDP growth were very low or even negative.

138
We also discussed the research of the effect from deregulation in the transportation industries,
such as the US and Canadian railways and the US airline. Tretheway (1982) showed that the Canadian
railway companies’ productivity had been higher than the US railway companies because the Canadian
government permitted Canadian railway companies to use very flexible pricing systems. On the other
hand, the US government introduced some regulations into motor vehicle industries to support the US
freight railway industry. In addition, Cave (1982) showed that the US airline deregulation has improved
their productivity well. We explained generally productivity analysis is recognized a good tool to
analyze the industrial structure reform, in our case, privatization and vertical separation.
We applied MFP, which has a single output and multiple inputs. Passenger-km and revenue were
used as output data separately, and personnel expense, non-personnel expense, and capital related
expense were used as input data. We set Tokaido Shinkansen and the Paris-Lyon line as our research
objectives. This was because these lines have the appropriate character to represent the effect of railway
industrial reforms. First, these lines have been profitable since their opening years. This suggests the
microeconomic theory works in the management of these lines. Second, these lines introduced the
latest technology when these lines had been constructed. This suggests the contribution of additional
HSR technology development for productivity is limited. Third, these lines have been used by only
HSR. So we can eliminate the contribution of developing logistics system in freight railway industry to
productivity. Fourth, these lines have more than 30 years management history. When we evaluate the
effect of industrial reform, we need a reasonable time span.
Our research results showed, after 1974, Tokaiso Shinkansen’s MFP growth had been negative.
However, after JR Central (JRC) started its operation, Tokaido Shinkansen’s MFP growth managed by
JRC has been constantly positive. From the result, we determined that the Japanese railway reform,

139
known as the privatization of JNR, has succeeded in improving the MFP of Tokaido Shinkansen.
After we showed the results of MFP analysis, we analyzed the single factor productivity, which
has a single input and a single output. The research result inducated that the capital related productivity,
passenger-km-capital expense productivity and revenue-capital expense productivity, has increased
significantly since the reform. We judged that the reason why JR Central has improved its productivity is
that JRC has a higher incentive to reduce the capital related expense than JNR had. Since 2000, JRC has
also increased their personnel expense related productivity. However, we cannot see a significant change
in the non-personnel expense related productivity. At this point, additional research is still needed.
We also tried to calculate the Paris-Lyon line’s MFP to evaluate the effect of introducing the
vertical separation in the French railway industry. However, not enough data were available. So we
reviewed the previous research about the productivity of entire French railway industry, including the
freight railway. Generally, their research results showed that the vertical separation has reduced the
productivity of the French railway industry. On the other hand, simultaneously, their research result
determined that Germany and Sweden have improved their productivity well after introducing the
vertical separation. This means that if one country introduced the competition with the vertical
separation management, as Germany and Sweden did, they could improve their productivity. As we
showed in Chapter 3.2, the French government slowly introduced the vertical separation because they
were not willing to introduce competition into their railway industry.
However, as shown in Chapter 3.2, the French government introduced a very complicated
relationship between SNCF and RFF. RFF has offered the railway maintenance jobs only to SNCF, and
the decision making process of railway infrastructure usage fees paid by SNCF to RFF is opaque. The

140
previous research had not considered the complicated relationship between SNCF and RFF. To develop
a research scheme that solves the current complicated management system in France, additional research
is still needed.
From the MFP analysis of Tokaido Shinkansen and the literature review of the research of the
European railway reform, we obtained two important results:
1. Privatization and dividing of Japanese railway industry has improved the productivity of the most
profitable HSR, Tokaido Shinkansen
2. Introducing the vertical separation might improve the railway industries’ productivity in Europe but
only if they also introduced competition.
In Chapter 7, this thesis analyzed the current US HSR programs and suggests three reasons why
the US HSR programs are not moving forward. The first is a problematic financing scheme. Almost all
projects deeply depend on the subsidies from federal government. As shown in Chapter 2 and 3, the first
Japanese and French HSR were financed by JNR and SNCF. Second, there is no large scale railway
operator. This means there is no organization which drives the US HSR programs. Third, for the political
reason, the federal government distributed their subsidies to the large number of programs around the
US, 79 projects, and did not concentrate constructing HSR on the important corridors, such as California
and NEC.
Although the entire national HSR network in the US is not a feasible project, this thesis suggests
that the HSR lines in major corridors, California corridor and NEC, make a certain amount of sense. As
shown in Table 7.1, some countries, such as Korea and Taiwan, introduced the HSR line. These
countries connected their capital cities and the second biggest cites. So these cases could be good

141
examples for the future US HSR in major corridors.
From our research results, even though geographically and economically there are lot of
difference between the US case and Japanese or French cases, one of the ideal management structure we
suggest for consideration of the potential NEC HSR is as following, the infrastructure will be capitalized
by mainly public money. However, the private sector should be in charge of managing the infrastructure,
and the operation will be managed by a private company with competition. The infrastructure owning
private company would take over the new exclusive HSR infrastructure financed by public sector’s
money.
This is because from the case of Tokaido Shinkansen, we showed that the most significant effect
of the privatization has appeared in the capital related productivity. This company would manage the
depreciation, taxation, and maintenance fee as expense and railway usage fee from the operator as
income. This company should try to improve their infrastructure and financing scheme with diligence
because they are a private company for profit. Besides, private HSR operators would try to decrease
their operating costs to decrease their ticket fee if the government or the infrastructure owner company
would hold the bidding; infrastructure owner company would decide the operator which would pay the
highest infrastructure usage fee.
However, this is only one possibility for the future exclusive HSR in NEC. Indeed, this case has
not happened yet because there are still considerable technical and financial difficulties. In addition, the
private sector’s success happened only in Japan. We cannot say the privatization and dividing would be
the best solution in all railway industries. However, from April 28th
2012, Italo, Italian pure private
railway operator, is planning to manage their HSR service on the infrastructure which is owned by the

142
public sector. The previous Italian national railway company, Trenitalia is also operating their HSR on
the same infrastructure. This Italian case could act as a pioneer. This thesis explains current Italian HSR
competition in the afterword following this chapter.
Since the Japanese government reformed the national railway company, some innovative railway
reform has happened. The vertical separation introduced by Sweden has spread into the members of EU
with some alterations. Now the latest social pilot program will be held in Italy. After the future research
evaluate the Italian HSR case, private companies competition on the vertically separated infrastructure,
we will know more appropriate HSR management structure.
Even after our research has been complicated, there are still very interesting topics remaining.
Does introducing vertical separation without competition make sense? Does introducing true
competition really improve productivity? Is it possible to introduce the private sectors’ funds to
construct the new exclusive NEC infrastructure? We hope these questions will be solved with careful
numerical data analysis in the near future.
This thesis requires substantial amount of patience for readers, and here we would like to express
our thanks to all of readers for your attention. We hope you find our research of value.

143
Afterword
HSR Competition in Italy
Introduction:
As this thesis described many times, originally, the EU wanted to stimulate competition within the
HSR operators by introducing vertical separation management; that means two or more operators on the
same infrastructure. Fundamentally, their idea was correct. Indeed, some countries, such as Sweden,
have said that they have improved their management efficiency with vertical separation, as shown in
Table 3.4. On the other hand, in the major European HSR markets, such as Germany, France, Spain, and
Italy, they had continued the monopoly market by the former national railways. Besides, these HSR
operators are still state owned companies, DB, SNCF, RENFE, and Trenitalia. As we explained in
Chapter 3, previous research showed their vertical separation might not contribute to improve
productivity, although admittedly data is limited.
However, an epoch making event is happening now in Italy. On April 28th
2012, the pure private
capitalized HSR operation company, Italo, started their HSR operation business on the Italian HSR
infrastructure which is owned by the public sector. Now, the former Italian national railway company,
Trenitalia, has to compete against Italo to retain their market share.
In this afterword, we discuss what is happening in Italy and the fundamental question, whether the
competition is fair from the viewpoints of Italo and Trenitalia.
History of Italian railway:
Before introducing vertical separation, Italian National Railway Company, so-called Ferrovie
dello Stato (FS), had operated all domestic railways including HSR. In 1991, the government introduced

144
vertical separation management in their HSR management in compliance with the regulation of the EU.
Italian government capitalized Treno Alta Velocità SpA (TAV), which owns Italian HSR infrastructure.
The government gave a new name, Trenitalia, to the new government owned railway operator.
As this thesis mentioned in Chapter 3, even though the original purpose of introducing vertical
separation management was to stimulate the competition within the operators, no actual competition had
happened in Italian HSR market. However, in 2006, the pure private holding company, Nuovo Trasporto
Viaggiatori (NTV), was capitalized to operate HSR in Italy as completely pure private railway operator.
NTV and Italo:
NTV is the holding company, which was capitalized by several Italian major business leaders,
such as CEO of Fiat and TODS, and Intesa Sanpaolo, an Italian bank. Then, they said, they would
operate HSR in Italy in the future, and NTV named the new HSR operation company Italo.
They postponed the day of the opening of their business. They may have gone through a lot of
political conflicts. The Financial Times, February 24th
2012, reported that the CEO of Italo said that the
opening day of their HSR depends on when TAV issues the business permission to Italo. Finally, Italo
was accepted by TAV, and started their HSR operation between Rome, capital city of Italy, and Milano,
the financial capital city of Italy on April 28th
.
Reputation if Italo’s service now:
Just before April 28th
, some of the media was skeptical about the challenge of Italo. The Railway
Gazette, April 10th
2012, said whether Italo will be able to start their HSR business deeply depended on
the decision of TAV in February 2012. As shown in Chapter 3, EU did not forced member countries to

145
introduce the same vertical separation system. As Table 3.6 shows, there are various vertical separation
managements. In Italy, the government just divided the infrastructure owner company, RFI, and railway
operator, FS, but both companies are still belonging to the national railway group, Ferrovie dello Stato
S.p.A. Nash (2004) called this type of separation “organizational separation”.
Trenitalia’s viewpoint:
As noted above, Trenitalia is a government-owned company. This thesis cannot confirm they have
legal obligation to operate unprofitable railway lines as social services. However, definitely some of
their railway operation businesses are unprofitable. Until Italo penetrated the HSR operation business
between Rome and Milan, Trenitalia enjoyed their monopoly power in that profitabele market, and they
used cross subsidization to continue operating their unprofitable railway lines. But now they have lost
their monopoly power in the profitable market. The Voice of America reported that “the state-owned
railway network (Trenitalia) has already lowerd its ticket prices and improved its service.” So they
already reduce their HSR ticket price to keep their customers. Every customer is happy about it, and
people may be able to say this is the benefit from the competitive market theory.
However, can Trenitalia believe this is a competitive market? We may be able to say they have
some sense that it’s an unfair competition. This is because they are managing certain amount of
unprofitable operations. On the other hand, Italo can manage only the profitable HSR operations.
Trenitalia may think Italo is just doing cream-skimming.
NTV and Italo’s viewpoint:
On the other hand, even though Italo is happy about starting their business, they may also have
certain amount of instability in their business model. First, there is no rigorous regulation about the

146
infrastructure usage fee. Reuters reported that CEO of Italo said “we are going to pay 120 million euro
for the usage fee”. But perhaps TAV will raise the usage fee. They may not be able to contest it because
there is no market price.
Second, the TAV can stop their business if they think Italo’s business has any safety problem.
Third, theoretically, Trenitalia can get unlimited amount of subsides from the government. This is
because Trenitalia is still a government owned company.
What we can learn from the case:
As mentioned above, passengers can get benefits from competition between Trenitalia and Italo
now. Italo’s ticket price is lower than Trenitalia, and Trenitalia is also trying to catch up with Italo’s
ticket price.
However, there is no guarantee this competition could be continued. This thesis suggests that the
Italian government should privatize Trenitalia, or at least the HSR management department. Now
Trenitalia, the government-owned company, is competing against Italo, a pure private company. This is
an unbalanced competition. This is because even if Trenitalia’s management system has fundamental
problems, they can cover a loss by the subsidy from the government. But a balanced competition can
occur between private companies. In the near future, we suspect the Italian government will face the
problem.
This thesis hopes the Italian HSR competition would be the important pilot case for every country
which wants to improve the productivity of its railway industry via vertical separation with competition.

147
References
Arne, N. (1988): “Traffic Policy in an Environmental Perspective” The London School of Economics
and Political Science
Cantos, R. Pastor, J. and Serrano, L. (1999): “Productivity, Efficiency and Technical Change in the
European Railways: A non-parametric approach” Kluwer Academic Publishers November 1999
Caves, D. W., L. R. Christensen and J. A. Swanson (1981): "Economic Performance in Regulated and
Unregulated Environments: A Comparison of US and Canadian Railroads" The Quarterly Journal of
Economics November 1981 No.4
Caves, D. Christensen, L. and Tretheway, M. (1982): “Airline Productivity under Deregulation”
Regulation November/December
Central Japan Railway Company Annual Report 2011
http://company.jr-central.co.jp/ir/annualreport/_pdf/annualreport2011.pdf
Central Japan Railway Company Fact Sheets 2010
http://company.jr-central.co.jp/ir/factsheets/_pdf/factsheets-18.pdf
Coelli, T. Rao, P. O’Donnell, C. and Battese, G. (2008): “An Introduction to Efficiency and Productivity
Analysis” Springer textbook serious
Cowing, T.G. and R.E. Stevenson (1981): “Productivity Measurement in Regulated Industries”
Academic Press TSA Publications April 1981
Chevroulet, T. (2010): “Assessment of High Speed Rail Projects: Selection of European Case and
Recommendations from Eva-Tren Research” 12th
WCTR, July 2010
Cowie, J. (2001): “Subsidy And Productivity in the Privatized British Passenger Railway” TSA
publications January 2001
Diewert, W. E. (1991): "The Measurement of Productivity in Regulated Industries". Discussion Paper
No. 91-20, Department of Economics, University of British Columbia, Vancouver.

148
Duke, J., D. Litz and L. Usher (1992): "Multifactor Productivity in Railroad Transportation" Monthly
Labor Review No. 11 1992
Friebel, G. Ivaldi, M. and Vibes, C. (2002): “Railway (de)regulation: A European Efficiency Comparison”
French Transportation Journal August 2002
Gomez-Ibanez, J. and Rus, G. (2005): “Competition in the Railway Industry” Harvard Transport
Economics and Policy June 2005
Gordon, R. J. (1992): "Productivity in the Transportation Sector". Working Paper Series 1993/02 (N.
1771), pp.371-442. Chicago: National Bureau of Economic Research”
HUFFPOST Chicago: http://www.huffingtonpost.com/chicago/
Hulten, C. (2011): “Total Factor Productivity A Short Biography” New Development in Productivity
Analysis Journal July 2011
Imashiro, M (1999): “International Comparison of Railway Reforms” Japanese Economic Critics Paper
No. 11, 1999
Impact of the Staggers Rail Act of 1980:
http://www.fra.dot.gov/downloads/policy/staggers_rail_act_impact.pdf
Jansson, J. Owen, J. and Cardenbring, P. (1989): “Swedish Railway Policy 1979-88” issued by Swedish
Ministry of Transportation May 1989
Japan Ministry of Land, Infrastructure, Transport and Tourism Data Base
http://www.mlit.go.jp/k-toukei/tetsuyu/tetsuyu.html
Japanese Railway Statistics Foundation (1995): “Japan National Railway Chronology”
Kagami, M. (1999): “Privatization and Deregulation: The Case of Japan” Japan Railway Journal
February 1999
Kinugasa, T. (2005): “the Productivity Analysis of Public Business”. Central Economy Co. Journal
No.11, 2005

149
Krugman. P. (1994): “The Myth of Asia’s Miracle” Foreign Affairs, 73:6 P.62
Larsson, M. (2009): “Major Trends in Modal Split Passenger and Freight Transport EU and North Sea
Regions” A Progress Report of the Statistical Mapping Task of Transport Group, NSC March 2009
Leheis, S. (2009): “High-Speed Train Planning in France, Lessons from Mediterranean TGV-Line”
World Academy of Science, Engineering and Technology 54, 2009
Martinez, P. and Suarez, E. (2004): “Performance of the High Speed Rail in Spain in the Context of the
New Regulation Framework. Evidence from the Madrid-Seville HSR Corridor” 9th
Conference on
Competition and Ownership in Land Transport
Martland, C. (2011): “Productivity Improvements in the U.S. Rail Freight Industry 1980-2010” MIT
paper October 2011
Ministry of Transportation and Communication in Sweden (1992): “Traffic Changes on Socio-Economic
Conditions, Stockholm” Conference Paper of TSA July 1992
Nakajima, T. (2001): “The Analysis of Japanese economics productivity” Paper of Japan Economics
Journal July 2001
Nam, T. (2009): “The Transportation-Cost Politics of Privatization” Jigaku-sha textbook p122 to p133
Nash, C. (2009): “European Railway Reform the Next Steps” European Conference of Minister of
Transportation competitive tendering for rail services, ECMT, Paris No. 2 2009
Nash, C. (2005): “Europe: Alternative models for restructuring” European Conference of Minister of
Transportation competitive tendering for rail services, ECMT, Paris July 2005
NEC Master Plan Working Group (2011): “The NEC Infrastructure Master Plan” issued by Amtrak
Obermauer, A. (2001): “National Railway Reform in Japan and the EU: Evaluation of Institutional
Changes” Railway Management and the Role of Government, December 2001
Pietrantonio, L. (2004): “The Economics of EU Railway Reform” Bruges European Economics Policy
Briefings January 2004

150
PricewaterhouseCoopers (2009): “UK Economic Outlook November 2009”
http://www.ukmediacentre.pwc.com/imagelibrary/downloadMedia.ashx?MediaDetailsID=1562
Public Corporation and National Enterprise Labor Relations Act (1950)
Quinet, E. (2005): “France: Avoiding competition” Harvard Transport Economics and Policy
Ross, J. (1994): “High-Speed Rail: Catalyst for European Integration?” Journal of Common Market
Studies No. 24, 1994
Rus, G. (2008): “The Economic Effect of High Speed Rail Investment” International Transport Forum
Discussion Paper No. 2008-16
Rus, G. and Nombela, G. (2007): “Is Investment in High Speed Rail Socially Profitable?” The London
School of Economics and Political Science December p12 to p24
Rus, G. and Campos, J. (2009): “Some stylized facts about high-speed rail: A review of HSR
experiences around the world” Transport Policy 16, 2009
Rus, G. and Inglada, V. (1997): “Cost-Benefit analysis of high-speed train in Spain” The Annuals of
Regional Science, 1997, 31:175-188
Solow, R. (1957): “Technical Change and the Aggregate Production Function” The review of Economics
and Statistics, Vol.39, No.3.
Starr, P. (1988): “The Meaning of Privatization” Yale Law & Policy Review Vol. 12
St. Petersburg Times: http://www.sptimes.ru/
Suda, H. (1994): “30 years history of Tokaido-Shinkansen” Japan Economics November 1994
Takahashi, D. (2000): “People Who Made Shinkansen” Japan Economics May 2000
Takatsu, T. (2007): “The History and Future of High-Speed Railways in Japan” Japan Railway &
Transportation Review Vol. 48
Takatsu, T (2007): “The History and Future of High-Speed Railways in Japan” Japan Railway &
Transport Review 29, December

151
The US Department of Transportation (2009): “Visions for High Speed Rail for America”
Thompson, L. and Tanaka, Y. (2011): “High Speed Rail Passenger Service: World Experience and U.S.
Applications” TGA Transportation Concepts Transport Politics:
http://www.thetransportpolitic.com/2011/09/24/after-30-years-tgv-service-prospers-even-as-its-future-is-
questioned/
Tretheway, M. W. and W. G. Waters II (1991): "Productivity Trends in Canadian and US Railroads" The
London School of Business and Political Science No.5, 1991
Tretheway, M. W. and W. G. Waters II (1992): "Productivity Trends in Canadian and US Railroads" The
London School of Business and Political Science No.7, 1992
Tretheway, M. W., W. G. Waters II and Andy K. Fok (1994) “Measuring Productivity and Financial
Returns for Canadian National Railway and CP Rail 1956-1991”. Monograph, UBC Centre for
Transportation Studies Vol.9, 1994
Vickerman, R. (1997): “High-speed rail in Europe: experience and issues for future development” The
Annuals of Regional Science No. 2, 1997
Winston, C. (2005): “The United States: Private and deregulated” Political Science Quarterly, 19