high temperature experiment design, operation, and results
TRANSCRIPT

INL/EXT-12-27082
High Temperature Electrolysis 4 kW Experiment Design, Operation, and Results
J. E. O’BrienX. ZhangG. K. HousleyL. Moore-McAteer G. Tao
September 2012
DISCLAIMER This information was prepared as an account of work sponsored by an
agency of the U.S. Government. Neither the U.S. Government nor any agency thereof, nor any of their employees, makes any warranty, expressed or implied, or assumes any legal liability or responsibility for the accuracy, completeness, or usefulness, of any information, apparatus, product, or process disclosed, or represents that its use would not infringe privately owned rights. References herein to any specific commercial product, process, or service by trade name, trade mark, manufacturer, or otherwise, does not necessarily constitute or imply its endorsement, recommendation, or favoring by the U.S. Government or any agency thereof. The views and opinions of authors expressed herein do not necessarily state or reflect those of the U.S. Government or any agency thereof.

INL/EXT-12-27082
High Temperature Electrolysis 4 kW Experiment Design, Operation, and Results
J. E. O’Brien, X. Zhang, G. K. Housley, L. Moore-McAteer (Idaho National Laboratory); and G. Tao (Materials and Systems Research, Inc.)
September 2012
Idaho National Laboratory VHTR TDO Program
Idaho Falls, Idaho 83415
http://www.inl.gov
Prepared for the U.S. Department of Energy Office of Nuclear Energy
Under DOE Idaho Operations Office Contract DE-AC07-05ID14517


H
Approve
James E. TechnicaHydrogen
Carl M. SHydrogen
David A.Director,
igh Tem
ed by:
O’Brien al Lead, VHTRn Research an
Stoots n Technical R
. Petti VHTR TDO
mperatuDesign
R TDO nd Developm
Reviewer
O
VHTR T
ure Elen, Opera
INL/E
Sept
ment
TDO Prog
ctrolysation, a
EXT-12-2708
ember 201
gram
sis 4 kWand Res
82
12
W Expersults
9/30/2Dat
9/30/2
Dat
9/30/2
Dat
riment
2012 te
2012
te
2012
te


v
ABSTRACT
This report provides results of long-term stack testing completed in the new high-temperature steam electrolysis multi-kW test facility recently developed at INL. The report includes detailed descriptions of the piping layout, steam generation and delivery system, test fixture, heat recuperation system, hot zone, instrumentation, and operating conditions. This facility has provided a demonstration of high-temperature steam electrolysis operation at the 4 kW scale with advanced cell and stack technology. This successful large-scale demonstration of high-temperature steam electrolysis will help to advance the technology toward near-term commercialization.

vi

vii
SUMMARY
A new test stand has been developed at Idaho National Laboratory for multi-kW testing of solid oxide electrolysis stacks. This test stand was initially operated at the 4 kW scale. The 4 kW tests included two stacks operating in parallel in a single hot zone. The stacks are internally manifolded with an inverted-U flow pattern and an active area of 100 cm2 per cell. Process gases flowing to and from the two stacks are distributed from common inlet/outlet tubing using a custom base manifold unit that also serves as the bottom current collector plate. The solid oxide cells incorporate a negative-electrode-supported multilayer design with nickel-zirconia cermet negative electrodes, thin-film yttria-stabilized zirconia electrolytes, and multilayer lanthanum ferrite-based positive electrodes. Treated metallic interconnects with integral flow channels separate the cells and electrode gases. Sealing is accomplished with compliant mica-glass seals. A spring-loaded test fixture is used for mechanical stack compression. Due to the power level and the large number of cells in the hot zone, process gas flow rates are high and heat recuperation is required to preheat the cold inlet gases upstream of the furnace. Heat recuperation is achieved by means of two inconel tube-in-tube counter-flow heat exchangers. A current density of 0.3 – 0.4 A/cm2 was used for these tests, resulting in a hydrogen production rate of 25 NL/min. Inlet steam flow rates were set to achieve a steam utilization value of 50%. A duration of 1000 hours was targeted for long-term testing at the 4 kW power level order to document the long-term durability of the stacks. Details of the test apparatus and initial results are provided.

viii

ix
ACKNOWLEDGEMENTS
This work was supported by the United States Department of Energy Office of Nuclear Energy, Very High Temperature Reactor Technology Development Office. Idaho National Laboratory is operated for the United States Department of Energy Office of Nuclear Energy by Battelle Energy Alliance, LLC, under contract No. DE-AC07-05ID14517.

x

xi
CONTENTS
ABSTRACT .................................................................................................................................................. v�
SUMMARY ................................................................................................................................................ vii�
ACKNOWLEDGEMENTS ......................................................................................................................... ix�
ACRONYMS ............................................................................................................................................. xiii�
NOMENCLATURE .................................................................................................................................. xiii�
UNITS ........................................................................................................................................................ xiii�
1.� INTRODUCTION .............................................................................................................................. 1�
2.� 4 kW TEST FACILITY ...................................................................................................................... 2�2.1� 4 kW Process Details ............................................................................................................... 2�2.2� Facility Description .................................................................................................................. 3�2.3� Operating Conditions ............................................................................................................... 7�
3.� PRELIMINARY TEST—SHORT STACKS ..................................................................................... 8�
4.� INITIAL 4 KW TEST ...................................................................................................................... 10�
5.� SECOND 4 kW TEST ...................................................................................................................... 14�
6.� REFERENCES ................................................................................................................................. 18�
FIGURESFigure 1. 4 kW HTSE apparatus P&ID. ........................................................................................................ 2�
Figure 2. 4 kW test stand. ............................................................................................................................. 4�
Figure 3. Base manifold plate and coiled tubing, (a) top, (b) bottom. .......................................................... 4�
Figure 4. Color-coded rendering of base manifold plate showing the inlet and outlet gas flow lines and seal-welded flow channels. .................................................................................................... 5�
Figure 5. MSRI stack; (a) exploded view, (b) short stack installed on test fixture. ...................................... 6�
Figure 6. Steam generator for 4 kW test. ...................................................................................................... 6�
Figure 7. Two ten-cell stacks installed in 4 kW test fixture, ready for preliminary test. .............................. 8�
Figure 8. Initial sweep from preliminary test with two 10-cell stacks. ......................................................... 9�
Figure 9. Stack voltage versus time over 100 hours of operation from preliminary test. ............................. 9�
Figure 10. Two 60-cell stacks installed in 4 kW test stand. ........................................................................ 10�
Figure 11. Initial DC polarization sweeps showing stack voltages............................................................. 11�
Figure 12. Initial DC polarization sweep showing intermediate voltages. ................................................. 12�

xii
Figure 13. Intermediate voltages during long-term test on Stack 1. ........................................................... 12�
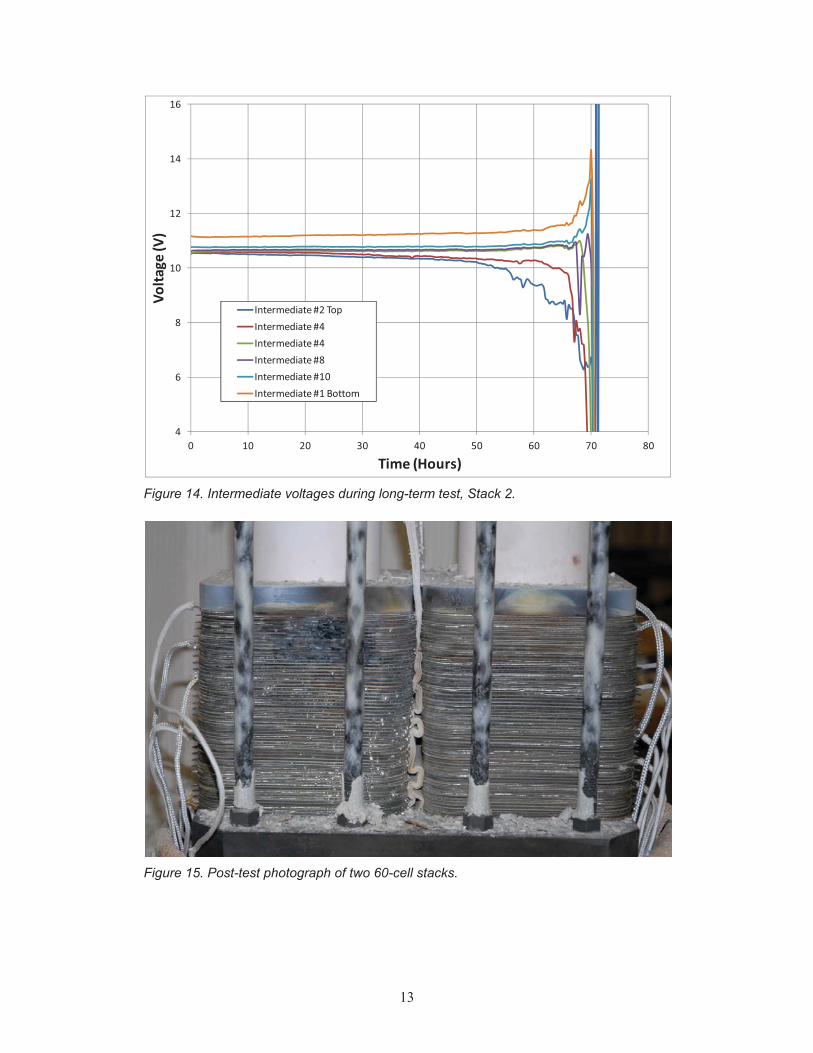
Figure 14. Intermediate voltages during long-term test, Stack 2. ............................................................... 13�
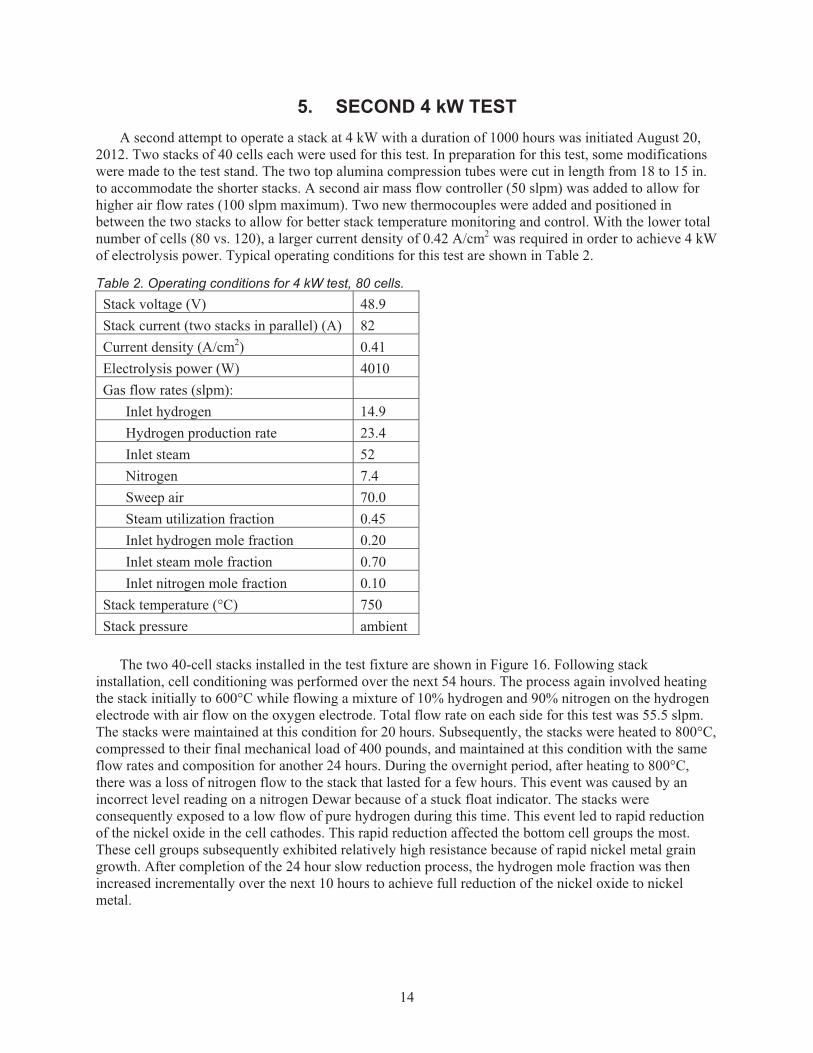
Figure 15. Post-test photograph of two 60-cell stacks. ............................................................................... 13�
Figure 16. 80-cell (2 × 40 cells) stack installation. ..................................................................................... 15�
Figure 17. Initial Vi sweep of Stack 1. ....................................................................................................... 16�
Figure 18. Initial Vi sweep of Stack 2. ....................................................................................................... 16�
Figure 19. Initial performance of two 40-cell stacks operating in parallel. ................................................ 17�
Figure 20. Long-term test results through 920 hours of test time. .............................................................. 17�
TABLES
Table 1. Operating Conditions for 4 kW test (120 cells). ............................................................................. 7�
Table 2. Operating conditions for 4 kW test, 80 cells. ................................................................................ 14�

xiii
ACRONYMSASR area-specific resistance
DC direct current
HTE high-temperature electrolysis
HTSE high-temperature steam electrolysis
INL Idaho National Laboratory
P&ID piping and instrumentation diagram
MSRI Materials and Systems Research, Inc.
SOEC solid oxide electrolysis cells
TC thermocouple
NOMENCLATUREF Faraday number, coulombs/mol or J/V mol
�GR Gibbs energy of reaction, J/mol
i current density, A/cm2
P pressure
Ru universal gas constant, J/V K mol
T temperature, K
V voltage, V
VN Nernst potential, V
y mole fraction
UNITSA amperes
cm centimeters
cm2 square centimeters
°C degrees Celsius
in inch
kg kilograms
MPa MegaPascals
slpm standard liters per minute
V volts
W watts
� Ohm

xiv

1
High Temperature Electrolysis 4 kW Experiment Design, Operation, and Results
1. INTRODUCTION Interest in the development of large-scale nonfossil hydrogen production technologies is increasing.
This interest is being driven by the (a) immediate demand for hydrogen for refining increasingly lower-quality petroleum resources, (b) expected intermediate-term demand for carbon-neutral synthetic fuels, and (c) potential long-term demand for hydrogen as an environmentally benign direct transportation fuel.1 At present, worldwide hydrogen production is based primarily on steam reforming of methane. From a long-term perspective, methane reforming is not a viable process for large-scale production of hydrogen since natural gas is a nonrenewable resource that exhibits large volatility in price, and methane reforming and other fossil-fuel conversion processes emit large quantities of greenhouse gases to the environment. Nonfossil, carbon-free options for hydrogen production include conventional water electrolysis coupled to either renewable energy sources such as wind or to nuclear energy. The renewable-hydrogen option may be viable as a supplementary source, but would be very expensive as a large-scale stand-alone option.2 Conventional electrolysis coupled to nuclear base-load power can approach economical viability when combined with off-peak power, but the capital cost is high.3 Higher overall hydrogen production efficiencies can be achieved using high-temperature electrolysis (HTE).4 The required high temperature process heat can be based on concentrated solar energy5 or nuclear energy from advanced high-temperature reactors.6
Performance characterization and durability testing with cells and stacks provided by Materials and Systems Research Inc. (MSRI) of Salt Lake City, UT were documented by O’Brien et al.7 Initial stack performance characterization was determined through a series of direct current (DC) potential sweeps in both fuel cell and electrolysis modes of operation. Results of these sweeps indicated very good initial performance, with stack-average area-specific resistance values less than 0.5 �.cm2. Long-term durability testing was performed with a test duration of 1000 hours. Overall performance degradation was less than 3% over the 1000-hour period. Final stack performance characterization was again determined by a series of DC potential sweeps at the same flow conditions as the initial sweeps in both electrolysis and fuel cell modes of operation. A final sweep in the fuel cell mode indicated a power density of 0.356 W/cm2, with average per-cell voltage of 0.71 V at a current of 50 A.
A 15 kW high-temperature electrolysis test was completed at Idaho National Laboratory (INL) in 2009.8 The HTE integrated laboratory-scale (ILS) experiment included three modules, each with four stacks of 60 cells per stack, for a total of 720 cells. The cells were electrolyte-supported and the stacks were externally manifolded. Peak hydrogen production with this facility was 5700 NL/hr. The 15 kW test was operated for 1080 hours, but significant performance degradation was observed. In 2010 and 2011, HTE research at INL focused on reducing performance degradation. The cells and stacks selected for the 4 kW test discussed in this paper have shown significantly better initial and long-term performance than those used in the ILS experiment.
This paper provides a description and status update on a new high-temperature steam electrolysis (HTSE) multi-kW test facility recently developed at INL. Detailed descriptions of the piping layout, steam generation and delivery system, test fixture, heat recuperation system, hot zone, instrumentation, and operating conditions are addressed. This facility provided a demonstration of HTSE operation at the 4 kW scale with advanced cell and stack technology. Successful demonstration of HTSE operation at the 4 kW scale will help to advance the technology toward near-term commercialization.
2
2. 4 kW TEST FACILITY
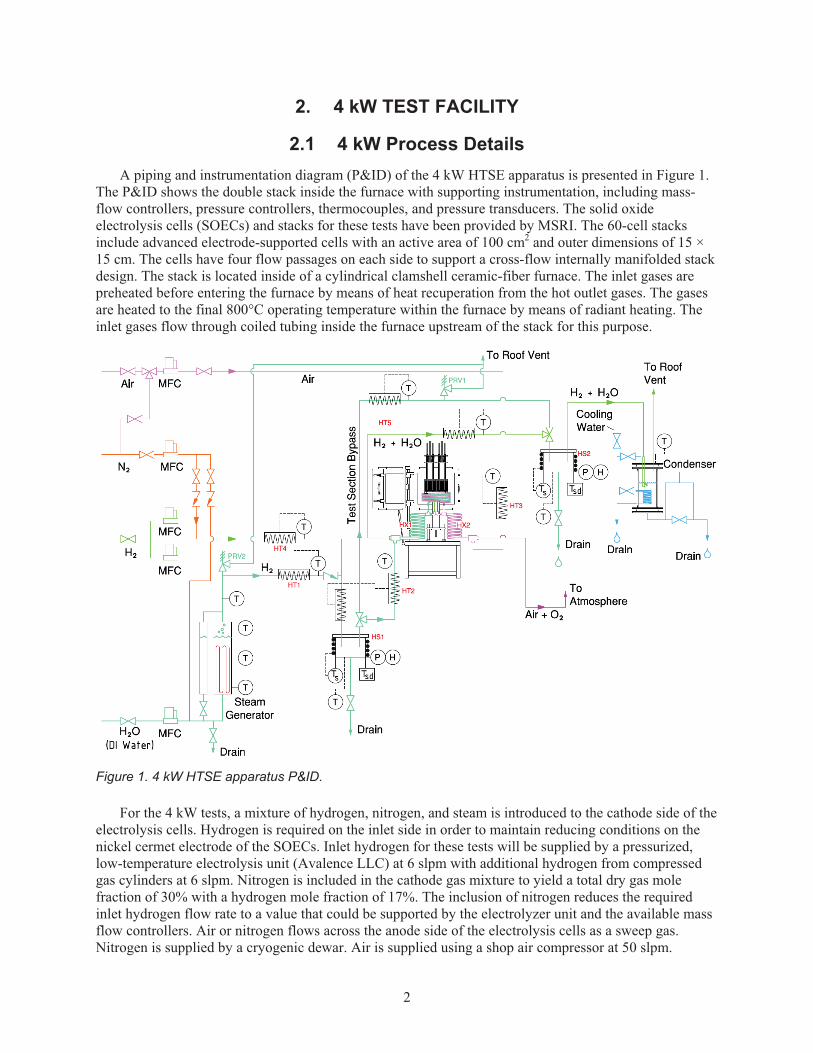
2.1 4 kW Process Details A piping and instrumentation diagram (P&ID) of the 4 kW HTSE apparatus is presented in Figure 1.
The P&ID shows the double stack inside the furnace with supporting instrumentation, including mass-flow controllers, pressure controllers, thermocouples, and pressure transducers. The solid oxide electrolysis cells (SOECs) and stacks for these tests have been provided by MSRI. The 60-cell stacks include advanced electrode-supported cells with an active area of 100 cm2 and outer dimensions of 15 × 15 cm. The cells have four flow passages on each side to support a cross-flow internally manifolded stack design. The stack is located inside of a cylindrical clamshell ceramic-fiber furnace. The inlet gases are preheated before entering the furnace by means of heat recuperation from the hot outlet gases. The gases are heated to the final 800°C operating temperature within the furnace by means of radiant heating. The inlet gases flow through coiled tubing inside the furnace upstream of the stack for this purpose.
Figure 1. 4 kW HTSE apparatus P&ID.
For the 4 kW tests, a mixture of hydrogen, nitrogen, and steam is introduced to the cathode side of the electrolysis cells. Hydrogen is required on the inlet side in order to maintain reducing conditions on the nickel cermet electrode of the SOECs. Inlet hydrogen for these tests will be supplied by a pressurized, low-temperature electrolysis unit (Avalence LLC) at 6 slpm with additional hydrogen from compressed gas cylinders at 6 slpm. Nitrogen is included in the cathode gas mixture to yield a total dry gas mole fraction of 30% with a hydrogen mole fraction of 17%. The inclusion of nitrogen reduces the required inlet hydrogen flow rate to a value that could be supported by the electrolyzer unit and the available mass flow controllers. Air or nitrogen flows across the anode side of the electrolysis cells as a sweep gas. Nitrogen is supplied by a cryogenic dewar. Air is supplied using a shop air compressor at 50 slpm.

3
Steam is provided by an electrically heated steam generator. The steam generator includes two independently heated zones. The lower boiling zone is controlled at constant power, with the power value depending on the required steam production rate. The rate of steam production for these tests yields an inlet steam mole fraction of 70%. The upper zone is feedback-controlled on temperature in the single-phase steam region above the liquid. The two-zone strategy allows for steady steam production with a desired amount of superheat. The gas flow lines downstream of the steam generator are heat-traced to avoid condensation. The outlet gas flow mixture flows through a water-cooled condenser, where the majority of the residual steam is condensed, and then to the roof vent.
Stack power is provided by a 10 kW DC power supply rated at 100 V and 100 A. Nominal power consumption during operation is 4.2 kW at 30 A and 70 V. The stacks are instrumented with intermediate voltage taps on every five cells.
The hydrogen/nitrogen inlet gas flow is mixed with steam downstream of the steam generator. After mixing, the dew point temperature of the resulting steam/hydrogen/nitrogen mixture is measured using a precision dew point sensor. Another dew point sensor is located downstream of the SOEC stacks. The two dew point measurements provide an independent direct measurement of the steam consumption rate in the SOEC stacks, which is equal to the hydrogen production rate on a molar basis.
2.2 Facility Description The completed 4 kW test stand is shown in Figure 2; a rendering of the 3-D Cad design is shown in
Figure 2(a) and a photograph of the completed assembled test stand is shown in Figure 2(b). At the heart of the test stand is a vertically mounted split-tube furnace (16 in. inside diameter by 21 in. high) that provides convenient access to the electrolysis test articles during maintenance and changeout of test articles without physically removing the furnace. The furnace has an electrical power rating up to 15 kW and can be operated at temperatures up to 1000ºC.
The rendering in Figure 2(a) is labeled to show the top current collector rods, springs for stack compression, alumina load transfer tubes, furnace, 60-cell SOEC stacks, base manifold plate, and recuperative heat exchangers. The stacks are shown in their uncompressed state. After heatup and final compression, the height of the stacks is significantly reduced.
The test fixture is based on a design developed at MSRI. The compression apparatus is capable of providing compressive force to the top of a stack during testing via compression springs located outside the hot zone of the furnace. A total compression load of 181 kg (400 lb) per stack is used. The compression load is transferred to the stack via an alumina load transfer tube and the upper electrode plates as shown in Figure 2. Once the stack is in place on the test fixture, alumina load transfer tubes are installed on top of the upper electrodes, onto which compression springs with pusher plates are placed. Compression of the stack to the desired loading is achieved by tightening nuts on the four threaded bars that stand in parallel to each load transfer tube and fixed to the lower test fixture portion running through the pusher plates. Upon achieving the desired initial compression of the springs and hence, forced loading of the stack, the furnace may be closed and a heatup procedure executed. During heatup, spring compression is monitored and carefully adjusted to maintain the prescribed load and compensate for thermal expansion of the threaded rods and compression of the compliant seals in the stack.
4
(a) (b) Figure 2. 4 kW test stand.
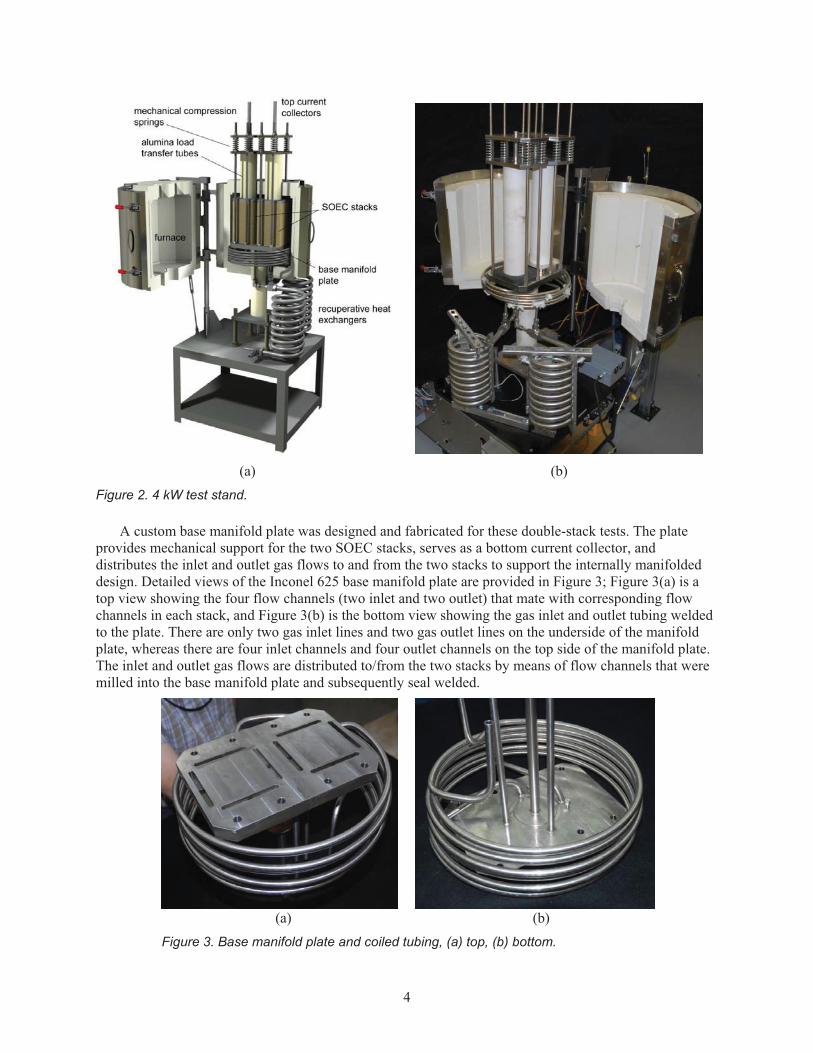
A custom base manifold plate was designed and fabricated for these double-stack tests. The plate provides mechanical support for the two SOEC stacks, serves as a bottom current collector, and distributes the inlet and outlet gas flows to and from the two stacks to support the internally manifolded design. Detailed views of the Inconel 625 base manifold plate are provided in Figure 3; Figure 3(a) is a top view showing the four flow channels (two inlet and two outlet) that mate with corresponding flow channels in each stack, and Figure 3(b) is the bottom view showing the gas inlet and outlet tubing welded to the plate. There are only two gas inlet lines and two gas outlet lines on the underside of the manifold plate, whereas there are four inlet channels and four outlet channels on the top side of the manifold plate. The inlet and outlet gas flows are distributed to/from the two stacks by means of flow channels that were milled into the base manifold plate and subsequently seal welded.
(a) (b)
Figure 3. Base manifold plate and coiled tubing, (a) top, (b) bottom.

5
Figure 4 shows a color-coded diagram of the inlet and outlet gas flows and the locations of the seal-welded flow channels. The steam/hydrogen and air sweep gas inlet lines are fed from the coiled tubing, which provides sufficient length for heat transfer from the furnace to the gases to ensure that the gas temperatures reach the desired stack operating temperature of 800°C prior to entering the stack. The outlet gas lines are not coiled.
Figure 4. Color-coded rendering of base manifold plate showing the inlet and outlet gas flow lines and seal-welded flow channels.
An exploded view of an MSRI SOEC stack is provided in Figure 5(a). The cells incorporate semi-elliptical cut-out gas flow channels (four per side) around the outer periphery of the cells that mate with corresponding holes in the interconnect plates and compliant seals. The stack is internally manifolded with compliant seals. Treated metallic interconnects with integral flow channels separate the cells and electrode gases. The stack operates in cross-flow, with an inverted-U shaped overall flow pattern such that the gas flow inlets and outlets are all located underneath the stack. Stack mechanical compression is accomplished by means of the custom spring-loaded test fixture described previously. The compliant seals are oriented at each level in the stack to allow for gas flow along either the anode or the cathode side of the cells. A photograph of a single short stack installed on a single-width base plate is presented in Figure 5(b).
The SOECs used for this study have a square profile with outer dimensions of 15.2 × 15.2 cm and a cell active area of 100 cm2. The cells incorporate a negative-electrode-supported multilayer design with nickel-zirconia cermet negative electrodes, thin-film yttria-stabilized zirconia electrolytes, and multilayer lanthanum ferrite-based positive electrodes. The nickel zirconia electrode has a support layer thickness of 700 μm and a graded functional layer with an overall thickness of 15 μm. The electrolyte thickness is 8-10 μm. The positive electrode has a graded functional layer with a thickness of 20 μm and a current collecting layer thickness of 50 μm.
Installation of MSRI stacks within the test section is a relatively simple procedure. Correct alignment of the process gas (steam/H2) and air inlets and outlets of the stack to the corresponding flow channels of the test section is most critical. Compliant gasket seals are placed underneath and atop of the stack prior to placement on the test fixture lower electrode/gas distribution plate. Contact aids are used to assist electrical contact between the stack and the upper and lower fixture electrodes.

6
(a) (b)
Figure 5. MSRI stack; (a) exploded view, (b) short stack installed on test fixture.
For the 4 kW tests, the inlet steam flow rate will be relatively large (~50 slpm). The custom steam generator shown in Figure 6 is used to supply steam at this flow rate. It consists of a heated vertical tube with two independently heated sections—a lower constant-power boiler section and an upper constant-temperature superheater section. The boiler portion vaporizes the water while the smaller superheater section heats the saturated steam from the boiler to a temperature of about 150°C. It was fabricated by attaching a combination of twenty 200 and 300-watt clamp on electric heaters to the outside of a 1-in. diameter stainless-steel tube. The heaters are covered with 2-in. of thermal insulation then topped by an outer aluminum covering. The heaters are spaced such that a higher heat flux is obtained in the boiling region with lower heat flux in the single-phase regions. The tube interior is filled with a copper foam material that reduces the flow perturbations and increases temperature uniformity in the boiling region. Three thermocouples are mounted to the outside wall of the boiler/superheater assembly. The superheater outlet temperature is feedback-controlled based on the desired superheater outlet temperature. Input power to the boiler section is set via computer and is not feedback controlled. The required boiler power is calculated via the data acquisition software based on the inlet water flow rate and temperature.
Figure 6. Steam generator for 4 kW test.

7
2.3 Operating Conditions Typical operating conditions for the 4 kW tests are listed in Table 1. At the nominal operating
conditions, the hydrogen production rate is 25 slpm or 1500 L/hr. This production rate is determined from the measurement of the electrical current supplied to the electrolysis cells using Faraday’s law and is also independently verified based on the change in dew point value between the inlet and outlet dew point sensors. The voltage and current across the electrolysis cell(s) is continuously monitored. Typical per-cell operating voltage will be 1.12 V.
Table 1. Operating Conditions for 4 kW test (120 cells). Stack voltage (V) 67.4 Stack current (two stacks in parallel) (A) 60 Current density (A/cm2) 0.30 Electrolysis power (W) 4046 Gas flow rates (slpm):
Inlet hydrogen 12.2 Hydrogen production rate 25.0 Inlet steam 50.2 Nitrogen 9.4 Sweep air 50.0 Steam utilization fraction 0.5 Inlet hydrogen mole fraction 0.17 Inlet steam mole fraction 0.70 Inlet nitrogen mole fraction 0.13
Stack temperature (°C) 800 Stack pressure ambient
A gas-monitoring system is used to notify laboratory occupants of the presence of any potentially
hazard gases. This system monitors the following gasses: CO, CO2, H2, and O2. The Drager Co., a recognized leader since 1889 in the field of safe industrial breathing environments, specified the gas monitoring system for Bay 9 (Draegergard CCS 3000, 16-channel controller with Polytron sensing heads) at the Bonneville County Technology Center. The system monitors the four gases in two locations. The system has relay outputs, a display readout, and visual and audible alarms. Maintenance and calibration of this system is performed in accordance with INL PLN-2896, “BCTC Bay 9 Gas Monitoring System Maintenance Plan.”
The exhaust gas streams are directly vented outside the building at the rooftop level by means of plastic tubing run through the entire length of a large-diameter PVC exhaust vent. The exhaust vent serves as a conduit that houses several smaller plastic exhaust tubes. This arrangement ensures that all exhaust gases are released outside the building and prevent the possibility of off-gas build up inside the exhaust vent should the draft inside the vent be insufficient to remove the off-gases.
8
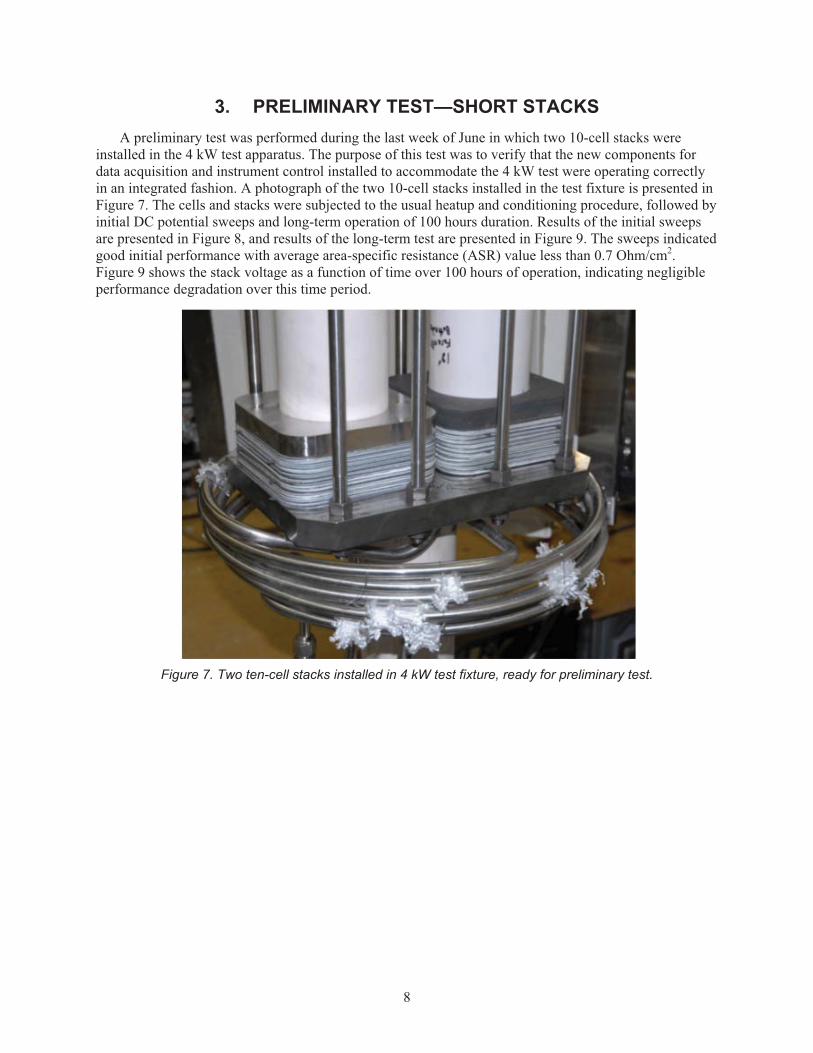
3. PRELIMINARY TEST—SHORT STACKS A preliminary test was performed during the last week of June in which two 10-cell stacks were
installed in the 4 kW test apparatus. The purpose of this test was to verify that the new components for data acquisition and instrument control installed to accommodate the 4 kW test were operating correctly in an integrated fashion. A photograph of the two 10-cell stacks installed in the test fixture is presented in Figure 7. The cells and stacks were subjected to the usual heatup and conditioning procedure, followed by initial DC potential sweeps and long-term operation of 100 hours duration. Results of the initial sweeps are presented in Figure 8, and results of the long-term test are presented in Figure 9. The sweeps indicated good initial performance with average area-specific resistance (ASR) value less than 0.7 Ohm/cm2. Figure 9 shows the stack voltage as a function of time over 100 hours of operation, indicating negligible performance degradation over this time period.
Figure 7. Two ten-cell stacks installed in 4 kW test fixture, ready for preliminary test.

9
Figure 8. Initial sweep from preliminary test with two 10-cell stacks.
Figure 9. Stack voltage versus time over 100 hours of operation from preliminary test.
0
0.2
0.4
0.6
0.8
1
1.2
6
7
8
9
10
11
12
0 0.1 0.2 0.3 0.4 0.5
ASR
�(�.cm2)
Stack�Vo
ltage�(V)
Current�Density�(A/cm2)
Stack�Voltage
ASR
6
7
8
9
10
11
12
0 20 40 60 80 100
Stack�Vo
ltage�(V)
Time�(Hours)

10
4. INITIAL 4 KW TEST Two 60-cell stacks were installed in parallel in the 4 kW test facility on July 9, 2012. Photographs of
the installation are presented in Figure 10; Figure 10(a) shows the stacks and the mechanical compression apparatus and Figure 10(b) shows the intermediate voltage taps included for each group of 10 cells. Cell conditioning was performed over the next 48 hours, which involves heating the stack initially to 600°C while flowing a mixture of 10% hydrogen and 90% nitrogen on the hydrogen electrode with air flow on the oxygen electrode. Total flow rate on each side was 50 slpm. The stacks were maintained at this condition overnight. Subsequently, the stacks were heated to 800°C, compressed to their final mechanical load of 400 pounds, and maintained at this condition with the same flow rates and composition for another 12 hours. The hydrogen mole fraction was then increased incrementally to achieve full reduction of the nickel oxide to nickel metal.
(a) (b)
Figure 10. Two 60-cell stacks installed in 4 kW test stand.
Initial performance characterization was achieved by DC potential sweeps. Results of two sweeps are presented in Figure 11. Sweep 1 was performed over a range of current from 0 to 80 A (40 A per stack) with a total stack flow rate of 80 slpm, 70% steam, 15% N2, and 15% H2. At 80 A, the total electrolysis power was 5.4 kW. The average ASR value for Sweep 1 was 0.67 �/cm2. The response of the intermediate cell groups for Sweep 1 is shown in Figure 12. Intermediate cell Groups 1 and 2 represent the cells that were located at the top of the two stacks, while intermediate cell Groups 11 and 12 represent the cells that were located at the bottom of the two stacks. These lowest cell groups had the highest open-cell voltages (at zero current) and higher voltage values throughout the sweeps. The higher voltages observed in these cell groups are likely related to slightly higher flow rates in these bottom cells compared to the cell groups located higher in the stack. This nonuniform flow distribution may have contributed to the stack failure that was experienced during long-term operation.

11
Figure 11. Initial DC polarization sweeps showing stack voltages.
The stack flow rate for Sweep 2 was set at the condition designated for long-term testing, 71.8 slpm, with the same gas composition as Sweep 1. The maximum current for Sweep 2 was 60 A (30 A per stack, 0.3 A/cm2 current density), which was the total current used for long-term test at 4 kW of electrolysis power. The overall stack voltage versus current for Sweep 2, shown in Figure 11 is similar to the result for Sweep 1, and virtually identical at current values above 50 A. The average ASR for Sweep 2 was 0.74 �/cm2.
Results of long-term testing with the two 60-cell stacks are presented in Figures 13 and 14. The goal for this test was to maintain long-term operation for 1000 hours. A time history of intermediate voltages is presented in Figure 13 for Stack 1 and in Figure 14 for Stack 2. Unfortunately, the two stacks suffered a catastrophic failure at ~70 hours as indicated by the large voltages fluctuations seen in Figures 13 and 14 around that time. The failure started near the top of Stack 2 and was characterized by overheating in that region. This localized failure led to a cascade effect that caused short circuiting and overheating throughout both stacks. The root cause of the failure is thought to be nonuniform flow distribution and/or incomplete cell reduction. The first indication of a problem is seen in Stack 2, Figure 14, cell Groups 2 and 4 (top cell groups), which indicated decreasing voltage values as early as 30 hours into the test. Ordinary long-term degradation should be manifested by increasing cell and stack voltages over time, so the decreasing voltages represented off-normal behavior. A post-test photograph of the two stacks is shown in Figure 15. The overheating in the top portion of Stack 2 is quite evident. A silver mesh is used as an electrical contact aid between cells in these stacks. Some of the silver melted out of Stack 2, causing shorting of the stack after the initial overheating. Beads of silver can be seen in the lower right portion of Stack 2, another indication of overheating. Because of stack failure, the test was terminated at ~70 hours.
20
30
40
50
60
70
80
0 10 20 30 40 50 60 70 80 90
Stack�Vo
ltage,�V
Total�current,�Amps
Tf =�800�C,�15%�H2,�15%�N2,�70%�steamsweep�1:�80�slpm�total�flow�rate,�UH2Omax =�60%sweep�2:�71.8�slpm�total�flow�rate,�UH2Omax =�50%
Sweep�1
Sweep�2
Maximum�power�:�5.4�kW
sweep�1�ASR =�0.67�Ohm�cm2
sweep�2�ASR�=�0.74�Ohm�cm2

12
Figure 12. Initial DC polarization sweep showing intermediate voltages.
Figure 13. Intermediate voltages during long-term test on Stack 1.
5
6
7
8
9
10
11
12
13
0 0.05 0.1 0.15 0.2 0.25 0.3 0.35 0.4 0.45
Voltage
Current�density,�A/cm2
Tf =�800�C,�imax =�0.4�A/cm2,�UH2Omax =�60%15%�H2,�15%�N2,�70%�steam
V�intermediate�1
V�intermediate�2
V�intermediate�3
V�intermediate�4
V�intermediate�5
V�intermediate�6
V�intermediate�7
V�intermediate�8
V�intermediate�9
V�intermediate�10
V�intermediate�11
V�intermediate�12
4
5
6
7
8
9
10
11
12
0 10 20 30 40 50 60 70 80
Voltage�(V)
Time�(Hours)
Intermediate�#1�Top
Intermediate�#3
Intermediate�#5
Intermediate�#7
Intermediate�#9
Intermediate�#11�Bottom
13
Figure 14. Intermediate voltages during long-term test, Stack 2.
Figure 15. Post-test photograph of two 60-cell stacks.
4
6
8
10
12
14
16
0 10 20 30 40 50 60 70 80
Voltage�(V)
Time�(Hours)
Intermediate�#2�Top
Intermediate�#4
Intermediate�#4
Intermediate�#8
Intermediate�#10
Intermediate�#1�Bottom
14
5. SECOND 4 kW TEST A second attempt to operate a stack at 4 kW with a duration of 1000 hours was initiated August 20,
2012. Two stacks of 40 cells each were used for this test. In preparation for this test, some modifications were made to the test stand. The two top alumina compression tubes were cut in length from 18 to 15 in. to accommodate the shorter stacks. A second air mass flow controller (50 slpm) was added to allow for higher air flow rates (100 slpm maximum). Two new thermocouples were added and positioned in between the two stacks to allow for better stack temperature monitoring and control. With the lower total number of cells (80 vs. 120), a larger current density of 0.42 A/cm2 was required in order to achieve 4 kW of electrolysis power. Typical operating conditions for this test are shown in Table 2.
Table 2. Operating conditions for 4 kW test, 80 cells. Stack voltage (V) 48.9 Stack current (two stacks in parallel) (A) 82 Current density (A/cm2) 0.41 Electrolysis power (W) 4010 Gas flow rates (slpm):
Inlet hydrogen 14.9 Hydrogen production rate 23.4 Inlet steam 52 Nitrogen 7.4 Sweep air 70.0 Steam utilization fraction 0.45 Inlet hydrogen mole fraction 0.20 Inlet steam mole fraction 0.70 Inlet nitrogen mole fraction 0.10
Stack temperature (°C) 750 Stack pressure ambient
The two 40-cell stacks installed in the test fixture are shown in Figure 16. Following stack
installation, cell conditioning was performed over the next 54 hours. The process again involved heating the stack initially to 600°C while flowing a mixture of 10% hydrogen and 90% nitrogen on the hydrogen electrode with air flow on the oxygen electrode. Total flow rate on each side for this test was 55.5 slpm. The stacks were maintained at this condition for 20 hours. Subsequently, the stacks were heated to 800°C, compressed to their final mechanical load of 400 pounds, and maintained at this condition with the same flow rates and composition for another 24 hours. During the overnight period, after heating to 800°C, there was a loss of nitrogen flow to the stack that lasted for a few hours. This event was caused by an incorrect level reading on a nitrogen Dewar because of a stuck float indicator. The stacks were consequently exposed to a low flow of pure hydrogen during this time. This event led to rapid reduction of the nickel oxide in the cell cathodes. This rapid reduction affected the bottom cell groups the most. These cell groups subsequently exhibited relatively high resistance because of rapid nickel metal grain growth. After completion of the 24 hour slow reduction process, the hydrogen mole fraction was then increased incrementally over the next 10 hours to achieve full reduction of the nickel oxide to nickel metal.

15
Figure 16. 80-cell (2 × 40 cells) stack installation.
Initial performance characterization was achieved by executing individual DC potential sweeps for each stack, plus an overall sweep for the two stacks operating in parallel. These sweeps were performed at a stack temperature of 780°C. Results of the individual stack sweeps are presented in Figures 17 and 18. The figures show the intermediate voltages of five cell groups with eight cells per group plus the overall stack ASR as a function of current density up to 0.4 A/cm2. Sweep results for Stack 1 are shown in Figure 17. The intermediate voltages for the three top cell groups exhibited very similar behavior. The highest voltages during the sweep were observed for the bottom two cell groups, probably because of the rapid reduction event described earlier. The initial overall ASR for Stack 1 was 0.86 �/cm2 at 0.42 A/cm2 current density. Sweep results for Stack 2 are shown in Figure 18. The intermediate voltages for the four top cell groups exhibited similar behavior. The highest voltages during the sweep were observed for the bottom cell group, again probably because of the rapid reduction event described earlier. Voltages for the bottom cell group in Stack 2 were by far the highest of all the cell groups. The initial overall ASR for Stack 2 was 1.15 �/cm2 at 0.42 A/cm2 current density.
Overall initial performance for the two stacks operating in parallel is shown in Figure 19, which includes stack voltage, ASR, and electrolysis power as a function of current density. The overall stack voltage increased nearly linearly with current density to a maximum value of 53.3 V at 0.42 A/cm2. The initial overall ASR value was 1.04 �/cm2 at 0.42 A/cm2 current density (84 A total current) with a total electrolysis power of 4.52 kW.
For long-term testing, the furnace temperature was reduced to 750°C in order to avoid the possibility of overheating of the stacks. Results of long-term testing through 9/30/12 are shown in Figure 20. The figure shows the time history of total current for the two stacks operating in parallel, the total electrolysis power, the stack voltage and the ASR value. The stacks were operated in parallel at constant current. The initial current was ramped up from 40 A to 60 to 82 A over the first day of long-term testing. At a current of 82 A, the total electrolysis power is just over 4 kW. The test duration target is 1000 hours at the 4 kW level. Figure 20 shows the results for the first 920 hours of operation (through 9/30/2012). Stack operation in the long-term mode was generally very stable, with no significant degradation in performance through 830 hours. The overall stack average ASR was 0.81 �/cm2, which is an excellent value in the stack configuration, especially considering that the operating temperature is only 750°C. The large fluctuations in the plotted values that began at 836 hours were related to a problem that developed with the deionized water delivery system. The pressure drop across the reverse osmosis (RO) device increased, resulting in a sudden loss of water flow delivery. The RO system was subsequently bypassed, but stable operation could not be fully restored.

16
Figure 17. Initial Vi sweep of Stack 1.
Figure 18. Initial Vi sweep of Stack 2.
0
0.2
0.4
0.6
0.8
1
1.2
1.4
0
2
4
6
8
10
12
14
16
0 0.1 0.2 0.3 0.4 0.5
Per�C
ell�A
SR�(�
.cm
2 )
Interm
ediate�Voltage�(V
)
Current�Density�(A/cm2)
Intermediate�#1�TopIntermediate�#3Intermediate�#5Intermediate�#7Intermediate�#9�BottomPer�Cell�ASR
0
0.5
1
1.5
2
0
2
4
6
8
10
12
14
16
0 0.1 0.2 0.3 0.4 0.5
Per�C
ell�A
SR�(�
.cm
2 )
Interm
ediate�Voltage�(V
)
Current�Density�(A/cm2)
Intermediate�#2�Top
Intermediate�#4
Intermediate�#6
Intermediate�#8
Intermediate�#10�Bottom
Per�Cell�ASR

17
Figure 19. Initial performance of two 40-cell stacks operating in parallel.
Figure 20. Long-term test results through 920 hours of test time.
0
0.5
1
1.5
2
2.5
3
3.5
4
4.5
5
0
10
20
30
40
50
60
0 0.1 0.2 0.3 0.4 0.5
Power�(KW)
Per�C
ell�A
SR�(�
.cm
2 )
Stack�Vo
ltage�(V
)
Current�Density�(A/cm2)
Stack�VoltagePer�Cell�ASRPower�
0
0.5
1
1.5
2
2.5
3
3.5
4
4.5
5
35
40
45
50
55
60
65
70
75
80
85
0 200 400 600 800 1000
Power�(kW)�o
r�ASR�(�
cm2 )
Stack�Vo
ltage�(V
)�or�C
urrent�(A
)
Time�(Hours)
Total�Current�(A)
Stack�Voltage�(V)
Power�(kW)
ASR�(� cm2)

18
6. REFERENCES 1. Forsberg, C. W., “The Hydrogen Economy is Coming. The Question is Where?” Chemical Eng.
Progress, December 2005, pp. 20–22.
2. Granovskii, M., Dincer, I., and Rosen, M. A., “Greenhouse gas emissions reduction by use of wind and solar energies for hydrogen and electricity production: economic factors,” Int. J. Hydrogen Energy, Vol. 32, 2007, pp. 927–931.
3. Floch, P-H., Gabriel, S., Mansilla, C., and Werkoff, F., “On the production of hydrogen via alkaline electrolysis during off-peak periods,” Int. J. Hydrogen Energy, Vol. 32, 2007, pp. 4641–4647.
4. O’Brien, J. E., “Thermodynamics and Transport Phenomena in High Temperature Steam Electrolysis Cells,” Journal of Heat Transfer, Vol. 134, March 2012, pp. 031017: 1–11.
5. Steinfeld, A. “Solar thermochemical production of hydrogen,” Solar Energy, Vol. 78, No 5, May 2005, pp. 603–615.
6. O’Brien, J. E., “Review of the Potential of Nuclear Hydrogen for Addressing Energy Security and Climate Change,” Nuclear Technology, Vol. 178, April 2012.
7. O’Brien, J. E., O’Brien, R. C., Zhang, X., Tao, G., and Butler, B. J., “Long-Term Performance of 5-Cell Solid Oxide Stacks with Electrode-Supported Cells Operating in the Steam Electrolysis Mode,” 2011 ASME International Congress and Exposition, Denver, Nov. 11-17, 2011, IMECE2011-62581,.
8. Stoots, C. M., Condie, K. G., Moore-McAteer, L., O’Brien, J. E., Housley, G. K., and Herring, J. S., Integrated Laboratory Scale Test Report, INL/EXT-09-15283, February 27, 2009.