high temperature, hydrogen separation temperature, hydrogen separation ... to january 2006 via...
TRANSCRIPT

1
& Development
High Temperature, Hydrogen Separation
A Carbon Capture Process Technology
Program Overview
February, 2011
For more information, please contact [email protected] or
303-530-0263

2
Technology Summary
In partnership with the Department of Energy (DOE), Eltron Research & Development Inc. has developed a process technology that separates hydrogen from a mixed gas feed stream. This technology has been developed to enable carbon capture in coal gasification facilities for power and chemicals production.
The two key advantages of Eltron’s dense metal membrane are that it is 10x cheaper than palladium membranes and has 10x better performance.
Membrane Figure 1 shows the general mechanism of Eltron’s hydrogen separation membrane. The membrane is a dense metal alloy with thin catalyst layers deposited on either side. A hydrogen dissociation catalyst is located on the high pressure feed side of the membrane. Once molecular hydrogen is dissociated, atomic hydrogen diffuses through the dense membrane. A hydrogen desorption catalyst is located on the low pressure, sweep side of the membrane. The differential pressure across the membrane creates the hydrogen partial pressure force necessary to drive hydrogen through the membrane. The permeate or sweep side of the membrane can be operated with or without a sweep gas to produce a mixed gas or pure hydrogen depending on the application. The retentate or feed side of the membrane maintains the remaining gases, primarily CO2, at high pressure conducive for transportation, storage or use for enhanced oil recovery (EOR). Eltron has developed hydrogen separation membranes for temperatures ranging from 250 up to 450oC and differential pressures up to 1000 psig.
Bulk Membrane
Syngas
H2
H
H
H2
Shifted Syngas (H
2 + CO
2 …)
H
High Pressure High Temp
H
� 3-Layers with dense metal bulk membrane
� First catalyst layer splits H2
to atomic H for passage through the membrane
� Second catalyst layer desorbs H2 into the permeate stream
� Optimized for flux, contaminant tolerance, mechanical strength
Hydrogen Desorption Catalyst Hydrogen Dissociation Catalyst
Figure 1. General schematic of Eltron's hydrogen separation membrane.

3
Process The target application for Eltron’s membrane is the separation of hydrogen and carbon dioxide from gasified coal. The process flow diagram depicted in Figure 2 is a standard Integrated Gasification Combined Cycle (IGCC) plant employing Eltron’s membrane for carbon capture. This process design:
� enables greater than 95% carbon capture, � retains CO2 at elevated pressure to reduce compression costs for transportation,
storage and EOR, � tolerates reasonably achievable levels of coal contaminants, � operates at water gas shift conditions for greater efficiency, economics and � delivers 99.99% pure H2 for use in fuel cells, gas turbines, hydrocarbon processing.
Figure 2. High Efficiency, IGCC Plant with Carbon Capture

4
Stage of Development
Eltron has spent almost ten years in the lab developing this technology. We’ve tested countless membrane compositions including ceramics, cermets and numerous metal alloys. We’ve down-selected the best materials for contaminant tolerance, lifetime and flux.
Pilot Project Eltron’s pilot testing program began in February of 2010 upon signing a joint development agreement with Eastman Chemical and receiving approximately $8 million from Eastman and The US Department of Energy. The pilot testing program includes two pilot scale tests. The first pilot test will be conducted in early 2011. The first pilot unit, pictured in Figure 3, will produce approximately 12lb/day of hydrogen from coal derived syngas from Eastman Chemical’s gasifier in Kingsport, TN.
The second pilot test will operate in 2012 and the unit will also process Eastman’s syngas but will produce over 200lb/day of hydrogen.
Figure 3. Eltron’s Pilot Unit 1A
Pre-Commercial Demonstration Project Starting in 2011, Eltron will accelerate and further the development and scale-up of our high temperature, hydrogen membrane process technology. This expanded program will enable Eltron to more rapidly complete pilot operations, scale-up membrane manufacturing and execute the test program involving the site selection, design, construction, and operations of a 5-10 ton/day Pre-Commercial Module (PCM). The system will separate hydrogen from gasified coal enabling energy efficient capture of carbon dioxide from industrial sources.
The proposed work will be split into three budget periods starting in Q1, FY2011 and continuing through Q3, FY2015 and will require approximately $78M total funding. Upon completion, Eltron will have a final economic analysis and the required data and documentation for a process technology licensing package for commercial implementation.
Figure 4. Rendering of Eltron’s
Pre-Commercial Module

5
Techno-Economic Analysis Hydrogen Transport Membrane in IGCC with CO2 Capture
Eltron’s hydrogen transport membrane (HTM) system is under development for separation of hydrogen from carbon dioxide in an Integrated Gasification Combined Cycle (IGCC) power plant designed for carbon capture and storage (CCS). Process performance and economics were evaluated for IGCC plants with carbon capture using HTM in comparison with conventional technology. For example, dual-stage Selexol process was the conventional technology evaluated for removal of hydrogen sulfide and carbon dioxide. Cases were evaluated using either the ConocoPhillips E-Gas gasifier or the GE gasifier, where a key difference between the gasifier types was higher operating pressure of the GE gasifier. Use of warm gas desulfurization/clean-up (WGCU) was also evaluated in combination with HTM for improved thermal efficiency and carbon capture in comparison with cold gas cleanup (CGCU) using an amine absorber.
Performance and economic measures from the cases evaluated, such as plant efficiency and net power production, are shown in Table 1.
Table 1: IGCC Plant Performance
Case 1 2 3 4 5 6
Gasifier Type
E-Gas GE Quench
E-Gas GE Radiant Convective
GE Radiant Convective
GE Quench
CO2 Capture Method
Selexol
Selexol
Eltron Membrane
Eltron Membrane
WGCU + Eltron Membrane
WGCU + Eltron Membrane
Coal Feed (tpd) 2942 3258 3217 3393 3526 3521 Gas Turbine Power (MW) 230 230 230 230 230 230 Net Power (MW) 242 239 278 291 318 298 HHV Efficiency, % 30.6 27.4 32.2 32 33.6 31.6 Cost of Electricity ($/MWh) 116.8 115.5 113.5 114.5 106 100.4 Plant Cost ($/kW) 2516 2434 2449 2482 2292 2112 CO2 Product rate (tpd) 5786 6485 6556 6700 7500 7437 CO2 Product purity (mol%) 97.1 94.9 95.3 95.2 95.9 96.3 % CO2 Captured 89.3 91.3 90.2 88.7 95.3 95.2
Best thermal efficiency, economics, CO2 production and percent carbon removal were achieved by combining Eltron’s membrane system with WGCU rather than an amine absorber for sulfur removal.

6
Background and Methodology of Techno-Economic Calculations
Detailed process simulations were developed to evaluate the performance of IGCC plants using conventional technology for the baseline cases, and comparison cases using the hydrogen transport membrane (HTM) for hydrogen/carbon dioxide separation.
The calculations to determine plant cost and performance indicators proceeded as follows:
1) Specify plant configuration and process flowsheet which includes - air separation - coal processing - coal gasification - syngas processing (impurity removal, water gas shift) - hydrogen/carbon dioxide separation - carbon dioxide purification, drying, and compression - power production with hydrogen rich stream in gas turbine - heat recovery, steam generation - power production with steam product
2) Process simulation to determine process stream properties and plant performance assuming 230 MW fixed power production in the gas turbine. Details include:
- Thermoflow’s GTPRO was used to model the gasification and power islands - Aspentech’s HYSYS was used to model syngas processing. - The models were iteratively converged to ensure consistency between GTPRO and
HYSYS outputs.
Other assumptions used in the process modeling were based on the FutureGen targets and are summarized below.
Table 2. Process Modeling Assumptions.* Plant Capacity 275 MW
Required Carbon Capture 90%
Required Sulfur Removal 99%
Required NOx Removal ≤ 0.05 lb/MMBTU NOx
Cost of Electricity DOE Financial Model v3.0
*FutureGen: Integrated Hydrogen, Electric Power Production and Carbon Sequestration Research Initiative, US DOE Office of Fossil Energy, March 2004
3) Determine sizing and cost of process equipment based on simulation results for the process stream properties
- The installed capital cost basis for most major plant components was Case 3E of EPRI’s “Updated Cost and Performance Estimates for Fossil Fuel Power Plants with CO2 Removal” [1]. These costs were scaled for differences in capacity and updated to January 2006 via application of the appropriate Chemical Engineering Plant cost

7
indices. For certain plant components, the EPRI estimates were supplemented with vendor quotes (e.g. PSA), internal information and/or Thermoflow’s PEACE cost estimation module outputs (e.g. power island).
- Installed costs include equipment, material, labor, and engineering fees at 6% of the bare erected cost. They exclude 25% total process and project contingency, which were added within DOE’s IGCC Financial Model.
4) Determine economic indicators in terms of normalized plant cost in $/kW and cost of electicity (COE). Levelized COE is the metric used to compare casework.
DOE’s IGCC Financial Model v3.0 was utilized to determine product costs, assuming $35/ton Illinois #6 coal and a 10% IRR. Other financial model assumptions include:
– 100% equity financing – 10% IRR – $35/ton Illinois #6 coal – 20 year plant life – 4 year construction period – No escalation or inflation – 15 year 150% declining balance depreciation – Working capital as 7% of 1st year revenues – 38% Federal and state taxes – Start-up at 2% of EPC – Development fees at 4% of EPC – 5% and 0.6% of EPC/year for fixed and variable O&M, respectively
Membrane performance and sizing
The membrane is modeled in a counter-current, tubular configuration, as shown below.
Clean, Shifted Syngas
N2 + H2
370 psia
HTM
JH2
N2
CO2-rich stream to sequestration
Clean shifted syngas with approximately 40 mol% H2 is fed to the membrane on the feed side, and N2 is used in power applications as a sweep gas on the other side of the membrane to improve performance. Hydrogen flux, JH2, at each location in the membrane depends on membrane permeance (permeability, K, divided by thickness, l) and the difference in square root of partial pressure of hydrogen as the driving force.

8
)2 2
H2
Par
tial
Pre
ssu
re (
psi
a)
J = K ( 1
2 − 1
2
H 2 l PH , Re t PH ,Perm
Membrane permeance has been determined in our laboratory testing under similar conditions of composition, temperature and pressure.
An example of membrane performance is shown below, where the retentate stream is the syngas feed side, and the permeate is the hydrogen product plus sweep nitrogen. Syngas feed enters on the left side of the graph at highest hydrogen partial pressure, which drops through the membrane, represented by increasing total membrane area. Sweep gas enters on the other end of the membrane with 0 hydrogen partial pressure, which increases as the sweep gas flows through the membrane and picks up permeating hydrogen.
250
Counte r-curre nt me mbrane Retentate
Perm eate
200
150
100
50
0
0 10000 20000 30000 40000 50000 60000 70000 80000 90000
Membrane Area (ft2)
Figure 5. Example Membrane Performance
Sizing calculations are performed by adjusting membrane area to produce desired hydrogen recovery of approximately 95% and roughly 50 mol% hydrogen in the permeate product at the given feed product pressure and hydrogen content. Permeate pressure is set by the hydrogen turbine inlet pressure specification.
Cases Evaluated
The basic configuration of the plants evaluated include coal gasification to produce synthesis gas (syngas) followed by gas cleaning and desulfurization at or near-gasifier pressure, water-gas shift reactors to produce additional hydrogen and CO2 in the syngas, then separation of hydrogen from CO2. The cases described are power-only cases, where the hydrogen product is burned in a gas turbine (230 MW GE 7251FB turbine) for power production, with additional steam turbine power produced through heat recovery and steam generation. Eltron has also studied additional cases of similar plants with co-

9
production of pure hydrogen and electricity using HTM in comparison with conventional technology. Conclusions are similar to those discussed here for the power-only cases. Details are available separately.
Using hydrogen membranes vs. Selexol was not the only change between the comparison plants. It was found that for the conventional technology, it was more economical to use the Selexol system for sulfur and CO2 removal downstream of the water-gas shift reactors. However, when using a hydrogen membrane for separation of hydrogen and CO2, sulfur removal (COS hydrolysis reactor followed by a lower-cost amine absorber) upstream of the water gas shift reactors improved CO2 capture efficiency.
Table 3 summarizes the configurations of the cases studied.
TABLE 3. Eltron IGCC with CO2 Capture Cases
Desulfurization Shift Water Gas Shift H2/ CO2
Case Gasifier Method Type H2O/CO Ratio Separation
1
E-Gas
Selexol
Sour
2.5
Selexol
2
GE quench
Selexol
Sour
2.4
Selexol
3
E-Gas
MDEA
Sweet
1.7
Eltron Membrane
4 GE radiant- convective
MDEA
Sweet
1.7
Eltron Membrane
5 GE radiant- convective
Warm Gas Cleaning (WGCU)
Sweet
1.7
Eltron Membrane
6
GE quench Warm Gas
Cleaning (WGCU)
Sour
2.4
Eltron Membrane
Figure 6 shows a simplified block flow diagram of the IGCC-CCS process scheme based on currently available technology for simulation case 1 with E-Gas gasifier and case 2 with GE gasifier (note: no extra steam is added to the syngas upstream of the water-gas shift reactors in the GE quench-cooled gasifier case). The figure also shows results of disposition of carbon through the process for case 1 with the E-Gas gasifier.

10
Figure 6. Flow diagram for pre-combustion power only case for CO2 capture with
current technology. Carbon disposition results are shown for Case 1 with the E-Gas
gasifier.
Eltron’s hydrogen transport membrane (HTM) technology for carbon capture in an IGCC plant separates hydrogen out of a high pressure water-gas shift feed stream, as shown in Figure 7. This configuration was used in case 3 with an E-Gas gasifier, and case 4 with a GE radiant-convection cooled gasifier. Carbon disposition fractions in Figure 7 are shown for case 3 with an E-Gas gasifier.
Figure 7. Flow diagram for pre-combustion power only case for CO2 capture with
Eltron membrane technology. Carbon disposition results are shown for Case 3 with
the E-Gas gasifier.

11
Gasifier
ASU
Gasifier Warm Gas
Cleaning/ SulfurRecovery
Water gas shift reactors
Syngas cooler or quench plus
scrubber
Gasifier
Compressor
Catalytic Combustor
Syngas cooler
H2 membrane separator
Any remaining CO and H2 remaining in the CO2-rich stream leaving the membrane are consumed in a high pressure catalytic combustor (CATOX) unit. Water is subsequently removed from the CO2 stream by condensation. Therefore, Eltron’s technology essentially takes a high pressure CO2/H2 stream and separates it into a high pressure CO2 stream for sequestration and a high pressure H2 stream for energy production. Figures 6 and 7 show that, in both cases, about 90% of the carbon is captured as targeted by DOE guidelines.
Figure 8 shows the flow diagram for integrating warm gas cleaning with Eltron’s membrane for carbon capture. Desulfurization performance is based on information from RTI International and Eastman Chemical Company1,2. Carbon distribution results shown are from case 5, which uses a GE gasifier with a radiant-convective cooler.
ASU
Water Heat/cool to 600 – 1000F
Air to regen
Steam
Oxygen Coal
Water
Gasifier Syngas cooler or quench plus
scrubber
Warm Gas Cleaning/ Sulfur
Recovery
Water gas shift reactors
Steam from cooler
Sulfur, ~4% of C
Compressor
Liquid CO2
to storage ~95% of C
Syngas cooler
Waste water 0.6% of C
Catalytic Combustor
Oxygen from ASU
H2 membrane separator
H2 plus sweep gas
0% of C
Figure 8. Flow diagram for pre-combustion power only case for CO2 capture with
warm gas desulfurization and Eltron membrane technology. Carbon disposition
results are shown for Case 5 with the GE gasifier.
1 B. Turk and J Schlather, “Field Testing of a Warm-Gas Desulfuriztion Process in a Pilot-Scale Transport Reactor System,” Gasification Technologies Conference 2006. 2 B. Turk and J Schlather, “Novel Technology Platform for Warm Syngas Cleanup: Progress from Field Testing with Coal Derived Syngas,” 2nd International Frieberg Conference on IGCC & XtL Technologies, 2007.
12
Results Efficiency Table 1 shows an increase in efficiency (HHV) moving from conventional CO2 capture method (Selexol) to use of Eltron’s hydrogen transport membrane (HTM), both for E-Gas and GE gasifier cases. Part of this increase is due to use of lower steam to carbon monoxide
ratio in the feed to the water gas shift reactors (Table 3). Additionally, a lower efficiency but
less expensive quench-cooled GE gasifier was used with the conventional CO2 separation method. However, a high efficiency radiant-convective cooled GE gasifier was used with the HTM cases 4 and 5 because of the sequence of putting desulfurization upstream of the water-gas shift reactors. Highest efficiency was found in HTM case 5 which replaces cold gas cleanup (CGCU) with warm gas desulfurization.
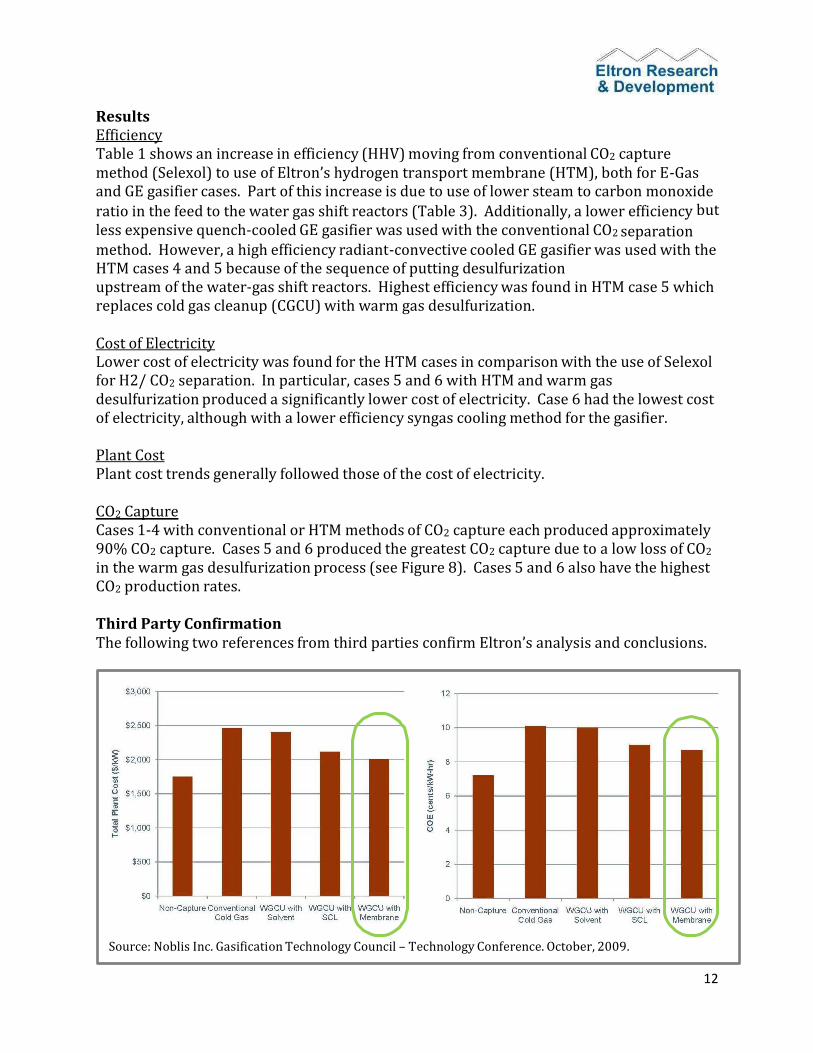
Cost of Electricity Lower cost of electricity was found for the HTM cases in comparison with the use of Selexol for H2/ CO2 separation. In particular, cases 5 and 6 with HTM and warm gas desulfurization produced a significantly lower cost of electricity. Case 6 had the lowest cost of electricity, although with a lower efficiency syngas cooling method for the gasifier.
Plant Cost Plant cost trends generally followed those of the cost of electricity.
CO2 Capture Cases 1-4 with conventional or HTM methods of CO2 capture each produced approximately 90% CO2 capture. Cases 5 and 6 produced the greatest CO2 capture due to a low loss of CO2
in the warm gas desulfurization process (see Figure 8). Cases 5 and 6 also have the highest CO2 production rates.
Third Party Confirmation The following two references from third parties confirm Eltron’s analysis and conclusions.
Source: Noblis Inc. Gasification Technology Council – Technology Conference. October, 2009.

13
Source: NETL, US DOE

14
Application Diversification
Eltron’s process technology that separates hydrogen from a mixed gas feed stream is being developed with a number of applications in mind such as dehydrogenation reactions, chemicals synthesis and power & hydrogen co-production.
The two key advantages of Eltron’s dense metal membrane are that it is 10x cheaper than palladium membranes and has 10x better performance.
Additional characteristics make it viable for a variety of process
applications. Such features include moderate temperature windows, wide
pressure windows and catalyst tolerances to poisons.
Eltron’s hydrogen membrane system can be utilized efficiently in a variety of industrial processes. These processes involve separation of hydrogen from feed streams produced from gasification, reforming, or petrochemical processes. Figure 2 shows a generalized flow diagram illustrating the concept for producing and separating H2 from carbon containing feed stocks. In configurations A, B, and C syngas is produced by gasification of fossil or biomass fuels or by steam reforming of natural gas. In configurations B and C additional hydrogen is produced by reacting syngas with steam in a water-gas shift reactor. This reaction produces a feed stream of hydrogen and carbon dioxide with smaller amounts of steam and residual carbon monoxide. Finally, in configuration D a hydrocarbon feed stock is produced during petrochemical processing.
Figure 2. Sources of hydrogen containing feed streams and use of Eltron’s membrane in various applications.

15
Eltron’s membrane technology can be used in each of these different configurations. For example, in configuration A, Eltron’s membrane separates hydrogen from CO in a syngas feed stream. Potential applications include hydrogen removal to improve CO conversion in a WGS reactor, or CO purification. Alternatively, in configuration B, the syngas could be fed to an integrated membrane water-gas shift reactor to produce additional hydrogen and CO2. Eltron’s membrane can be efficiently integrated with WGS catalyst for improved CO conversion by removing hydrogen as it is produced. In configuration C, Eltron’s membrane is placed after a WGS bed. Applications where a shifted feed stream is fed to the membrane include Integrated Gasification Combined Cycle-Carbon Capture & Storage (IGCC-CCS) power plants and synthesis of ammonia. Finally, in configuration D, Eltron’s membrane is integrated with an alkane dehydrogenation catalyst. Removal of hydrogen by the membrane during dehydrogenation of an alkane feed stream would allow efficient production of light olefins such as propylene.
This technology has been developed under partial funding from The Department of Energy.
The technologies described herein, and all related inventions are owned by Eltron, and protected by copyrights,
trademarks, issued and pending patents, trade secrets, or other applicable intellectual property rights.
Copyright © 2011 Eltron Research & Development Inc. All rights reserved.