high-throughput, high-resolution echelle deep-uv …asher/homepage/spec_pdf/high-throughput,...
TRANSCRIPT

High-Throughput, High-Resolution Echelle Deep-UV RamanSpectrometer
Sergei V. Bykov,a Bhavya Sharma,b Sanford A. Ashera,*a Department of Chemistry, University of Pittsburgh, Pittsburgh, PA 15260, USAb Department of Chemistry, Northwestern University, Evanston, IL 60208, USA
We constructed an ultrahigh-throughput, high-resolution ultraviolet (UV)
Raman spectrograph that utilizes a high-efficiency filter-stage monochro-
mator and a high-dispersion Echelle spectrograph. The spectrograph
utilizes a total of six mirrors and two gratings, with an overall efficiency at
229 nm of ;18%. The limiting resolution of our spectrometer is 0.6 cm�1
full width half-maximum (FWHM), as measured for 229 nm Rayleigh
scattering. Use of a 1 mm–wide entrance slit gives rise to an
approximately 10 cm�1 FWHM resolution at 229 nm. The ultrahigh
spectrograph throughput enables ultrahigh signal-to-noise ratio, deep UV
Raman spectra that allow us to monitor ,1% changes in peptide bond
composition. The throughput is measured to be 35-fold greater than
conventional deep UV Raman spectrometers.
Index Headings: UV Raman spectrometer; Echelle; High-throughput;
High-resolution; Biomolecules; Peptide; Protein.
INTRODUCTION
Ultraviolet (UV) resonance Raman spectroscopy is a highlyinformative technique for investigating the structure anddynamics of biological macromolecules and other complexsystems.1–7 The resonance Raman spectra are sensitive to verysmall changes in molecular bond lengths and bond angles,because these small changes significantly impact the ground-state vibrational frequencies as well as the coupling ofvibrations to the resonant electronic transition(s). Time-dependent measurements can be used to follow reactions suchas protein folding down into picosecond and nanosecond timeintervals.8–15 The resonance Raman spectra can have highspatial selectivity, because the excitation can be chosen to beresonant with particular absorption bands localized in specificregions of interest in the macromolecule.
UV resonance Raman spectra are generally signal-to-noise(S/N) limited due to the low excitation powers that can be used.High excitation powers can result in thermal or photochemicaldamage to samples. Furthermore, the higher peak powers oflow-duty cycle lasers can result in nonlinear optical phenomenathat complicate the measured spectra and confound spectralinterpretations.
Low-UV-resonance Raman spectral S/N also results fromthe generally low throughputs of existing deep UV Ramanspectrometers. To improve UV Raman S/N, we have built arevolutionary high-throughput, high-dispersion, high-resolu-tion UV Raman spectrograph that dramatically increases thespectral S/N and the information content of measured deep UVRaman spectra. We increased the spectrometer throughput by
increasing the spectrometer dispersion; this allows us to openthe spectrometer entrance slit.
Our spectrometer utilizes a 1 mm slit width that gives aspectral resolution bandwidth of ;10 cm�1, appropriate for229 nm UV Raman spectra of condensed-phase samples. Thisbandwidth is comparable to the homogeneous line widths ofRaman bands of biological macromolecules.16 The resultinghigh spectrometer throughput allows us to use short, 10 minspectral accumulation times to easily monitor small proteinsecondary-structure conformational changes that involve lessthan 1% of the protein peptide bonds. Thus, this spectrometerallows us to monitor conformational changes of a singlepeptide bond for a protein of 100 amino acids.
SPECTROMETER DESIGN
Figure 1 shows the optical diagram of the Echellespectrograph we constructed. The spectrograph utilizes twogratings; one regular grating is used in the filter stage, while theother, an Echelle grating, is used in the high-dispersionspectrograph stage. Raman and Rayleigh scattered light isfocused on the entrance slit S1 that is tilted by an angle n1 aboutthe optic axis X to compensate for the vertical tilt of the imagedue to the out-of-plane positioning of the diffraction gratings.The filter stage spectrograph optic axis lies in the XY plane,which contains the centers of entrance slit S1, mirrors M1, M2,and M3, and grating G1. Grating G1 is displaced by DX =�7.5cm from S1, while M2 is displaced by DX =�7.5 cm from M1.The distance between S1 and M1 is approximately 126 cm.
The light is collimated by M1 and directed to the holographicgrating G1 (1200 grooves/mm, purchased from RichardsonGratings, Inc.). The dispersed, collimated light is collected andfocused by mirror M2 and directed to the flat turning mirror M3
(all mirrors are UV enhanced, Al coated with MgF2) thatfocuses the light to slit S2 and transfers the diverging light toturning mirror M4 in the Echelle-based stage of thespectrometer. We define the Echelle spectrograph-stage planeof diffraction as the XZ plane perpendicular to the Echellegrating grooves. We define the spectrograph plane XY as thevertical plane perpendicular to the plane of diffraction XZ thatis horizontal. The middle slit S2 located between M3 and M4
blocks the Rayleigh scattered light and selects the spectralregion of interest (approximately 10 nm) to be dispersed by theEchelle grating. The middle slit is tilted by an angle n2 = n1þDn, where n1 is a tilt of the entrance slit S1, and Dn is theadditional tilt required by the out-of-plane configuration ofgrating G1. Mirrors M1 and M2 are not vertically above oneother, but M2 is displaced by DX = 7.5 cm to allow more spacebetween grating G1 and turning mirror M3.
Plane mirror M4 directs the diverging beam to collimatingmirror M5. The collimated beam is sent to the Echelle grating
Received 12 December 2012; accepted 28 March 2013* Author to whom correspondence should be sent. E-mail: [email protected]: 10.1366/12-06960
Volume 67, Number 8, 2013 APPLIED SPECTROSCOPY 8730003-7028/13/6708-0873/0
� 2013 Society for Applied Spectroscopy

G2 to be dispersed and directed to mirror M6, which focuses thedispersed light onto the charge-coupled device (CCD) detector.The out-of-plane angles of the filter spectrometer stage andEchelle spectrograph stages are /1 ’ /2 ’ 68.These out-of-plane angles are in the XY plane and occur between the incidentand X and the diffracted beam and X (Fig. 1).
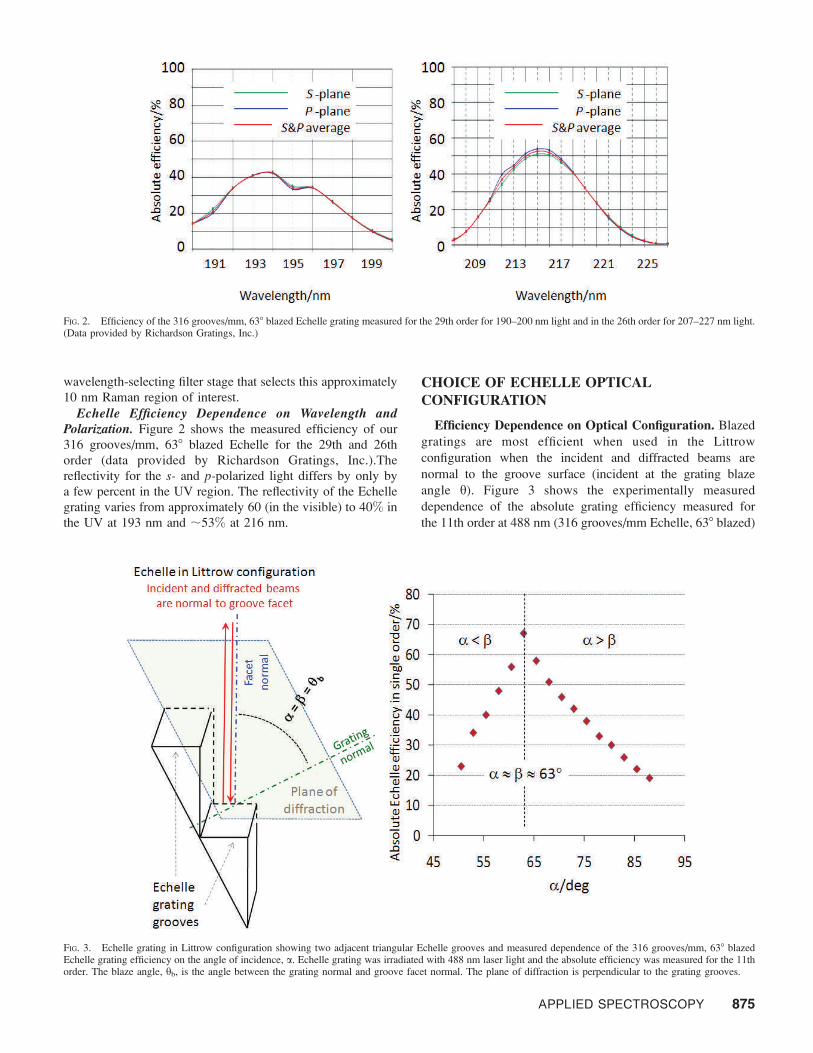
Choice of Dispersing Gratings. Echelle gratings have veryhigh dispersion and resolving power. High-quality Echellegratings demonstrate high reflectivity over a broad spectralrange, with only a weak dependence of reflectivity on thepolarization of the incident light. Echelle gratings have lowgroove densities (usually between 23 to 316 grooves/mm) andare blazed for operation at high orders at high-diffractionangles (usually between 32 and 798). After careful review andmultiple tests of commercially available Echelle gratings fromdifferent manufacturers, we chose a 316 grooves/mm, 638blazed, MgF2-protected, Al-coated Echelle grating manufac-tured by Richardson Gratings, Inc. This grating shows goodreflectivity in the UV region .190 nm, very little polarizationdependence of reflectivity (Fig. 2), and is commerciallyavailable in large sizes. Similar Echelle gratings from othermanufacturers showed lower efficiency. We found that themanufacturer quoted efficiency and the actual efficiencies wemeasured often dramatically differed.
The angular dispersion of a diffraction grating at wavelengthk is determined by the incidence (a) and diffraction (b) angles.If the Echelle grating is operated in the Littrow configurationwhere a = b = h (Fig. 3) the angular dispersion, Da is
Da ¼2 tan h
kð1Þ
Theoretically, an infinite dispersion can be obtained if happroaches 908. In practice, the use of high values of h is
limited due to the increasingly stronger contributions of groovedefects on dispersion and resolution, and the increasingcontribution of ghost aberration due to high blaze angles, aswell as the decreased effective width of the grating at high h.
We concluded that use of our Echelle grating that is blazedat h = 638 provides a close to optimal dispersion and resolutionfor a grating of reasonable width. This grating also enables awide enough free spectral range (FSR) and high resolvingpower, Rpw , for the Littrow case a = b = h:
Rpw ¼2W sin h
kð2Þ
For the 638 blazed perfect Echelle with a ruled width, W =206 mm at 229 nm in the Littrow configuration, the resolvingpower is calculated to be Rpw = 1.6 3 106. The effectiveexperimental resolving power can be less due to irregularity ingrating groove periodicity and surface optical defects. Theresolution of the spectrometer is determined by the spectro-graph entrance and exit slit widths (or the CCD detector pixelwidths), as well as spectrograph optical aberrations.
One of the disadvantages of low groove-density gratingssuch as the Echelle is their resulting limited free spectral range:
FSR ¼ kc
nð3Þ
where n is the diffraction order, and kc is central wavelength.
If our 638 blazed, 316 grooves/mm Echelle were used in theLittrow configuration and illuminated with the Stokes Ramanspectra excited at 229 nm, the diffracted intensity will beconcentrated near the 24th order, with an FSR ;10 nm. Toavoid spectral-order overlap, the spectrometer must include a
FIG. 1. Diagram of high-resolution, high-throughput spectrograph. X is parallel to the spectrometer optical axis; the XY plane is orthogonal to the spectrographdispersion plane XZ. S1 is the entrance slit that is tilted by angle n1 = 238about X to compensate for the tilt introduced by the out-of-plane diffraction gratings G1 andG2. M1, M2, M5, and M6 are off-axis parabolic mirrors. The on-axis focal lengths are fM1
¼ fM2¼ fM3
= 126.37 cm (49.75 in), fM4= 133.68 cm (52.63 in) and zonal
radii are ZRM1¼ ZRM2
¼ ZRM3= 11.43 cm (4.5 in), ZM4
= 19.05 cm (7.5 in). G1 is the filter-stage low stray light, 1200 grooves/mm blazed holographic grating,while G2 is a high-dispersion Echelle grating, 316 grooves/mm, blazed at 638. The middle slit S2 separates the filter and Echelle spectrograph stages. M3 and M4 areplane turning mirrors. /1 is the angle of the incident and diffracted light relative to X about G1. /2 is the angle between the incident and diffracted light about X aboutthe Echelle grating G2 of the dispersing spectrograph. Centers of the slit S1, grating G1, mirrors M1, M2, and M3 are in the same vertical plane XY. Centers of theCCD, grating G2, mirrors M4, M5, and M6 are in the same vertical plane, the X0Y0 main-dispersion spectrograph plane.
874 Volume 67, Number 8, 2013
wavelength-selecting filter stage that selects this approximately
10 nm Raman region of interest.
Echelle Efficiency Dependence on Wavelength andPolarization. Figure 2 shows the measured efficiency of our
316 grooves/mm, 638 blazed Echelle for the 29th and 26th
order (data provided by Richardson Gratings, Inc.).The
reflectivity for the s- and p-polarized light differs by only by
a few percent in the UV region. The reflectivity of the Echelle
grating varies from approximately 60 (in the visible) to 40% in
the UV at 193 nm and ;53% at 216 nm.
CHOICE OF ECHELLE OPTICALCONFIGURATION
Efficiency Dependence on Optical Configuration. Blazed
gratings are most efficient when used in the Littrow
configuration when the incident and diffracted beams are
normal to the groove surface (incident at the grating blaze
angle h). Figure 3 shows the experimentally measured
dependence of the absolute grating efficiency measured for
the 11th order at 488 nm (316 grooves/mm Echelle, 638 blazed)
FIG. 2. Efficiency of the 316 grooves/mm, 638 blazed Echelle grating measured for the 29th order for 190–200 nm light and in the 26th order for 207–227 nm light.(Data provided by Richardson Gratings, Inc.)
FIG. 3. Echelle grating in Littrow configuration showing two adjacent triangular Echelle grooves and measured dependence of the 316 grooves/mm, 638 blazedEchelle grating efficiency on the angle of incidence, a. Echelle grating was irradiated with 488 nm laser light and the absolute efficiency was measured for the 11thorder. The blaze angle, hb, is the angle between the grating normal and groove facet normal. The plane of diffraction is perpendicular to the grating grooves.
APPLIED SPECTROSCOPY 875
for different angles of incidence. When a ’ b ’ h = 638, thegrating is in a configuration close to Littrow and shows amaximum efficiency, where approximately 70% of the incidentmonochromatic light is diffracted into a single order. Thegrating efficiency decreases with the a angular deviation from638, which is equivalent to the angular deviation from theLittrow condition. The Echelle efficiency drops faster for a ,
b case compared with a . b, probably due to back-reflectionlight losses (Fig. 4b).
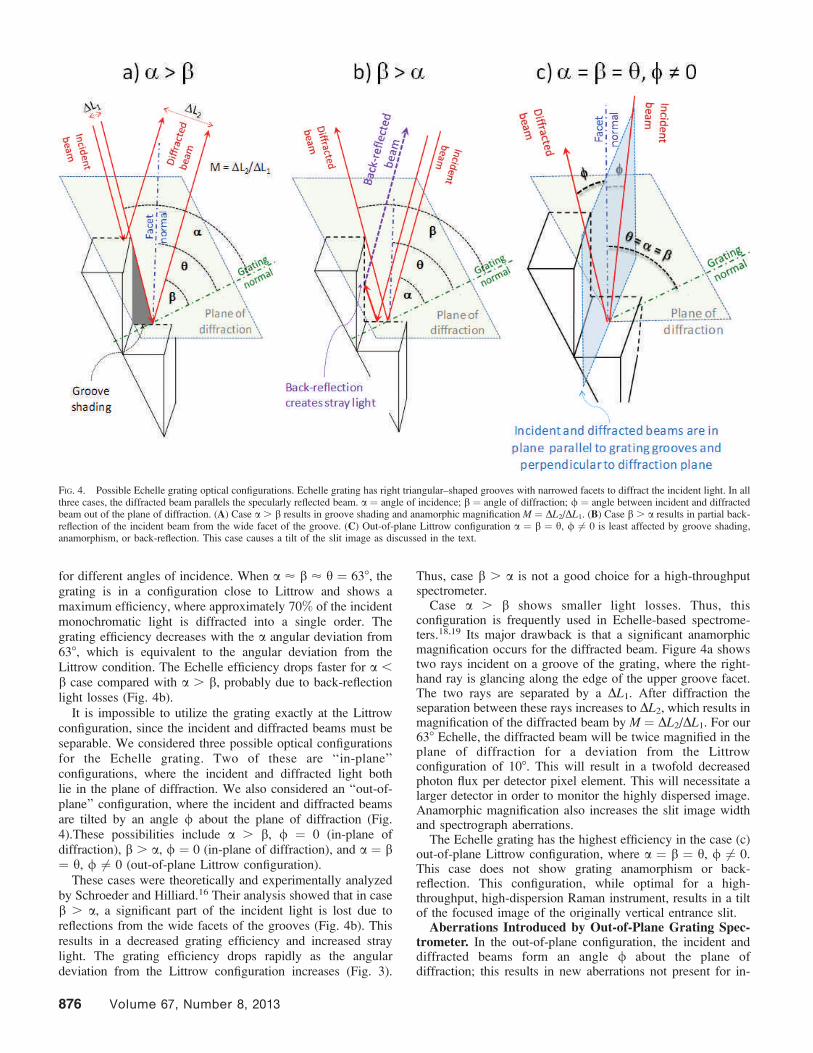
It is impossible to utilize the grating exactly at the Littrowconfiguration, since the incident and diffracted beams must beseparable. We considered three possible optical configurationsfor the Echelle grating. Two of these are ‘‘in-plane’’configurations, where the incident and diffracted light bothlie in the plane of diffraction. We also considered an ‘‘out-of-plane’’ configuration, where the incident and diffracted beamsare tilted by an angle / about the plane of diffraction (Fig.4).These possibilities include a . b, / = 0 (in-plane ofdiffraction), b . a, / = 0 (in-plane of diffraction), and a = b= h, / 6¼ 0 (out-of-plane Littrow configuration).
These cases were theoretically and experimentally analyzedby Schroeder and Hilliard.16 Their analysis showed that in caseb . a, a significant part of the incident light is lost due toreflections from the wide facets of the grooves (Fig. 4b). Thisresults in a decreased grating efficiency and increased straylight. The grating efficiency drops rapidly as the angulardeviation from the Littrow configuration increases (Fig. 3).
Thus, case b . a is not a good choice for a high-throughputspectrometer.
Case a . b shows smaller light losses. Thus, thisconfiguration is frequently used in Echelle-based spectrome-ters.18,19 Its major drawback is that a significant anamorphicmagnification occurs for the diffracted beam. Figure 4a showstwo rays incident on a groove of the grating, where the right-hand ray is glancing along the edge of the upper groove facet.The two rays are separated by a DL1. After diffraction theseparation between these rays increases to DL2, which results inmagnification of the diffracted beam by M = DL2/DL1. For our638 Echelle, the diffracted beam will be twice magnified in theplane of diffraction for a deviation from the Littrowconfiguration of 108. This will result in a twofold decreasedphoton flux per detector pixel element. This will necessitate alarger detector in order to monitor the highly dispersed image.Anamorphic magnification also increases the slit image widthand spectrograph aberrations.
The Echelle grating has the highest efficiency in the case (c)out-of-plane Littrow configuration, where a = b = h, / 6¼ 0.This case does not show grating anamorphism or back-reflection. This configuration, while optimal for a high-throughput, high-dispersion Raman instrument, results in a tiltof the focused image of the originally vertical entrance slit.
Aberrations Introduced by Out-of-Plane Grating Spec-trometer. In the out-of-plane configuration, the incident anddiffracted beams form an angle / about the plane ofdiffraction; this results in new aberrations not present for in-
FIG. 4. Possible Echelle grating optical configurations. Echelle grating has right triangular–shaped grooves with narrowed facets to diffract the incident light. In allthree cases, the diffracted beam parallels the specularly reflected beam. a = angle of incidence; b = angle of diffraction; / = angle between incident and diffractedbeam out of the plane of diffraction. (A) Case a . b results in groove shading and anamorphic magnification M = DL2/DL1. (B) Case b . a results in partial back-reflection of the incident beam from the wide facet of the groove. (C) Out-of-plane Littrow configuration a = b = h, / 6¼ 0 is least affected by groove shading,anamorphism, or back-reflection. This case causes a tilt of the slit image as discussed in the text.
876 Volume 67, Number 8, 2013
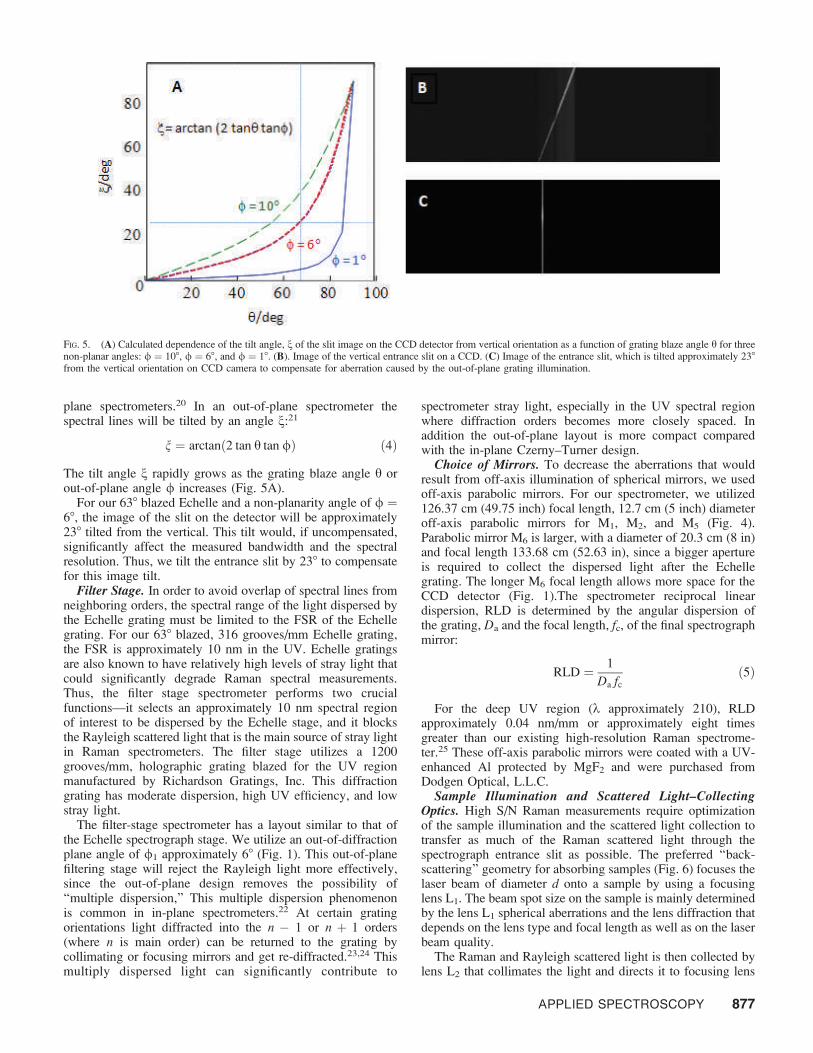
plane spectrometers.20 In an out-of-plane spectrometer thespectral lines will be tilted by an angle n:21
n ¼ arctanð2 tan h tan /Þ ð4Þ
The tilt angle n rapidly grows as the grating blaze angle h orout-of-plane angle / increases (Fig. 5A).
For our 638 blazed Echelle and a non-planarity angle of / =68, the image of the slit on the detector will be approximately238 tilted from the vertical. This tilt would, if uncompensated,significantly affect the measured bandwidth and the spectralresolution. Thus, we tilt the entrance slit by 238 to compensatefor this image tilt.
Filter Stage. In order to avoid overlap of spectral lines fromneighboring orders, the spectral range of the light dispersed bythe Echelle grating must be limited to the FSR of the Echellegrating. For our 638 blazed, 316 grooves/mm Echelle grating,the FSR is approximately 10 nm in the UV. Echelle gratingsare also known to have relatively high levels of stray light thatcould significantly degrade Raman spectral measurements.Thus, the filter stage spectrometer performs two crucialfunctions—it selects an approximately 10 nm spectral regionof interest to be dispersed by the Echelle stage, and it blocksthe Rayleigh scattered light that is the main source of stray lightin Raman spectrometers. The filter stage utilizes a 1200grooves/mm, holographic grating blazed for the UV regionmanufactured by Richardson Gratings, Inc. This diffractiongrating has moderate dispersion, high UV efficiency, and lowstray light.
The filter-stage spectrometer has a layout similar to that ofthe Echelle spectrograph stage. We utilize an out-of-diffractionplane angle of /1 approximately 68 (Fig. 1). This out-of-planefiltering stage will reject the Rayleigh light more effectively,since the out-of-plane design removes the possibility of‘‘multiple dispersion,’’ This multiple dispersion phenomenonis common in in-plane spectrometers.22 At certain gratingorientations light diffracted into the n � 1 or n þ 1 orders(where n is main order) can be returned to the grating bycollimating or focusing mirrors and get re-diffracted.23,24 Thismultiply dispersed light can significantly contribute to
spectrometer stray light, especially in the UV spectral regionwhere diffraction orders becomes more closely spaced. Inaddition the out-of-plane layout is more compact comparedwith the in-plane Czerny–Turner design.
Choice of Mirrors. To decrease the aberrations that wouldresult from off-axis illumination of spherical mirrors, we usedoff-axis parabolic mirrors. For our spectrometer, we utilized126.37 cm (49.75 inch) focal length, 12.7 cm (5 inch) diameteroff-axis parabolic mirrors for M1, M2, and M5 (Fig. 4).Parabolic mirror M6 is larger, with a diameter of 20.3 cm (8 in)and focal length 133.68 cm (52.63 in), since a bigger apertureis required to collect the dispersed light after the Echellegrating. The longer M6 focal length allows more space for theCCD detector (Fig. 1).The spectrometer reciprocal lineardispersion, RLD is determined by the angular dispersion ofthe grating, Da and the focal length, fc, of the final spectrographmirror:
RLD ¼ 1
Da fcð5Þ
For the deep UV region (k approximately 210), RLDapproximately 0.04 nm/mm or approximately eight timesgreater than our existing high-resolution Raman spectrome-ter.25 These off-axis parabolic mirrors were coated with a UV-enhanced Al protected by MgF2 and were purchased fromDodgen Optical, L.L.C.
Sample Illumination and Scattered Light–CollectingOptics. High S/N Raman measurements require optimizationof the sample illumination and the scattered light collection totransfer as much of the Raman scattered light through thespectrograph entrance slit as possible. The preferred ‘‘back-scattering’’ geometry for absorbing samples (Fig. 6) focuses thelaser beam of diameter d onto a sample by using a focusinglens L1. The beam spot size on the sample is mainly determinedby the lens L1 spherical aberrations and the lens diffraction thatdepends on the lens type and focal length as well as on the laserbeam quality.
The Raman and Rayleigh scattered light is then collected bylens L2 that collimates the light and directs it to focusing lens
FIG. 5. (A) Calculated dependence of the tilt angle, n of the slit image on the CCD detector from vertical orientation as a function of grating blaze angle h for threenon-planar angles: / = 108, / = 68, and / = 18. (B). Image of the vertical entrance slit on a CCD. (C) Image of the entrance slit, which is tilted approximately 238from the vertical orientation on CCD camera to compensate for aberration caused by the out-of-plane grating illumination.
APPLIED SPECTROSCOPY 877
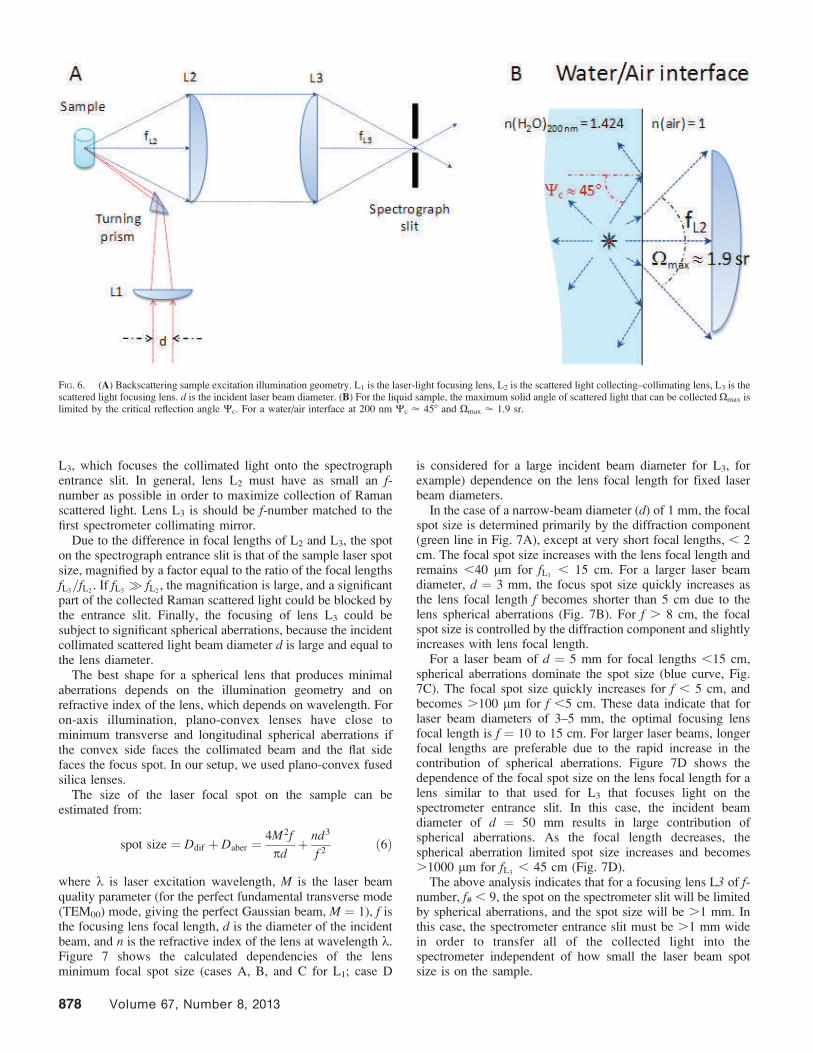
L3, which focuses the collimated light onto the spectrographentrance slit. In general, lens L2 must have as small an f-number as possible in order to maximize collection of Ramanscattered light. Lens L3 is should be f-number matched to thefirst spectrometer collimating mirror.
Due to the difference in focal lengths of L2 and L3, the spoton the spectrograph entrance slit is that of the sample laser spotsize, magnified by a factor equal to the ratio of the focal lengthsfL3=fL2
. If fL3� fL2
, the magnification is large, and a significantpart of the collected Raman scattered light could be blocked bythe entrance slit. Finally, the focusing of lens L3 could besubject to significant spherical aberrations, because the incidentcollimated scattered light beam diameter d is large and equal tothe lens diameter.
The best shape for a spherical lens that produces minimalaberrations depends on the illumination geometry and onrefractive index of the lens, which depends on wavelength. Foron-axis illumination, plano-convex lenses have close tominimum transverse and longitudinal spherical aberrations ifthe convex side faces the collimated beam and the flat sidefaces the focus spot. In our setup, we used plano-convex fusedsilica lenses.
The size of the laser focal spot on the sample can beestimated from:
spot size ¼ Ddif þ Daber ¼4M2f
pdþ nd3
f 2ð6Þ
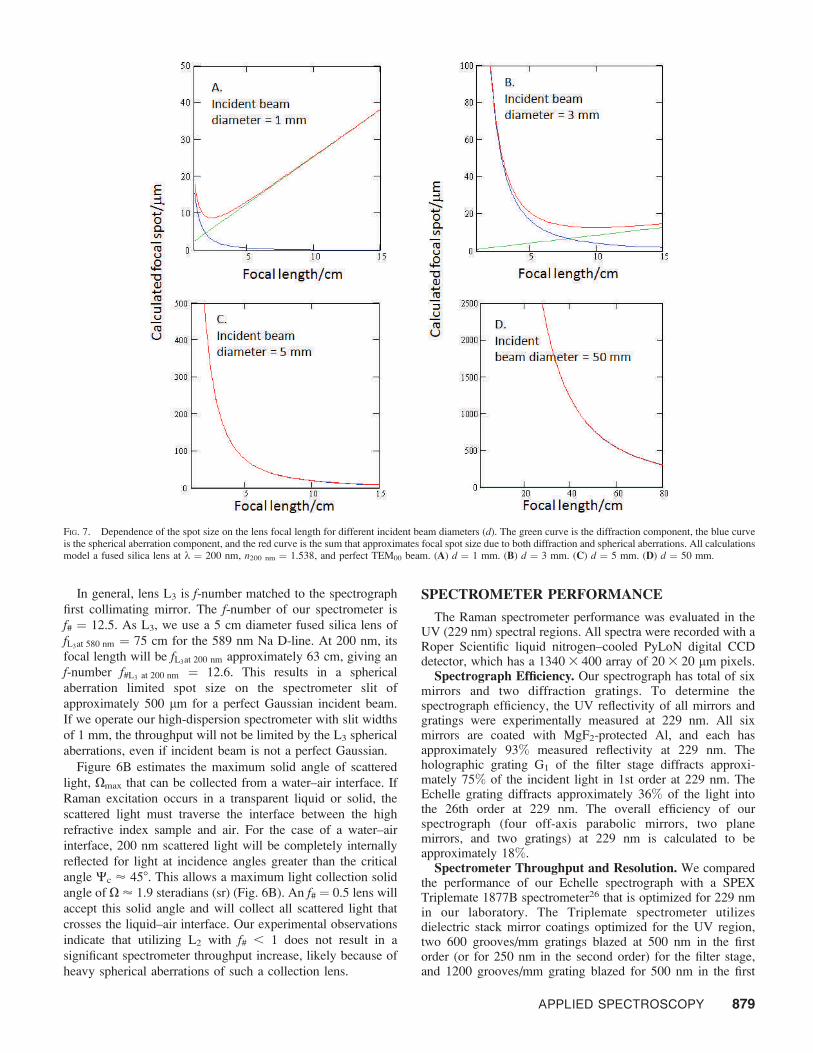
where k is laser excitation wavelength, M is the laser beamquality parameter (for the perfect fundamental transverse mode(TEM00) mode, giving the perfect Gaussian beam, M = 1), f isthe focusing lens focal length, d is the diameter of the incidentbeam, and n is the refractive index of the lens at wavelength k.Figure 7 shows the calculated dependencies of the lensminimum focal spot size (cases A, B, and C for L1; case D
is considered for a large incident beam diameter for L3, forexample) dependence on the lens focal length for fixed laserbeam diameters.
In the case of a narrow-beam diameter (d) of 1 mm, the focalspot size is determined primarily by the diffraction component(green line in Fig. 7A), except at very short focal lengths, , 2cm. The focal spot size increases with the lens focal length andremains ,40 lm for fL1
, 15 cm. For a larger laser beamdiameter, d = 3 mm, the focus spot size quickly increases asthe lens focal length f becomes shorter than 5 cm due to thelens spherical aberrations (Fig. 7B). For f . 8 cm, the focalspot size is controlled by the diffraction component and slightlyincreases with lens focal length.
For a laser beam of d = 5 mm for focal lengths ,15 cm,spherical aberrations dominate the spot size (blue curve, Fig.7C). The focal spot size quickly increases for f , 5 cm, andbecomes .100 lm for f ,5 cm. These data indicate that forlaser beam diameters of 3–5 mm, the optimal focusing lensfocal length is f = 10 to 15 cm. For larger laser beams, longerfocal lengths are preferable due to the rapid increase in thecontribution of spherical aberrations. Figure 7D shows thedependence of the focal spot size on the lens focal length for alens similar to that used for L3 that focuses light on thespectrometer entrance slit. In this case, the incident beamdiameter of d = 50 mm results in large contribution ofspherical aberrations. As the focal length decreases, thespherical aberration limited spot size increases and becomes.1000 lm for fL3
, 45 cm (Fig. 7D).The above analysis indicates that for a focusing lens L3 of f-
number, f# , 9, the spot on the spectrometer slit will be limitedby spherical aberrations, and the spot size will be .1 mm. Inthis case, the spectrometer entrance slit must be .1 mm widein order to transfer all of the collected light into thespectrometer independent of how small the laser beam spotsize is on the sample.
FIG. 6. (A) Backscattering sample excitation illumination geometry. L1 is the laser-light focusing lens, L2 is the scattered light collecting–collimating lens, L3 is thescattered light focusing lens. d is the incident laser beam diameter. (B) For the liquid sample, the maximum solid angle of scattered light that can be collected Xmax islimited by the critical reflection angle Wc. For a water/air interface at 200 nm Wc ’ 458 and Xmax ’ 1.9 sr.
878 Volume 67, Number 8, 2013
In general, lens L3 is f-number matched to the spectrograph
first collimating mirror. The f-number of our spectrometer is
f# = 12.5. As L3, we use a 5 cm diameter fused silica lens of
fL3at 580 nm = 75 cm for the 589 nm Na D-line. At 200 nm, its
focal length will be fL3at 200 nm approximately 63 cm, giving an
f-number f#L3 at 200 nm = 12.6. This results in a spherical
aberration limited spot size on the spectrometer slit of
approximately 500 lm for a perfect Gaussian incident beam.
If we operate our high-dispersion spectrometer with slit widths
of 1 mm, the throughput will not be limited by the L3 spherical
aberrations, even if incident beam is not a perfect Gaussian.
Figure 6B estimates the maximum solid angle of scattered
light, Xmax that can be collected from a water–air interface. If
Raman excitation occurs in a transparent liquid or solid, the
scattered light must traverse the interface between the high
refractive index sample and air. For the case of a water–air
interface, 200 nm scattered light will be completely internally
reflected for light at incidence angles greater than the critical
angle Wc ’ 458. This allows a maximum light collection solid
angle of X ’ 1.9 steradians (sr) (Fig. 6B). An f# = 0.5 lens will
accept this solid angle and will collect all scattered light that
crosses the liquid–air interface. Our experimental observations
indicate that utilizing L2 with f# , 1 does not result in a
significant spectrometer throughput increase, likely because of
heavy spherical aberrations of such a collection lens.
SPECTROMETER PERFORMANCE
The Raman spectrometer performance was evaluated in theUV (229 nm) spectral regions. All spectra were recorded with aRoper Scientific liquid nitrogen–cooled PyLoN digital CCDdetector, which has a 1340 3 400 array of 20 3 20 lm pixels.
Spectrograph Efficiency. Our spectrograph has total of sixmirrors and two diffraction gratings. To determine thespectrograph efficiency, the UV reflectivity of all mirrors andgratings were experimentally measured at 229 nm. All sixmirrors are coated with MgF2-protected Al, and each hasapproximately 93% measured reflectivity at 229 nm. Theholographic grating G1 of the filter stage diffracts approxi-mately 75% of the incident light in 1st order at 229 nm. TheEchelle grating diffracts approximately 36% of the light intothe 26th order at 229 nm. The overall efficiency of ourspectrograph (four off-axis parabolic mirrors, two planemirrors, and two gratings) at 229 nm is calculated to beapproximately 18%.
Spectrometer Throughput and Resolution. We comparedthe performance of our Echelle spectrograph with a SPEXTriplemate 1877B spectrometer26 that is optimized for 229 nmin our laboratory. The Triplemate spectrometer utilizesdielectric stack mirror coatings optimized for the UV region,two 600 grooves/mm gratings blazed at 500 nm in the firstorder (or for 250 nm in the second order) for the filter stage,and 1200 grooves/mm grating blazed for 500 nm in the first
FIG. 7. Dependence of the spot size on the lens focal length for different incident beam diameters (d). The green curve is the diffraction component, the blue curveis the spherical aberration component, and the red curve is the sum that approximates focal spot size due to both diffraction and spherical aberrations. All calculationsmodel a fused silica lens at k = 200 nm, n200 nm = 1.538, and perfect TEM00 beam. (A) d = 1 mm. (B) d = 3 mm. (C) d = 5 mm. (D) d = 50 mm.
APPLIED SPECTROSCOPY 879
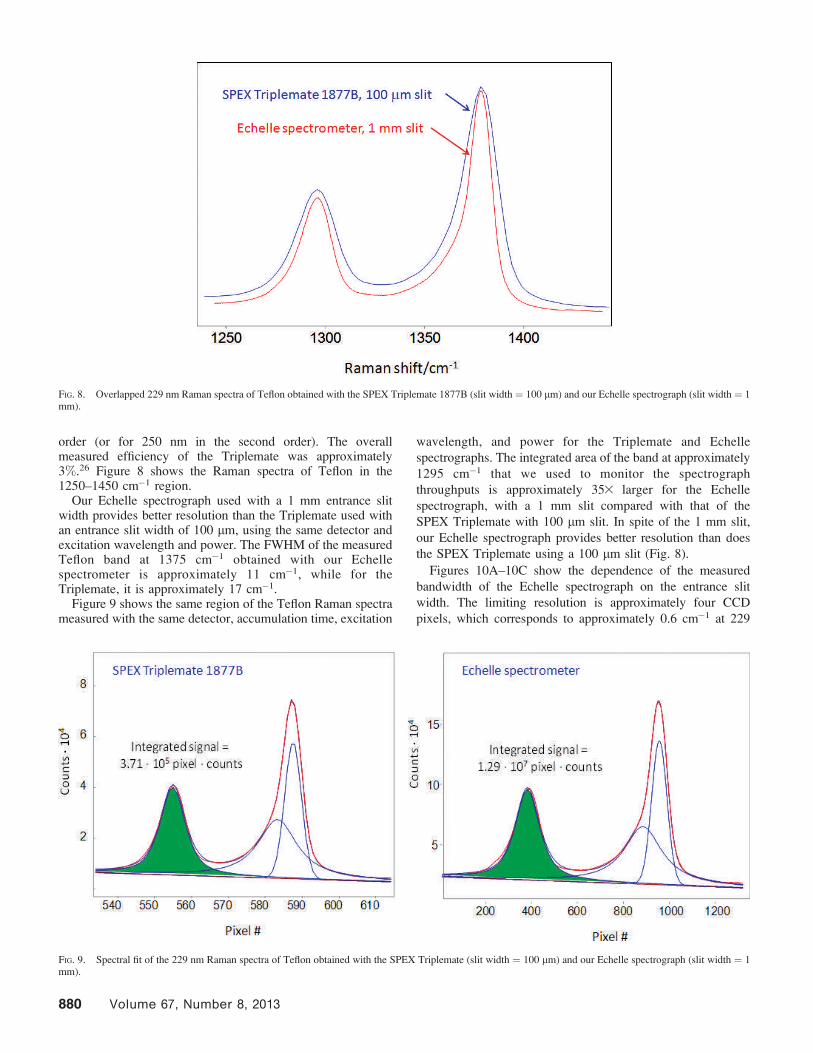
order (or for 250 nm in the second order). The overallmeasured efficiency of the Triplemate was approximately3%.26 Figure 8 shows the Raman spectra of Teflon in the1250–1450 cm�1 region.
Our Echelle spectrograph used with a 1 mm entrance slitwidth provides better resolution than the Triplemate used withan entrance slit width of 100 lm, using the same detector andexcitation wavelength and power. The FWHM of the measuredTeflon band at 1375 cm�1 obtained with our Echellespectrometer is approximately 11 cm�1, while for theTriplemate, it is approximately 17 cm�1.
Figure 9 shows the same region of the Teflon Raman spectrameasured with the same detector, accumulation time, excitation
wavelength, and power for the Triplemate and Echelle
spectrographs. The integrated area of the band at approximately
1295 cm�1 that we used to monitor the spectrograph
throughputs is approximately 353 larger for the Echelle
spectrograph, with a 1 mm slit compared with that of the
SPEX Triplemate with 100 lm slit. In spite of the 1 mm slit,
our Echelle spectrograph provides better resolution than does
the SPEX Triplemate using a 100 lm slit (Fig. 8).
Figures 10A–10C show the dependence of the measured
bandwidth of the Echelle spectrograph on the entrance slit
width. The limiting resolution is approximately four CCD
pixels, which corresponds to approximately 0.6 cm�1 at 229
FIG. 8. Overlapped 229 nm Raman spectra of Teflon obtained with the SPEX Triplemate 1877B (slit width = 100 lm) and our Echelle spectrograph (slit width = 1mm).
FIG. 9. Spectral fit of the 229 nm Raman spectra of Teflon obtained with the SPEX Triplemate (slit width = 100 lm) and our Echelle spectrograph (slit width = 1mm).
880 Volume 67, Number 8, 2013

nm. The Hg(I) atomic spectrum 232 nm triplet of closelyspaced lines is completely resolved.
Spectrometer Transfer Function at Entrance Slit = 1mm. The wide entrance slit dramatically increases spectrom-eter throughput, but it also affects the observed Raman spectralband shapes. The 1 mm wide slit creates an approximately 1mm wide image on the CCD detector, which is about 50 pixels.Figure 11 shows the band shape created by Echellespectrometer if monochromatic light (204 nm Rayleigh line
scattered from the Teflon surface) is focused through a 1 mmopened slit to form a CCD image.
Reciprocal Linear Dispersion: 229 nm UV Raman ofInorganic Salts. Figure 12 shows the Raman spectrum of solidNa2SO4, measured by our Echelle spectrometer. At 229 nmexcitation the 1 in (2.54 cm) CCD accommodates approxi-mately 200 cm�1 of the Raman spectrum showing RLD229 =0.147 cm�1 per pixel = 0.04 nm/mm. The FWHM of theSO4
2� band is about 5 cm�1.
FIG. 10. Echelle spectrometer resolution. (A) Spectrum of 229 nm laser Rayleigh scattering from Teflon. At a slit width = 20 lm, the resolution is about 4 pixels,which is approximately 0.6 cm�1. (B) Slit width dependence of the FWHM of the 229 nm Rayleigh line scattered from the Teflon. (C) Atomic spectrum of themercury, an Hg(I) triplet at 232 nm. Wavelengths of the mercury lines are taken from the National Institute of Science and Technology Atomic Spectra Database.
FIG. 11. Band shape of monochromatic light (laser Rayleigh scattered from Teflon) focused onto 1 mm slit (red) compared with Gaussian band shape. Image of 1mm slit on a CCD.
APPLIED SPECTROSCOPY 881
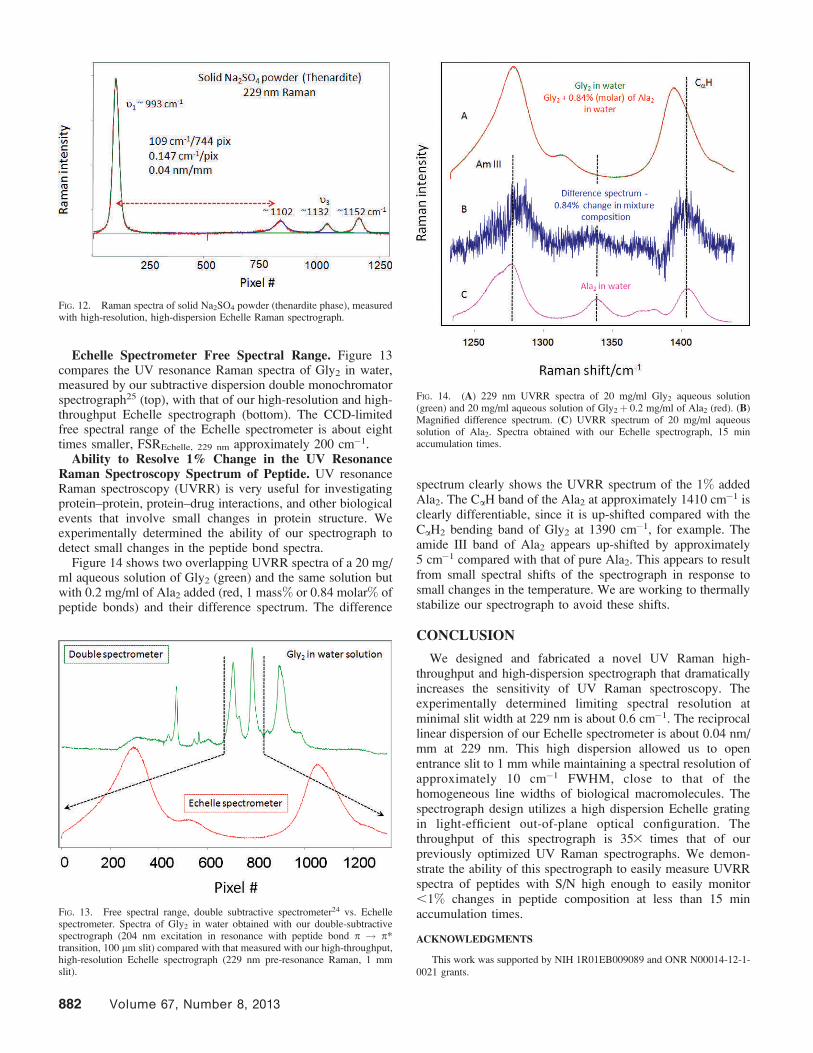
Echelle Spectrometer Free Spectral Range. Figure 13compares the UV resonance Raman spectra of Gly2 in water,measured by our subtractive dispersion double monochromatorspectrograph25 (top), with that of our high-resolution and high-throughput Echelle spectrograph (bottom). The CCD-limitedfree spectral range of the Echelle spectrometer is about eighttimes smaller, FSREchelle, 229 nm approximately 200 cm�1.
Ability to Resolve 1% Change in the UV ResonanceRaman Spectroscopy Spectrum of Peptide. UV resonanceRaman spectroscopy (UVRR) is very useful for investigatingprotein–protein, protein–drug interactions, and other biologicalevents that involve small changes in protein structure. Weexperimentally determined the ability of our spectrograph todetect small changes in the peptide bond spectra.
Figure 14 shows two overlapping UVRR spectra of a 20 mg/ml aqueous solution of Gly2 (green) and the same solution butwith 0.2 mg/ml of Ala2 added (red, 1 mass% or 0.84 molar% ofpeptide bonds) and their difference spectrum. The difference
spectrum clearly shows the UVRR spectrum of the 1% addedAla2. The CaH band of the Ala2 at approximately 1410 cm�1 isclearly differentiable, since it is up-shifted compared with theCaH2 bending band of Gly2 at 1390 cm�1, for example. Theamide III band of Ala2 appears up-shifted by approximately5 cm�1 compared with that of pure Ala2. This appears to resultfrom small spectral shifts of the spectrograph in response tosmall changes in the temperature. We are working to thermallystabilize our spectrograph to avoid these shifts.
CONCLUSION
We designed and fabricated a novel UV Raman high-throughput and high-dispersion spectrograph that dramaticallyincreases the sensitivity of UV Raman spectroscopy. Theexperimentally determined limiting spectral resolution atminimal slit width at 229 nm is about 0.6 cm�1. The reciprocallinear dispersion of our Echelle spectrometer is about 0.04 nm/mm at 229 nm. This high dispersion allowed us to openentrance slit to 1 mm while maintaining a spectral resolution ofapproximately 10 cm�1 FWHM, close to that of thehomogeneous line widths of biological macromolecules. Thespectrograph design utilizes a high dispersion Echelle gratingin light-efficient out-of-plane optical configuration. Thethroughput of this spectrograph is 353 times that of ourpreviously optimized UV Raman spectrographs. We demon-strate the ability of this spectrograph to easily measure UVRRspectra of peptides with S/N high enough to easily monitor,1% changes in peptide composition at less than 15 minaccumulation times.
ACKNOWLEDGMENTS
This work was supported by NIH 1R01EB009089 and ONR N00014-12-1-0021 grants.
FIG. 12. Raman spectra of solid Na2SO4 powder (thenardite phase), measuredwith high-resolution, high-dispersion Echelle Raman spectrograph.
FIG. 13. Free spectral range, double subtractive spectrometer24 vs. Echellespectrometer. Spectra of Gly2 in water obtained with our double-subtractivespectrograph (204 nm excitation in resonance with peptide bond p ! p*transition, 100 lm slit) compared with that measured with our high-throughput,high-resolution Echelle spectrograph (229 nm pre-resonance Raman, 1 mmslit).
FIG. 14. (A) 229 nm UVRR spectra of 20 mg/ml Gly2 aqueous solution(green) and 20 mg/ml aqueous solution of Gly2þ 0.2 mg/ml of Ala2 (red). (B)Magnified difference spectrum. (C) UVRR spectrum of 20 mg/ml aqueoussolution of Ala2. Spectra obtained with our Echelle spectrograph, 15 minaccumulation times.
882 Volume 67, Number 8, 2013
1. S.A. Oladepo, K. Xiong, Z. Hong, S.A. Asher, J. Handen, I.K. Lednev.‘‘UV Resonance Raman Investigations of Peptide and Protein Structureand Dynamics’’. Chem. Rev. 2012. 112(5): 2604-2628.
2. G. Balakrishnan, Y. Hu, T. G. Spiro, ‘‘His26 Protonation in Cytochrome cTriggers Microsecond b-Sheet Formation and Heme Exposure: Implica-tions for Apoptosis’’. J. Am. Chem. Soc. 2012. 134(46): 19061-19069.
3. S. Niebling, H.Y. Kuchelmeister, C. Schmuck, S. Schluecker. ‘‘Quantita-tive Label-Free Monitoring of Peptide Recognition by Artificial Receptors:A Comparative FT-IR and UV Resonance Raman Spectroscopic Study’’.Chem. Sci. 2012. 3(12): 3371-3377.
4. C.M. Halsey, O.O. Oshokoya, R.D. Jiji, J.W. Cooley. ‘‘Deep-UVResonance Raman Analysis of the Rhodobacter capsulatus cytochromebc1 Complex Reveals a Potential Marker for the Transmembrane PeptideBackbone’’. Biochemistry. 2011. 50(30): 6531-6538.
5. S. Nagatomo, M. Nagai, T. Kitagawa. ‘‘A New Way to UnderstandQuaternary Structure Changes of Hemoglobin upon Ligand Binding on theBasis of UV-Resonance Raman Evaluation of Intersubunit Interactions’’. J.Am. Chem. Soc. 2011. 133(26): 10101-10110.
6. I.K. Lednev, V. Shashilov, M. Xu. ‘‘Ultraviolet Raman Spectroscopy isUniquely Suitable for Studying Amyloid Diseases’’. Curr. Sci. 2009. 97(2):180-185.
7. J.M. Benevides, S.A. Overman, G.J. Thomas, Jr. ‘‘Raman, PolarizedRaman, and Ultraviolet Resonance Raman Spectroscopy of Nucleic Acidsand Their Complexes’’. J. Raman Spectrosc. 2005. 36(4): 279-299.
8. I.K. Lednev, A.S. Karnoup, M.C. Sparrow, S.A. Asher. ‘‘a-Helix PeptideFolding and Unfolding Activation Barriers: A Nanosecond UV ResonanceRaman Study’’. J. Am. Chem. Soc. 1999. 121(35): 8074-8086.
9. I.K. Lednev, A.S. Karnoup, M.C. Sparrow, S.A. Asher. ‘‘Transient UVRaman Spectroscopy Finds No Crossing Barrier Between the Peptide a-Helix and Fully Random Coil Conformation’’. J. Am. Chem. Soc. 2001.123(10): 2388-2392.
10. T. Kitagawa, N. Haruta, Y. Mizutani. ‘‘Time-Resolved Resonance RamanStudy on Ultrafast Structural Relaxation and Vibrational Cooling ofPhotodissociated Carbonmonoxy Myoglobin’’. Biopolymers. 2002. 61(3):207-213.
11. C.-Y. Huang, G. Balakrishnan, T.G. Spiro. ‘‘Early Events in Apomyoglo-bin Unfolding Probed by Laser T-Jump–UV Resonance Raman Spectros-copy’’. Biochemistry. 2005. 44(48): 15734-15742.
12. A.V. Mikhonin, S.A. Asher, S.V. Bykov, A. Murza. ‘‘UV Raman SpatiallyResolved Melting Dynamics of Isotopically Labeled Polyalanyl Peptide:
Slow A-Helix Melting Follows 310-Helices and p-Bulges Premelting’’. J.Phys. Chem. B. 2007. 111(12): 3280-3292.
13. G. Balakrishnan, C.L. Weeks, M. Ibrahim, A.V. Soldatova, T.G. Spiro.‘‘Protein Dynamics from Time-Resolved UV Raman Spectroscopy’’. Curr.Opin. Structr. Biol. 2008. 18(5): 623-629.
14. S.F. El-Mashtoly, M. Kubo, S. Nakashima, T. Shimizu, T. Kitagawa.‘‘Structural Dynamics of EcDOS Heme Domain Revealed by Time-Resolved Ultraviolet Resonance Raman Spectroscopy’’. J. Phys. Chem.Lett. 2011. 2(17): 2212-2217.
15. S.A. Oladepo, K. Xiong, Z. Hong, S.A. Asher. ‘‘Elucidating Peptide andProtein Structure and Dynamics: UV Resonance Raman Spectroscopy’’. J.Phys. Chem. Lett. 2011. 2(4): 334-344.
16. S.A. Asher, A.V. Mikhonin, S. Bykov. ‘‘UV Raman Demonstrates that a-Helical Polyalanine Peptides Melt to Polyproline II Conformations’’. J.Am. Chem. Soc. 2004. 126(27): 8433-8440.
17. D.J. Schroeder, R.L. Hilliard. ‘‘Echelle Efficiencies: Theory and Experi-ment’’. Appl. Opt. 1980. 19(16): 2833-2841.
18. M.J. Pelletier. ‘‘Raman Spectroscopy Using an Echelle Spectrograph withCCD Detection’’. Appl. Spectrosc. 1990. 44(10): 1699-1705.
19. M.R. Torr, D.G. Torr. ‘‘Imaging Spectrometer for High-ResolutionMeasurements of Stratospheric Trace Constituents in the Ultraviolet’’.Appl. Opt. 1988. 27(3): 619-626.
20. M.A. Gil, J.M. Simon. ‘‘Aberrations in Off-Plane Spectrometers’’. Opt.Acta. 1983. 30(9): 1287-1301.
21. P. Lindblom. ‘‘Theory of the Two-Mirror Plane-Grating Spectrograph’’. J.Opt. Soc. Am. 1972. 62(6): 756-762.
22. J.J. Mitteldorf, D.O. Landon. ‘‘Multiply Diffracted Light in the Czerny–Turner Spectrometer’’. Appl. Opt. 1968. 7(8): 1431-1435.
23. C.M. Penchina. ‘‘Reduction of Stray Light in In-Plane Grating Spectrom-eters’’. Appl. Opt. 1967. 6(6): 1029-1031.
24. J.K. Pribram, C.M. Penchina. ‘‘Stray Light in Czerny–Turner and EbertSpectrometers’’. Appl. Opt. 1968. 7(10): 2005-2014.
25. S. Bykov, I. Lednev, A. Ianoul, A. Mikhonin, C. Munro, S.A. Asher.‘‘Steady-State and Transient Ultraviolet Resonance Raman Spectrometer forthe 193–270 nm Spectral Region’’. Appl. Spectr. 2005. 59(12): 1541-1552.
26. S.A. Asher, C.R. Johnson, J. Murtaugh. ‘‘Development of a New UVResonance Raman Spectrometer for the 217–400-nm Spectral Region’’.Rev. Sci. Instrum. 1983. 54(12): 1657-1662.
APPLIED SPECTROSCOPY 883