higher criticism: theory and applications in …hea- · higher criticism: theory and applications...
TRANSCRIPT

Jiashun Jin, Purdue University, 10/11/2005 1
'
&
$
%
Higher Criticism: Theory
and Applications in Cosmology
Jiashun Jin
Statistics Department
Purdue Uinversity

Jiashun Jin, Purdue University, 10/11/2005 2
'
&
$
%
Collaborators
Alphabetically:
Nabila Aghanim Universite Paris Sud
Laura Cayon Purdue University
David Donoho Stanford University
Olivier Forni Universite Paris Sud
Jeau-Luc Starck Service d’Astrophysique
Anna Treaster Purdue University

Jiashun Jin, Purdue University, 10/11/2005 3
'
&
$
%
Agenda
• Higher Criticism statistic
• Optimal Adaptivity for detecting sparse Gaussian mixtures
• Application to nonGaussian detection
– detection of cosmic string
– WMAP first year data

Jiashun Jin, Purdue University, 10/11/2005 4
'
&
$
%
Tukey’s story
• Example: A young scientist administers 250 uncorrelated tests,out of which 11 were significant at the 5% level.
• Question is: Is this surprising?
• Answer: No, we expect
250× 5% = 12.5
significance at 5% level.

Jiashun Jin, Purdue University, 10/11/2005 5
'
&
$
%
Higher Criticism, Formalization proposed by Tukey
• Higher Criticism statistics:
HC.05,n =√
n[(Fraction Significant at .05)− .05]/√
.05× .95
and typically,
Reject H0 if and only if HC.05,n ≥ 2
• Solution to previous example:
HC.05,n = [11−12.5]/√
250× .05× .95 = −.43, =⇒ Accept H0.
• Higher Criticism, or “Second-Level Significance Testing,”indicating
Significance of Overall Body of Tests.

Jiashun Jin, Purdue University, 10/11/2005 6
'
&
$
%
Our Proposal
We propose
HC∗ = max0<α<1
√n[(Fraction Significant at α)− α]/
√α(1− α)
• Generalization of Tukey’s HCα,n to allow selection of level α
• Looking for unusually large number of “moderate significances”

Jiashun Jin, Purdue University, 10/11/2005 7
'
&
$
%
Only need p-values to implement HC
Obtain individual p-values by:
pi = P{|N(0, 1)| ≥ |Xi|}
• sort p-values:p(1) < p(2) . . . < p(n)
• calculate ith z-score:
HCn,i =√
n
[ in − p(i)√
p(i)(1− p(i))
]• take maximum:
HC∗n = max{1 ≤ i ≤ n} HCn,i
Jiashun Jin, Purdue University, 10/11/2005 8
'
&
$
%
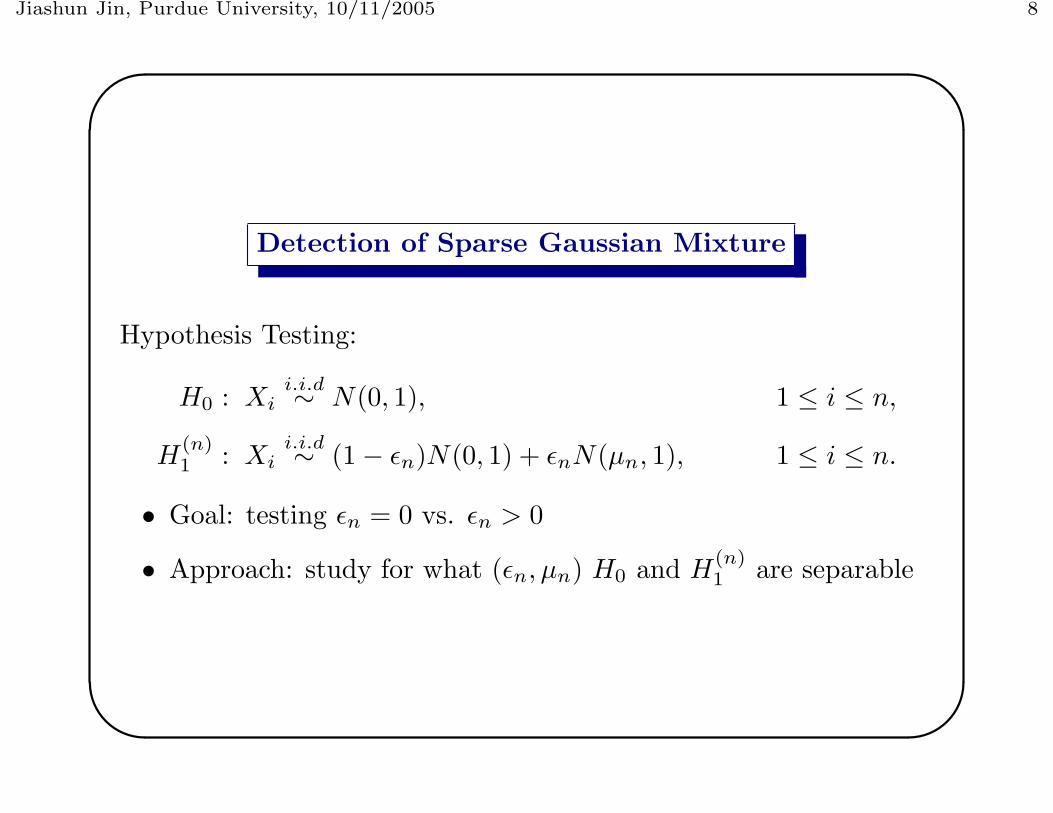
Detection of Sparse Gaussian Mixture
Hypothesis Testing:
H0 : Xii.i.d∼ N(0, 1), 1 ≤ i ≤ n,
H(n)1 : Xi
i.i.d∼ (1− εn)N(0, 1) + εnN(µn, 1), 1 ≤ i ≤ n.
• Goal: testing εn = 0 vs. εn > 0
• Approach: study for what (εn, µn) H0 and H(n)1 are separable

Jiashun Jin, Purdue University, 10/11/2005 9
'
&
$
%
Subtlety of the Problem
Calibrate with:
εn = n−β , 0.5 < β < 1,
µn =√
2r log n, 0 < r < 1.
Challenges:
• Very sparse: εn � 1√n
• Moderate significance: µn <√
2 log n
• Different from continguity: µn increases with n

Jiashun Jin, Purdue University, 10/11/2005 10
'
&
$
%
Detection Boundary
Theorem 1. (Ingster 1999, Jin 2004). If εn = n−β ,µn =
√2r log n, 1
2 < β < 1, and 0 < r < 1, then:
If r > ρ(β), H0 and H(n)1 separate asymptotically,
If r < ρ(β), H0 and H(n)1 merge asymptotically.
We call r = ρ(β) the “detection boundary”:
ρ(β) =
β − 12 , 1
2 < β < 34 ,
(1−√
1− β)2, 34 < β < 1.

Jiashun Jin, Purdue University, 10/11/2005 11
'
&
$
%0.5 0.55 0.6 0.65 0.7 0.75 0.8 0.85 0.9 0.95 10
0.1
0.2
0.3
0.4
0.5
0.6
0.7
0.8
0.9
1
Detectable
Undetectable
Classifiable

Jiashun Jin, Purdue University, 10/11/2005 12
'
&
$
%
Critical Value of Higher Criticism
• let h(n, α) be the critical value that
P{HC∗ > h(n, α)} ≤ α
• h(n, α) ≈√
2 log log n, ∀ 0 < α < 1
Call αn → 0 slowly enough if :
h(n, αn)√2 log log n
→ 1, n →∞.

Jiashun Jin, Purdue University, 10/11/2005 13
'
&
$
%
Optimal Adaptivity of Higher Criticism
Theorem 2. (Donoho and Jin 2004). Consider the HigherCriticism test that rejects H0 when
HC∗ > h(n, αn)
where the level αn → 0 slowly enough. For every alternativeH
(n)1 (r, β) where r exceeds the detection boundary ρ(β) — so that
the Likelihood ratio test would have full power — Higher Criticismtest also has full power:
PH
(n)1{Reject H0} → 1.

Jiashun Jin, Purdue University, 10/11/2005 14
'
&
$
%
Cosmic Microwave Background (CMB)
CMB:
• Oldest light in the universe, a direct link to early universe
• A relic of radiation when the universe ≈ 380, 000 years old
• An almost perfect black body at a temperature ≈ 2.725 Kelvin

Jiashun Jin, Purdue University, 10/11/2005 15
'
&
$
%
Why study CMB
CMB provides a direct link to very early universe:
• Discriminate different models for early universe
• how does it evolve into the large scale galaxies today

Jiashun Jin, Purdue University, 10/11/2005 16
'
&
$
%
From 1965 to 2003
Figure 1: Small angular fluctuations in CMB are predicted as theimprints of initial densities perturbation which gave rise to large scalestructures today. Red color: strong emission from the Milky way.

Jiashun Jin, Purdue University, 10/11/2005 17
'
&
$
%
Wavelet Approach for nonGaussian Detection
• Standard inflation model predicts that the CMB is Gaussian
• Other models or secondary effects have nonGaussian signatures
• nonGaussian detection: disentangle different source ofnonGaussianity from one to another
• Wavelet transform is a powerful tool for detect nonGaussiansignature
– isotropic a trous algorithm (Starck et al. 1998)
– bi-orthogonal wavelet transform
Jiashun Jin, Purdue University, 10/11/2005 18
'
&
$
%
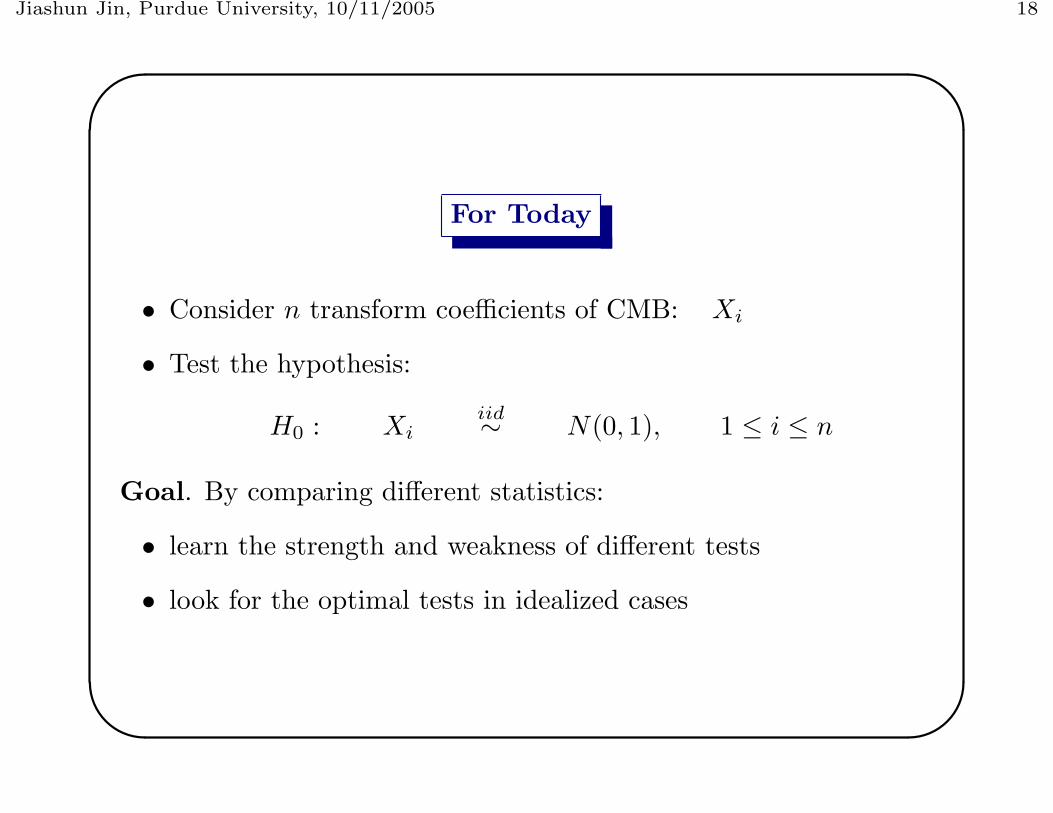
For Today
• Consider n transform coefficients of CMB: Xi
• Test the hypothesis:
H0 : Xiiid∼ N(0, 1), 1 ≤ i ≤ n
Goal. By comparing different statistics:
• learn the strength and weakness of different tests
• look for the optimal tests in idealized cases

Jiashun Jin, Purdue University, 10/11/2005 19
'
&
$
%
Wavelet Based nonGaussian Tests
1. Excess kurtosis (κ):
κ(X1, . . . , Xn) =∑
i
[X4
i − 3]
2. Maximum (Max):
Max(X1, . . . , Xn) = max{|X1|, |X2|, . . . , |Xn|}
3. Higher Criticism (HC)

Jiashun Jin, Purdue University, 10/11/2005 20
'
&
$
%
Heuristic Comparison
A test only sensitive to certain type of nonGaussianity:
• κ: deviation of 4-th moment from Gaussian
• Max: unusual behavior of very large observations
• HC:
– unusual behavior of extreme values
– unusual behavior of moderately large values

Jiashun Jin, Purdue University, 10/11/2005 21
'
&
$
%
Application I: Detecting Cosmic String
Cosmic string:
• an important source of nonGaussianity in CMB
• line-like object
• very old: formed within 1100 second after Big Bang
• very thin: 10−22 m
• very heavy: 10 km weights the same as earth

Jiashun Jin, Purdue University, 10/11/2005 22
'
&
$
%
Why Look For Cosmic String
• most potential candidate for forming modern galaxies
• a direct link to very early universe
• not yet detected
• can not be produced in Lab (extremely high energy)
Goal: develop most sensitive detection tools

Jiashun Jin, Purdue University, 10/11/2005 23
'
&
$
%
Detecting nonGassian Convolution Component
• given superposed image:√
1− λ · CMB +√
λ · CS, λ ≈ 0
• test: λ = 0 vs. λ > 0

Jiashun Jin, Purdue University, 10/11/2005 24
'
&
$
%
−0.8 −0.6 −0.4 −0.2 0 0.2 0.4 0.6 0.80
50
100
150
200
250
300
350
−5 −4 −3 −2 −1 0 1 2 3 4 5−1
−0.5
0
0.5
1
Standard Normal Quantiles
Qua
ntile
s of
Inpu
t Sam
ple
QQ Plot of Sample Data versus Standard Normal
−3 −2 −1 0 1 2 3 40
200
400
600
800
1000
1200
−5 −4 −3 −2 −1 0 1 2 3 4 5−3
−2
−1
0
1
2
3
4
Standard Normal Quantiles
Qua
ntile
s of
Inpu
t Sam
ple
QQ Plot of Sample Data versus Standard Normal
• equivalent to test:
H0 : Xi = zi, 1 ≤ i ≤ n,
H(n)1 : Xi =
√1− λ · zi +
√λ · wi, 1 ≤ i ≤ n.
– zii.i.d∼ N(0, 1): wavelet coefficients of CMB
– wii.i.d∼ W : wavelet coefficients of CS
– W unknown, but symmetric and heavy tail

Jiashun Jin, Purdue University, 10/11/2005 25
'
&
$
%
Calibrations
Need careful calibrations for subtle analysis:
• increasing amount of data are offset by increasingly challenges:
λ = λn = n−r, 0 < r < 1
• W : symmetric and has a power-law tail with index α:
limx→∞
xαp{|W | > x} = Cα, Cα: constant
Question: Fixed (r, α) and let n →∞, what is the optimal test?

Jiashun Jin, Purdue University, 10/11/2005 26
'
&
$
%2 4 6 8 10 12 14 16 18
0
0.1
0.2
0.3
0.4
0.5
0.6
0.7
0.8
0.9
1
Undetectable
Detectablefor Max/HC
Detectablefor Kurtosis
Detectable for Kurtosis/Max/HC
α
r

Jiashun Jin, Purdue University, 10/11/2005 27
'
&
$
%
Interpretation
α = 8 is the separating line:
• E[W 8] < ∞: Kurtosis is better
– W has a relatively thin tail, nonGaussianity affects thebulk of the data
– best tests: tests based on moments
• E[W 8] = ∞: HC/Max is better
– W has relatively heavy tail
– nonGaussianity has little effect on the bulk of data, butlarge effect on extreme values and moderately large values
– best tests: tests based on data tails

Jiashun Jin, Purdue University, 10/11/2005 28
'
&
$
%
Estimating α
• Analysis supports the power-law tail assumption of W
• A classical estimator for α is the Hill’s estimator (Ann. Statist.1975)
• Implementation of Hill’s estimator:
α ≈ 6.1, std(α) ≈ 0.9,

Jiashun Jin, Purdue University, 10/11/2005 29
'
&
$
%
Large n
• The finer resolution of the image, the larger the n
• Need large n
– to see the real advantage of HC
– better answer whether α < 8 or α > 8
– better answer which of HC and Kurtosis is better

Jiashun Jin, Purdue University, 10/11/2005 30
'
&
$
%
Application II: WMAP First Year Data
http://map.gsfc.nasa.gov/
• WMAP radiometers observe at 5 frequency bands with one ormore receivers: K (1), Ka (1), Q (2), V (2), W (4).
• WMAP team suggested use the weighted average of Q-V-Wbands (8 receivers)
• Foreground cleaned
• Mask added: strong emission of Milky way etc..
• Downgraded from nside = 512 to nside = 256: measurementnoise dominant in the smallest scale

Jiashun Jin, Purdue University, 10/11/2005 31
'
&
$
%
Statistical Analysis
1. Generate 5, 000 simulated Gaussian maps of CMB.
2. For WMAP and each simulated map:
• Use Spherical Mexican Hat Wavelets (SMHW):2-D-spherical wavelets
• Normalize the wavelet coefficients
• Apply kurtosis, Max, and HC to wavelet coefficients

Jiashun Jin, Purdue University, 10/11/2005 32
'
&
$
%
6
2 4 6 8 10 12 14−2
−1.5
−1
−0.5
0
0.5
1
1.5
2
scale
K
Figure 2. Values of the K statistic for the analyzed WMAP data set (crosses). The bands outlined by dashed, dotted-dashed and solidlines correspond to the 68%, 95% and 99% confidence regions respectively.
0 5 10 152
2.5
3
3.5
4
4.5
5
5.5
6
Max
scale
Figure 3. Values of the Max statistical test for the analyzed WMAP data set (crosses). The dashed, dotted-dashed and solid linescorrespond to the 68%, 95% and 99% confidence levels respectively.
Bennett, C.L. et al. 2003, ApJS, 148, 1
Bennett, C.L. et.al., 2003b, ApJS, 148, 97
Candes, E.J. & Donoho, D.L. 1999, In Curve and Surface Fitting:Saint-Malo 1999, Nashville, TN. Editors: Cohen, A., Rabut,C. & Schumaker, L.L.. Vanderbilt University Press PAGE???
Chiang, L.-Y., Naselsky, P.D., Verkhodanov, O.V. & Way, M.J.2003, ApJ, 590, L65
Chiang, L.Y. & Naselsky, P.D. 2004, astro-ph/0407395
Coles, P., Dineen, P., Earl, J. & Wright, D. 2004, MNRAS, 350,989
Copi, C.J., Huterer, D. & Starkman, G.D. 2004, Phys.Rev.D, 70,043515
Cruz, M., Martınez-Gonzalez, E., Vielva, P. & Cayon, L. 2004,astro-ph/0405341
Donoho, D. & Jin, J. 2004, Ann. Statist., 32, 962
Eriksen, H.K., Novikov, D.I., Lilje, P.B., Banday, A.J. & Gorski,K.M. 2004a, astro-ph/0401276
Eriksen, H.K., Hansen, F.K., Banday, A.J., Gorski, K.M. & Lilje,P.B. 2004b, ApJ, 605, 14
Eriksen, H.K., Banday, A.J., Gorski, K.M. & Lilje, P.B. 2004c,
astro-ph/0407271
Gorski, K.M., Hivon, E. & Wandelt, B.D. 1999, in Proceed-ings of the MPA/ESO Cosmology Conference ”Evolution ofLarge-Scale Structure”, eds. A.J. Banday, R.S. Sheth and L.Da Costa, PrintPartners Ipskamp, NL, pp. 37-42 (also astro-ph/9812350)
Guth, A.H. 1981, Phys.Rev.D., 23, 347
Guth, A.H. & Pi, S.-Y. 1982, Phys.Rev.Lett., 49, 1110
Hansen, F.K., Banday, A.J. & Gorski, K.M. 2004, astro-ph/0404206
Hinshaw, G. et.al., 2003, ApJS, 148, 63
Jarosik, N. et.al., 2003, ApJS, 148, 29
Jin, J. 2004, Institue of Mathematical Statistics Monograph, No.45, 255
Jin, J., Starck, J.-L., Donoho, D.L., Aghanim, N. & Forni, O.2004, submitted to EURASIP Journal on Applied Signal Pro-cessing, special issue on “Applications of Signal Processing inAstrophysics and Cosmology”
Komatsu, E. et al. 2003, ApJS, 148, 119
Larson, D.L. & Wandelt, B.D. 2004, astro-ph/0404037
c© 2001 RAS, MNRAS 000, 1–??
6
2 4 6 8 10 12 14−2
−1.5
−1
−0.5
0
0.5
1
1.5
2
scale
K
Figure 2. Values of the K statistic for the analyzed WMAP data set (crosses). The bands outlined by dashed, dotted-dashed and solidlines correspond to the 68%, 95% and 99% confidence regions respectively.
0 5 10 152
2.5
3
3.5
4
4.5
5
5.5
6
Max
scale
Figure 3. Values of the Max statistical test for the analyzed WMAP data set (crosses). The dashed, dotted-dashed and solid linescorrespond to the 68%, 95% and 99% confidence levels respectively.
Bennett, C.L. et al. 2003, ApJS, 148, 1
Bennett, C.L. et.al., 2003b, ApJS, 148, 97
Candes, E.J. & Donoho, D.L. 1999, In Curve and Surface Fitting:Saint-Malo 1999, Nashville, TN. Editors: Cohen, A., Rabut,C. & Schumaker, L.L.. Vanderbilt University Press PAGE???
Chiang, L.-Y., Naselsky, P.D., Verkhodanov, O.V. & Way, M.J.2003, ApJ, 590, L65
Chiang, L.Y. & Naselsky, P.D. 2004, astro-ph/0407395
Coles, P., Dineen, P., Earl, J. & Wright, D. 2004, MNRAS, 350,989
Copi, C.J., Huterer, D. & Starkman, G.D. 2004, Phys.Rev.D, 70,043515
Cruz, M., Martınez-Gonzalez, E., Vielva, P. & Cayon, L. 2004,astro-ph/0405341
Donoho, D. & Jin, J. 2004, Ann. Statist., 32, 962
Eriksen, H.K., Novikov, D.I., Lilje, P.B., Banday, A.J. & Gorski,K.M. 2004a, astro-ph/0401276
Eriksen, H.K., Hansen, F.K., Banday, A.J., Gorski, K.M. & Lilje,P.B. 2004b, ApJ, 605, 14
Eriksen, H.K., Banday, A.J., Gorski, K.M. & Lilje, P.B. 2004c,
astro-ph/0407271
Gorski, K.M., Hivon, E. & Wandelt, B.D. 1999, in Proceed-ings of the MPA/ESO Cosmology Conference ”Evolution ofLarge-Scale Structure”, eds. A.J. Banday, R.S. Sheth and L.Da Costa, PrintPartners Ipskamp, NL, pp. 37-42 (also astro-ph/9812350)
Guth, A.H. 1981, Phys.Rev.D., 23, 347
Guth, A.H. & Pi, S.-Y. 1982, Phys.Rev.Lett., 49, 1110
Hansen, F.K., Banday, A.J. & Gorski, K.M. 2004, astro-ph/0404206
Hinshaw, G. et.al., 2003, ApJS, 148, 63
Jarosik, N. et.al., 2003, ApJS, 148, 29
Jin, J. 2004, Institue of Mathematical Statistics Monograph, No.45, 255
Jin, J., Starck, J.-L., Donoho, D.L., Aghanim, N. & Forni, O.2004, submitted to EURASIP Journal on Applied Signal Pro-cessing, special issue on “Applications of Signal Processing inAstrophysics and Cosmology”
Komatsu, E. et al. 2003, ApJS, 148, 119
Larson, D.L. & Wandelt, B.D. 2004, astro-ph/0404037
c© 2001 RAS, MNRAS 000, 1–??
Higher Criticism Statistic: Detecting and Identifying Outliers in the WMAP First Year Data 7
0 5 10 150
20
40
60
80
100
120
140
160
180
scale
HC
0 5 10 150
20
40
60
80
100
120
140
160
180
scale
HC+
Figure 4. Values of the HC/HC+ statistical tests for the analyzed WMAP data set (crosses). The dashed, dotted-dashed and solidlines correspond to the 68%, 95% and 99% confidence levels respectively.
0 0.2 0.4 0.6 0.8 10
20
40
60
80
100
120
140
160
180
i/ndata (pixel)
HC
0.97 0.98 0.99 10
20
40
60
80
100
120
140
160
180
i/ndata (pixel)
HC
Figure 5. Values of the HC statistical test at every pixel of the analyzed WMAP data set. After sorting all the p-values, a numberis assigned to each pixel i. That number goes from 0 (pixel with the smallest p-value) to the number of data (pixel with the largestp-value). The HC values at each pixel are plotted against i/number of data. The region corresponding to the extreme values of HC isshown in the figure on the right panel.
Figure 6. A quater of the whole sky showing the location of the WMAP pixels with HC values above the extreme of the 99% limitobtained from 5000 simulations.
c© 2001 RAS, MNRAS 000, 1–??
Figure 2: Test scores on WMAP and 67%, 95%, and 99% confidenceregions on 5, 000 simulated CMB maps.

Jiashun Jin, Purdue University, 10/11/2005 33
'
&
$
%
Comparisons of Different Statistics
1. Almost equally powerful for detection, kurtosis is slightly better
• Define empirical confidence of detection:
#{test scores based on simulations ≤ score on WMAP}5000
• Kurtosis: 99.7%
• HC: 99.46%
• Max: 99.44%
2. Higher Criticism: automatically identify a tiny portion data asthe source of nonGaussianity

Jiashun Jin, Purdue University, 10/11/2005 34
'
&
$
%
Source of nonGaussianity
• HC∗n = max0<α<1
{HCn,α
},
HCn,α =√
n · [(Fraction Significant at α)− α]/√
α(1− α)
• HCn,α � 1 implies nonGaussiaintiy
Higher Criticism Statistic: Detecting and Identifying Outliers in the WMAP First Year Data 7
0 5 10 150
20
40
60
80
100
120
140
160
180
scale
HC
0 5 10 150
20
40
60
80
100
120
140
160
180
scale
HC+
Figure 4. Values of the HC/HC+ statistical tests for the analyzed WMAP data set (crosses). The dashed, dotted-dashed and solidlines correspond to the 68%, 95% and 99% confidence levels respectively.
0 0.2 0.4 0.6 0.8 10
20
40
60
80
100
120
140
160
180
i/ndata (pixel)
HC
0.97 0.98 0.99 10
20
40
60
80
100
120
140
160
180
i/ndata (pixel)
HC
Figure 5. Values of the HC statistical test at every pixel of the analyzed WMAP data set. After sorting all the p-values, a numberis assigned to each pixel i. That number goes from 0 (pixel with the smallest p-value) to the number of data (pixel with the largestp-value). The HC values at each pixel are plotted against i/number of data. The region corresponding to the extreme values of HC isshown in the figure on the right panel.
Figure 6. A quater of the whole sky showing the location of the WMAP pixels with HC values above the extreme of the 99% limitobtained from 5000 simulations.
c© 2001 RAS, MNRAS 000, 1–??
Figure 3: Plot of HCn,α versus (1 − α) for wavelet coefficients ofWMAP at Scale 9

Jiashun Jin, Purdue University, 10/11/2005 35
'
&
$
%
Figure 4: The selected coefficients maps back to pixels in a ring cen-tered at (209o, -57o). We map each coefficient to only one pixel. Thisdoesn’t say only pixels over the ring is the source for nonGaussianity.

Jiashun Jin, Purdue University, 10/11/2005 36
'
&
$
%
8
5 10 15−2
−1
0
1
2
scale
K
0 5 10 152
3
4
5
6
scale
Max
0 5 10 150
50
100
150
200
scale
HC
0 5 10 150
50
100
150
200
scale
HC
+
Figure 7. Values of K, Max and HC tests for the analyzed WMAP data set after subtracting the pixels that were causing the deviationsfrom the predictions of the Standard Inflationary model (crosses). The bands outlined by dashed, dotted-dashed and solid lines correspondto the 68%, 95% and 99% confidence regions respectively for K. The dashed, dotted-dashed and solid lines correspond to the 68%, 95%and 99% confidence levels respectively for Max, HC and HC+.
McEwen, J.D., Hobson, M.P., Lasenby, A.N. & Mortlock, D.J.2004, astro-ph/0406604
Mukherjee, P. & Wang, Y. 2004, astro-ph/0402602Naselsky, P.D., Doroshkevich, A.G. & Verkhodanov, O.V. 2003,
ApJ, 599, L53Page, L. et al. 2003, ApJS, 148, 39Park, C.-G. 2004, MNRAS, 349, 313Prunet, S., Uzan, J.-P., Bernardeau, F. & Brunier, T. 2004, astro-
ph/0406364Vielva, P., Martınez-Gonzalez, E., Barreiro, R.B., Sanz, J.L. &
Cayon, L. 2004, ApJ, 609, 22
c© 2001 RAS, MNRAS 000, 1–??
Figure 5: Kurtosis, Max, and HC after the ring removed from theWMAP. No detection of nonGaussianity at the level ≥ 90%.

Jiashun Jin, Purdue University, 10/11/2005 37
'
&
$
%
Comparison to Other Works
• Some work has ≥ 99% confidence of nonGaussian detection,and some work identify the cold spot centered at (209o,−57o).
• Our contribution:
– Add new statistics to nonGaussian detection: HC and Max
– Almost equally powerful as kurtosis
– HC offers automatical identification of a tiny portion ofdata as the source of nonGaussianity
– The location of the ring coincide with the cold spotreported by Viela et al. 2004, Cruz et al. 2005

Jiashun Jin, Purdue University, 10/11/2005 38
'
&
$
%
Take Home Messages
• nonGaussian detection in CMB is an exciting filed
• Higher Criticism is a promising new detection tool, adds morediscussion to nonGaussian detection
• better answer is expected in future study with a larger n