higher education coordinating board october 27, 2009 university of washington tacoma
DESCRIPTION
The Role of Transfer in the Attainment of Bachelor’s Degrees at Washington Public Baccalaureate Institutions, Class of 2006. Higher Education Coordinating Board October 27, 2009 University of Washington Tacoma. Method and Questions. Used combined PCHEES & SBCTC data files - PowerPoint PPT PresentationTRANSCRIPT
The Role of Transfer in the Attainment of Bachelor’s
Degrees at Washington Public Baccalaureate Institutions, Class
of 2006
Higher Education Coordinating BoardOctober 27, 2009
University of Washington Tacoma
1

Method and Questions
• Used combined PCHEES & SBCTC data files
• Conducted by Paul Stern, Kirby Pitman, and Dave Pavelchek, SESRC – Puget Sound Division
• Examined academic and background characteristics of 2006 Public Baccalaureate Graduates (n=19,272), including by:• campus type – (main, branch, and center)• % transfer vs. direct entry• type of two-year degree earned• enrollment in pre-college English or math• successful degree completion (by 6 broad major
areas)2

Limitations
• Some variables were not available in the developing database (e.g. earned credits, etc.)
• Some data were missing, particularly transfer credits from institutions other than Washington Community and Technical Colleges
• Some data were collected inconsistently by colleges (e.g. dual credit)
3

Public degree production has grown rapidly at centers, branch campuses, and other off-campus
locations
4

Most graduates enrolled in courses at two or more
colleges
5,728 6,269
2,799
3,4671,009
0
2,500
5,000
7,500
10,000
Direct Entry N=9,195
CTC TransferN=7,278
Other Transfer
Graduate Distribution by Transfer Status –Student Counts
Less than 40 Transfer Credits
NoTransferCredits
Transferred with a Two-Year Degree
Transferred without a Two-Year Degree
5
Type of Student # %
Direct Entry 7,918 41%
CTC Transfers 7,278 38%
Other Transfer 2,799 15%
Unknown 1,277 6%
TOTAL 19,272 100%

Direct entry students tended to be younger (under 25) than transfer
students
6
Transfer Status by Age at Graduation
0
2,500
5,000
7,500
10,000
Direct Entry (9,191)
CTC Transfers(7,278)
Other Transfer (2,797)
30+
25-29
Under 25

The student population at branches and centers are older . . .
7
Campus Type by Age at Graduation
68%79% 71%
35% 26%
18%14%
18%
27%24%
14%7% 11%
38%50%
0%
25%
50%
75%
100%
Total
(N=19
,266)
Resea
rch U
niv (N
=9,291
)
Region
al Com
p. (N=6,7
21)
Branch
Cam
pus (N
=1,933
)
Center
(N=1,3
21)
Under 25 25-29 30+

. . . and more are transfer students
8
67%
71%
34%
29%
23%
27%
14%
11%
11%
2%
52%
59%
0% 25% 50% 75% 100%
Center (N=1,321)
Branch Campus (N=1,933)
Regional Comp (N=6,726)
Research Univ (N=9,292)
Transfer Status by Campus Type
CTC Transfers Other Transfer Direct Entry

The majority of CTC transfer students successfully completed remedial
coursework and went on to complete a Bachelor’s degree
Percentage of CTC Transfers Enrolled inPre-College Math and English (N=7,278)
No Pre-College Courses
(N=2,763)38%
Pre-College English (N=457)
6%
Pre-College English & Math
(N=1,013)14%
Pre-College Math (N=3,045)
42%
9

More than 4,500 students successfully completed remedial coursework at a CTC in
English or Math and progressed to a bachelor’s degree
Percentage of CTC Transfers by Major Enrolled in Pre-College Math and English
18%25%
19% 20% 24%17%
22%
60%50%
65%
35%
56% 60%70%
0%
25%
50%
75%
100%
Arts &Letters
(N=1,835)
Business (N=1,413)
Education (N=526)
STEM (N=1,067)
Health (N=290)
Soc Sci (N=1,372)
Other (N=775)
Pre-College English Pre-College Math
35% of STEM graduates (n=232) and 50% of business graduates (n=505) took pre-college math
10
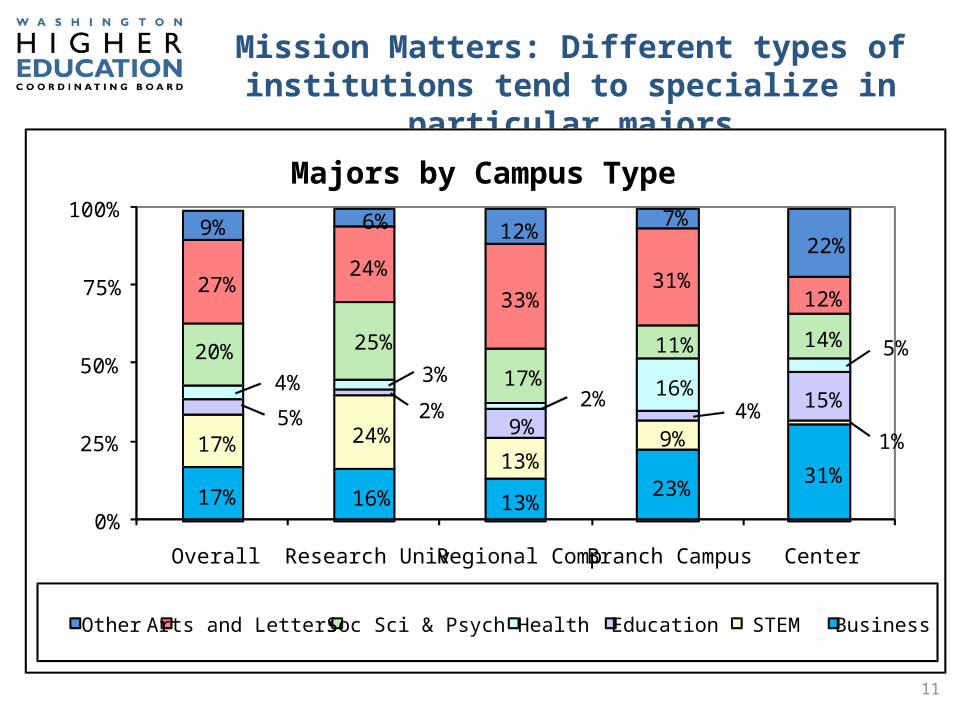
Mission Matters: Different types of institutions tend to specialize in
particular majors
Distribution of Majors by Campus Type
11
17% 16% 13%23%
31%
17% 24%13%
9% 1%5% 2%
9%4% 15%
4% 3%2% 16%
5%20% 25%
17%
11% 14%
27%24%
33%31%
12%
9% 6% 12%7%
22%
0%
25%
50%
75%
100%
Overall Research Univ Regional Comp Branch Campus Center
Majors by Campus Type
Other Arts and Letters Soc Sci & Psych Health Education STEM Business

Transfer Pathways seem to be effective
48 out of 53 students completing the Business DTA/MRP earned a bachelor’s degree in business
12
Median Credits Attempted/Earned Toward Business Degree
208.5 credits 199.5 207.0 211.0
242.0
Total (N=1,211)
BusinessDTA
(N=44)
DTA (N=923)
No AAEarned (N=175)
Technicaland OtherDegree (N=69)

Transfer Pathways seem to be effective
Median Credits Attempted/Earned Toward STEM Degree
238.5 234.0 240.0 236.0
283.0
Total (N=1,008)
AS Track1 &Track 2 (N=204)
DTA (N=530)
No AAEarned (N=202)
Technicaland OtherDegree (N=72)
145 out of 152 students completing an A. S. Track 2 (engineering/physics) completed a bachelor’s degree in a STEM-related major
68 out of 83 students earning an A. S. Track 1 (biology/chemistry) majored in either STEM or health
13

Next Steps
• Continue working with Education Research and Data Center (ERDC) to improve PCHEES data set. – Capture earned as well as attempted credits
• Identify core questions for longitudinal studies about transfer, as well as any additional questions more suitable for periodic studies.
• Consider the pro’s and con’s in integrating the two transfer studies we currently conduct into one report.
14