higher education in england: provision, skills and · pdf filehigher education in england:...
TRANSCRIPT
HIGHER EDUCATION IN ENGLAND: PROVISION, SKILLS AND GRADUATES
1
CONTENTS
PREFACE: UNIVERSITIES UK REVIEW OF SKILLS ............................................................. 2
INTRODUCTION .................................................................................................................... 3
1. DIVERSITY OF HIGHER EDUCATION PROVISION ........................................................... 4
2. HIGHER EDUCATION PROVISION AND SKILLS DEVELOPMENT: GRADUATE
PERSPECTIVES ................................................................................................................. 15
3. GRADUATE DESTINATIONS .......................................................................................... 20
4. TRANSITIONING INTO – AND SUCCEEDING IN – THE LABOUR MARKET: WHAT
SKILLS AND EXPERIENCE MATTER MOST? .................................................................... 28
ANNEXE: LIST OF TRANSFERABLE SKILLS ..................................................................... 35
2
PREFACE: UNIVERSITIES UK REVIEW OF SKILLS
This paper provides background evidence and identifies questions to be explored in
the Review of Skills being conducted by Universities UK in autumn 2016.
As this paper will go on to describe, it is clear that graduates develop many skills that
are valued by employers, and employment rates for graduates remain high. There
are, however, challenges for the higher education sector. It must continue to work
with employers to ensure that skills gaps are addressed, that skills mismatches are
reduced, that graduates continue to meet employers’ needs, and that opportunities
available to all students and graduates to develop skills and improve employability
are enhanced.
The UUK Review of Skills, through a survey of providers and a wider call for
evidence, especially from employers, will aim to get a better understanding of what
universities and employers are doing to address these challenges, what works best for
which employers and students, and what universities and employers will need to do
in the future.
3
INTRODUCTION
During 2014–15 the UK higher education sector catered to over two million students
who hailed from approximately 200 countries and studied over 90 different types of
courses, across 1,000+ different detailed subjects. These students attended nearly
800 institutions, which can be categorised into three broad types: higher education
institutions, which are traditionally universities, further education colleges (FECs)
and alternative providers (APs). There is also increasing complexity in the policy
environments and priorities for higher education in the different nations of the UK. It
is, therefore, a sector with an immensely diverse set of students, practices, aims,
outcomes and challenges.
There are various sets of data available on the different parts of the sector in the
different parts of the UK relating to types of programmes, level and mode of study
and outcomes of these programmes in terms of skills and employment. In an
environment where the nature of funding for teaching is changing, especially in
England, there is an increased focus on value and the link between qualifications and
positive outcomes for graduates, for example with the development of the Teaching
Excellence Framework in England.
This paper provides a high-level summary of higher education provision while
linking, at a rather aggregate level, this provision to graduates’ skills development
and destinations, such as further study, employment and earnings patterns. While it
discusses what we know about the links between qualification, skills development
and graduate outcomes it also seeks to pinpoint what we don’t know and where there
are pertinent – but realistic – avenues for further investigation.
In this paper, the term ‘higher education sector’ refers to all higher education
provision, be it at a traditional university (which we often refer to as a higher
education institution), an FEC, or an AP, regardless of whether they are non-profit or
profit. Higher education provision itself refers to any course that is designated as
Level4+ on the Quality Assurance Agency’s Framework for Higher Education
Qualifications system.
Where possible, we combine data on all three types of higher education providers,
though due to the limited nature of FEC and AP data we often focus on traditional
universities. This is particularly the case for graduate outcomes data, where unless
otherwise noted, Destinations of Leavers from Higher Education (DLHE)data, for
universities only, is used. As a result of limited FEC and AP data, we also focus on
those institutions located within England in chapter 1, on provision. An added
dimension deserving of further consideration and analysis is the regional and local
dimension of provision, skills needs and labour markets; this analysis has focused on
the data for England as a whole.
4
1. DIVERSITY OF HIGHER EDUCATION PROVISION
Level of study
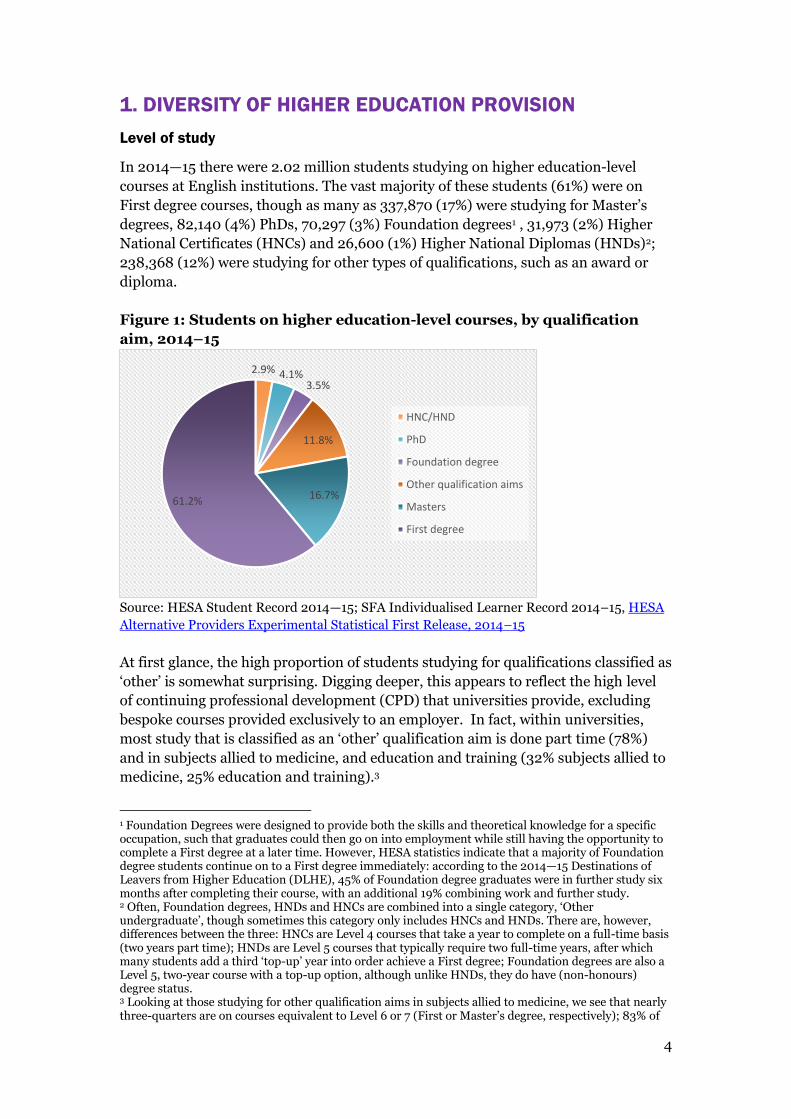
In 2014—15 there were 2.02 million students studying on higher education-level
courses at English institutions. The vast majority of these students (61%) were on
First degree courses, though as many as 337,870 (17%) were studying for Master’s
degrees, 82,140 (4%) PhDs, 70,297 (3%) Foundation degrees1 , 31,973 (2%) Higher
National Certificates (HNCs) and 26,600 (1%) Higher National Diplomas (HNDs)2;
238,368 (12%) were studying for other types of qualifications, such as an award or
diploma.
Figure 1: Students on higher education-level courses, by qualification
aim, 2014–15
Source: HESA Student Record 2014—15; SFA Individualised Learner Record 2014–15, HESA
Alternative Providers Experimental Statistical First Release, 2014–15
At first glance, the high proportion of students studying for qualifications classified as
‘other’ is somewhat surprising. Digging deeper, this appears to reflect the high level
of continuing professional development (CPD) that universities provide, excluding
bespoke courses provided exclusively to an employer. In fact, within universities,
most study that is classified as an ‘other’ qualification aim is done part time (78%)
and in subjects allied to medicine, and education and training (32% subjects allied to
medicine, 25% education and training).3
1 Foundation Degrees were designed to provide both the skills and theoretical knowledge for a specific occupation, such that graduates could then go on into employment while still having the opportunity to complete a First degree at a later time. However, HESA statistics indicate that a majority of Foundation degree students continue on to a First degree immediately: according to the 2014—15 Destinations of Leavers from Higher Education (DLHE), 45% of Foundation degree graduates were in further study six months after completing their course, with an additional 19% combining work and further study. 2 Often, Foundation degrees, HNDs and HNCs are combined into a single category, ‘Other undergraduate’, though sometimes this category only includes HNCs and HNDs. There are, however, differences between the three: HNCs are Level 4 courses that take a year to complete on a full-time basis (two years part time); HNDs are Level 5 courses that typically require two full-time years, after which many students add a third ‘top-up’ year into order achieve a First degree; Foundation degrees are also a Level 5, two-year course with a top-up option, although unlike HNDs, they do have (non-honours) degree status. 3 Looking at those studying for other qualification aims in subjects allied to medicine, we see that nearly three-quarters are on courses equivalent to Level 6 or 7 (First or Master’s degree, respectively); 83% of
2.9% 4.1%3.5%
11.8%
16.7%61.2%
HNC/HND
PhD
Foundation degree
Other qualification aims
Masters
First degree
5
Place of study
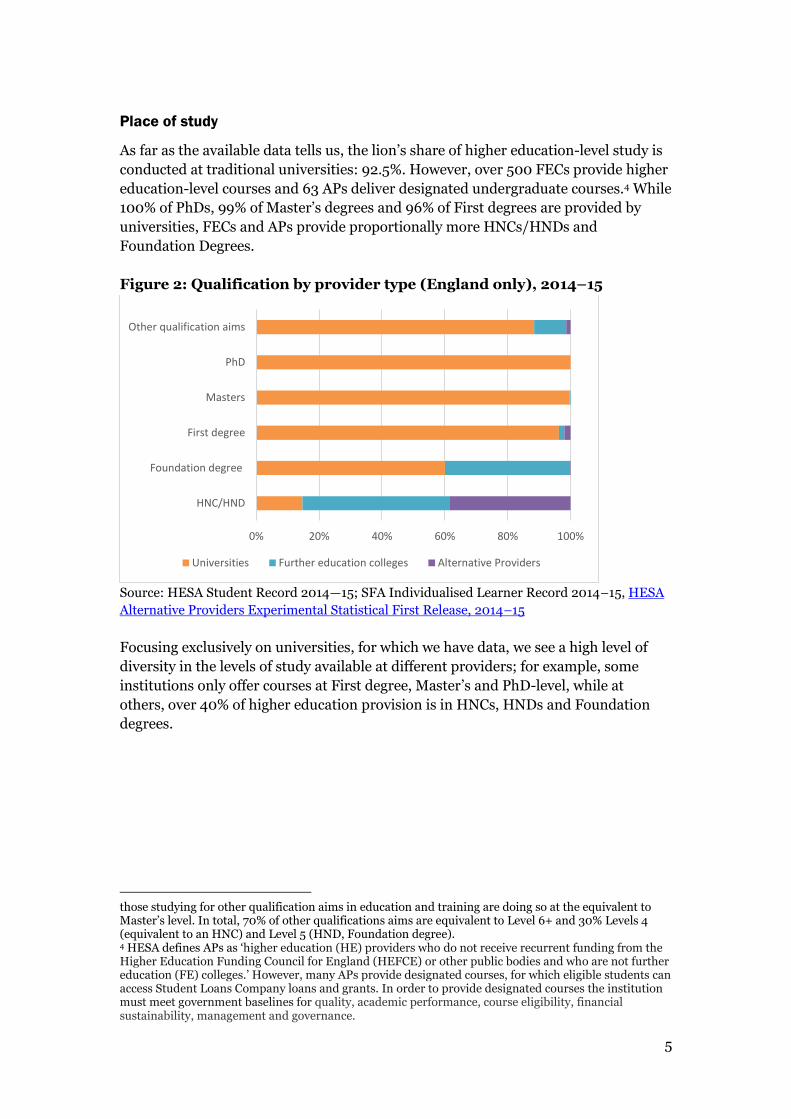
As far as the available data tells us, the lion’s share of higher education-level study is
conducted at traditional universities: 92.5%. However, over 500 FECs provide higher
education-level courses and 63 APs deliver designated undergraduate courses.4 While
100% of PhDs, 99% of Master’s degrees and 96% of First degrees are provided by
universities, FECs and APs provide proportionally more HNCs/HNDs and
Foundation Degrees.
Figure 2: Qualification by provider type (England only), 2014–15
Source: HESA Student Record 2014—15; SFA Individualised Learner Record 2014–15, HESA
Alternative Providers Experimental Statistical First Release, 2014–15
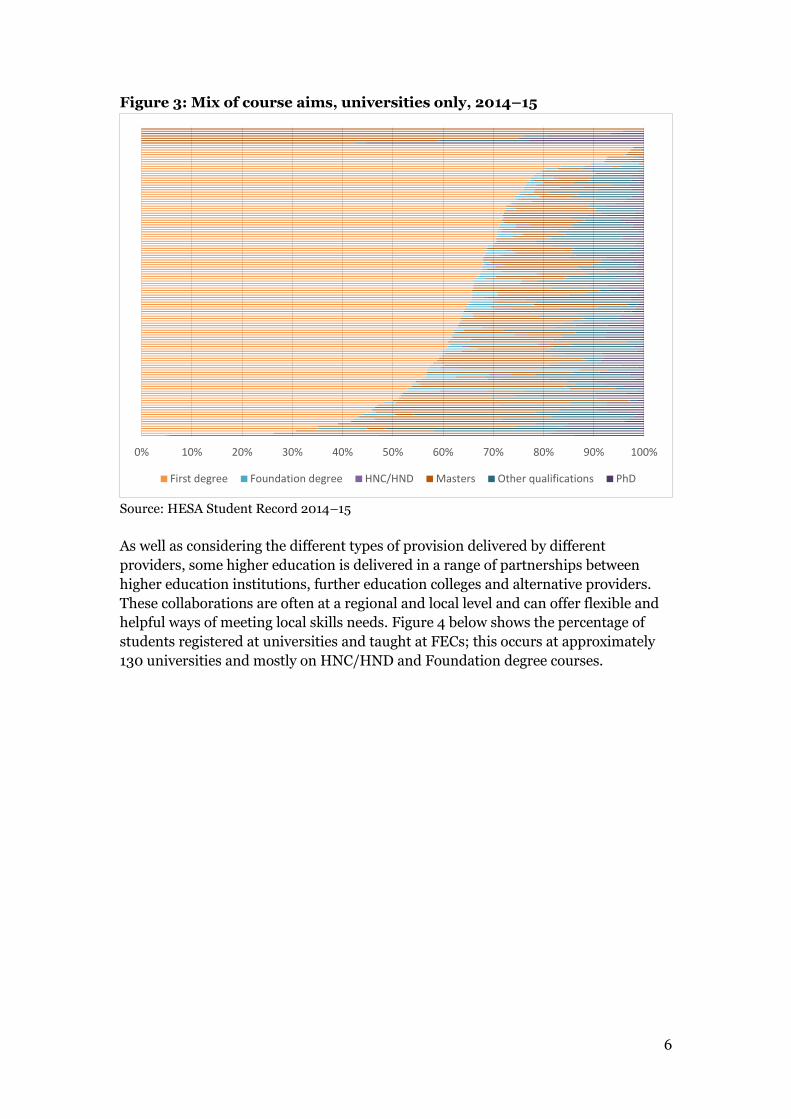
Focusing exclusively on universities, for which we have data, we see a high level of
diversity in the levels of study available at different providers; for example, some
institutions only offer courses at First degree, Master’s and PhD-level, while at
others, over 40% of higher education provision is in HNCs, HNDs and Foundation
degrees.
those studying for other qualification aims in education and training are doing so at the equivalent to Master’s level. In total, 70% of other qualifications aims are equivalent to Level 6+ and 30% Levels 4 (equivalent to an HNC) and Level 5 (HND, Foundation degree). 4 HESA defines APs as ‘higher education (HE) providers who do not receive recurrent funding from the Higher Education Funding Council for England (HEFCE) or other public bodies and who are not further education (FE) colleges.’ However, many APs provide designated courses, for which eligible students can access Student Loans Company loans and grants. In order to provide designated courses the institution must meet government baselines for quality, academic performance, course eligibility, financial sustainability, management and governance.
0% 20% 40% 60% 80% 100%
HNC/HND
Foundation degree
First degree
Masters
PhD
Other qualification aims
Universities Further education colleges Alternative Providers
6
Figure 3: Mix of course aims, universities only, 2014–15
Source: HESA Student Record 2014–15
As well as considering the different types of provision delivered by different
providers, some higher education is delivered in a range of partnerships between
higher education institutions, further education colleges and alternative providers.
These collaborations are often at a regional and local level and can offer flexible and
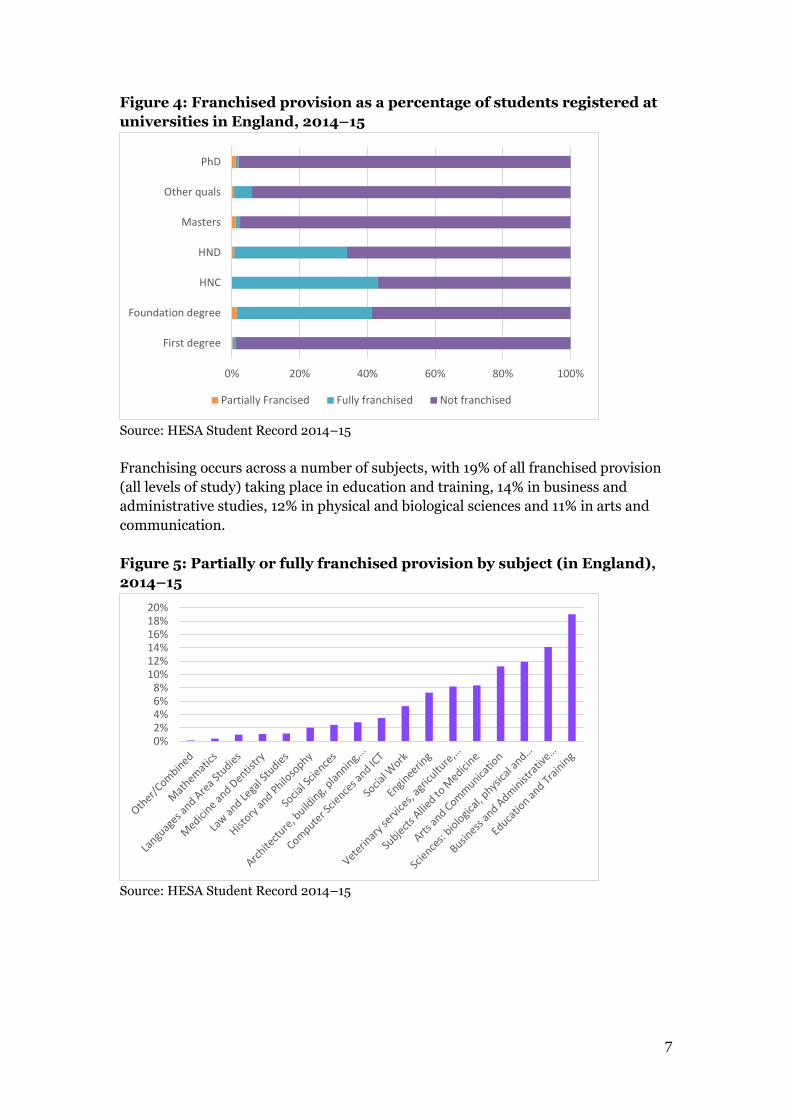
helpful ways of meeting local skills needs. Figure 4 below shows the percentage of
students registered at universities and taught at FECs; this occurs at approximately
130 universities and mostly on HNC/HND and Foundation degree courses.
0% 10% 20% 30% 40% 50% 60% 70% 80% 90% 100%
First degree Foundation degree HNC/HND Masters Other qualifications PhD
7
Figure 4: Franchised provision as a percentage of students registered at
universities in England, 2014–15
Source: HESA Student Record 2014–15
Franchising occurs across a number of subjects, with 19% of all franchised provision
(all levels of study) taking place in education and training, 14% in business and
administrative studies, 12% in physical and biological sciences and 11% in arts and
communication.
Figure 5: Partially or fully franchised provision by subject (in England),
2014–15
Source: HESA Student Record 2014–15
0% 20% 40% 60% 80% 100%
First degree
Foundation degree
HNC
HND
Masters
Other quals
PhD
Partially Francised Fully franchised Not franchised
0%2%4%6%8%
10%12%14%16%18%20%
8
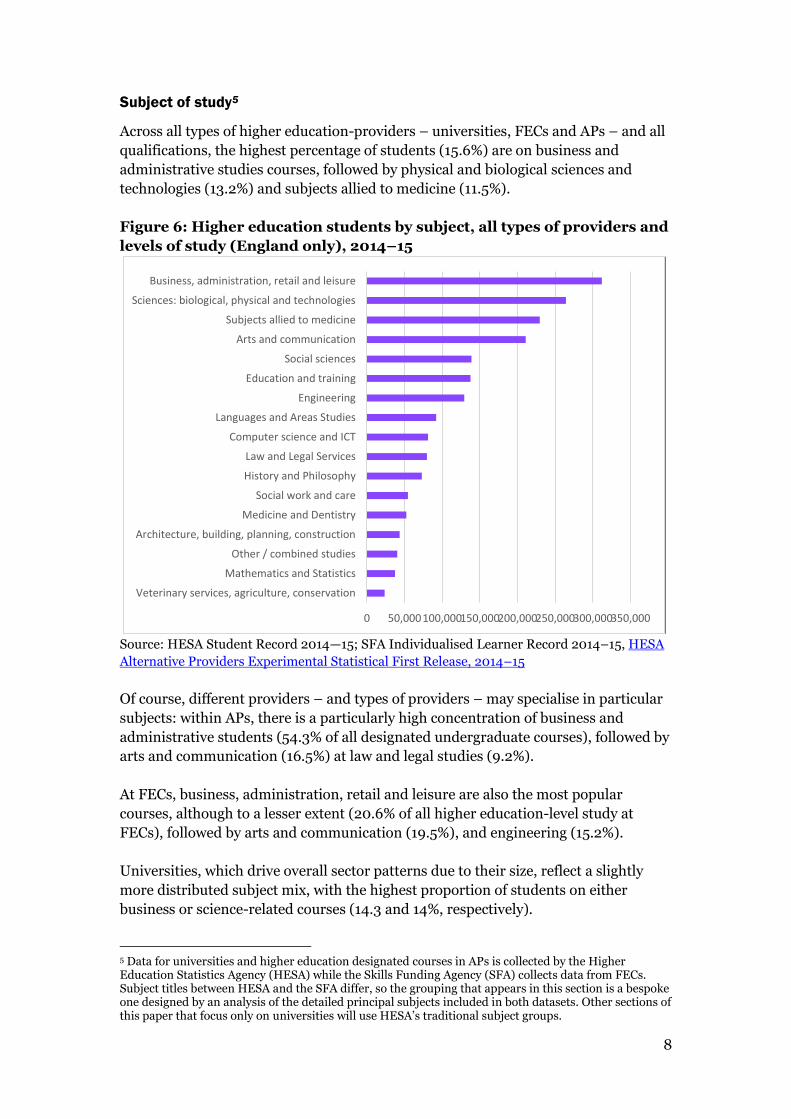
Subject of study5
Across all types of higher education-providers – universities, FECs and APs – and all
qualifications, the highest percentage of students (15.6%) are on business and
administrative studies courses, followed by physical and biological sciences and
technologies (13.2%) and subjects allied to medicine (11.5%).
Figure 6: Higher education students by subject, all types of providers and
levels of study (England only), 2014–15
Source: HESA Student Record 2014—15; SFA Individualised Learner Record 2014–15, HESA
Alternative Providers Experimental Statistical First Release, 2014–15
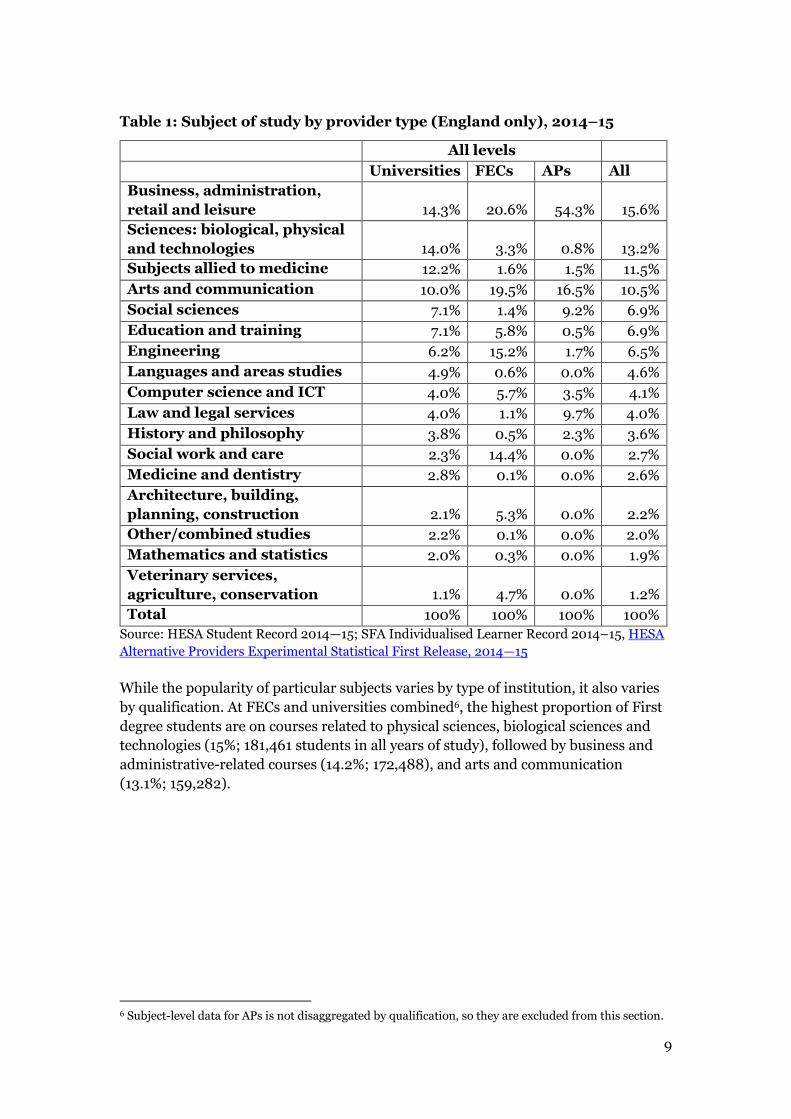
Of course, different providers – and types of providers – may specialise in particular
subjects: within APs, there is a particularly high concentration of business and
administrative students (54.3% of all designated undergraduate courses), followed by
arts and communication (16.5%) at law and legal studies (9.2%).
At FECs, business, administration, retail and leisure are also the most popular
courses, although to a lesser extent (20.6% of all higher education-level study at
FECs), followed by arts and communication (19.5%), and engineering (15.2%).
Universities, which drive overall sector patterns due to their size, reflect a slightly
more distributed subject mix, with the highest proportion of students on either
business or science-related courses (14.3 and 14%, respectively).
5 Data for universities and higher education designated courses in APs is collected by the Higher Education Statistics Agency (HESA) while the Skills Funding Agency (SFA) collects data from FECs. Subject titles between HESA and the SFA differ, so the grouping that appears in this section is a bespoke one designed by an analysis of the detailed principal subjects included in both datasets. Other sections of this paper that focus only on universities will use HESA’s traditional subject groups.
0 50,000100,000150,000200,000250,000300,000350,000
Veterinary services, agriculture, conservation
Mathematics and Statistics
Other / combined studies
Architecture, building, planning, construction
Medicine and Dentistry
Social work and care
History and Philosophy
Law and Legal Services
Computer science and ICT
Languages and Areas Studies
Engineering
Education and training
Social sciences
Arts and communication
Subjects allied to medicine
Sciences: biological, physical and technologies
Business, administration, retail and leisure
9
Table 1: Subject of study by provider type (England only), 2014–15
All levels
Universities FECs APs All
Business, administration,
retail and leisure 14.3% 20.6% 54.3% 15.6%
Sciences: biological, physical
and technologies 14.0% 3.3% 0.8% 13.2%
Subjects allied to medicine 12.2% 1.6% 1.5% 11.5%
Arts and communication 10.0% 19.5% 16.5% 10.5%
Social sciences 7.1% 1.4% 9.2% 6.9%
Education and training 7.1% 5.8% 0.5% 6.9%
Engineering 6.2% 15.2% 1.7% 6.5%
Languages and areas studies 4.9% 0.6% 0.0% 4.6%
Computer science and ICT 4.0% 5.7% 3.5% 4.1%
Law and legal services 4.0% 1.1% 9.7% 4.0%
History and philosophy 3.8% 0.5% 2.3% 3.6%
Social work and care 2.3% 14.4% 0.0% 2.7%
Medicine and dentistry 2.8% 0.1% 0.0% 2.6%
Architecture, building,
planning, construction 2.1% 5.3% 0.0% 2.2%
Other/combined studies 2.2% 0.1% 0.0% 2.0%
Mathematics and statistics 2.0% 0.3% 0.0% 1.9%
Veterinary services,
agriculture, conservation 1.1% 4.7% 0.0% 1.2%
Total 100% 100% 100% 100%
Source: HESA Student Record 2014—15; SFA Individualised Learner Record 2014–15, HESA
Alternative Providers Experimental Statistical First Release, 2014—15
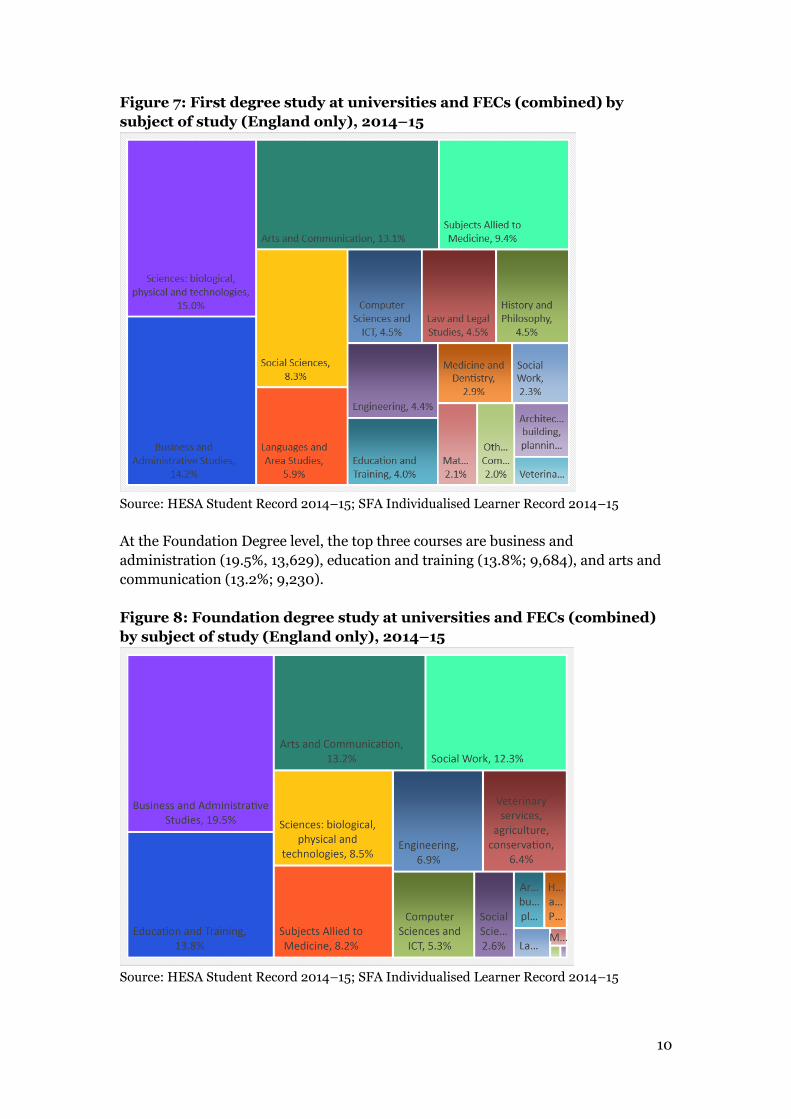
While the popularity of particular subjects varies by type of institution, it also varies
by qualification. At FECs and universities combined6, the highest proportion of First
degree students are on courses related to physical sciences, biological sciences and
technologies (15%; 181,461 students in all years of study), followed by business and
administrative-related courses (14.2%; 172,488), and arts and communication
(13.1%; 159,282).
6 Subject-level data for APs is not disaggregated by qualification, so they are excluded from this section.
10
Figure 7: First degree study at universities and FECs (combined) by
subject of study (England only), 2014–15
Source: HESA Student Record 2014–15; SFA Individualised Learner Record 2014–15
At the Foundation Degree level, the top three courses are business and
administration (19.5%, 13,629), education and training (13.8%; 9,684), and arts and
communication (13.2%; 9,230).
Figure 8: Foundation degree study at universities and FECs (combined)
by subject of study (England only), 2014–15
Source: HESA Student Record 2014–15; SFA Individualised Learner Record 2014–15
11
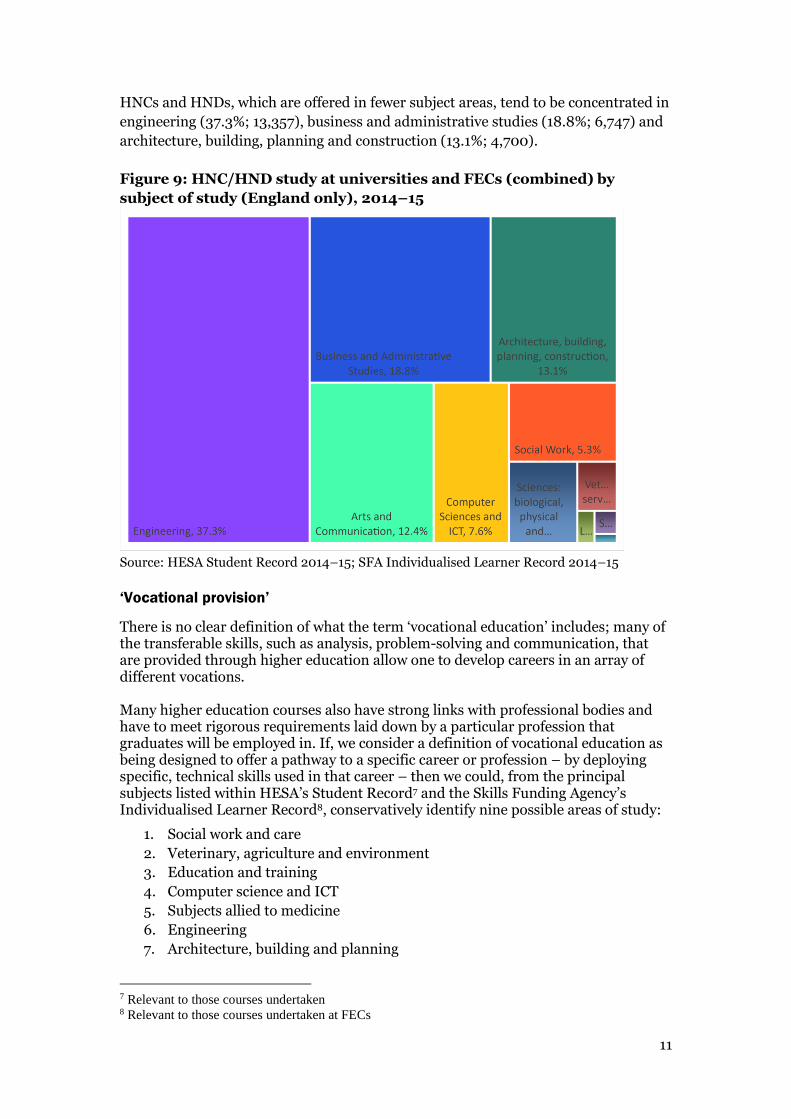
HNCs and HNDs, which are offered in fewer subject areas, tend to be concentrated in
engineering (37.3%; 13,357), business and administrative studies (18.8%; 6,747) and
architecture, building, planning and construction (13.1%; 4,700).
Figure 9: HNC/HND study at universities and FECs (combined) by
subject of study (England only), 2014–15
Source: HESA Student Record 2014–15; SFA Individualised Learner Record 2014–15
‘Vocational provision’
There is no clear definition of what the term ‘vocational education’ includes; many of the transferable skills, such as analysis, problem-solving and communication, that are provided through higher education allow one to develop careers in an array of different vocations. Many higher education courses also have strong links with professional bodies and have to meet rigorous requirements laid down by a particular profession that graduates will be employed in. If, we consider a definition of vocational education as being designed to offer a pathway to a specific career or profession – by deploying specific, technical skills used in that career – then we could, from the principal subjects listed within HESA’s Student Record7 and the Skills Funding Agency’s Individualised Learner Record8, conservatively identify nine possible areas of study:
1. Social work and care
2. Veterinary, agriculture and environment
3. Education and training
4. Computer science and ICT
5. Subjects allied to medicine
6. Engineering
7. Architecture, building and planning
7 Relevant to those courses undertaken 8 Relevant to those courses undertaken at FECs
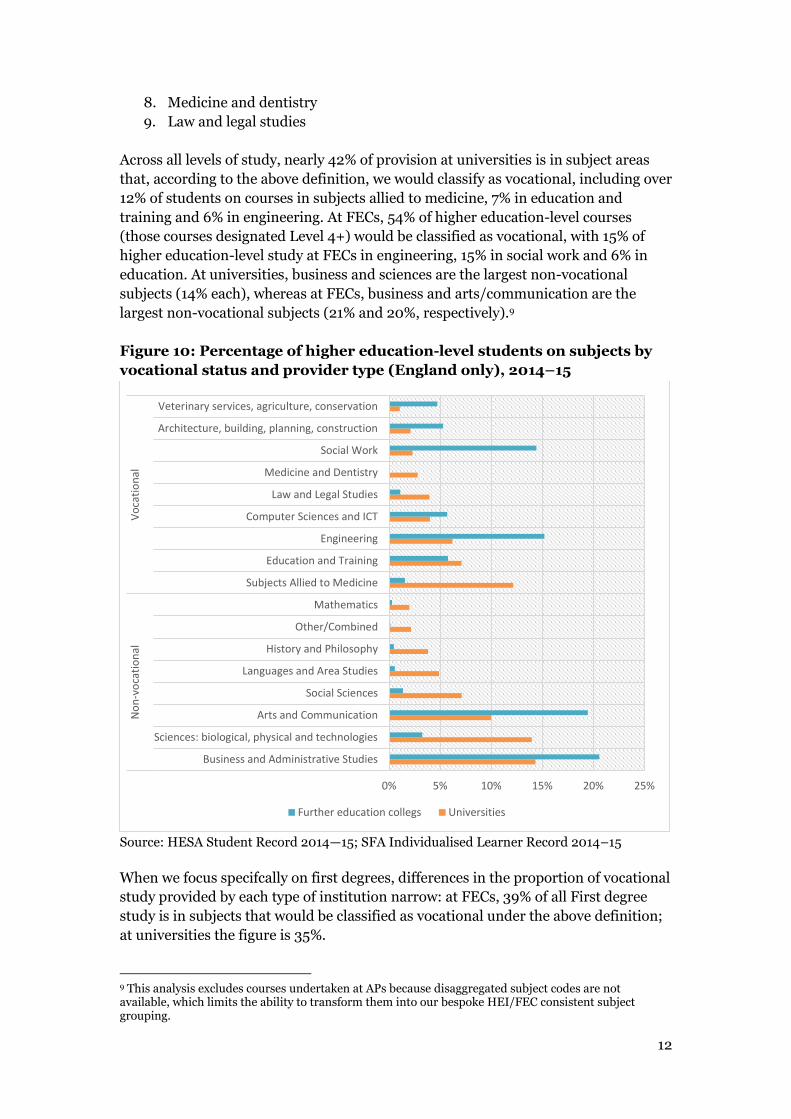
12
8. Medicine and dentistry
9. Law and legal studies
Across all levels of study, nearly 42% of provision at universities is in subject areas
that, according to the above definition, we would classify as vocational, including over
12% of students on courses in subjects allied to medicine, 7% in education and
training and 6% in engineering. At FECs, 54% of higher education-level courses
(those courses designated Level 4+) would be classified as vocational, with 15% of
higher education-level study at FECs in engineering, 15% in social work and 6% in
education. At universities, business and sciences are the largest non-vocational
subjects (14% each), whereas at FECs, business and arts/communication are the
largest non-vocational subjects (21% and 20%, respectively).9
Figure 10: Percentage of higher education-level students on subjects by
vocational status and provider type (England only), 2014–15
Source: HESA Student Record 2014—15; SFA Individualised Learner Record 2014–15
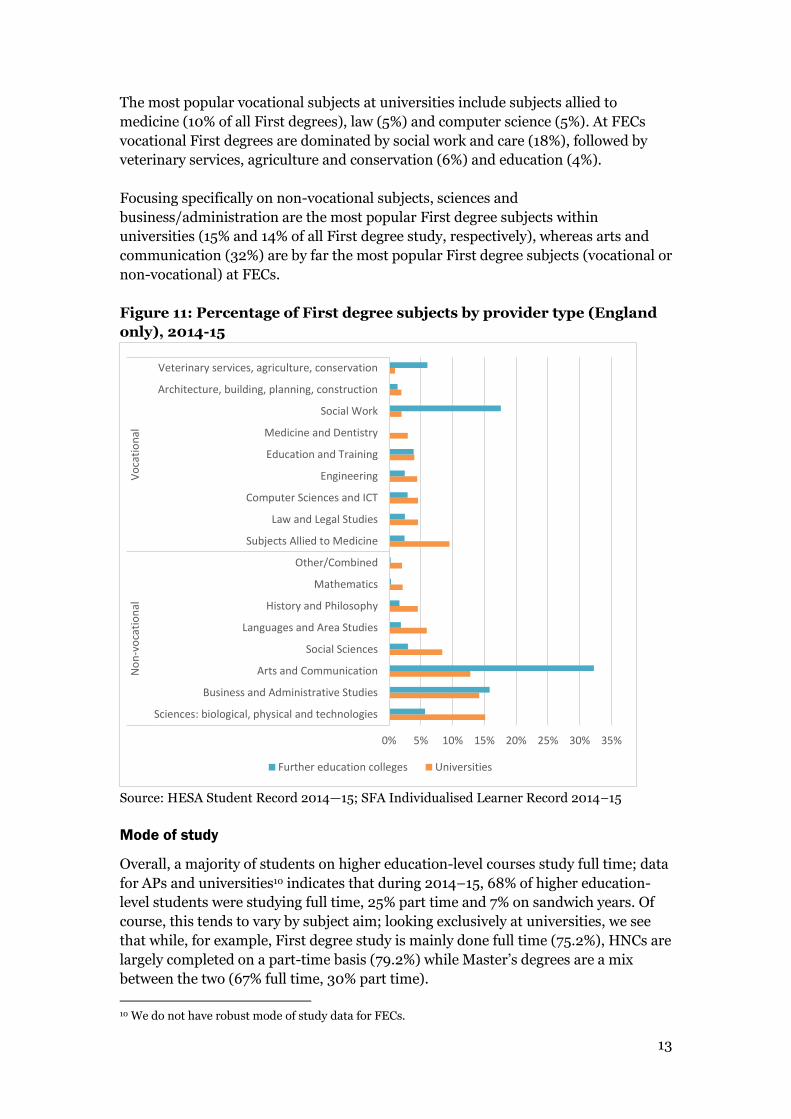
When we focus specifcally on first degrees, differences in the proportion of vocational
study provided by each type of institution narrow: at FECs, 39% of all First degree
study is in subjects that would be classified as vocational under the above definition;
at universities the figure is 35%.
9 This analysis excludes courses undertaken at APs because disaggregated subject codes are not available, which limits the ability to transform them into our bespoke HEI/FEC consistent subject grouping.
0% 5% 10% 15% 20% 25%
Business and Administrative Studies
Sciences: biological, physical and technologies
Arts and Communication
Social Sciences
Languages and Area Studies
History and Philosophy
Other/Combined
Mathematics
Subjects Allied to Medicine
Education and Training
Engineering
Computer Sciences and ICT
Law and Legal Studies
Medicine and Dentistry
Social Work
Architecture, building, planning, construction
Veterinary services, agriculture, conservation
No
n-v
oca
tio
nal
Vo
cati
on
al
Further education collegs Universities
13
The most popular vocational subjects at universities include subjects allied to
medicine (10% of all First degrees), law (5%) and computer science (5%). At FECs
vocational First degrees are dominated by social work and care (18%), followed by
veterinary services, agriculture and conservation (6%) and education (4%).
Focusing specifically on non-vocational subjects, sciences and
business/administration are the most popular First degree subjects within
universities (15% and 14% of all First degree study, respectively), whereas arts and
communication (32%) are by far the most popular First degree subjects (vocational or
non-vocational) at FECs.
Figure 11: Percentage of First degree subjects by provider type (England
only), 2014-15
Source: HESA Student Record 2014—15; SFA Individualised Learner Record 2014–15
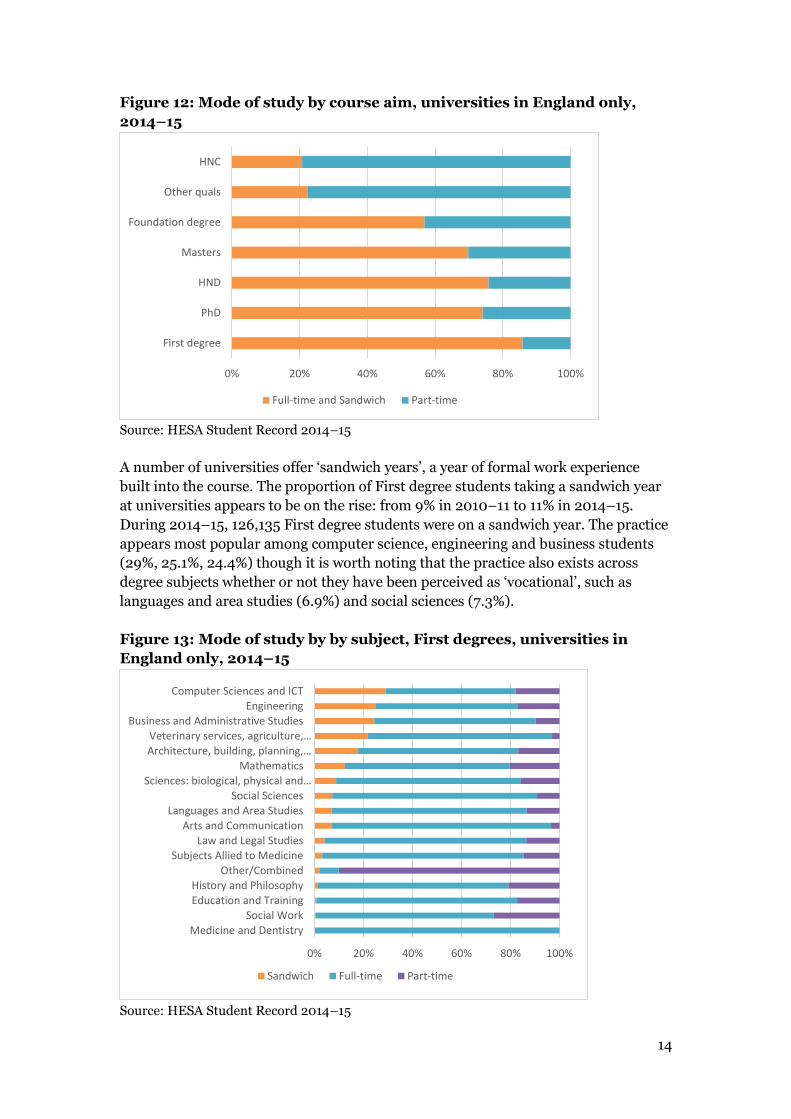
Mode of study
Overall, a majority of students on higher education-level courses study full time; data
for APs and universities10 indicates that during 2014–15, 68% of higher education-
level students were studying full time, 25% part time and 7% on sandwich years. Of
course, this tends to vary by subject aim; looking exclusively at universities, we see
that while, for example, First degree study is mainly done full time (75.2%), HNCs are
largely completed on a part-time basis (79.2%) while Master’s degrees are a mix
between the two (67% full time, 30% part time).
10 We do not have robust mode of study data for FECs.
0% 5% 10% 15% 20% 25% 30% 35%
Sciences: biological, physical and technologies
Business and Administrative Studies
Arts and Communication
Social Sciences
Languages and Area Studies
History and Philosophy
Mathematics
Other/Combined
Subjects Allied to Medicine
Law and Legal Studies
Computer Sciences and ICT
Engineering
Education and Training
Medicine and Dentistry
Social Work
Architecture, building, planning, construction
Veterinary services, agriculture, conservation
No
n-v
oca
tio
nal
Vo
cati
on
al
Further education colleges Universities
14
Figure 12: Mode of study by course aim, universities in England only,
2014–15
Source: HESA Student Record 2014–15
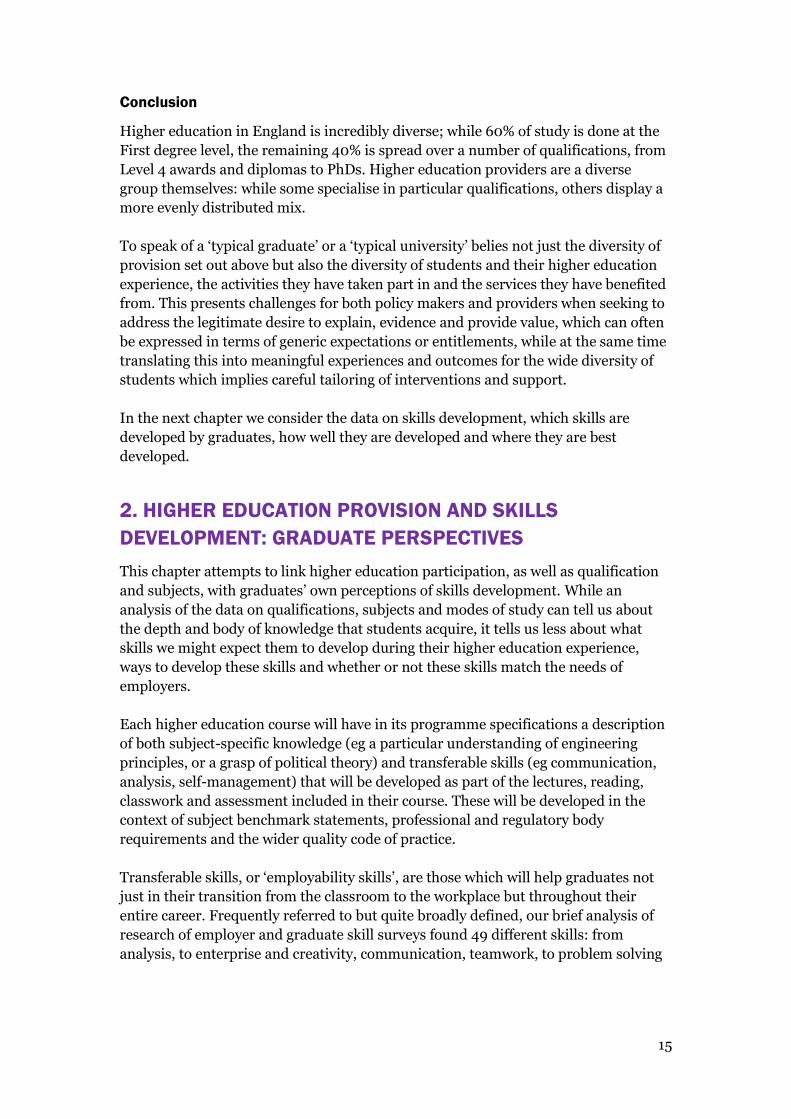
A number of universities offer ‘sandwich years’, a year of formal work experience
built into the course. The proportion of First degree students taking a sandwich year
at universities appears to be on the rise: from 9% in 2010–11 to 11% in 2014–15.
During 2014–15, 126,135 First degree students were on a sandwich year. The practice
appears most popular among computer science, engineering and business students
(29%, 25.1%, 24.4%) though it is worth noting that the practice also exists across
degree subjects whether or not they have been perceived as ‘vocational’, such as
languages and area studies (6.9%) and social sciences (7.3%).
Figure 13: Mode of study by by subject, First degrees, universities in
England only, 2014–15
Source: HESA Student Record 2014–15
0% 20% 40% 60% 80% 100%
First degree
PhD
HND
Masters
Foundation degree
Other quals
HNC
Full-time and Sandwich Part-time
0% 20% 40% 60% 80% 100%
Medicine and Dentistry
Social WorkEducation and Training
History and PhilosophyOther/Combined
Subjects Allied to MedicineLaw and Legal Studies
Arts and Communication
Languages and Area Studies
Social SciencesSciences: biological, physical and…
MathematicsArchitecture, building, planning,…Veterinary services, agriculture,…
Business and Administrative StudiesEngineering
Computer Sciences and ICT
Sandwich Full-time Part-time
15
Conclusion
Higher education in England is incredibly diverse; while 60% of study is done at the
First degree level, the remaining 40% is spread over a number of qualifications, from
Level 4 awards and diplomas to PhDs. Higher education providers are a diverse
group themselves: while some specialise in particular qualifications, others display a
more evenly distributed mix.
To speak of a ‘typical graduate’ or a ‘typical university’ belies not just the diversity of
provision set out above but also the diversity of students and their higher education
experience, the activities they have taken part in and the services they have benefited
from. This presents challenges for both policy makers and providers when seeking to
address the legitimate desire to explain, evidence and provide value, which can often
be expressed in terms of generic expectations or entitlements, while at the same time
translating this into meaningful experiences and outcomes for the wide diversity of
students which implies careful tailoring of interventions and support.
In the next chapter we consider the data on skills development, which skills are
developed by graduates, how well they are developed and where they are best
developed.
2. HIGHER EDUCATION PROVISION AND SKILLS
DEVELOPMENT: GRADUATE PERSPECTIVES
This chapter attempts to link higher education participation, as well as qualification
and subjects, with graduates’ own perceptions of skills development. While an
analysis of the data on qualifications, subjects and modes of study can tell us about
the depth and body of knowledge that students acquire, it tells us less about what
skills we might expect them to develop during their higher education experience,
ways to develop these skills and whether or not these skills match the needs of
employers.
Each higher education course will have in its programme specifications a description
of both subject-specific knowledge (eg a particular understanding of engineering
principles, or a grasp of political theory) and transferable skills (eg communication,
analysis, self-management) that will be developed as part of the lectures, reading,
classwork and assessment included in their course. These will be developed in the
context of subject benchmark statements, professional and regulatory body
requirements and the wider quality code of practice.
Transferable skills, or ‘employability skills’, are those which will help graduates not
just in their transition from the classroom to the workplace but throughout their
entire career. Frequently referred to but quite broadly defined, our brief analysis of
research of employer and graduate skill surveys found 49 different skills: from
analysis, to enterprise and creativity, communication, teamwork, to problem solving
16
and using IT effectively11 (see the annexe for a complete list). The skills developed
through higher education should equip students with skills that will be relevant
throughout their career but also in different contexts such as volunteering and charity
work, or in setting up their own businesses and social enterprises.
The paragraphs below illustrate the extent to which graduates believe their
experience helped them to develop a number of these transferable and work-related
skills. To a certain extent, aggregating these views at a high level can prove useful:
evidence suggests that in a knowledge economy, employers increasingly expect all
highly-skilled workers to have high-level communication, problem-solving, ICT, team
working and influencing skills12
As far as the data tell us, those with a background in higher education are more likely
to enter the labour force with these skills and capacities, although there are
challenges in identifying the best mechanisms and settings in which students can
develop and hone them.
Graduate perceptions of skills development
The Longitudinal Destinations of Leavers from Higher Education (DLHE) survey,
which asks university leavers what they are doing 40 months after graduation, also
prompts them to reflect on their higher education experience, the skills they feel it
helped them develop and the factors that helped them attain to their current job13.
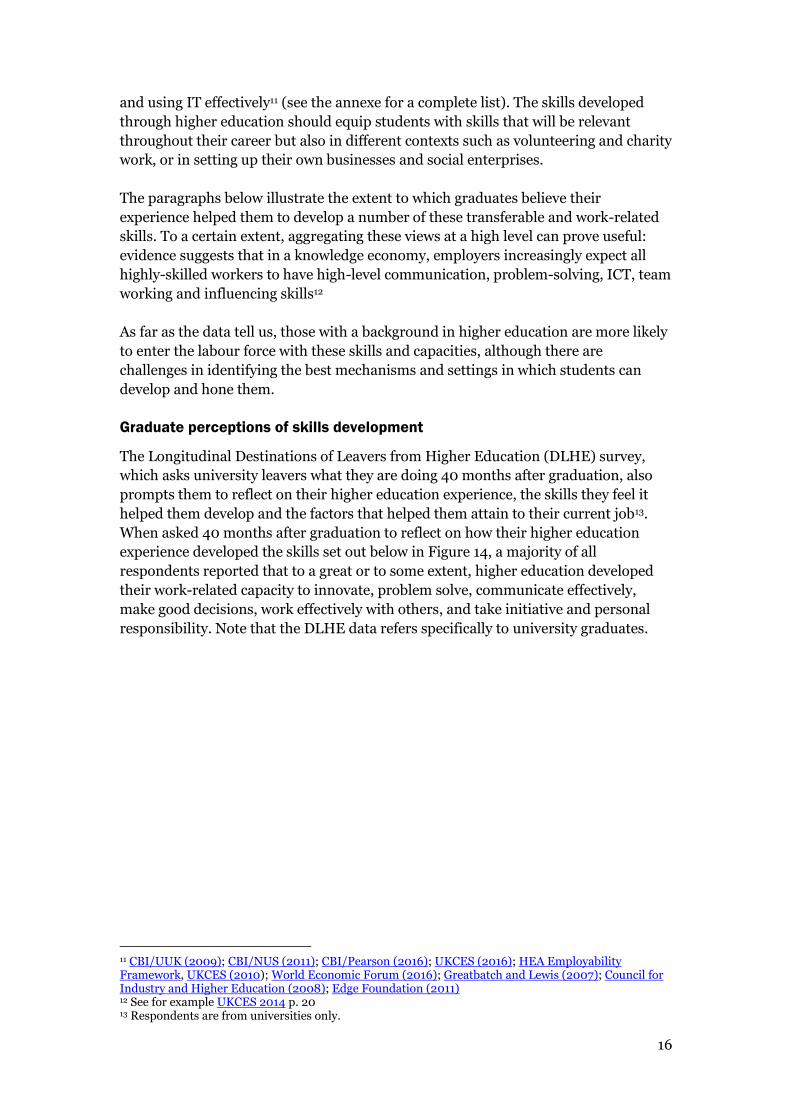
When asked 40 months after graduation to reflect on how their higher education
experience developed the skills set out below in Figure 14, a majority of all
respondents reported that to a great or to some extent, higher education developed
their work-related capacity to innovate, problem solve, communicate effectively,
make good decisions, work effectively with others, and take initiative and personal
responsibility. Note that the DLHE data refers specifically to university graduates.
11 CBI/UUK (2009); CBI/NUS (2011); CBI/Pearson (2016); UKCES (2016); HEA Employability Framework, UKCES (2010); World Economic Forum (2016); Greatbatch and Lewis (2007); Council for Industry and Higher Education (2008); Edge Foundation (2011) 12 See for example UKCES 2014 p. 20 13 Respondents are from universities only.
17
Figure 14: Percentage of 2010–11 UK graduates reporting that their
higher education experience helped them in the workplace (2014)
Source: HESA Longitudinal Destinations of Leavers from Higher Education (2010–11)
Across all levels of study surveyed (taught postgraduate, First degree and other
undergraduate at universities only) a majority of respondents stated that their higher
education experience helped develop all of these skills and capacities to a great extent
or to some extent.14
While a majority of all respondents from all qualifications reported that higher
education developed their numeracy skills, this was the lowest rated skill overall. This
us likely driven by courses’ different aims, which becomes apparent when looking at
variance by subject aim. Postgraduates rated good decision making highest, as
compared to First degree graduates, the largest proportion of whom identified the
capacity to take initiative and personal responsibility, and other undergraduates, who
cited the ability to communicate effectively. However, the overall differences in
perceived skills development between qualifications are quite minimal.
There is some predictable variation by subject. For example, just 32% of language
graduates found that higher education developed their capacity to work effectively
with numbers, as compared to 94% of mathematics graduates. However, there are
also striking similarities across the board. Table 2 is based on the same 2014 survey
of 2010–11 graduates referred to in Figure 14; it focuses on First degree graduates
and breaks their answers down to subject level, with columns denoting the
proportion of respondents who felt that higher education helped them develop
particular skills to some/a great extent.
14 Respondents are from universities only.
84.1%
86.4%
87.4%
85.7%
83.1%
85.1%
55.7%
80.9%
83.9%
87.8%
84.0%
86.6%
87.9%
60.3%
83.3%
82.6%
85.7%
83.9%
84.3%
84.6%
61.9%
0.0%10.0%20.0%30.0%40.0%50.0%60.0%70.0%80.0%90.0%100.0%
Innovative
Problem solve
Communicate effectively
Make good decisions at work
Work effectively w/others
Take initiative and personal responsibility
Work effectively w/numbers
Other undergraduate First degree Postgraduate taught
18
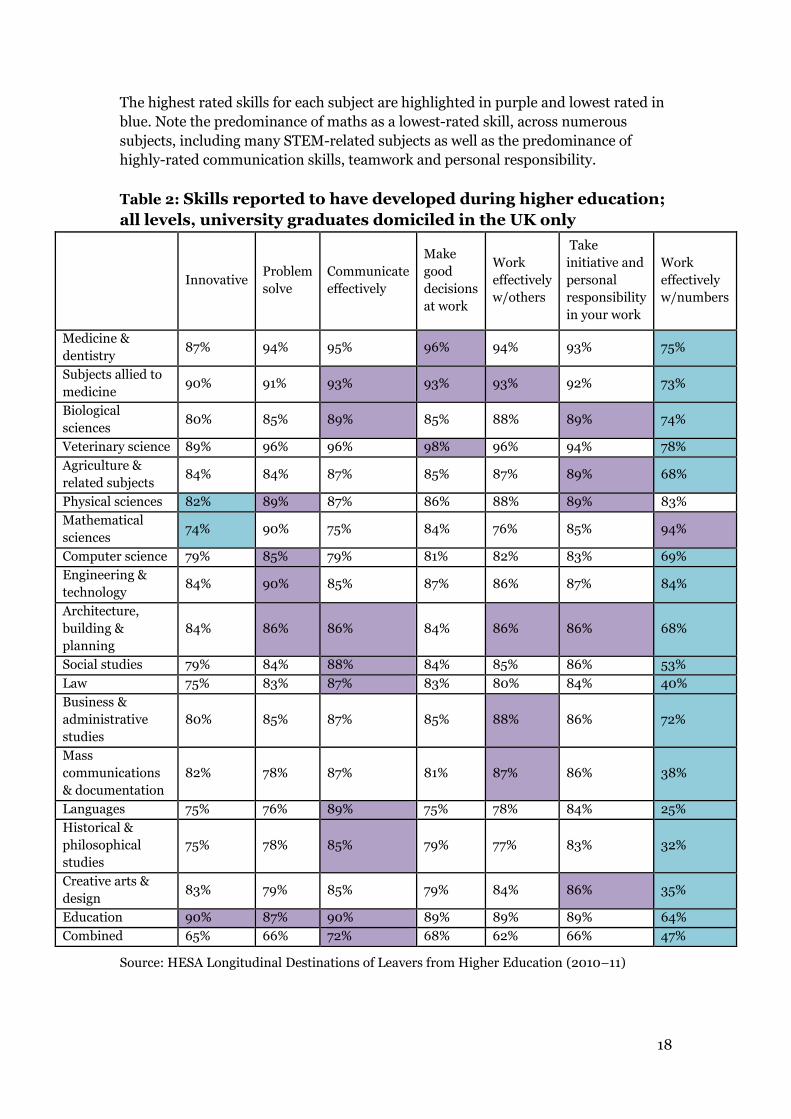
The highest rated skills for each subject are highlighted in purple and lowest rated in
blue. Note the predominance of maths as a lowest-rated skill, across numerous
subjects, including many STEM-related subjects as well as the predominance of
highly-rated communication skills, teamwork and personal responsibility.
Table 2: Skills reported to have developed during higher education;
all levels, university graduates domiciled in the UK only
Innovative Problem
solve
Communicate
effectively
Make
good
decisions
at work
Work
effectively
w/others
Take
initiative and
personal
responsibility
in your work
Work
effectively
w/numbers
Medicine &
dentistry 87% 94% 95% 96% 94% 93% 75%
Subjects allied to
medicine 90% 91% 93% 93% 93% 92% 73%
Biological
sciences 80% 85% 89% 85% 88% 89% 74%
Veterinary science 89% 96% 96% 98% 96% 94% 78%
Agriculture &
related subjects 84% 84% 87% 85% 87% 89% 68%
Physical sciences 82% 89% 87% 86% 88% 89% 83%
Mathematical
sciences 74% 90% 75% 84% 76% 85% 94%
Computer science 79% 85% 79% 81% 82% 83% 69%
Engineering &
technology 84% 90% 85% 87% 86% 87% 84%
Architecture,
building &
planning
84% 86% 86% 84% 86% 86% 68%
Social studies 79% 84% 88% 84% 85% 86% 53%
Law 75% 83% 87% 83% 80% 84% 40%
Business &
administrative
studies
80% 85% 87% 85% 88% 86% 72%
Mass
communications
& documentation
82% 78% 87% 81% 87% 86% 38%
Languages 75% 76% 89% 75% 78% 84% 25%
Historical &
philosophical
studies
75% 78% 85% 79% 77% 83% 32%
Creative arts &
design 83% 79% 85% 79% 84% 86% 35%
Education 90% 87% 90% 89% 89% 89% 64%
Combined 65% 66% 72% 68% 62% 66% 47%
Source: HESA Longitudinal Destinations of Leavers from Higher Education (2010–11)
19
Apart from some expected differences in subject-level skills development (eg
numeracy), there does appear to be a fair level of consistency in perceived skills
development across qualification aims and subject level, even if the objective
sophistication of these skills may vary across these areas.
Conclusion
Overall, graduates appear quite positive when reflecting on the actual skills that they
developed during their higher education experience, even if we do not quite know the
extent to which they use them, and/or are enabled to use them, in their current job.
Also, there appears to be some broad similarities – both positive (communication
skills and team working) and negative (the ability to effectively work with numbers) –
across a number of diverse subject areas.
We should also bear in mind the dynamic nature of the entire system of university
and programme choice, graduate recruitment and career choice. Many jobs do not
require a specific subject but value the broader skills graduates develop. Many
students do not go into jobs related to the subject they studied either because they
choose not to or because the particular jobs aren’t available. Also industries such as
engineering or construction need a whole variety of graduate skills for the many
different roles they provide and many industries need a combination of subjects and
skills.
However, such information only seems to raise further questions, such as:
1. Are these the ‘right’ skills to ask graduates about? Are they critical for
determining success in the labour market and are they appropriate for all
academic subjects and industries?
2. If they are the ‘right’ – or at least broadly appropriate – skills and capacities
to ask graduates about, where during their higher education experience do
graduates feel they were best able to develop them: in the classroom, through
work experience programmes, as a result of participation in extracurricular
activities such as sports teams or societies?
3. To what extent do employer views of graduate skills match up with graduates’
own perceptions? Where there are differences, what drives them and what can
be done to alleviate them?
These are, of course, quite daunting questions that elude the scope of this paper but
will be considered throughout the course of our review. Many of the issues are
inextricably linked to our knowledge – and our perceptions – of graduate
destinations, in terms of employment or further study, occupation type and earnings,
discussed in the next chapter.
20
3. GRADUATE DESTINATIONS
This chapter outlines graduate destinations six and forty months after leaving
university. It points to similarities in employment rates – particularly as compared to
non-graduates – but also notes differences among graduates in the types of roles and
industries they enter into, and the salaries they earn.
While information on university graduates is more robust, at least for the first six
months to three years, we have less – and considerably less granular – information
on the outcomes of higher education-level qualifiers from further education colleges
(FECs) and, especially alternative providers (Aps), where outcomes data is not yet
available. As such this section focuses exclusively on graduates from universities.
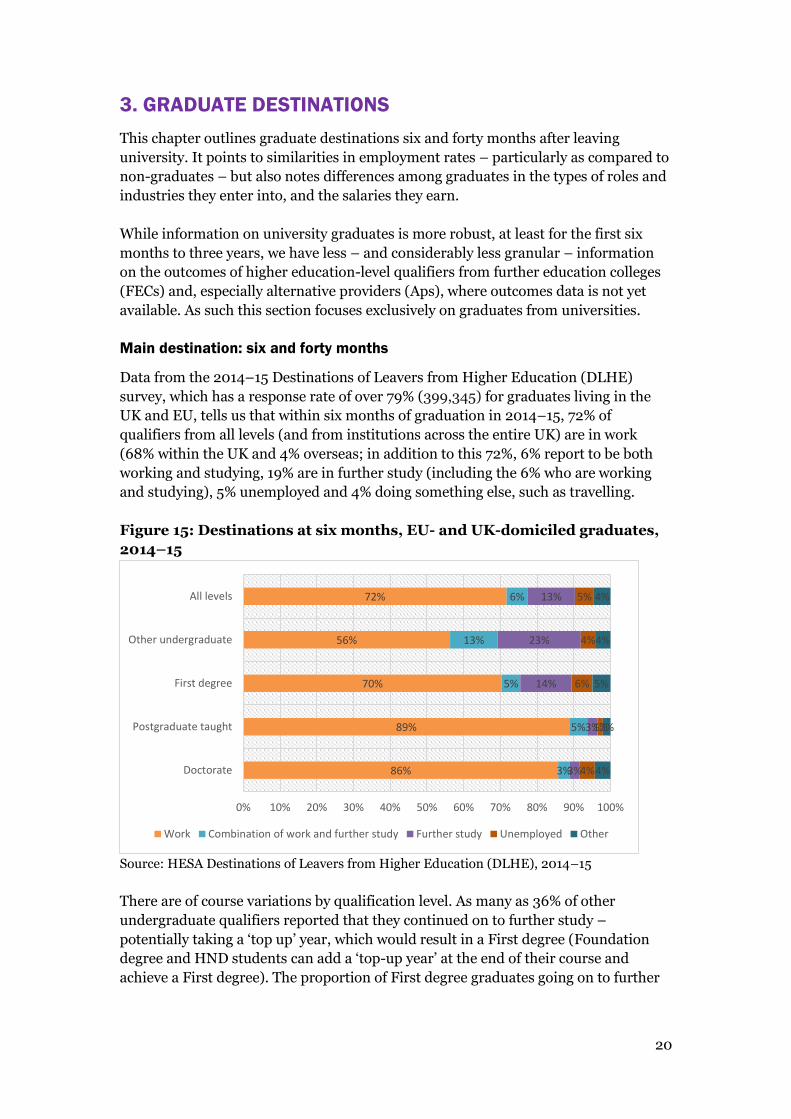
Main destination: six and forty months
Data from the 2014–15 Destinations of Leavers from Higher Education (DLHE)
survey, which has a response rate of over 79% (399,345) for graduates living in the
UK and EU, tells us that within six months of graduation in 2014–15, 72% of
qualifiers from all levels (and from institutions across the entire UK) are in work
(68% within the UK and 4% overseas; in addition to this 72%, 6% report to be both
working and studying, 19% are in further study (including the 6% who are working
and studying), 5% unemployed and 4% doing something else, such as travelling.
Figure 15: Destinations at six months, EU- and UK-domiciled graduates,
2014–15
Source: HESA Destinations of Leavers from Higher Education (DLHE), 2014–15
There are of course variations by qualification level. As many as 36% of other
undergraduate qualifiers reported that they continued on to further study –
potentially taking a ‘top up’ year, which would result in a First degree (Foundation
degree and HND students can add a ‘top-up year’ at the end of their course and
achieve a First degree). The proportion of First degree graduates going on to further
86%
89%
70%
56%
72%
3%
5%
5%
13%
6%
3%
3%
14%
23%
13%
4%
1%
6%
4%
5%
4%
2%
5%
4%
4%
0% 10% 20% 30% 40% 50% 60% 70% 80% 90% 100%
Doctorate
Postgraduate taught
First degree
Other undergraduate
All levels
Work Combination of work and further study Further study Unemployed Other
21
study within six months of leaving higher education was 19%, followed by taught
postgraduate (8%), and PhDs (6%).
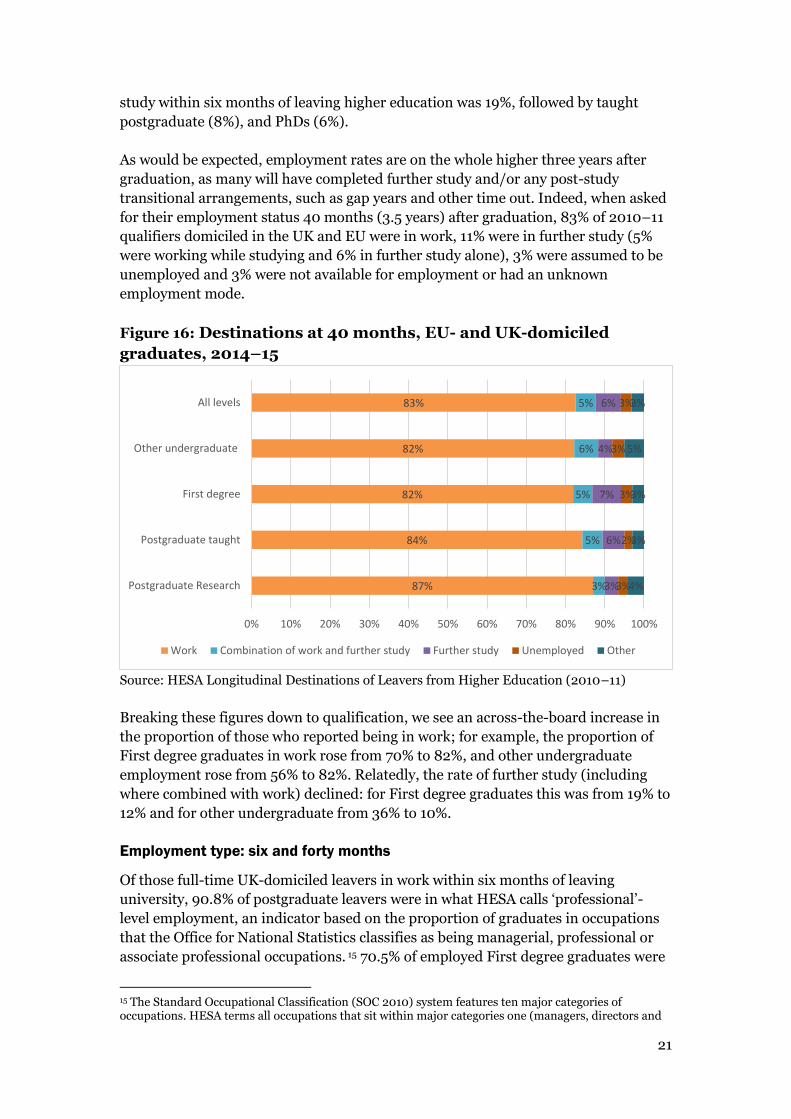
As would be expected, employment rates are on the whole higher three years after
graduation, as many will have completed further study and/or any post-study
transitional arrangements, such as gap years and other time out. Indeed, when asked
for their employment status 40 months (3.5 years) after graduation, 83% of 2010–11
qualifiers domiciled in the UK and EU were in work, 11% were in further study (5%
were working while studying and 6% in further study alone), 3% were assumed to be
unemployed and 3% were not available for employment or had an unknown
employment mode.
Figure 16: Destinations at 40 months, EU- and UK-domiciled
graduates, 2014–15
Source: HESA Longitudinal Destinations of Leavers from Higher Education (2010–11)
Breaking these figures down to qualification, we see an across-the-board increase in
the proportion of those who reported being in work; for example, the proportion of
First degree graduates in work rose from 70% to 82%, and other undergraduate
employment rose from 56% to 82%. Relatedly, the rate of further study (including
where combined with work) declined: for First degree graduates this was from 19% to
12% and for other undergraduate from 36% to 10%.
Employment type: six and forty months
Of those full-time UK-domiciled leavers in work within six months of leaving
university, 90.8% of postgraduate leavers were in what HESA calls ‘professional’-
level employment, an indicator based on the proportion of graduates in occupations
that the Office for National Statistics classifies as being managerial, professional or
associate professional occupations. 15 70.5% of employed First degree graduates were
15 The Standard Occupational Classification (SOC 2010) system features ten major categories of occupations. HESA terms all occupations that sit within major categories one (managers, directors and
87%
84%
82%
82%
83%
3%
5%
5%
6%
5%
3%
6%
7%
4%
6%
3%
2%
3%
3%
3%
4%
3%
3%
5%
3%
0% 10% 20% 30% 40% 50% 60% 70% 80% 90% 100%
Postgraduate Research
Postgraduate taught
First degree
Other undergraduate
All levels
Work Combination of work and further study Further study Unemployed Other
22
in professional-level employment, as were 60.4% of other undergraduate (including
Foundation Degrees, HNDs and HNCs) qualifiers.
While the ‘professional’ employment indicator provides a broad illustration of the
types of roles graduates enter into, there are limitations to the occupational
categories it is based on. These classifications cannot adjust to the arrival of new
occupations, often brought on by technological, social or organisational change, nor
can they account for occupations’ skill requirements shifting over time – both of
which have produced a rise in the number and proportion of graduate jobs in the UK,
according to academic research by Green and Henseke (2014).
Forty months after leaving full-time higher education, 91.8% of 2010–11
postgraduate (taught and research) qualifiers were in ‘professional’ employment, as
were 77.2% of First degree graduates and 72% of other undergraduate (including
Foundation degrees, HNDs and HNCs) qualifiers.
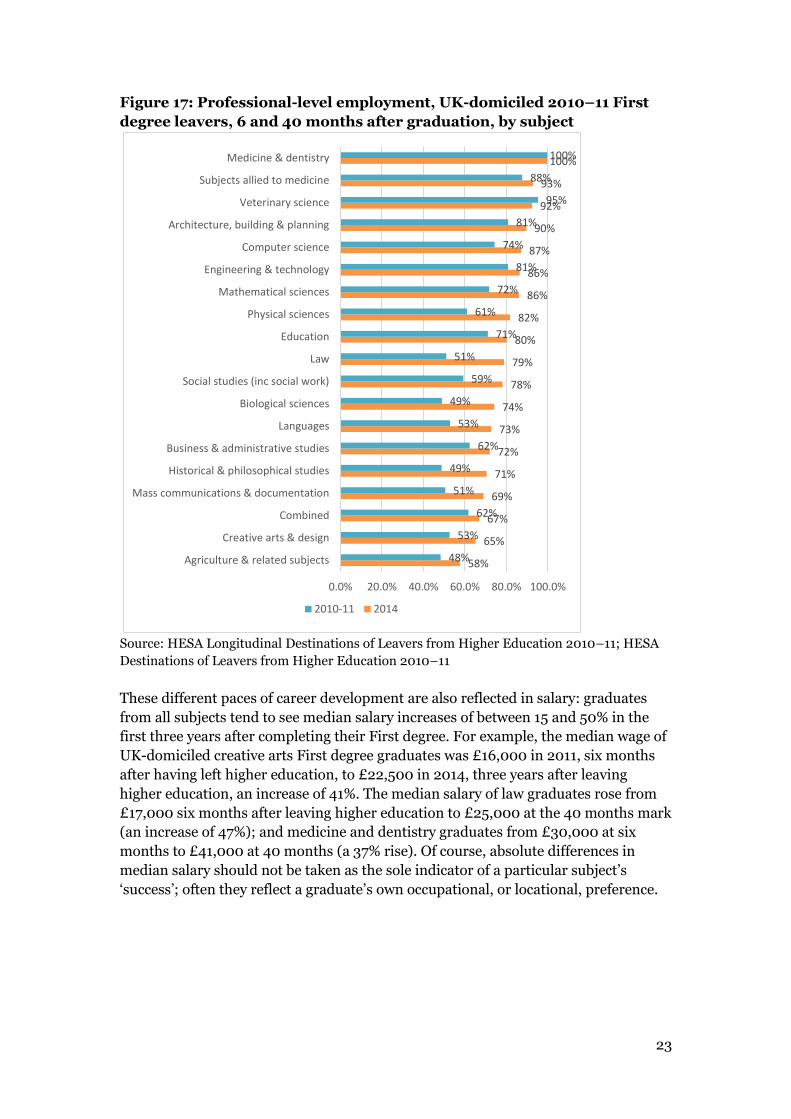
There is, as would be expected, subject-based variation in professional employment.
Looking at First degree graduates, we see that nearly all medicine and dentistry
leavers found themselves in professional-level employment within six months of
leaving higher education, perhaps an unsurprising outcome given their natural
professional pathways.
However, graduates from other subjects can take longer to find their way into
professional-level jobs. For example, 48.9% of 2010–11 biological science graduates
were in professional employment within six months as compared to 2014, by which
point 74.2% of 2010–11 biological science graduates had found their way into
professional-level employment.
This is illustrated in Figure 17, below, which shows professional employment rates for
2010–11 First degree graduates six months and then three years after leaving
university, according to subject. However, due to limitations in data availability,
figures for 2010–11 graduates at three years refer exclusively to those who studied full
time whereas those for 2010–11 graduates refer to graduates who studied full- and
part-time combined.
senior officials), two (professional occupations) and three (associate professional and technical occupations) ‘professional employment’. The former Department for Business, Innovation and Skills, in its Graduate Labour Market Statistics series of publications, labelled these ‘high skilled employment.’
23
Figure 17: Professional-level employment, UK-domiciled 2010–11 First
degree leavers, 6 and 40 months after graduation, by subject
Source: HESA Longitudinal Destinations of Leavers from Higher Education 2010–11; HESA
Destinations of Leavers from Higher Education 2010–11
These different paces of career development are also reflected in salary: graduates
from all subjects tend to see median salary increases of between 15 and 50% in the
first three years after completing their First degree. For example, the median wage of
UK-domiciled creative arts First degree graduates was £16,000 in 2011, six months
after having left higher education, to £22,500 in 2014, three years after leaving
higher education, an increase of 41%. The median salary of law graduates rose from
£17,000 six months after leaving higher education to £25,000 at the 40 months mark
(an increase of 47%); and medicine and dentistry graduates from £30,000 at six
months to £41,000 at 40 months (a 37% rise). Of course, absolute differences in
median salary should not be taken as the sole indicator of a particular subject’s
‘success’; often they reflect a graduate’s own occupational, or locational, preference.
58%
65%
67%
69%
71%
72%
73%
74%
78%
79%
80%
82%
86%
86%
87%
90%
92%
93%
100%
48%
53%
62%
51%
49%
62%
53%
49%
59%
51%
71%
61%
72%
81%
74%
81%
95%
88%
100%
0.0% 20.0% 40.0% 60.0% 80.0% 100.0%
Agriculture & related subjects
Creative arts & design
Combined
Mass communications & documentation
Historical & philosophical studies
Business & administrative studies
Languages
Biological sciences
Social studies (inc social work)
Law
Education
Physical sciences
Mathematical sciences
Engineering & technology
Computer science
Architecture, building & planning
Veterinary science
Subjects allied to medicine
Medicine & dentistry
2010-11 2014
24
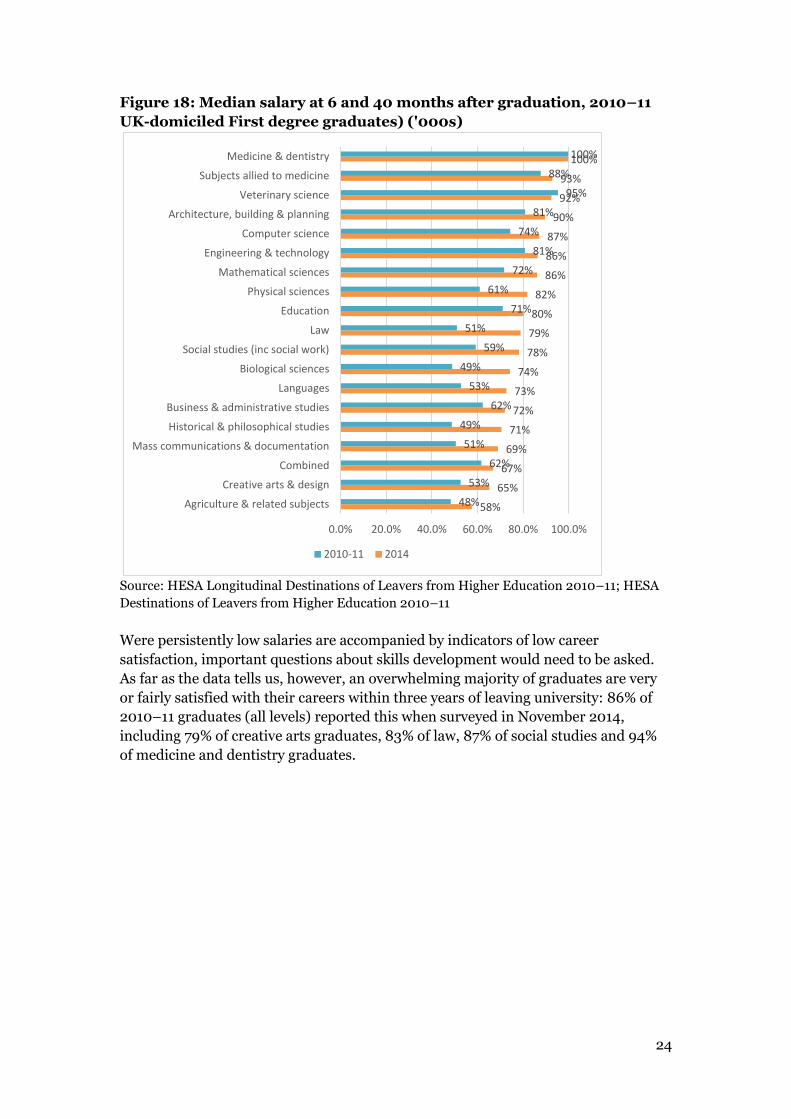
Figure 18: Median salary at 6 and 40 months after graduation, 2010–11
UK-domiciled First degree graduates) ('000s)
Source: HESA Longitudinal Destinations of Leavers from Higher Education 2010–11; HESA
Destinations of Leavers from Higher Education 2010–11
Were persistently low salaries are accompanied by indicators of low career
satisfaction, important questions about skills development would need to be asked.
As far as the data tells us, however, an overwhelming majority of graduates are very
or fairly satisfied with their careers within three years of leaving university: 86% of
2010–11 graduates (all levels) reported this when surveyed in November 2014,
including 79% of creative arts graduates, 83% of law, 87% of social studies and 94%
of medicine and dentistry graduates.
58%
65%
67%
69%
71%
72%
73%
74%
78%
79%
80%
82%
86%
86%
87%
90%
92%
93%
100%
48%
53%
62%
51%
49%
62%
53%
49%
59%
51%
71%
61%
72%
81%
74%
81%
95%
88%
100%
0.0% 20.0% 40.0% 60.0% 80.0% 100.0%
Agriculture & related subjects
Creative arts & design
Combined
Mass communications & documentation
Historical & philosophical studies
Business & administrative studies
Languages
Biological sciences
Social studies (inc social work)
Law
Education
Physical sciences
Mathematical sciences
Engineering & technology
Computer science
Architecture, building & planning
Veterinary science
Subjects allied to medicine
Medicine & dentistry
2010-11 2014
25
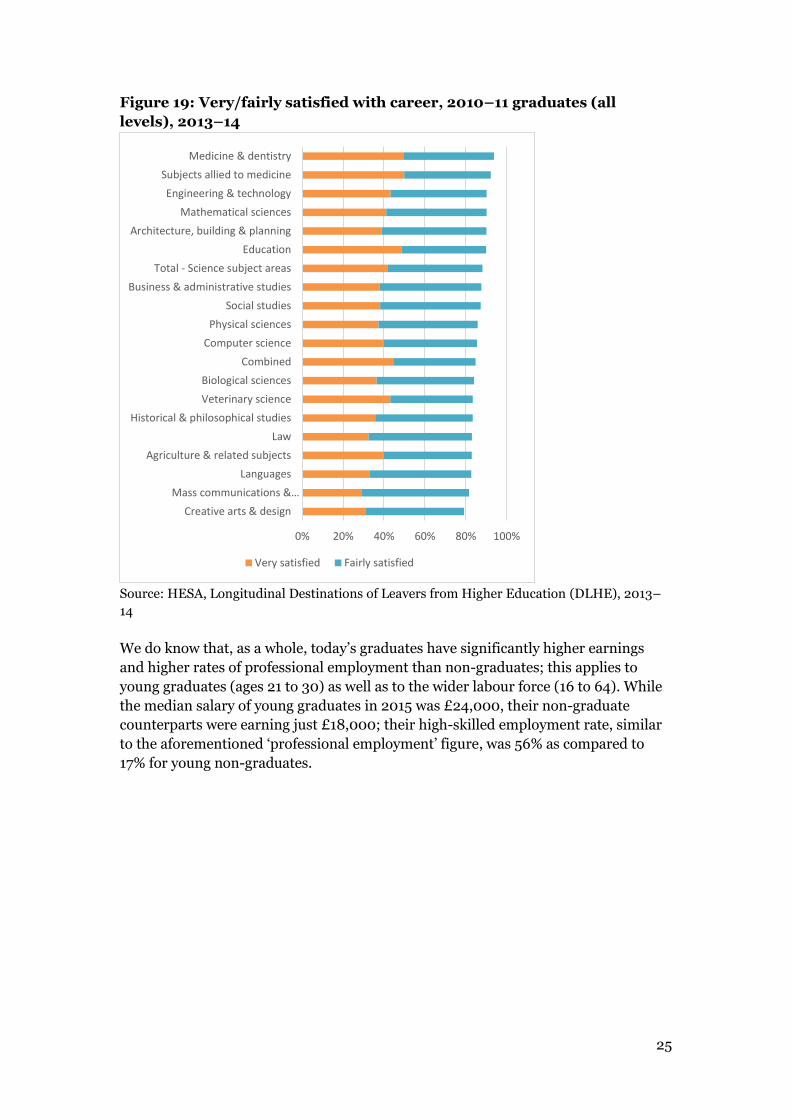
Figure 19: Very/fairly satisfied with career, 2010–11 graduates (all
levels), 2013–14
Source: HESA, Longitudinal Destinations of Leavers from Higher Education (DLHE), 2013–
14
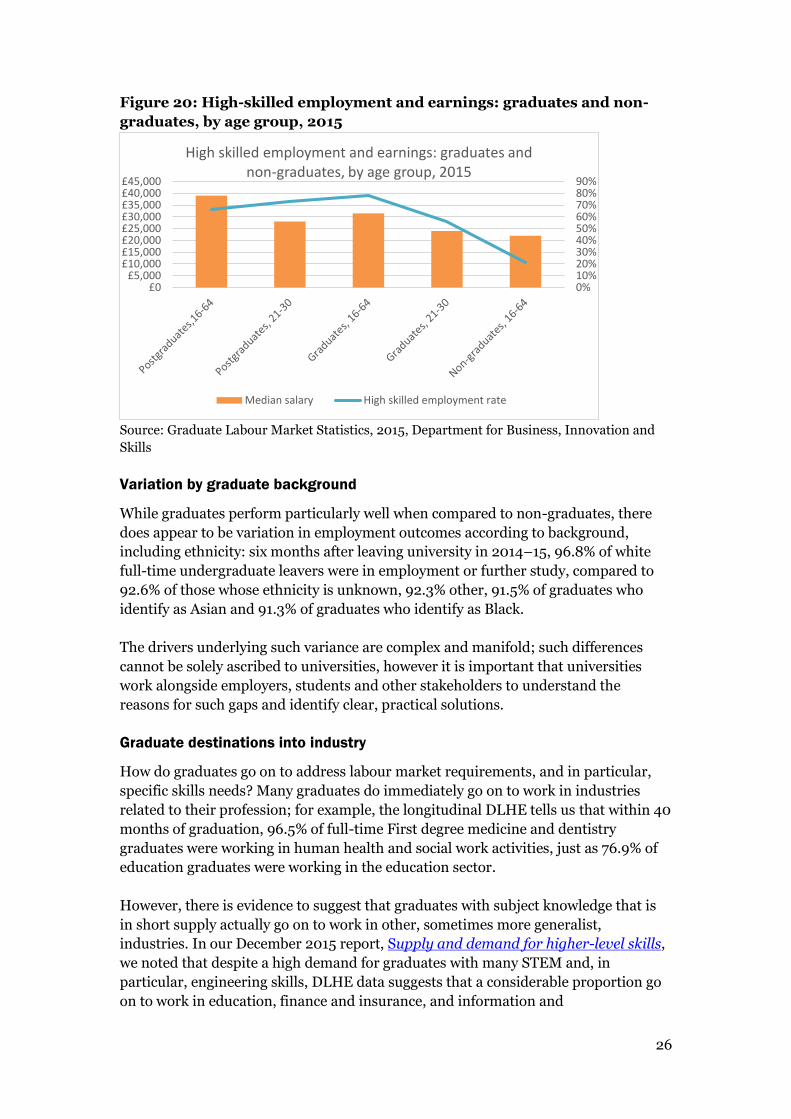
We do know that, as a whole, today’s graduates have significantly higher earnings
and higher rates of professional employment than non-graduates; this applies to
young graduates (ages 21 to 30) as well as to the wider labour force (16 to 64). While
the median salary of young graduates in 2015 was £24,000, their non-graduate
counterparts were earning just £18,000; their high-skilled employment rate, similar
to the aforementioned ‘professional employment’ figure, was 56% as compared to
17% for young non-graduates.
0% 20% 40% 60% 80% 100%
Creative arts & design
Mass communications &…
Languages
Agriculture & related subjects
Law
Historical & philosophical studies
Veterinary science
Biological sciences
Combined
Computer science
Physical sciences
Social studies
Business & administrative studies
Total - Science subject areas
Education
Architecture, building & planning
Mathematical sciences
Engineering & technology
Subjects allied to medicine
Medicine & dentistry
Very satisfied Fairly satisfied
26
Figure 20: High-skilled employment and earnings: graduates and non-
graduates, by age group, 2015
Source: Graduate Labour Market Statistics, 2015, Department for Business, Innovation and
Skills
Variation by graduate background
While graduates perform particularly well when compared to non-graduates, there
does appear to be variation in employment outcomes according to background,
including ethnicity: six months after leaving university in 2014–15, 96.8% of white
full-time undergraduate leavers were in employment or further study, compared to
92.6% of those whose ethnicity is unknown, 92.3% other, 91.5% of graduates who
identify as Asian and 91.3% of graduates who identify as Black.
The drivers underlying such variance are complex and manifold; such differences
cannot be solely ascribed to universities, however it is important that universities
work alongside employers, students and other stakeholders to understand the
reasons for such gaps and identify clear, practical solutions.
Graduate destinations into industry
How do graduates go on to address labour market requirements, and in particular,
specific skills needs? Many graduates do immediately go on to work in industries
related to their profession; for example, the longitudinal DLHE tells us that within 40
months of graduation, 96.5% of full-time First degree medicine and dentistry
graduates were working in human health and social work activities, just as 76.9% of
education graduates were working in the education sector.
However, there is evidence to suggest that graduates with subject knowledge that is
in short supply actually go on to work in other, sometimes more generalist,
industries. In our December 2015 report, Supply and demand for higher-level skills,
we noted that despite a high demand for graduates with many STEM and, in
particular, engineering skills, DLHE data suggests that a considerable proportion go
on to work in education, finance and insurance, and information and
0%10%20%30%40%50%60%70%80%90%
£0£5,000
£10,000£15,000£20,000£25,000£30,000£35,000£40,000£45,000
High skilled employment and earnings: graduates and non-graduates, by age group, 2015
Median salary High skilled employment rate
27
communication.
While some of these findings could be driven by complexity in classifying occupations
and industries16, they do represent a clear challenge to education providers and
industry: often, ‘mismatched’ destinations reflect graduates’ personal preferences,
such as a job’s location or the salary it offers. How can we encourage graduates with
highly demanded skills into the occupations where they are most needed?
While the recent Wakeham Review of STEM Degree Provision and Graduate
Employability (2016) focused on employability of graduates moreso than employers’
challenges in accessing graduates, it did note that graduates will be better prepared
for work when, as students, they have access to work experience (a finding that has
resonated for graduates of all subjects17). It also emphasized the need to embed
specific work-related skills into courses, improve careers advice and, relatedly,
improve the quality of graduate destinations data so as to achieve a more granular
illustration of the flows of graduates from particular courses into particular sectors.
Improved data sources may help inform our understanding of the supply and
demand for specific skills – an outcome of likely benefit to employers searching for
vacancies. However, the European Centre for the Development of Vocational
Training (CEDEFOP) points to a host of additional factors including pay and
‘inefficient recruitment and training strategies.’18
Of course, it is not always possible – or helpful – to try to adopt a rigid model of
supply and demand for all graduates: in a knowledge economy such as the UK,
graduates with a core set of analytical, critical and creative skills may excel in any
number of highly-skilled occupations and industries. For example, a social science
graduate may have developed the skills to allow them to flourish in a number of
different occupations and industries, from finance to market research; an attempt to
rigidly match supply and demand for their skills and subject knowledge would
potentially undermine the core set of capacities that should help them to adapt to an
ever-changing, knowledge-based labour market.
This indicates that providers could do an excellent job in developing the skills and
subject knowledge of graduates, including providing a range of opportunities to
experience work and link with employers, but where those graduates end up is a
choice driven by a whole range of factors in addition to their qualification and skills.
With the strong employment rate of graduates combined with reported skills
shortages, perhaps becoming exacerbated by demographic trends and reduced
immigration in light of the UK’s vote to leave the EU, there is a market for talent and
employers will need to actively engage with this market to meet their needs and
persuade graduates to work for them.
16The DLHE classifies graduate jobs into different industries using the Standard Industrial Classification system, wherein jobs are coded according to an employer’s industry. While this may make sense for a doctor – they do a health-related job for a health employer – it may muddle other classifications: an accountant at a construction firm would be classified as working in construction, as would its in-house legal adviser. 17 QAA (2016) Evaluating the impact of higher education providers’ employability measures 18 CEDEFOP (2014) Skills mismatch: more than meets the eye
28
Conclusion Data showing overall high rates of highly skilled – and highly paid –
graduates suggests that their experience during higher education has given them a
significant boost in life and indeed contributed to the skills needs of the economy.
While the skills developed in higher education will allow many graduates to adapt
and excel across a wide range of occupations and industries, there remains a question
about how to ensure graduates with specific skills that are in high demand are
encouraged into the areas that need them most.
We also know less about the specific factors that graduates believed helped them
transition into the labour market – and the extent to which their assessments match
up with employer priorities. What matters most: degree classification, subject, work
experience or interview preparation?
And of course, we are concerned not just with what helps graduates transition into
employment but also how they – and their employers – succeed, making the best use
of their skills and knowledge.
4. TRANSITIONING INTO – AND SUCCEEDING IN – THE
LABOUR MARKET: WHAT SKILLS AND EXPERIENCE
MATTER MOST?
This chapter briefly compares Destinations of Leavers from Higher Education
(DLHE) survey questions that ask graduates, 40 months after leaving higher
education, what helped them into their current roles against what employers list as
the most important factors under consideration when recruiting a graduate.
It then outlines how, according to a small number of surveys, employers feel that
graduates perform in these areas, before going on to ask where and how some of
these skills and capabilities might best be developed.
Graduates on entering the labour market
What, according to graduates, mattered most for attaining their job? The longitudinal
DLHE (university graduates only) includes a series of questions asking graduates to
indicate whether a particular attribute was a formal requirement or important factor
in attaining their current job. The attributes include type of qualification, subject
studied, degree class, skills and competencies, relevant work experience and formal
work experience that was part of their qualification (eg a sandwich year).
For graduates of all levels and all subject areas, skills and competencies came first
(82.4% reported this to be a formal or important requirement), followed by relevant
work experience (66.7%), type of qualification (63%), subject studied (58.9%), degree
class (43.3%) and formal placement (39.7%). The latter is not a surprising outcome
given the low proportion of graduates who will have completed a sandwich year.
29
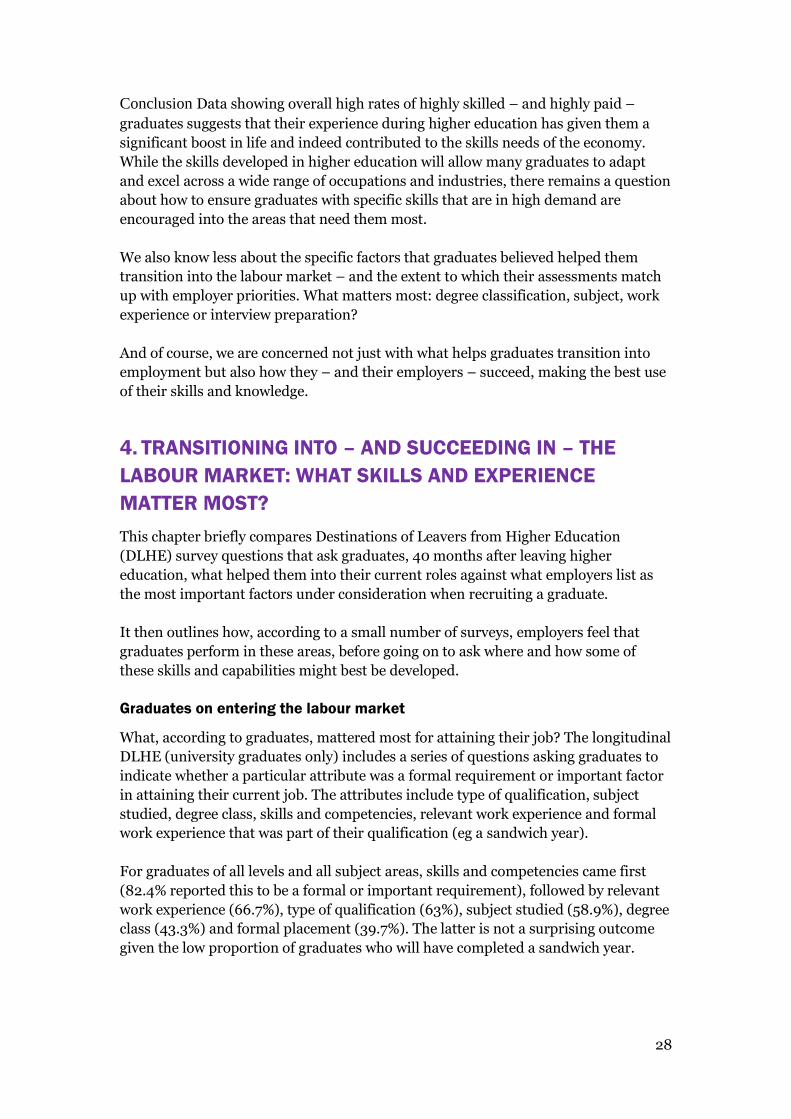
Table 3, below, lists the results at subject level for all levels of higher education
qualifications; cells highlighted in purple denote the highest rated attribute for a
particular subject, those in blue note the second highest and green, the lowest.
Table 3: Importance of attributes in attaining current job, UK-domiciled
graduates from universities only, all qualifications
All levels Type of
qualification:
Formal/
important
Subject
studied:
formal/
important
Degree class:
Formal/
important
Skills and
competencies:
formal/
important
Formal/important:
Relevant work
experience from
previous
employment
Historical &
philosophical
studies
48% 29.60% 39.10% 78.70% 67.50%
Mathematical
sciences 67% 61.00% 55.70% 84.70% 48.20%
Combined 48% 39.20% 31.40% 70.00% 71.80%
Languages 54% 37.30% 40.40% 82.00% 70.80%
Physical
sciences 63% 54.70% 45.40% 80.40% 56.70%
Creative arts &
design 44% 45.60% 26.30% 75.60% 64.00%
Law 62% 57.40% 53.10% 83.00% 67.40%
Computer
science 57% 61.80% 42.60% 79.60% 58.10%
Mass
communications
&
documentation
46% 44.10% 29.80% 79.70% 70.50%
Business &
administrative
studies
54% 50.00% 39.80% 79.50% 69.60%
Biological
sciences 57% 51.20% 42.00% 79.40% 68.00%
Engineering &
technology 69% 70.70% 51.20% 82.80% 57.90%
Social studies 59% 49.00% 42.40% 83.00% 71.90%
Agriculture &
related subjects 49% 55.20% 31.10% 76.20% 68.60%
Architecture,
building &
planning
73% 73.50% 46.70% 83.00% 70.00%
Subjects allied
to medicine 83% 85.10% 50.20% 88.50% 64.60%
Medicine &
dentistry 89% 90.10% 42.50% 91.00% 66.50%
Education 81% 81.00% 53.60% 88.80% 68.50%
Veterinary
science 92% 95.40% 24.60% 93.40% 72.60%
Total all levels 63% 58.90% 43.30% 82.40% 66.70%
Source: HESA Longitudinal Destinations of Leavers from Higher Education 2010–11
30
There is a striking degree of similarity across subject areas: skills and competencies
are the highest rated attribute by a substantial margin, whether or not a subject may
fall into a vocational or non-vocational category. This is followed by relevant work
experience and type of qualification.
One interpretation of the data would suggest that this is not particularly surprising:
while a degree may be a baseline requirement for attaining a job, an applicant’s
ability to demonstrate the skills and competencies that they can bring to the
workplace will allow them to stand out from their graduate counterparts. Work
experience could have helped them translate the skills and competencies picked up
through higher education into a formal work environment. However, this
interpretation would require further interrogation, not just of the data but of both
graduate and indeed employer perspectives.
Employer perspectives on graduate recruitment and graduate skills
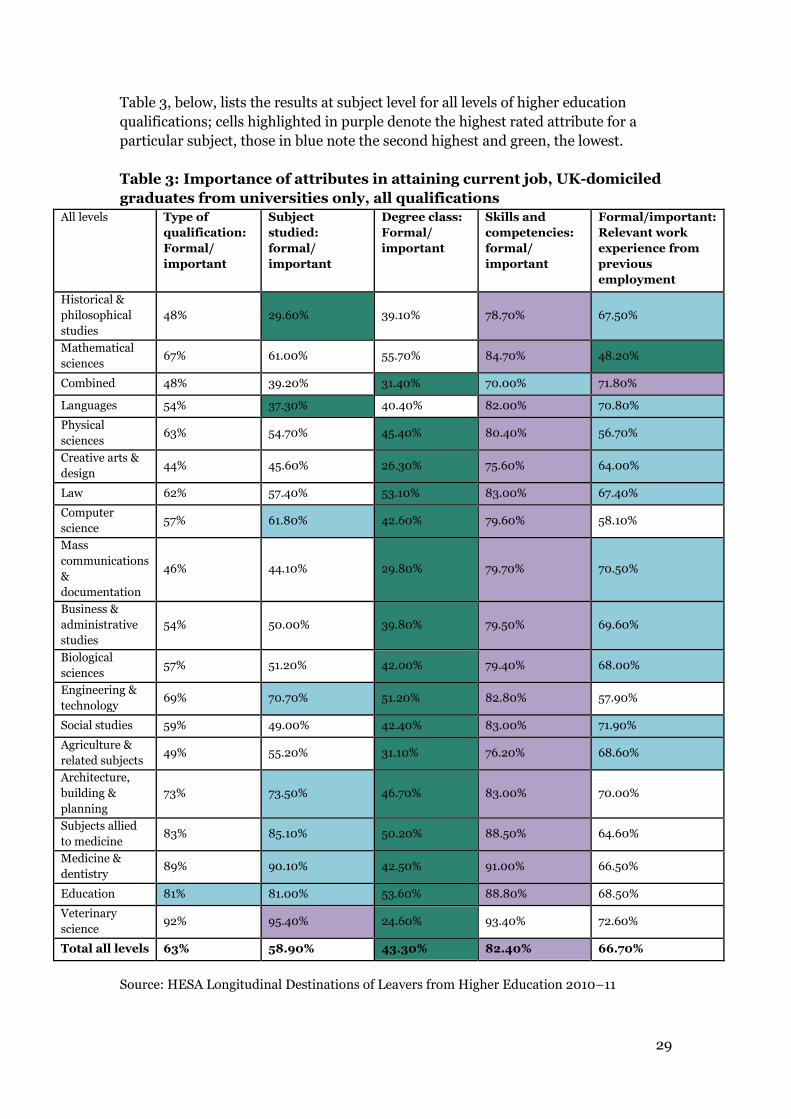
Each year the Confederation of British Industry (CBI) and Pearson conduct a survey
on recruitment and skills, part of which includes a series of questions asking
employers to list the most important factors under consideration when recruiting
graduates, and a series of questions asking them to assess their graduate recruits’
skills.
In 2016, employers listed attitudes and aptitudes for work (reported by 87% of
employers), relevant work experience (67%) and degree subject (65%, particularly
more important for businesses in the manufacturing, engineering and high-tech
sectors) as the most important factors under consideration when recruiting a
graduate.
Figure 21: Employer considerations when recruiting a graduate, 2016
Source: CBI/Pearson Education and Skills Survey 2016
If we were to suggest a degree of similarity between the CBI’s definitions of attitudes
and aptitudes and the DLHE’s ‘skills and competencies’ then there appears to be
coherence among graduate and employer views: both rated skills/aptitudes and
0% 20% 40% 60% 80% 100%
Foreign language capability
University attended
Degree result
Degree subject
Relevant work experience/industrialplacement
Attitudes and aptitdues for work
31
relevant work experience as the first and second most important factors in attaining
employment.
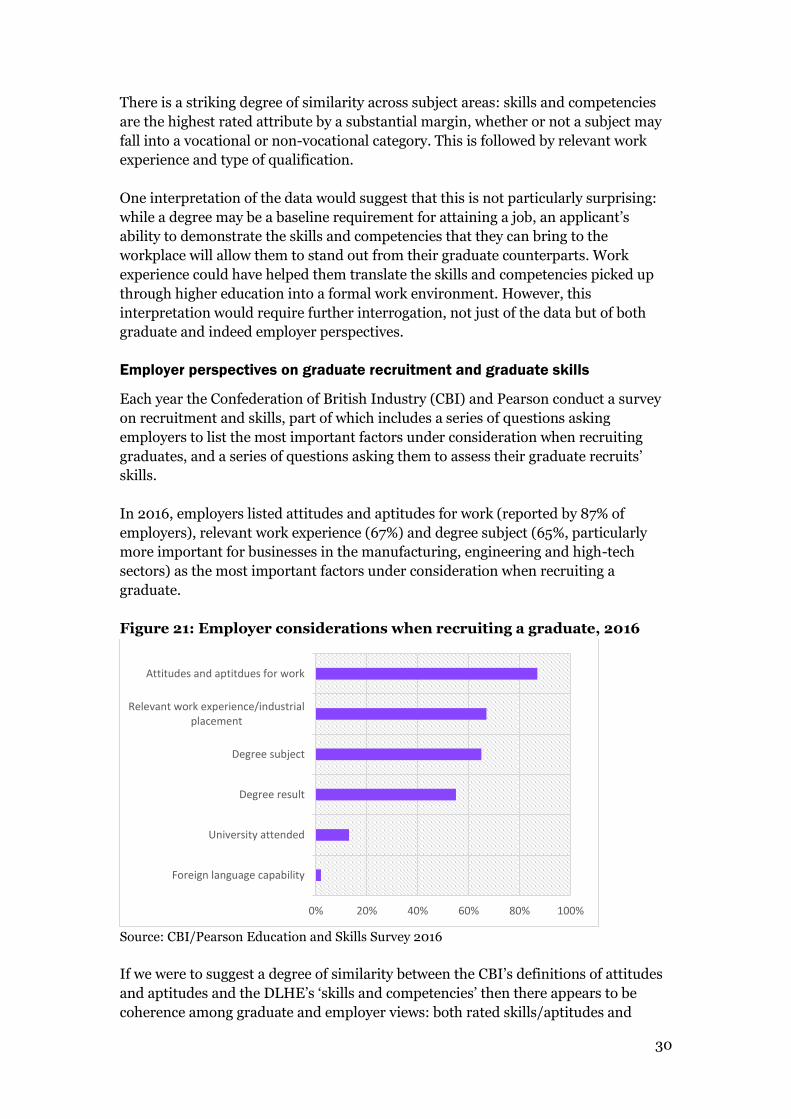
How have employers actually rated graduates’ skills and attributes? The CBI/Pearson
survey indicates that employers are, on the whole, quite satisfied with their graduate
recruits’ skills, particularly when compared to those of other types of education
leavers.
Figure 22: Employer assessments of recruits’ skills by education level,
2016
Source: CBI/Pearson Education and Skills Survey 2016
The survey does not tell us, however, how much this satisfaction varies by industry or
the extent to which employers rate each of these skills as important (eg how many
employers feel that their graduates’ less-than-satisfying foreign language skills are a
problem?). Yet it does point out particular areas of success (IT, numeracy) as well as
capacities that, relative to other areas, could be seen as a problem (business and
customer awareness, work experience, self-management and resilience).
It is interesting that analysis skills, which would be considered a core skill developed
through higher education study, is identified as a highly valued and work-relevant
skill. The survey also clearly identifies the difference higher education study makes in
terms of the satisfaction of employers with the skills of their recruits. In previous
chapters we have considered which higher education subjects might be considered
more vocational or professional than others and which might be considered more
technically focused. The survey clearly demonstrates considerable employer
satisfaction with the technical skills of the graduates they recruit.
There are also interesting differences between employers’ and graduates’ skills
0% 20% 40% 60% 80% 100% 120%
Use of IT
Basic numeracy skills
Technical skills
Literacy and use of English
Analysis Skills
Positive attitudes to work
Teamworking
Problem solving
Communication skills
Knowledge of chosen job/career
International cultural awareness
Self management/resilience
Relevant work experience
Business and customer Awareness
Foreign language skills
Very satisfied/Satisfied with school/college leaver recruits' skills
Very satisfied/Satisfied with graduate recruits' skills
32
assessments. While, for example, just 60.3% of 2010–11 First degree graduates
reported that their higher education experience enabled them to work effectively with
numbers to a great or to some extent, 91% of employers reported being very satisfied
or satisfied with their graduate recruits’ numeracy skills. Conversely, 87% of
graduates reported having developed their communication skills during higher
education but only 77% of employers reported being satisfied with them.
Other skill assessments appear to be rated similarly by both employers and
graduates: 86.6% of graduates reported that higher education enabled them to work
effectively with others while 81% of employers reported satisfaction with their
graduate recruits’ team working skills. 83.9% of graduates reported that higher
education helped them develop their problem-solving skills, as compared to 79% of
employers who are satisfied with them.
There could be a number of issues that limit our ability to compare graduate and
employer skill assessments. On the one hand, these could be data related; it is likely
that different employers and of course different roles require different skills;
reporting figures at such an aggregate level masks important trends. It is also highly
probable that some disjuncture is driven by language or, more specifically, the
absence of a clear framework that both employers and universities can use to identify
and describe different sets of skills, both technical and transferable.
It might be helpful, therefore, to focus on a set of more easily described and
understood skills, universal throughout different roles and industries but specifically
pertinent to highly skilled workers. The 2016 Association of Graduate Recruiters
Survey, for example, asked employers to assess the skills displayed by graduates
when hired, including: managing up, dealing with conflict, negotiating/influencing,
self-awareness, problem-solving and others.
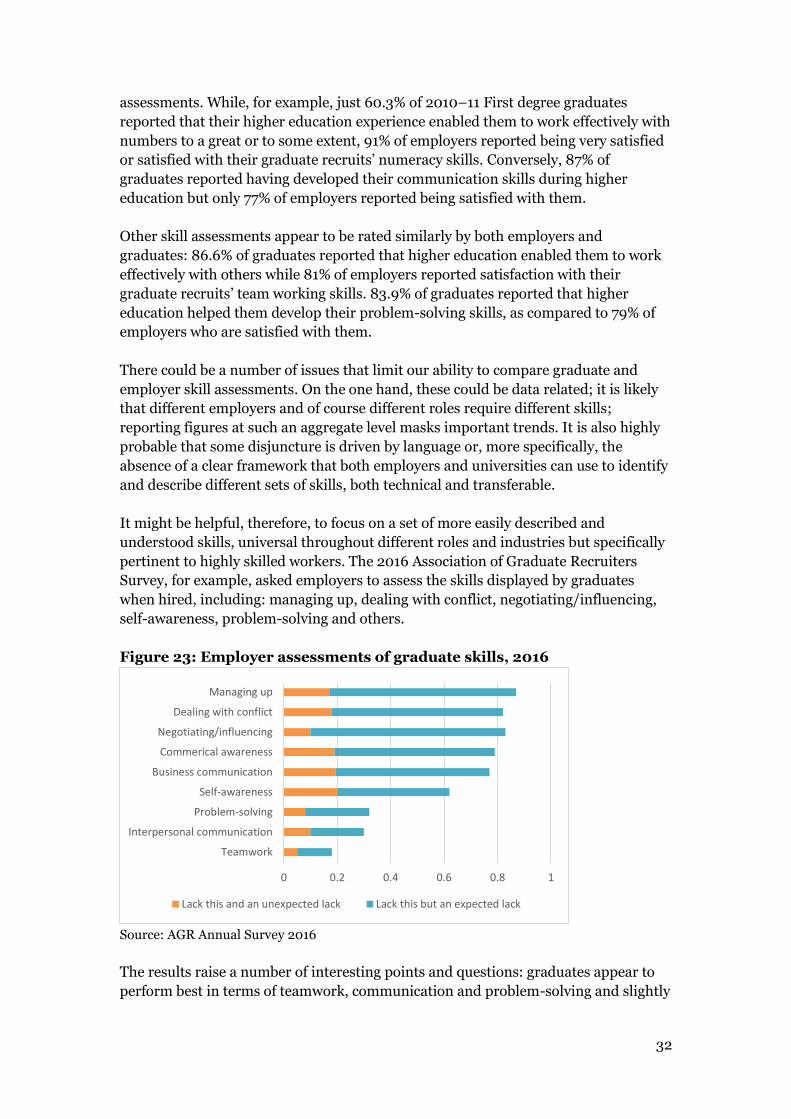
Figure 23: Employer assessments of graduate skills, 2016
Source: AGR Annual Survey 2016
The results raise a number of interesting points and questions: graduates appear to
perform best in terms of teamwork, communication and problem-solving and slightly
0 0.2 0.4 0.6 0.8 1
Teamwork
Interpersonal communication
Problem-solving
Self-awareness
Business communication
Commerical awareness
Negotiating/influencing
Dealing with conflict
Managing up
Lack this and an unexpected lack Lack this but an expected lack
33
less well in negotiating, dealing with conflict and managing up, although a majority of
employers classify this as an expected issue.
As a consequence, we are left to ask which of these skills are best developed during
higher education – and in what facets of higher education – and which in the
workplace? Is there is a role for employers and providers to collaborate on these
areas, and if so what is the most appropriate avenue: course design, open days, work
experience opportunities? How do these views differ not just within the higher
education sector but between universities and employers themselves?
Much of the data presented in this paper resonates with that discussed in
employability surveys and literature.
Graduates from all subjects tend to do well in the labour market, with most
employers prioritising graduates’ ability to demonstrate their skills and capacities
over degree subject. As research conducted by the QAA/Institute for Employment
Research and IFF Research, CBI/Pearson 2016 survey, Wakeham Review and
Shadbolt Review of Computer Science Degree Provision and Employability have all
shown, employers in industries that require particular technical skills and/or subject
knowledge will pay more attention to subject of study than others in industries that
don’t. There remains a question around how, and what forms of occupational
shortage and graduate destinations data can be best used to inform prospective
student choice. Likewise, there are questions around the forms of university-business
collaboration that will prove most effective in encouraging technically skilled
graduates to go into the industries that need them most.
Of course, those same pieces of research have found that graduates’ ability to identify,
describe and demonstrate work-relevant skills are critical to success in the labour
market. Unfortunately, however, students and graduates often struggle to understand
how skills developed on their course or in their extracurricular activities might be
relevant to the workplace.
In fact, there are particular skills and knowledge bases that are more naturally
developed in the workplace, such as business and customer awareness and managing
up. This speaks to the importance of work experience as a common prerequisite to
attaining a graduate-level job and having an easier transition into the workplace.
However, the impact of work experience will vary according to its length, type and
content.
Moreover, the importance of work experience – and students’ understanding of how
higher education-developed skills can be translated into the workplace – points to the
need for a more decentralised level of careers advice.
Conclusion The UK higher education sector is immensely diverse, producing
graduates with a wide variety of specific and transferable skills as well as clear
competencies around problem solving, communication and teamwork. For the most
part, these graduates go on to excel in the labour market and their skills and
attributes are highly valued by employers.
34
But there are still a number of graduates who fare less well, a number of employers
struggling to find the skills they require and concerns about some skills such as
business and customer awareness and relevant work experience. All this raises
questions in need of further exploration: the ability to demonstrate transferable skills
and competencies appears critical to allowing graduates to transition into the labour
market, but how can students best attain them? Should they be integrated into course
design, central careers services, or learned through formal work placements? Does
this vary by level, subject, or indeed university?
in the case of work placements, is there a particular format that best prepares
graduates and most benefits employers? How are these best organised, funded,
advertised and allocated? What models of university-employer engagement open up
an array of opportunities to all students?
How can universities and employers work together to meet specific skills needs; what
are the best collaborative mechanisms for allowing a clear, steady pipeline between
in-demand graduates and employers with skill shortages?
And finally, how can universities ensure that the skills graduates leave with will
remain relevant throughout eras of robust – and potentially unsettling – economic,
organisational and technological change?
These are big questions we intend to address, and through the Universities UK
Review of Skills we are inviting the sector and our stakeholders to work with us to
address them.
35
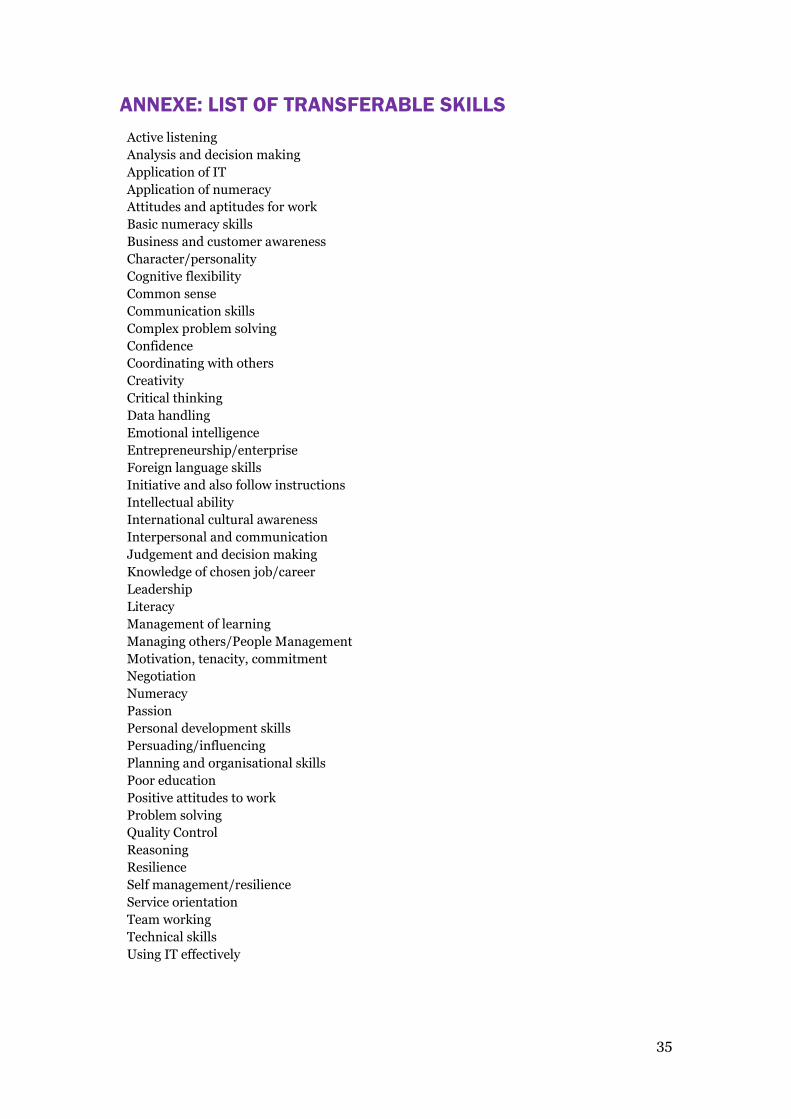
ANNEXE: LIST OF TRANSFERABLE SKILLS
Active listening
Analysis and decision making
Application of IT
Application of numeracy
Attitudes and aptitudes for work
Basic numeracy skills
Business and customer awareness
Character/personality
Cognitive flexibility
Common sense
Communication skills
Complex problem solving
Confidence
Coordinating with others
Creativity
Critical thinking
Data handling
Emotional intelligence
Entrepreneurship/enterprise
Foreign language skills
Initiative and also follow instructions
Intellectual ability
International cultural awareness
Interpersonal and communication
Judgement and decision making
Knowledge of chosen job/career
Leadership
Literacy
Management of learning
Managing others/People Management
Motivation, tenacity, commitment
Negotiation
Numeracy
Passion
Personal development skills
Persuading/influencing
Planning and organisational skills
Poor education
Positive attitudes to work
Problem solving
Quality Control
Reasoning
Resilience
Self management/resilience
Service orientation
Team working
Technical skills
Using IT effectively
This publication has been produced by Universities UK (UUK), the representative organisation for the UK’s universities. Founded in 1918, its mission is to be the voice of universities in the UK, providing high quality leadership and support to its members to promote a successful and diverse higher education sector. With 135 members and offices in London, Cardiff (Universities Wales) and Edinburgh (Universities Scotland), it promotes the strength and success of UK universities nationally and internationally.
Woburn House, 20 Tavistock Square London WC1H 9HQ
Tel: +44 (0)20 7419 4111 Email: [email protected] Website: www.universitiesuk.ac.uk Twitter: @UniversitiesUK
To download this publication, or for the full list of Universities UK publications, visit www.universitiesuk.ac.uk
September 2016
ISBN: 978-1-84036-366-1