higher education vis - status of muslims vis-a- india 2015 institute of objective studies,€¦ ·...
TRANSCRIPT

Higher Education vis
Higher Education - Status of Muslims vis-a-vis
Other Social Groups,
India – 2015
Institute of Objective Studies,
162, Jogabai Main Road,
Jamia Nagar, New Delhi – 110025
1

Higher Education - Status of Muslims vis-a-vis Other Social Groups 2014-15
Details of Slides:
1. Education For All (EFA) and Right to Education (RTE) in India 3 - 4
2. Higher Education in India 5
3. Few Highlights of the Report of All India Survey on Higher Education 2014-15 (Provisional) , MHRD 6
4. Some Facts and Figures showing Position of Muslims in India 7
5. Percentage Distribution in Education Across SRCs- Round 61 (2004-05) and Round 68 (2011-12) 8 - 10
5. Work Participation - % Distribution Across SRCs - Round 61 (2004-05) and Round 68 (2011-12) 11 – 13
6. All-India Enrolment and Percentage in Various Social Categories 2014-15 14
7. Category-wise Enrolment in Various Types of Universities 2014-15 - (b) Affiliated and Constituent Colleges 15 – 17
8. Universities in India 2015 18
9. Some Muslim Modern Universities in India 2015 19
10. First Muslim in India – Some Shining Stars 20
11. First Muslim Female IAS and IPS Officer in India 21
12. Some Data/Information about Muslim IAS Officers, High Court Judges and in Police in India 22
12. State-wise Muslim IAS Officers Promoted and Selected in 20 Years (from 1990 to 2009) 23
13. High Court Judges as on 01-02-16 24 – 27
14. Representation of SCs-STs-Muslims in Police Force, 2001 – 2013 28
15. UPSC Civil Services Final Result 2016; Muslim Graduate who was denied Job 29
16. Suggestions and Conclusion 30
2
Items Slide No.

3
Education For All at global level and Right to Education of India
Education For All (EFA) at global level as well as Right to Education (RTE) of India is very much
linked to Higher Education in India.
Education For All (EFA) is a global movement led by UNESCO (United Nation Educational,
Scientific and Cultural Organization), aiming to meet the learning needs of all children, youth and
adults by 2015. UNESCO has been mandated to lead the movement and coordinate the international
efforts to reach Education for All. Governments, Development Agencies, Civil Society, Non-
Government Organizations (NGOs) and the media are but some of the partners working towards
reaching these goals.
'The Right of Children to Free and Compulsory Education Act' or 'Right to Education Act also
known as RTE', is an Act of the Parliament of India enacted on 4 August 2009, which describes the
modalities of the importance of free and compulsory education for children between 6 and 14 in
India under Article 21A of the Indian Constitution. India became one of 135 countries to
make education a fundamental right of every child when the act came into force on 1 April 2010.
The basic objective of the RTE Act is stated as follows: “Every child of the age of six to fourteen
years shall have a right to free and compulsory education in a neighbourhood school till
completion of elementary education.”

4
Education For All at global level as well as Right to Education of India is the base for
Higher Education in Indian. As UNESCO together with other organisations is trying
hard to make people educated all over the world. By 2015 due these efforts by all
countries achievements have been made.
The dropout at different levels of education Primary, Middle, Secondary and Hr
Secondary will have an adverse effect on Higher Education which has happened in
the case of SCs, STs and Muslims.
The Sachchar Committee Report which was based on NSSO data of Round 61 (2004-
05) and after that NSSO data of Round 68 (2011-12) has shown that percentage of
Muslims at Primary level (Round 61- 13.6%; Round 68- 15.3%) to Higher Education
(Round 61- 6.0%; Round 68 - 6.4%) – Table 1. has shown a downward trend where as
that of Hindu-UC (Upper Caste) is just reverse being at Primary level (Round 61-
21.6%; Round 68 - 26.5%) and for Higher Education (Round 61- 54.3%; Round 68 –
47.2%).
The Report released by Ministry of Human Resource Development on “All India
Survey on Higher Education 2014-15 (Provisional)” depicts that condition of
Muslims in Higher Education (percentage of Muslim Enrolment being only 4.45%)
is still very bad being worse than SCs (13.42%) and STs (4.77%) – Table 3.

Higher Education in India
India has a long and venerable history in the field of higher education. In ancient times, the country was known to
have been home to the oldest formal universities in the world. The more striking of these ancient universities were:
1.Takshila (now in Pakistan)
2.Nalanda (in the modern state of Bihar) and
3.Ujjaini (in modern Madhya Pradesh) a major centre for mathematics, literature, philosophy and astronomy
These were famous in the prehistoric world and attracted students from all parts of India, Central Asia, China and
South-east Asia. The Hindu-Buddhist University of Takshila, the oldest, was probably established in 6 century B.C.
It was only during British colonial rule that formal university education was revived. Modern colleges were set up in
Agra, Nagpur, Calcutta, Bombay and Madras in the early nineteenth century. This introduction of Western learning,
made accessible through the knowledge of English, was a very important factor that allowed the emergence of
India's middle class. And this so termed 'middle class' would go on to produce legends after legends when it came to
history of higher education in India.
In 1857, three federal examining universities on the pattern of London University were established in the three main
British-controlled cities of Calcutta, Bombay and Madras. The existing colleges were affiliated to these universities.
Over the next several decades, more universities were founded and by 1947 there were 25 universities in the country.
Post Independence, history of higher education in India went through phases of rapid expansion. The number of
universities in the country leapt from 25 in 1947 to 348 in 2005. Enrollment rose from 0.1 million in 1947 to 10.5
million in 2005.
In present times, the country's higher educational institutions have an enrolment of 10.5 million students and turn
out 2.5 million each year.
Approximately 45 per cent of the students pursue degrees in the arts, 20 per cent in sciences and 18 per cent in
commerce. The remaining 17 per cent are enrolled into professional courses like law and medicine. The sheer
numbers may seem enormous, but that appears pretty small for a country of India's size.
5

Few Highlights of the Report of All India Survey on Higher
Education 2014-15 (Provisional) – MHRD
•Survey covers entire Higher Education Institutions in the country. Institutions are categorized in
3 broad categories: University, College and Stand-Alone Institutions*.
•There are 757 Universities, 38056 Colleges and 11922 Stand-Alone Institutions* and out of them
716 Universities, 29056 Colleges and 6837 Stand-Alone Institutions* have responded during the
survey.
•267 Universities are privately managed. There are 43 Central Universities, 1 Central and 13 State
Open Universities 69 Institutes of National Importance, 316 State Public Universities, 5 Institute
under State Legislature Act, 37 Deemed Universities Government and 6 Other Universities.
•The top 7 States in terms of highest number of colleges in India are UP, Maharashtra,
Karnataka, Rajasthan, Andhra Pradesh, Tamil Nadu and Telangana.
•76% Colleges are privately managed 61% Private-Unaided and 15% Private Aided.
•Total Enrolment in has been estimated 33.3 million with 17.9 million boys and 15.4 million girls
(46% of Total Enrolment).
•Out of Total Enrolment SC students constitute 13.4%, ST students 4.8% and that of Muslims is
only 4.45% (i.e. 14.8 million which constitutes Male – 2.36% and Female 2.09% only).
6
*Stand‐alone institutions (not affiliated with Universities) which are not empowered to provide degree and therefore run
Diploma Level Programmes;
MHRD = Ministry of Human Resource Development

7
Some Facts and Figures
Showing
Position of Muslims
in India
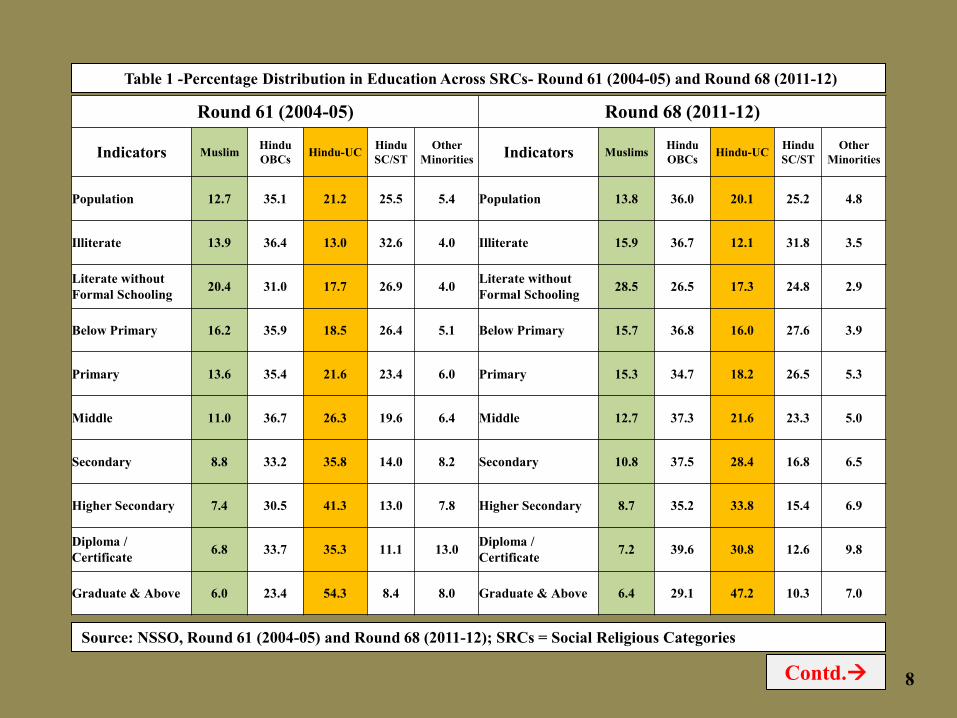
Table 1 -Percentage Distribution in Education Across SRCs- Round 61 (2004-05) and Round 68 (2011-12)
Round 61 (2004-05) Round 68 (2011-12)
Indicators Muslim Hindu
OBCs Hindu-UC
Hindu
SC/ST
Other
Minorities Indicators Muslims
Hindu
OBCs Hindu-UC
Hindu
SC/ST
Other
Minorities
Population 12.7 35.1 21.2 25.5 5.4 Population 13.8 36.0 20.1 25.2 4.8
Illiterate 13.9 36.4 13.0 32.6 4.0 Illiterate 15.9 36.7 12.1 31.8 3.5
Literate without
Formal Schooling 20.4 31.0 17.7 26.9 4.0
Literate without
Formal Schooling 28.5 26.5 17.3 24.8 2.9
Below Primary 16.2 35.9 18.5 26.4 5.1 Below Primary 15.7 36.8 16.0 27.6 3.9
Primary 13.6 35.4 21.6 23.4 6.0 Primary 15.3 34.7 18.2 26.5 5.3
Middle 11.0 36.7 26.3 19.6 6.4 Middle 12.7 37.3 21.6 23.3 5.0
Secondary 8.8 33.2 35.8 14.0 8.2 Secondary 10.8 37.5 28.4 16.8 6.5
Higher Secondary 7.4 30.5 41.3 13.0 7.8 Higher Secondary 8.7 35.2 33.8 15.4 6.9
Diploma /
Certificate 6.8 33.7 35.3 11.1 13.0
Diploma /
Certificate 7.2 39.6 30.8 12.6 9.8
Graduate & Above 6.0 23.4 54.3 8.4 8.0 Graduate & Above 6.4 29.1 47.2 10.3 7.0
Source: NSSO, Round 61 (2004-05) and Round 68 (2011-12); SRCs = Social Religious Categories
8 Contd.

12.7 13.9
20.4
16.2
13.6
11.0
8.8 7.4 6.8
6.0
35.1 36.4
31.0
35.9 35.4 36.7
33.2
30.5
33.7
23.4
21.2
13.0
17.7 18.5
21.6
26.3
35.8
41.3
35.3
54.3
25.5
32.6
26.9 26.4
23.4
19.6
14.0 13.0
11.1
8.4
5.4 4.0 4.0
5.1 6.0 6.4
8.2 7.8
13.0
8.0
0.0
10.0
20.0
30.0
40.0
50.0
60.0
Population Illiterate Literate
without
Formal
Schooling
Below
Primary
Primary Middle Secondary Higher
Secondary
Diploma /
Cerificate
Graduate &
Above
Muslim Hindu OBCs Hindu-UC Hindu SC/ST Other Minorities
Muslims
Hindu-UC
Fig 1 - Percentage Distribution in Education of SRCs Round 61 (2004-05)
9 Contd.

13.8
15.9
28.5
15.7
15.3
12.7
10.8 8.7 7.2 6.4
36.0 36.7
26.5
36.8
34.7
37.3 37.5
35.2
39.6
29.1
20.1
12.1
17.3 16.0 18.2
21.6
28.4
33.8
30.8
47.2
25.2
31.8
24.8
27.6 26.5
23.3
16.8
15.4
12.6
10.3
4.8 3.5
2.9 3.9
5.3 5.0
6.5 6.9
9.8
7.0
0.0
5.0
10.0
15.0
20.0
25.0
30.0
35.0
40.0
45.0
50.0
Population Illiterate Literate without
Formal
Schooling
Below Primary Primary Middle Secondary Higher
Secondary
Diploma /
Cerificate
Graduate &
Above
Muslims Hindu OBCs Hindu-UC Hindu SC/ST Other Minorities
Fig 2 - Percentage Distribution in Education of SRCs Round 68 (2011-12)
Muslims
Hindu-UC
10

Table 2 - Work Participation - Percentage Distribution Across SRCs - Round 61 (2004-05) and Round 68 (2011-12)
Items
Round 61 (2004-05)
Items
Round 68 (2011-12)
Muslim Hindu
OBCs Hindu-UC
Hindu
SCs/STs
Other
Minorities Muslim
Hindu
OBCs Hindu-UC
Hindu
SCs/ST
Other
Minorities
Population 12.7 35.1 21.2 25.5 5.4 Population 13.8 36.0 20.1 25.2 4.8
Workers 10.2 36.5 20.3 27.3 5.7 Workers 11.7 36.8 19.4 26.9 5.1
Self Employed,
Unpaid Family
Worker, Employers
11.1 39.4 22.6 21.3 5.6
Self Employed,
Unpaid Family
Worker, Employers
12.4 39.4 21.4 21.7 5.1
Regular Salary 9.0 30.7 33.6 19.3 7.4 Regular Salary 10.7 31.8 31.7 18.9 6.9
Casual Workers 9.0 33.7 9.1 43.2 4.9 Casual Workers 11.2 35.2 8.6 41.0 4.1
Agriculture 7.3 39.3 16.7 31.3 5.4 Agriculture 7.5 40.9 15.8 31.1 4.8
Industry 16.0 34.8 18.9 25.0 5.2 Industry 17.7 32.7 16.3 28.8 4.6
Traditional Services 17.8 31.8 26.5 18.0 5.8 Traditional
Services 18.1 34.6 25.6 16.7 5.1
Modern Services 7.7 28.3 39.5 16.4 8.1 Modern Services 8.3 31.0 33.9 19.3 7.5
Govt./Public Sector 6.2 27.3 35.9 23.3 7.2 Govt./Public Sector 7.0 30.4 30.4 25.5 6.7
Source: NSSO, Round 61 (2004-05) and Round 68 (2011-12); SRCs = Social Religious Categories
11 Contd.

12.7
10.2 11.1
9.0 9.0
7.3
16.0
17.8
7.7
6.2
35.1 36.5
39.4
30.7
33.7
39.3
34.8
31.8
28.3 27.3
21.2 20.3
22.6
33.6
9.1
16.7
18.9
26.5
39.5
35.9
25.5
27.3
21.3
19.3
43.2
31.3
25.0
18.0
16.4
23.3
5.4 5.7 5.6
7.4
4.9 5.4 5.2 5.8
8.1 7.2
0.0
5.0
10.0
15.0
20.0
25.0
30.0
35.0
40.0
45.0
50.0
Population Workers Self Employed,
Unpaid Family
Worker, Employers
Regular Salary Casual Workers Agriculture Industry Traditional Services Modern Services Government/Public
Sector
Muslim Hindu OBCs Hindu-UC Hindu SCs/STs Other Minorities
Round 61 (2004-05)
Fig 3- Percentage of Workers Participation of SRCs from NSSO Data
12 Contd.

13.8
11.7 12.4
10.7 11.2
7.5
17.7 18.1
8.3
7.0
36.0 36.8
39.4
31.8
35.2
40.9
32.7
34.6
31.0 30.4
20.1 19.4
21.4
31.7
8.6
15.8 16.3
25.6
33.9
30.4
25.2
26.9
21.7
18.9
41.0
31.1
28.8
16.7
19.3
25.5
4.8 5.1 5.1
6.9
4.1 4.8 4.6
5.1
7.5 6.7
0.0
5.0
10.0
15.0
20.0
25.0
30.0
35.0
40.0
45.0
Population Workers Self Employed,
Unpaid Family
Worker, Employers
Regular Salary Casual Workers Agriculture Industry Traditional Services Modern Services Government/Public
Sector
Muslim Hindu OBCs Hindu-UC Hindu SCs/ST Other Minorities
Fig 4 - Percentage of Workers Participation of SRCs* from NSSO Data Round 68 (2011-
13

Table 3 - All-India Enrolment and Percentage in Various Social Categories 2014-15
Items Numbers/
Percentage
All SC ST OBC PWD* Muslims Other Minorities
Total Total Total Total Total Total Total
Enrolment
Numbers 33272722 4463734 1586368 10945061 78449 1480736 644135
Percentage
of All 100.00 13.42 4.77 32.89 0.24 4.45 1.94
Item Numbers/
Percentage
All SC ST OBC PWD* Muslims Other Minorities
Male Female Male Female Male Female Male Female Male Female Male Female Male Female
Enrolment
Numbers 17906704 15366018 2423150 2040584 857804 728564 5845386 5099675 43976 34473 785475 695261 293997 350138
Percentage
of All 53.82 46.18 7.28 6.13 2.58 2.19 17.57 15.33 0.13 0.10 2.36 2.09 0.88 1.05
Percentage
of Total 53.82 46.18 54.29 45.71 54.07 45.93 53.41 46.59 56.06 43.94 53.05 46.95 45.64 54.36
*PWD = Person With Disability
Source: All India Survey on Higher Education 2014-15 (Provisional), M/o HRD
14
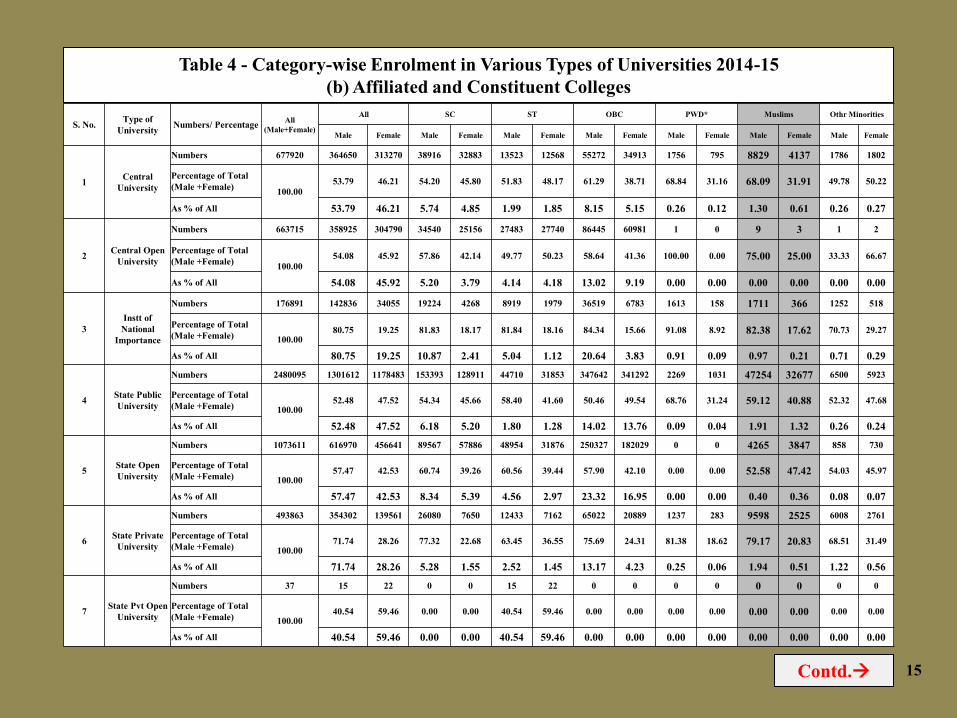
Table 4 - Category-wise Enrolment in Various Types of Universities 2014-15
(b) Affiliated and Constituent Colleges
S. No. Type of
University Numbers/ Percentage
All
(Male+Female)
All SC ST OBC PWD* Muslims Othr Minorities
Male Female Male Female Male Female Male Female Male Female Male Female Male Female
1 Central
University
Numbers 677920 364650 313270 38916 32883 13523 12568 55272 34913 1756 795 8829 4137 1786 1802
Percentage of Total
(Male +Female) 100.00
53.79 46.21 54.20 45.80 51.83 48.17 61.29 38.71 68.84 31.16 68.09 31.91 49.78 50.22
As % of All 53.79 46.21 5.74 4.85 1.99 1.85 8.15 5.15 0.26 0.12 1.30 0.61 0.26 0.27
2 Central Open
University
Numbers 663715 358925 304790 34540 25156 27483 27740 86445 60981 1 0 9 3 1 2
Percentage of Total
(Male +Female) 100.00
54.08 45.92 57.86 42.14 49.77 50.23 58.64 41.36 100.00 0.00 75.00 25.00 33.33 66.67
As % of All 54.08 45.92 5.20 3.79 4.14 4.18 13.02 9.19 0.00 0.00 0.00 0.00 0.00 0.00
3
Instt of
National
Importance
Numbers 176891 142836 34055 19224 4268 8919 1979 36519 6783 1613 158 1711 366 1252 518
Percentage of Total
(Male +Female) 100.00 80.75 19.25 81.83 18.17 81.84 18.16 84.34 15.66 91.08 8.92 82.38 17.62 70.73 29.27
As % of All 80.75 19.25 10.87 2.41 5.04 1.12 20.64 3.83 0.91 0.09 0.97 0.21 0.71 0.29
4 State Public
University
Numbers 2480095 1301612 1178483 153393 128911 44710 31853 347642 341292 2269 1031 47254 32677 6500 5923
Percentage of Total
(Male +Female) 100.00 52.48 47.52 54.34 45.66 58.40 41.60 50.46 49.54 68.76 31.24 59.12 40.88 52.32 47.68
As % of All 52.48 47.52 6.18 5.20 1.80 1.28 14.02 13.76 0.09 0.04 1.91 1.32 0.26 0.24
5 State Open
University
Numbers 1073611 616970 456641 89567 57886 48954 31876 250327 182029 0 0 4265 3847 858 730
Percentage of Total
(Male +Female) 100.00 57.47 42.53 60.74 39.26 60.56 39.44 57.90 42.10 0.00 0.00 52.58 47.42 54.03 45.97
As % of All 57.47 42.53 8.34 5.39 4.56 2.97 23.32 16.95 0.00 0.00 0.40 0.36 0.08 0.07
6 State Private
University
Numbers 493863 354302 139561 26080 7650 12433 7162 65022 20889 1237 283 9598 2525 6008 2761
Percentage of Total
(Male +Female) 100.00 71.74 28.26 77.32 22.68 63.45 36.55 75.69 24.31 81.38 18.62 79.17 20.83 68.51 31.49
As % of All 71.74 28.26 5.28 1.55 2.52 1.45 13.17 4.23 0.25 0.06 1.94 0.51 1.22 0.56
7 State Pvt Open
University
Numbers 37 15 22 0 0 15 22 0 0 0 0 0 0 0 0
Percentage of Total
(Male +Female) 100.00 40.54 59.46 0.00 0.00 40.54 59.46 0.00 0.00 0.00 0.00 0.00 0.00 0.00 0.00
As % of All 40.54 59.46 0.00 0.00 40.54 59.46 0.00 0.00 0.00 0.00 0.00 0.00 0.00 0.00
Contd. 15

Table 5 - Category-wise Enrolment in Various Types of Universities 2014-15
(b) Affiliated and Constituent Colleges
S. No. Type of
University
Numbers/
Percentage
All
(Male+Female)
All SC ST OBC PWD* Muslims Othr Minorities
Male Female Male Female Male Female Male Female Male Female Male Female Male Female
8 Instt under State
Legislature Act
Numbers 2843 1499 1344 195 256 36 47 305 444 3 2 18 41 0 0
% of Total (Male
+Female) 100.00
52.73 47.27 43.24 56.76 43.37 56.63 40.72 59.28 60.00 40.00 30.51 69.49 0.00 0.00
As % of All 52.73 47.27 6.86 9.00 1.27 1.65 10.73 15.62 0.11 0.07 0.63 1.44 0.00 0.00
9 Deemed
University - Govt.
Numbers 43524 32168 11356 2458 1009 1438 566 5032 2142 166 27 159 21 1110 366
% of Total (Male
+Female) 100.00
73.91 26.09 70.90 29.10 71.76 28.24 70.14 29.86 86.01 13.99 88.33 11.67 75.20 24.80
As % of All 73.91 26.09 5.65 2.32 3.30 1.30 11.56 4.92 0.38 0.06 0.37 0.05 2.55 0.84
10
Deemed
University - Govt.
Aided
Numbers 88136 50911 37225 4421 3740 1348 990 12423 11951 58 73 5377 2963 1322 1413
% of Total (Male
+Female) 100.00
57.76 42.24 54.17 45.83 57.66 42.34 50.97 49.03 44.27 55.73 64.47 35.53 48.34 51.66
As % of All 57.76 42.24 5.02 4.24 1.53 1.12 14.10 13.56 0.07 0.08 6.10 3.36 1.50 1.60
11
Deemed
University -
Private
Numbers 664044 422058 241986 12042 7564 4784 2706 74921 40075 162 134 8206 4011 13072 10194
% of Total (Male
+Female) 100.00
63.56 36.44 61.42 38.58 63.87 36.13 65.15 34.85 54.73 45.27 67.17 32.83 56.18 43.82
As % of All 63.56 36.44 1.81 1.14 0.72 0.41 11.28 6.03 0.02 0.02 1.24 0.60 1.97 1.54
12 Others
Numbers 5270 1856 3414 347 432 101 155 658 808 14 7 22 57 13 87
% of Total (Male
+Female) 100.00
35.22 64.78 44.54 55.46 39.45 60.55 44.88 55.12 66.67 33.33 27.85 72.15 13.00 87.00
As % of All 35.22 64.78 6.58 8.20 1.92 2.94 12.49 15.33 0.27 0.13 0.42 1.08 0.25 1.65
13 All India
Numbers 6369949 3647802 2722147 381630 269758 163744 117664 934566 702307 7279 2510 85448 50648 31922 23796
% of Total (Male
+Female) 100.00
57.27 42.73 58.59 41.41 58.19 41.81 57.09 42.91 74.36 25.64 62.79 37.21 57.29 42.71
As % of All 57.27 42.73 5.99 4.23 2.57 1.85 14.67 11.03 0.11 0.04 1.34 0.80 0.50 0.37
Source: All India Survey on Higher Education 2014-15 (Provisional), M/o HRD
*PWD = Person With Disability
16

S. No. Type of
University
Numbers/
Percentage
All
(Male +
Female)
All SC ST OBC PWD* Muslims Other Minorities
Male Female Male Female Male Female Male Female Male Female Male Female Male Female
1 Central
University
Numbers 884276 409118 475158 51737 50921 82306 90992 102880 116752 1630 1108 15042 17881 27043 35336
% of Total
(Male +Female)
100.00
46.27 53.73 50.40 49.60 47.49 52.51 46.84 53.16 59.53 40.47 45.69 54.31 43.35 56.65
As % of All 46.27 53.73 5.85 5.76 9.31 10.29 11.63 13.20 0.18 0.13 1.70 2.02 3.06 4.00
2 State Public
University
Numbers 24184971 12552595 11632376 1777871 1609063 566055 486622 4330716 4102173 31061 28697 633198 610565 198692 274928
% of Total
(Male +Female)
100.00
51.90 48.10 52.49 47.51 53.77 46.23 51.36 48.64 51.98 48.02 50.91 49.09 41.95 58.05
As % of All 51.90 48.10 7.35 6.65 2.34 2.01 17.91 16.96 0.13 0.12 2.62 2.52 0.82 1.14
3 Grand Total
Numbers 25069247 12961713 12107534 1829608 1659984 648361 577614 4433596 4218925 32691 29805 648240 628446 225735 310264
P% of Total
(Male +Female)
100.00
51.70 48.30 52.43 47.57 52.89 47.11 51.24 48.76 52.31 47.69 50.78 49.22 42.11 57.89
As % of All 51.70 48.30 7.30 6.62 2.59 2.30 17.69 16.83 0.13 0.12 2.59 2.51 0.90 1.24
Table 6 - Category-wise Enrolment in Various Types of Universities 2014-15
(b) Affiliated and Constituent Colleges
Source: All India Survey on Higher Education 2014-15 (Provisional), M/o HRD
*PWD = Person With Disability
17

The emphasis on higher education in India can be understood by the number of universities currently present in India
and the quality of education they provide. As of 2014, there are 677 universities, 37,204 colleges and 11443 stand-alone
institutions in India, as per the latest statistics from the website of India's HRD ministry. These numbers would only
have increased by now.
•201 Private Universities
•45 Central Universities
•1 Central/ National Open University
•13 State Open Universities
•73 Institutes of National Importance (INI)
•290 State Public Universities
•5 Institute under State Legislature Act
•38 Deemed Universities (Government)
•11 Deemed Universities (Government Aided)
•3 Other Universities
Universities in India 2015
Table 7 - Different Types of Universities 2015
All India
Central Central
(Open)
Instt. of
National
Importance
State
Public
State
(Open)
State (Pvt.) Instt. under
State Leg.
Act
Deemed
(Govt.)
Deemed
(Govt.
aided)
Deemed
(Pvt.)
Others Total
45 1 61 290 13 122 5 38 11 79 3 665
http://www.indiaeducation.net/universities/
18
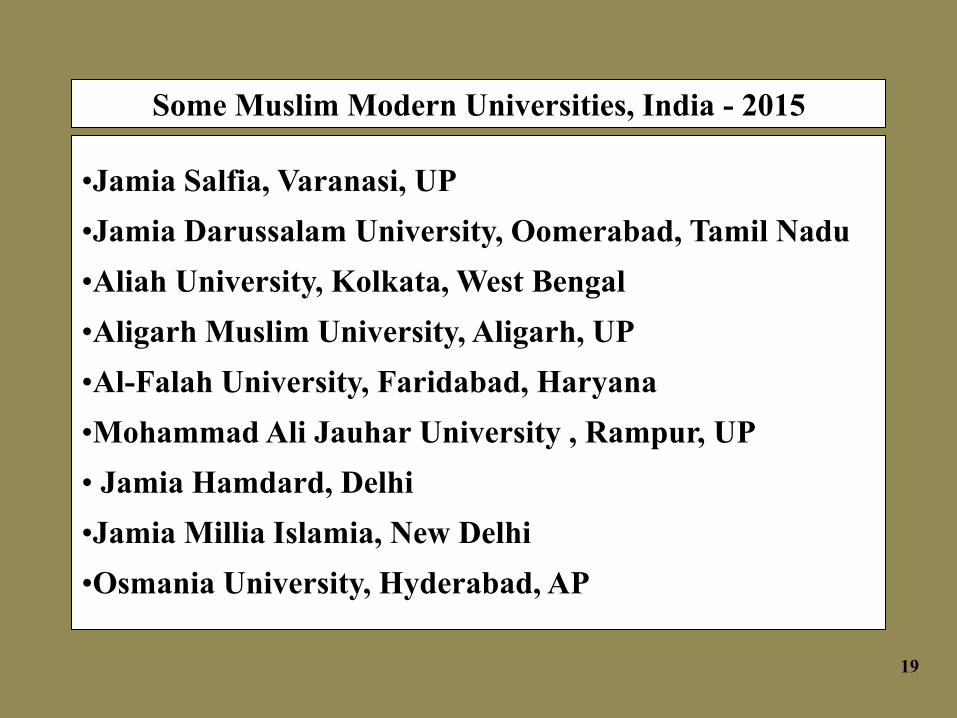
Some Muslim Modern Universities, India - 2015
•Jamia Salfia, Varanasi, UP
•Jamia Darussalam University, Oomerabad, Tamil Nadu
•Aliah University, Kolkata, West Bengal
•Aligarh Muslim University, Aligarh, UP
•Al-Falah University, Faridabad, Haryana
•Mohammad Ali Jauhar University , Rampur, UP
• Jamia Hamdard, Delhi
•Jamia Millia Islamia, New Delhi
•Osmania University, Hyderabad, AP
19

First Muslim in India – Some Shining Stars
First Muslim in the Field Name
First Muslim President of Indian Republic Dr Zakir Hussain
First Education Minister of Independent India Maulana Abul Kalam Azad
First President of India to die in office Dr Zakir Hussain
First Foreign recipient of Bharat Ratna Khan Abdul Gaffar Khan
First Muslim Female IAS Officer Ms Yasmin Ahmed
First Muslim Female IPS Officer Dr Ruveda Salam
First Female Judge in Supreme Court Ms Fatima Beevi
20
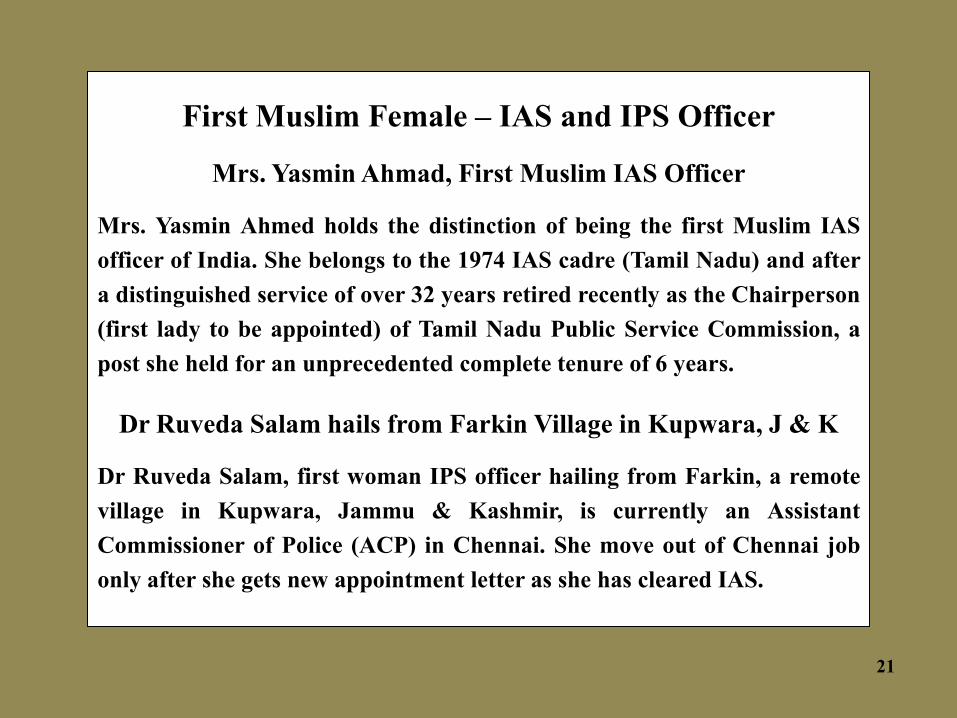
First Muslim Female – IAS and IPS Officer
Mrs. Yasmin Ahmad, First Muslim IAS Officer
Mrs. Yasmin Ahmed holds the distinction of being the first Muslim IAS
officer of India. She belongs to the 1974 IAS cadre (Tamil Nadu) and after
a distinguished service of over 32 years retired recently as the Chairperson
(first lady to be appointed) of Tamil Nadu Public Service Commission, a
post she held for an unprecedented complete tenure of 6 years.
Dr Ruveda Salam hails from Farkin Village in Kupwara, J & K
Dr Ruveda Salam, first woman IPS officer hailing from Farkin, a remote
village in Kupwara, Jammu & Kashmir, is currently an Assistant
Commissioner of Police (ACP) in Chennai. She move out of Chennai job
only after she gets new appointment letter as she has cleared IAS.
21

22
Some Data/Information about Muslim IAS Officers, High Court
Judges and in Police in India
1. Table 8 - State-wise Muslim IAS Officers (Promoted + Selected) in 20 Years (from 1990 to 2009):
Percentage of Muslim IAS Officers (Promoted + Selected) on an average has been only 3.95%
2. Table 9 - High Court Judges as on 01-02-16:
i) Percentage of Muslim Judges out of Total Judges of All High Courts is:
a) Muslims of Judges out of Total Judges = 5.59%
b) Muslim Female Judges of Total Female Judges = 6.98%
ii) Percentage of Muslim Additional Judges out of Total Additional Judges of All High Courts is:
a) Muslim Additional Judges out of Total Additional Judges = 5.45%
b) Muslim Female Additional Judges of Total Female Additional Judges = 7.14%
3. Table 10 - Representation of SCs – STs - Muslims in Police Force from 2001 to 2013:-
Percentage of SCs – increased from 13.4% (2001) to 14.7% (2013)
Percentage of STs – increased from 8.06% (2001) to 10.82% (2013)
Percentage of Muslims - decreased from 8.4% (2001) to 6.27% (2013)

Table 8 - State-wise Muslim IAS Officers Promoted and Selected in 20 Years (from 1990 to 2009)
State / UT Promoted RR Total (2+3)
Muslims
Male Female Total (Male+Female) Percent
Promoted RR Promoted RR Promoted
(5+7)
RR
(6+8)
Total
(9+10)
Promoted
(9 of 2)
RR
(10 of 3)
Total
(11 of 4)
1 2 3 4 5 6 7 8 9 10 11 12 13 14
Andhra Pradesh 78 83 161 3 4 0 0 3 4 7 3.85 4.82 4.35
Assam - Meghalya 50 72 122 8 3 0 0 8 3 11 16.00 4.17 9.02
Bihar 24 80 104 2 0 0 1 2 1 3 8.33 1.25 2.88
Chhattisgarh 36 54 90 0 1 0 2 0 3 3 0.00 5.56 3.33
Gujarat 59 76 135 1 2 0 1 1 3 4 1.69 3.95 2.96
Haryana 46 55 101 0 1 0 0 0 1 1 0.00 1.82 0.99
Himachal Pradesh 19 28 47 0 1 0 0 0 1 1 0.00 3.57 2.13
J and K 34 29 63 20 2 0 0 20 2 22 58.82 6.90 34.92
Jharkhand 19 43 62 1 1 0 0 1 1 2 5.26 2.33 3.23
Karnataka 50 69 119 3 4 0 2 3 6 9 6.00 8.70 7.56
Kerala 43 47 90 3 2 0 0 3 2 5 6.98 4.26 5.56
Madhya Pradesh 82 99 181 1 1 0 1 1 2 3 1.22 2.02 1.66
Maharashtra 93 116 209 0 0 0 1 0 1 1 0.00 0.86 0.48
Manipur - Tripura 25 60 85 0 3 0 0 0 3 3 0.00 5.00 3.53
Nagaland 12 21 33 0 2 0 0 0 2 2 0.00 9.52 6.06
Orissa 18 68 86 0 0 0 0 0 0 0 0.00 0.00 0.00
Punjab 37 70 107 0 2 0 0 0 2 2 0.00 2.86 1.87
Rajasthan 9 68 77 0 0 0 0 0 0 0 0.00 0.00 0.00
Sikkim 3 14 17 0 0 0 0 0 0 0 0.00 0.00 0.00
Tamil Nadu 67 94 161 3 2 0 1 3 3 6 4.48 3.19 3.73
Uttar Pradesh 22 137 159 0 4 0 0 0 4 4 0.00 2.92 2.52
Uttarakhand 21 35 56 0 0 0 0 0 0 0 0.00 0.00 0.00
West Bengal 69 76 145 4 5 0 1 4 6 10 5.80 7.89 6.90
AGMU 52 95 147 1 1 0 0 1 1 2 1.92 1.05 1.36
India 968 1589 2557 50 41 0 10 50 51 101 5.17 3.21 3.95
Source: Civil List 2011, Ministry of Personnel, Public Grievances and Pensions
N.B. RR= Regular Recruitment; Total = Promoted + RR; AGMUT = Arunachal Pradesh-Goa-Mizoram-Union Territories
23
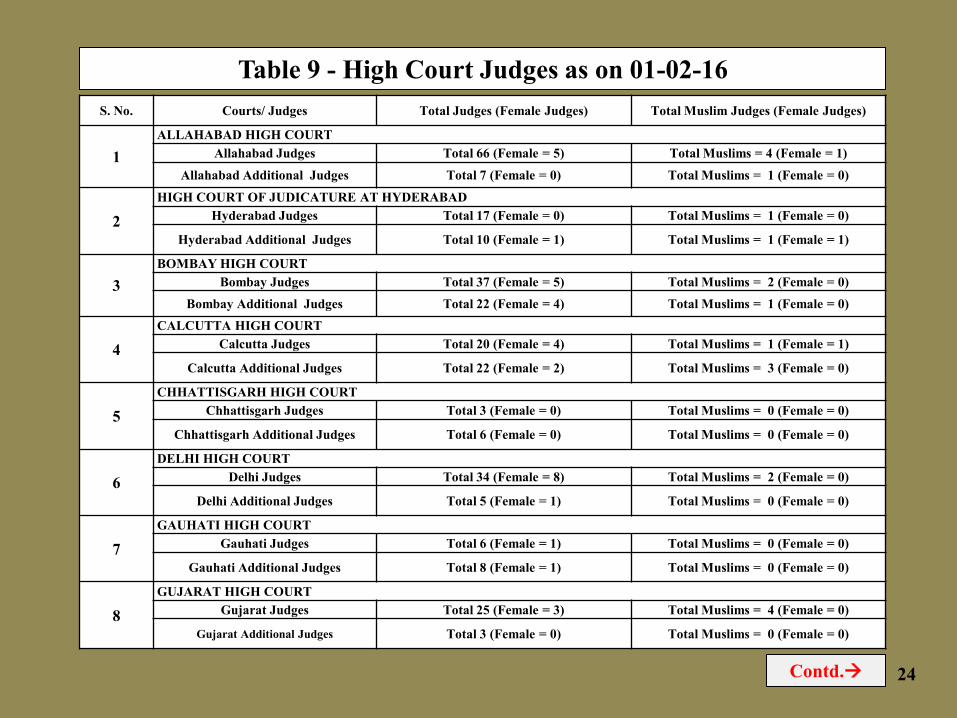
Table 9 - High Court Judges as on 01-02-16
S. No. Courts/ Judges Total Judges (Female Judges) Total Muslim Judges (Female Judges)
1
ALLAHABAD HIGH COURT
Allahabad Judges Total 66 (Female = 5) Total Muslims = 4 (Female = 1)
Allahabad Additional Judges Total 7 (Female = 0) Total Muslims = 1 (Female = 0)
2
HIGH COURT OF JUDICATURE AT HYDERABAD
Hyderabad Judges Total 17 (Female = 0) Total Muslims = 1 (Female = 0)
Hyderabad Additional Judges Total 10 (Female = 1) Total Muslims = 1 (Female = 1)
3
BOMBAY HIGH COURT
Bombay Judges Total 37 (Female = 5) Total Muslims = 2 (Female = 0)
Bombay Additional Judges Total 22 (Female = 4) Total Muslims = 1 (Female = 0)
4
CALCUTTA HIGH COURT
Calcutta Judges Total 20 (Female = 4) Total Muslims = 1 (Female = 1)
Calcutta Additional Judges Total 22 (Female = 2) Total Muslims = 3 (Female = 0)
5
CHHATTISGARH HIGH COURT
Chhattisgarh Judges Total 3 (Female = 0) Total Muslims = 0 (Female = 0)
Chhattisgarh Additional Judges Total 6 (Female = 0) Total Muslims = 0 (Female = 0)
6
DELHI HIGH COURT
Delhi Judges Total 34 (Female = 8) Total Muslims = 2 (Female = 0)
Delhi Additional Judges Total 5 (Female = 1) Total Muslims = 0 (Female = 0)
7
GAUHATI HIGH COURT
Gauhati Judges Total 6 (Female = 1) Total Muslims = 0 (Female = 0)
Gauhati Additional Judges Total 8 (Female = 1) Total Muslims = 0 (Female = 0)
8
GUJARAT HIGH COURT
Gujarat Judges Total 25 (Female = 3) Total Muslims = 4 (Female = 0)
Gujarat Additional Judges Total 3 (Female = 0) Total Muslims = 0 (Female = 0)
24 Contd.

S. No. Courts/ Judges Total Judges (Female Judges) Total Muslim Judges (Female Judges)
9 HIMACHAL PRADESH HIGH COURT
Himachal Pradesh Judges Total 7 (Female = 0) Total Muslims = 1 (Female = 0)
10
JAMMU & KASHMIR HIGH COURT
Jammu & Kashmir Judges Total 8 (Female = 0) Total Muslims = 3 (Female = 0)
Jammu & Kashmir Additional
Judges Total 1 (Female = 0) Total Muslims = 0 (Female = 0)
11
JHARKHAND HIGH COURT
Jharkhand Judges Total 9 (Female = 0) Total Muslims = 0 (Female = 0)
Jharkhand Additional Judges Total 5 (Female = 0) Total Muslims = 0 (Female = 0)
12
KARNATAKA HIGH COURT
Karnataka Judges Total 22 (Female = 1) Total Muslims = 1 (Female = 0)
Karnataka Additional Judges Total 9 (Female = 2) Total Muslims = 0 (Female = 0)
13
KERALA HIGH COURT
Kerala Judges Total 19 (Female = 0) Total Muslims = 2 (Female = 0)
Kerala Additional Judges Total 16 (Female = 3) Total Muslims = 2 (Female = 0)
14
Madhya Pradesh High Court
Madhya Pradesh Judges Total 22 (Female = 1) Total Muslims = 0 (Female = 0)
Madhya Pradesh Additional
Judges Total 7 (Female = 1) Total Muslims = 0 (Female = 0)
15 MADRAS HIGH COURT
Madras Judges Total 37 (Female = 4) Total Muslims = 0 (Female = 0)
16 MANIPUR HIGH COURT
Manipur Judges Total 3 (Female = 0) Total Muslims = 0 (Female = 0)
17 MEGHALAYA HIGH COURT
Meghalaya Judges Total 1 (Female = 0) Total Muslims = 0 (Female = 0)
Table 9 - High Court Judges as on 01-02-16
25 Contd.

S. No. Courts/ Judges Total Judges (Female Judges) Total Muslim Judges (Female Judges)
19
ORISSA HIGH COURT
Orissa Judges Total 16 (Female = 1) Total Muslims = 0 (Female = 0)
Orissa Additional Judges Total 6 (Female = 0) Total Muslims = 0 (Female = 0)
20
PATNA HIGH COURT
Patna Judges Total 22 (Female = 1) Total Muslims = 2 (Female = 0)
Patna Additional Judges Total 6 (Female = 2) Total Muslims = 0 (Female = 0)
21
PUNJAB & HARYANA HIGH COURT
Punjab & Haryana Judges Total 39 (Female = 6) Total Muslims = 1 (Female = 1)
Punjab & Haryana Additional Judges Total 11 (Female = 2) Total Muslims = 0 (Female = 0)
22
RAJASTHAN HIGH COURT
Rajasthan Judges Total 22 (Female = 2) Total Muslims = 1 (Female = 0)
Rajasthan Additional Judges Total 3 (Female = 1) Total Muslims = 0 (Female = 0)
23 SIKKIM HIGH COURT
Sikkim Judges Total 2 (Female = 1) Total Muslims = 0 (Female = 0)
24 TRIPURA HIGH COURT
Tripura Judges Total 4 (Female = 0) Total Muslims = 0 (Female = 0)
25 UTTARAKHAND HIGH COURT
Uttarakhand Judges Total 6 (Female = 0)
Table 9 - High Court Judges as on 01-02-16
26 Contd.

27
Courts/ Judges Total Judges
(Female Judges)
Total Muslim Judges
(Female Judges)
Total Judges
(All High Courts)
Total 447
(Female = 43)
Total Muslims = 25
(Female = 3)
Percentages of
Total Judges
Females of
Total = 6.92
Muslims of
Total = 5.59
Muslims Females of
Total Females = 6.98
Total Additional Judges
(All High Courts)
Total 110
(Female = 14)
Total Muslims = 6
(Female = 1)
Percentages of
Total Additional Judges
Females of
Total = 12.73
Muslims of
Total = 5.45
Muslims Females of
Total Females = 7.14
Table 9 - High Court Judges as on 01-02-16

Table 10 - Representation of SCs-STs-Muslims in Police Force, 2001 - 2013
Percentage of Police Personnel
S. No. SC ST Muslim Others Year
1 13.40 8.06 8.40 70.15 2001
2 13.58 8.03 8.38 70.01 2002
3 14.06 8.34 7.85 69.76 2003
4 13.31 8.11 7.12 71.46 2004
5 13.19 8.22 7.63 70.95 2005
6 14.24 8.62 5.46 71.68 2006
7 13.67 8.67 7.55 70.10 2007
8 13.28 9.13 7.05 70.54 2008
9 13.66 9.28 7.18 69.88 2009
10 13.38 9.71 6.91 70.00 2010
11 13.68 10.01 6.53 69.79 2011
12 14.02 10.38 6.51 69.09 2012
13 14.71 10.82 6.27 68.20 2013
13.40 13.58 14.06 13.31 13.19 14.24 13.67 13.28 13.66 13.38 13.68 14.02 14.71
8.06 8.03 8.34 8.11 8.22 8.62 8.67 9.13 9.28 9.71 10.01 10.38 10.82 8.40 8.38 7.85 7.12 7.63
5.46 7.55 7.05 7.18 6.91 6.53 6.51 6.27
70.15 70.01 69.76 71.46 70.95 71.68
70.10 70.54 69.88 70.00 69.79 69.09 68.20
0.00
10.00
20.00
30.00
40.00
50.00
60.00
70.00
80.00
2001 2002 2003 2004 2005 2006 2007 2008 2009 2010 2011 2012 2013
SC ST Muslim Others
Fig 5: Percentage of Police Personnel, 2001 - 2013
Source: National Crime Record Bureau
28

UPSC Civil Services Final Result 2016 declared
In UPSC Topper List 2016 – Athar Aamir Ul Shafi Khan got 2nd rank
in the Civil Services Exams 2015.
Muslim Graduate who was denied Job rejects 12 offers,
Says: He wants to be selected on Merit
Zeeshan Ali Khan, the 22-year-old MBA graduate who was denied a
job by a diamond export company in Mumbai because of his religion,
has turned down 12 other job offers he got. Zeeshan said he wanted to
get a job on the basis of merit and not sympathy.
This should also be part of approach of Muslims that they should toil
hard and make best efforts to achieve the goals in education, jobs and
everywhere.
29

Suggestions:
1. We should not have fear from other people/government because generally people talk that the government is biased
against Muslims rather we should take it as positive and should continue fighting.
2. There should be planning for better use of resources available.
3. Their should be proper interpretation of data/information and then should find out solutions accordingly.
4. Leaders, Academicians, NGOs and every individual must work hard for making available the better education
particularly Higher Education to Muslims.
5. The community should be made aware for their rights and should be motivated to fight to get their share.
6. Their should be proper handling of the sentiments of the members of the community by responsible persons in the
community.
Conclusion:
Problem with Muslim community is that we think of our own children and our family only while other communities think
at macro level for the whole community e.g. Sikh, Christians, etc. If we are well to do and my children are studying in
good colleges or well settled then we are not bothered for the other members of the community. We have to change our
approach and thinking.
The position of Muslims in higher education is worrying being only 4.45% of overall enrolment being even worse than
STs (4.77%) according to All India Higher Education 2014-15 (MHRD).
Hence, there is immediate need of all-out-effort by Muslim leaders, rich persons and academicians to use all the resources
physical and financial to help financially as well as morally for motivating the community for giving Higher Education to
their children. More schools and colleges of good standards should be opened without delay.
30