highlights - bnm.gov.my
TRANSCRIPT

11Quarterly Bulletin | 2Q 2021
Developments in the Malaysian Economy
• GDP growth continued to improve in 2Q 2021.
• Headline inflation increased to 4.1% during the quarter driven mainly by the base effect from low fuel prices.
• Higher current account surplus of RM14.4 billion or 3.9% of GDP.
HighlightsGDP growth turned positive in 2Q 2021
The Malaysian economy expanded by 16.1% in the second quarter of 2021 (1Q 2021: -0.5%). Growth was supported mainly by the improvement in domestic demand and continued robust exports performance. The strong growth also reflected continued policy support and the low base from the significant decline in activity during the second quarter of 2020. Economic activity picked up at the start of the second quarter but slowed following the re-imposition of stricter nationwide containment measures, particularly under Phase 1 of the Full Movement Control Order (FMCO). For the second quarter as a whole, all economic sectors registered an improvement, particularly the manufacturing sector. On the expenditure side, growth was driven by higher private sector spending and strong trade activity. On a quarter-on-quarter seasonally-adjusted basis, the economy registered a decline of 2.0% (1Q 2021: 2.7%), due to the containment measures.
This page was intentionally left blank.
Real GDP Growth
Source: Department of Statistics, Malaysia
Year-on-yearQuarter-on-quarter (seasonally adj.)
C4
Perubahan dalam tempoh (%)
Pertumbuhan KDNK Benar
Sumber: Jabatan Perangkaan Malaysia
Perubahan tahun ke tahunPerubahan suku ke suku (terlaras secara bermusim)
R4
-17.2
-2.7 -3.4-0.5
16.1
-20-15-10-505
101520
2Q 20 3Q 20 4Q 20 1Q 21 2Q 21
Period-on-period change (%)
-17.2
-2.7 -3.4-0.5
16.1
-20-15-10-505
101520
S2 20 S3 20 S4 20 S1 21 S2 21

12 Quarterly Bulletin | 2Q 2021
Annual Growth of Economic Sectors
Source: Department of Statistics, Malaysia
1Q 21 2Q 21
C5
Pertumbuhan tahunan KDNK Benar Mengikut Sektor Ekonomi
Sumber: Jabatan Perangkaan Malaysia
S1 21 S2 21
R5
-2.3
6.6
-10.4-5.0
0.2
13.4
26.6
40.3
13.9
-1.5
-20.0
-10.0
0.0
10.0
20.0
30.0
40.0
50.0
Services Manufacturing Construction Mining Agriculture
-2.3
6.6
-10.4-5.0
0.2
13.4
26.6
40.3
13.9
-1.5
-20.0
-10.0
0.0
10.0
20.0
30.0
40.0
50.0
Perkhidmatan Perkilangan Pembinaan Perlombongan Pertanian
Annual growth (%)
Pertumbuhan tahunan (%)
Contributions of Economic Sectors to Real GDP Growth
Source: Department of Statistics, Malaysia
1Q 21 2Q 21
C6
Sumbangan Sektor Ekonomi kepada Pertumbuhan KDNK Benar
Sumber: Jabatan Perangkaan Malaysia
R6
-1.3
1.5
-0.5 -0.4
0.0
7.8
5.9
1.2 1.0
-0.1
-2.0
0.0
2.0
4.0
6.0
8.0
10.0
Services Manufacturing Construction Mining Agriculture
-1.3
1.5
-0.5 -0.4
0.0
7.8
5.9
1.2 1.0
-0.1
-2.0
0.0
2.0
4.0
6.0
8.0
10.0
Perkhidmatan Perkilangan Pembinaan Perlombongan Pertanian
S1 21 S2 21
Contribution to growth (ppt)
Sumbangan kepada pertumbuhan (mata peratusan)
13Quarterly Bulletin | 2Q 2021
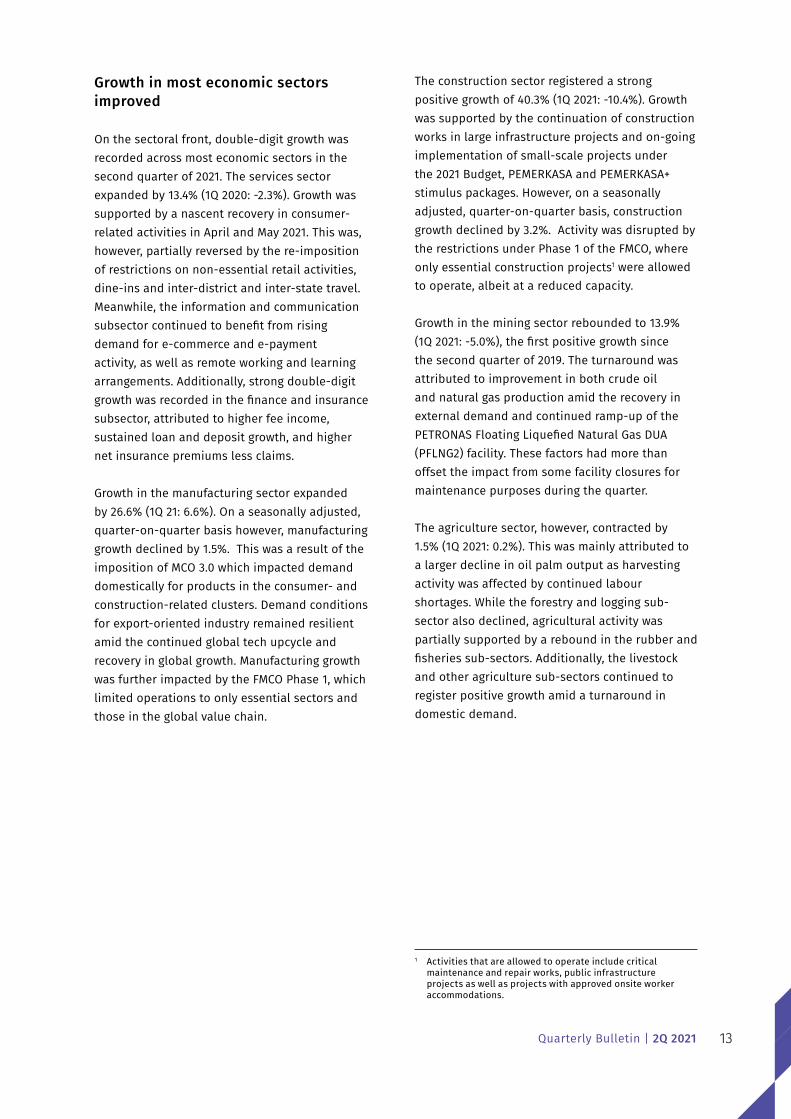
Growth in most economic sectors improved
On the sectoral front, double-digit growth was recorded across most economic sectors in the second quarter of 2021. The services sector expanded by 13.4% (1Q 2020: -2.3%). Growth was supported by a nascent recovery in consumer-related activities in April and May 2021. This was, however, partially reversed by the re-imposition of restrictions on non-essential retail activities, dine-ins and inter-district and inter-state travel. Meanwhile, the information and communication subsector continued to benefit from rising demand for e-commerce and e-payment activity, as well as remote working and learning arrangements. Additionally, strong double-digit growth was recorded in the finance and insurance subsector, attributed to higher fee income, sustained loan and deposit growth, and higher net insurance premiums less claims.
Growth in the manufacturing sector expanded by 26.6% (1Q 21: 6.6%). On a seasonally adjusted, quarter-on-quarter basis however, manufacturing growth declined by 1.5%. This was a result of the imposition of MCO 3.0 which impacted demand domestically for products in the consumer- and construction-related clusters. Demand conditions for export-oriented industry remained resilient amid the continued global tech upcycle and recovery in global growth. Manufacturing growth was further impacted by the FMCO Phase 1, which limited operations to only essential sectors and those in the global value chain.
The construction sector registered a strong positive growth of 40.3% (1Q 2021: -10.4%). Growth was supported by the continuation of construction works in large infrastructure projects and on-going implementation of small-scale projects under the 2021 Budget, PEMERKASA and PEMERKASA+ stimulus packages. However, on a seasonally adjusted, quarter-on-quarter basis, construction growth declined by 3.2%. Activity was disrupted by the restrictions under Phase 1 of the FMCO, where only essential construction projects1 were allowed to operate, albeit at a reduced capacity.
Growth in the mining sector rebounded to 13.9% (1Q 2021: -5.0%), the first positive growth since the second quarter of 2019. The turnaround was attributed to improvement in both crude oil and natural gas production amid the recovery in external demand and continued ramp-up of the PETRONAS Floating Liquefied Natural Gas DUA (PFLNG2) facility. These factors had more than offset the impact from some facility closures for maintenance purposes during the quarter.
The agriculture sector, however, contracted by 1.5% (1Q 2021: 0.2%). This was mainly attributed to a larger decline in oil palm output as harvesting activity was affected by continued labour shortages. While the forestry and logging sub-sector also declined, agricultural activity was partially supported by a rebound in the rubber and fisheries sub-sectors. Additionally, the livestock and other agriculture sub-sectors continued to register positive growth amid a turnaround in domestic demand.
1 Activities that are allowed to operate include critical maintenance and repair works, public infrastructure projects as well as projects with approved onsite worker accommodations.

14 Quarterly Bulletin | 2Q 2021
Annual growth (%)
Source: Department of Statistics, Malaysia
C7
Pertumbuhan tahunan (%)
Sumber: Jabatan Perangkaan Malaysia
R7
-1.5
5.9
-3.3
0.8
-1.7
11.69.0
16.5
34.3
15.8
-10-505
10152025303540
PrivateConsumption
PublicConsumption
GFCF Net Exports Change in Stocks(RM billion)
Annual Growth of GDP by Expenditure Components
-1.5
5.9
-3.3
0.8
-1.7
11.69.0
16.5
34.3
15.8
-10-505
10152025303540
PenggunaanSwasta
PenggunaanAwam
PMTK Eksport Bersih Perubahan Stok(RM bilion)
1Q 21 2Q 21
S1 21 S2 21
Contribution to growth (ppt)
Source: Department of Statistics, Malaysia
1Q 21
C8
Sumbangan kepada pertumbuhan (mata peratusan)
Sumbangan Komponen Perbelanjaan kepada Pertumbuhan KDNK Benar
Sumber: Jabatan Perangkaan Malaysia
R8
-0.9
0.7
-0.7
0.0 0.4
6.6
1.3
3.5
1.8
2.9
-4
0
4
8
PrivateConsumption
PublicConsumption
GFCF Net Exports Change in Stocks
2Q 21
Contributions of Expenditure Components to Real GDP Growth
-0.9
0.7
-0.7
0.0 0.4
6.6
1.3
3.5
1.8
2.9
-4
0
4
8
PenggunaanSwasta
PenggunaanAwam
PMTK Eksport Bersih Perubahan Stok
S1 21 S2 21

15Quarterly Bulletin | 2Q 2021
Higher domestic demand and robust external demand
Domestic demand turned around to register a positive growth of 12.3% (1Q 2021: -1.0%) in the second quarter of 2021, mainly supported by private sector expenditure. On the external front, demand for Malaysia’s exports, particularly for E&E products, continued to remain robust.
Private consumption growth increased by 11.6% during the quarter (1Q 2021: -1.5%), following a broad-based expansion across both necessity and discretionary items,
particularly at the start of the quarter, prior to the imposition of FMCO. This was due mainly to less stringent containment measures and mobility restrictions in the first half of the quarter. Labour market conditions also showed signs of improvement in the same period, which lent support to household spending. Furthermore, various policy measures, including the EPF i-Sinar withdrawals and Bantuan Prihatin Rakyat, provided additional lift to consumer expenditure.
Public consumption expanded by 9.0% (1Q 2021: 5.9%), mainly on account of higher spending on supplies and services.

16 Quarterly Bulletin | 2Q 2021
Rebound in investment activity
Gross fixed capital formation (GFCF) growth rebounded to 16.5% (1Q 2021: -3.3%), supported by the recovery in capital spending from both private and public sectors. By type of asset, both investment in structures and machinery & equipment (M&E) expanded by 20.2% (1Q 2021: -10.4%) and 15.1% (1Q 2021: 10.3%), respectively.
Private investment registered a growth of 17.4% (1Q 2021: 1.3%). The higher investment activity was underpinned mainly by the continued capital spending in telecommunication-related equipment, as firms’ automation and
digitalisation efforts gain further traction, as well as the continued progress in national digital infrastructure investments. In addition, further expansions of new and ongoing investment projects amid improving external demand, particularly in the export-oriented industries such as E&E and metal, also provided further impetus to growth.
After 12 quarters of contraction, public investment recorded a positive growth of 12.0% (1Q 2021: -18.6%). The performance mainly reflects the higher spending on fixed assets by the General Government amid continued weak capital spending by public corporations.
Year-on-year change (%)
GFCF Growth by Type of Asset
Source: Department of Statistics, Malaysia
GFCF Structures
Machinery and Equipment Other Assets
C9
Perubahan tahun ke tahun (%)
Pertumbuhan PMTK Mengikut Jenis Aset
Sumber: Jabatan Perangkaan Malaysia
PMTK Struktur
Jentera dan kelengkapan Aset-aset lain
R9
16.5
-45
-35
-25
-15
-5
5
15
25
2Q 20 3Q 20 4Q 20 1Q 21 2Q 21
-3.3
16.5
-45
-35
-25
-15
-5
5
15
25
S2 20 S3 20 S4 20 S1 21 S2 21
-3.3
17Quarterly Bulletin | 2Q 2021
2 The tiered electricity tariff rebates were implemented under the Bantuan Prihatin Elektrik scheme from April to December 2020, with rebates ranging from 2% to 50% depending on monthly electricity consumption.
3 This corresponded to the largest base effect from fuel inflation in April 2021, given the trough in retail fuel prices in April 2020. Average RON95 price in April 2020: RM1.27/barrel (April 2021 RM2.05/barrel).
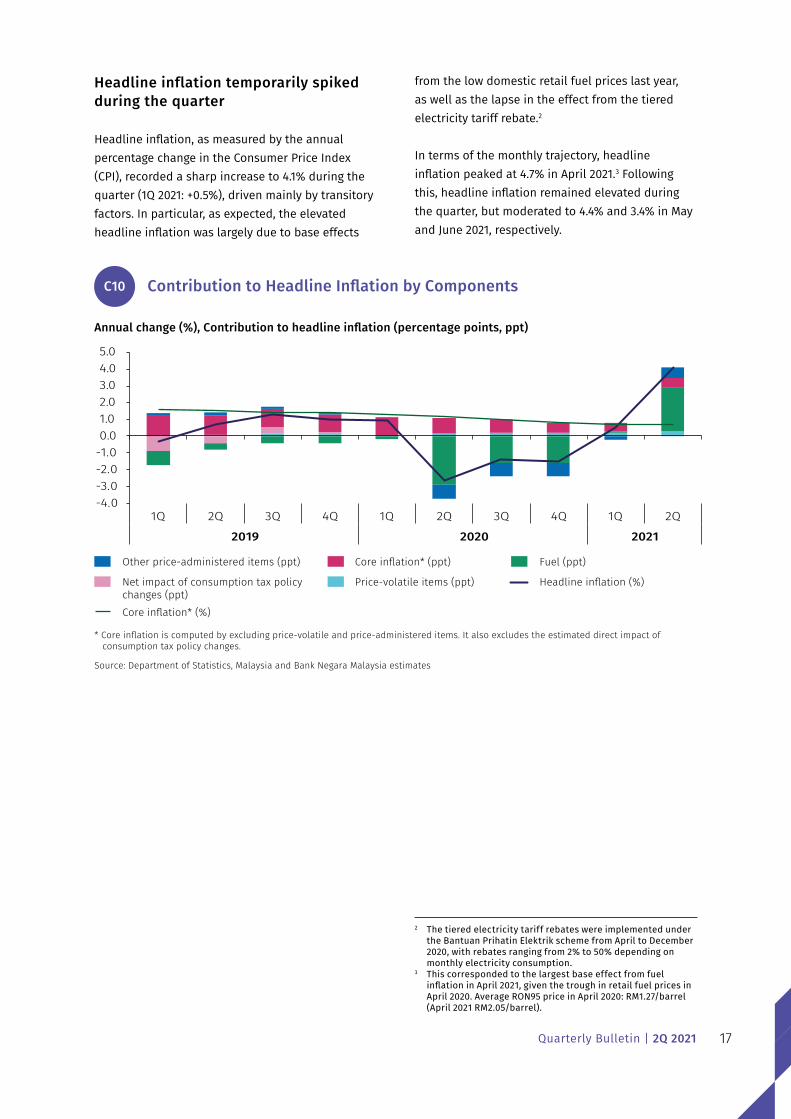
Headline inflation temporarily spiked during the quarter
Headline inflation, as measured by the annual percentage change in the Consumer Price Index (CPI), recorded a sharp increase to 4.1% during the quarter (1Q 2021: +0.5%), driven mainly by transitory factors. In particular, as expected, the elevated headline inflation was largely due to base effects
from the low domestic retail fuel prices last year, as well as the lapse in the effect from the tiered electricity tariff rebate.2
In terms of the monthly trajectory, headline inflation peaked at 4.7% in April 2021.3 Following this, headline inflation remained elevated during the quarter, but moderated to 4.4% and 3.4% in May and June 2021, respectively.
Annual change (%), Contribution to headline inflation (percentage points, ppt)
Contribution to Headline Inflation by Components
* Core inflation is computed by excluding price-volatile and price-administered items. It also excludes the estimated direct impact of consumption tax policy changes.
Source: Department of Statistics, Malaysia and Bank Negara Malaysia estimates
Other price-administered items (ppt) Core inflation* (ppt) Fuel (ppt)
Net impact of consumption tax policy changes (ppt)
Price-volatile items (ppt) Headline inflation (%)
C10
Core inflation* (%)
Perubahan tahunan (%), Sumbangan kepada inflasi keseluruhan (mata peratusan, mp)
Sumbangan kepada Inflasi Keseluruhan Mengikut Komponen
* Pengiraan inflasi teras tidak termasuk barangan yang harganya tidak menentu dan barangan yang harganya ditadbir. Pengiraan juga tidak termasuk anggaran kesan langsung perubahan dasar cukai penggunaan.
Sumber: Jabatan Perangkaan Malaysia dan anggaran Bank Negara Malaysia
Barangan lain yang harganya ditadbir (mp) Inflasi teras* (mp) Bahan api (mp)
Kesan bersih daripada perubahan dasar cukai penggunaan (mp)
Barangan yang harganya tidak menentu (mp)
Inflasi keseluruhan (%)
R10
Inflasi teras* (%)
-4.0-3.0-2.0-1.00.01.02.03.04.05.0
1Q 2Q 3Q 4Q 1Q 2Q 3Q 4Q 1Q 2Q2019 2020 2021
-4.0-3.0-2.0-1.00.01.02.03.04.05.0
S1 S2 S3 S4 S1 S2 S3 S4 S1 S22019 2020 2021

18 Quarterly Bulletin | 2Q 2021
Percentage of CPI items (%)
Month-on-Month Price Changes of CPI Items*
* Based on the month-on-month inflation for 125 CPI items at the 4-digit level
Source: Department of Statistics, Malaysia and Bank Negara Malaysia estimates
Price declineUnchanged price Price increase
C11
Peratusan barangan IHP (%)
Perubahan Bulan ke Bulan dalam Harga Barangan IHP*
* Berdasarkan inflasi bulan ke bulan bagi 125 barangan IHP pada aras 4 digit
Sumber: Jabatan Perangkaan Malaysia dan anggaran Bank Negara Malaysia
Harga menurunHarga tidak berubah Harga meningkat
R11
-40-20
020406080
100Ju
n-20
Jul-
20
Aug-
20
Sep-
20
Oct
-20
Nov
-20
Dec-
20
Jan-
21
Feb-
21
Mar
-21
Apr-
21
May
-21
Jun-
21
-40-20
020406080
100
Jun-
20
Jul-
20
Ogo
-20
Sep-
20
Okt
-20
Nov
-20
Dis-
20
Jan-
21
Feb-
21
Mac
-21
Apr-
21
Mei
-21
Jun-
21
Despite the increase in headline inflation, upward pressures on prices during the quarter were not broad-based, as the share of CPI items recording month-on-month price increases was lower than the long-term average (2Q 2021 average: 36%; 2010-2019 average: 45%).
Notably, a larger proportion of CPI items recorded unchanged price movements (2Q 2021 average: 50%; 2010-2019 average: 33%), particularly
towards the end of the quarter, due mainly to temporary business closures and uncertainties in demand following the re-imposition of movement restrictions. More specifically, price movements of core discretionary items (27.9% of CPI basket), while positive for the second quarter as a whole, became more subdued during the FMCO period. In line with this, core inflation remained stable at 0.7% during the quarter (1Q 2021: 0.7%).

19Quarterly Bulletin | 2Q 2021
Labour market recovery was affected by FMCO
In the labour market, improvements in conditions in the first half of the quarter was affected by the imposition of FMCO in June. For the second quarter as a whole, the unemployment rate remained elevated at 4.8% (1Q 2021: 4.8%). This reflected a net employment decline of 29 thousand persons relative to the previous quarter (1Q 2021: +75 thousand persons), amid a smaller labour force (-36 thousand persons; 1Q 2021: +86 thousand persons).
The Employment Insurance System (EIS) recorded lower jobless claims (14,311 persons; 1Q 2021: 20,418), amid a higher placement rate of employees into new jobs (40 per 100 people retrenched; 1Q 2021: 33)4, reflecting lower
retrenchments and improvement in hiring activity in April and May. Nevertheless, there was a deterioration in both retrenchments and hiring activity in June.
Private sector wages grew by 2.4% (1Q 2021: -2.2%), attributable mainly to the relatively low base in the second quarter of 2020. In the services sector, wages increased by 0.4% (1Q 2021: -3.1%), driven by improvements in the transportation and storage and wholesale and retail trade subsectors. In the manufacturing sector, wage growth was also higher at 6.0% (1Q 2021: -0.6%), due to broad-based improvements in wages of both the export-oriented5 and domestic-oriented sub-sectors. Nevertheless, on a quarter-on-quarter basis, private sector wages declined by 2.2%, reflecting the impact of operating and labour capacity restrictions.
4 Job losses and retrenchments are proxied by the number of people who apply for the EIS benefits (jobless claims) following loss of employment, while the placement rate refers to the number of people placed in new jobs under the EIS programme for every 100 persons retrenched. Thus, the placement rate is indicative of the pace of hiring, relative to retrenchment activity. EIS data does not include non-standard workers, who may be more significantly affected by the movement restrictions.
5 Export-oriented manufacturing subsectors include electrical and electronics; petroleum, chemical, rubber and plastic; wood products, furniture, paper products and printing; and textiles, wearing apparel, leather and footwear. Domestic-oriented manufacturing subsectors include food, beverages and tobacco; non-metallic mineral products, basic metal and fabricated metal products; and transport equipment and other manufactures.
Year-on-year change (%)
Employment and Wage Growth
Note: Private sector wage growth refers to wage growth of workers in the manufacturing and services sectors
Source: Department of Statistics, Malaysia
Employment growth Private sector wage growth
C12
Perubahan tahun ke tahun (%)
Kadar Pertumbuhan Guna Tenaga dan Upah
Nota: Kadar pertumbuhan gaji sektor swasta merujuk kepada kadar pertumbuhan gaji pekerja dalam sektor pembuatan dan perkhidmatan
Sumber: Jabatan Perangkaan Malaysia
Guna tenaga Upah sektor swasta
R12
2Q 20 3Q 20 4Q 20 1Q 21 2Q 21
S2 20 S3 20 S4 20 S1 21 S2 21
-0.6
0.0
2.4
2.2
-2.2
-3.4
-0.6
0.0
2.4
2.2
-2.2
-3.4

20 Quarterly Bulletin | 2Q 2021
Jobless Claims and Placement Rate
Source: Employment Insurance System, Social Security Organisation
Jobless claims refers to the number of people who apply for the Employment Insurance System (EIS) benefits following loss of employment. The placement rate refers to the number of people placed in new jobs under the EIS for every 100 persons retrenched.
Jobless claims (persons) Placement rate (%)
C13
Note:
Tuntutan Hilang Pekerjaan dan Kadar Penempatan Pekerjaan
Sumber: Sistem Insurans Pekerjaan, Pertubuhan Keselamatan Sosial
Tuntutan hilang pekerjaan merujuk kepada bilangan penganggur yang memohon elaun dan faedah yang disediakan di bawah Sistem Insurans Pekerjaan (SIP). Kadar penempatan pekerjaan merujuk kepada bilangan pekerja yang ditempatkan dalam pekerjaan baharu melalui SIP bagi setiap 100 pekerja yang hilang perkerjaan.
Tuntutan hilang pekerjaan (bilangan orang) Kadar penempatan pekerjaan (%)
R13
Nota:
34,806 33,309
23,30720,418
14,311
4,963 3,727 5,621
9
22
43 3340
40
48
35
2Q 20 3Q 20 4Q 20 1Q 21 2Q 21 Apr-21 May-21 Jun-21
34,806 33,309
23,30720,418
14,311
4,963 3,727 5,621
9
22
43 3340
40
48
35
S2 20 S3 20 S4 20 S1 21 S2 21 Apr-21 Mei-21 Jun-21

21Quarterly Bulletin | 2Q 2021
Improvement in trade activity amid higher external demand and domestic economic activity
Gross exports grew at a faster pace of 44.0% (1Q 2021: 18.0%). The strong exports performance was broad-based across products and markets, underpinned by improving external demand. Gross imports also registered a higher growth of 33.3% (1Q21: 10.0%), due mainly to a stronger expansion in intermediate imports. The trade surplus6 amounted to RM56.4 billion (1Q 2021: RM58.7 billion).
Manufactured exports increased by 43.6% (1Q 2021: 22.7%), supported mainly by non-E&E
exports (55.5%, 1Q 2021: 19.0%). This was driven by strong demand for petroleum and chemical products, manufactures of metal and machinery, and equipment and parts. Commodities exports registered a strong rebound (46.3%, 1Q 2021: -6.5%) due mainly to improvement in CPO, LNG and crude petroleum exports.
Intermediate imports registered a stronger growth of 43.8% (1Q 2021: 3.4%), due mainly to higher imports of industrial supplies, in tandem with the faster expansion in domestic manufacturing activity. This was partially offset by the decline in capital imports (-8.3%; 1Q 2021: 32.2%), due to base effect from the import of a large floating structure in the second quarter of 2020.
6 The goods and trade surpluses differ because goods for processing, storage and distribution (with no change in ownership) are excluded from the goods account. This is as per the 6th Edition of the Balance of Payments and International Investment Position Manual by the International Monetary Fund (IMF).
Gross Exports by Product and Market
Source: Department of Statistics, Malaysia
C14
Annual change (%), contribution to growth (ppt)
E&E Resource-based
Non-resource based Commodities
Others Gross exports (% yoy)
ASEAN China
USA EU
Rest of world Gross exports (% yoy)
Annual change (%), contribution to growth (ppt)
Eksport Mengikut Keluaran dan Pasaran
Sumber: Jabatan Perangkaan Malaysia
R14
E&E Berasaskan sumber
Bukan berasaskan sumber Komoditi
Lain-lain Eksport Kasar (% tahunan)
ASEAN China
AS Kesatuan Eropah (EU)
Negara-negara lain Eksport Kasar (% tahunan)
Perubahan tahunan (%), sumbangan kepada pertumbuhan (mata peratusan)
Perubahan tahunan (%), sumbangan kepada pertumbuhan (mata peratusan)
-0.2
-14.9
5.1 5.2
18.0
44.0
-20
-10
0
10
20
30
40
50
1Q 20 2Q 20 3Q 20 4Q 20 2Q 211Q 21
-0.2
-14.9
5.1 5.2
18.0
44.0
-20
-10
0
10
20
30
40
50
S1 20 S2 20 S3 20 S4 20 S2 21S1 21
1Q 20 2Q 20 3Q 20 1Q 21
-0.2
-14.9
5.1 5.2
18.0
44.0
-30-20-10
01020304050
4Q 20 2Q 21
S1 20 S2 20 S3 20 S1 21
-0.2
-14.9
5.1 5.2
18.0
44.0
-30-20-10
01020304050
S4 20 S2 21

22 Quarterly Bulletin | 2Q 2021
Current Account Balance
Source: Department of Statistics, Malaysia
C15
Secondary income Primary income Services
Goods CA balance (rhs)
% of GDPRM billion
Imbangan Akaun Semasa
Sumber: Jabatan Perangkaan Malaysia
R15
Pendapatan sekunder Pendapatan primer Perkhidmatan
Barangan Imbangan akaun semasa (skala kanan)
% daripada KDNKRM bilion
3.3 3.9
0
1
2
3
4
5
6
7
8
-30
-20
-10
0
10
20
30
40
50
60
1Q 2Q 3Q 4Q 1Q 2Q 3Q 4Q 1Q 2Q 3Q 4Q 1Q 2Q
2018 2019 2020 2021
3.3 3.9
0
1
2
3
4
5
6
7
8
-30
-20
-10
0
10
20
30
40
50
60
S1 S2 S3 S4 S1 S2 S3 S4 S1 S2 S3 S4 S1 S2
2018 2019 2020 2021
Higher current account surplus
The current account of the balance of payments registered a higher surplus of RM14.4 billion, or 3.9% of GDP during the quarter (1Q 2021: RM12.3 billion or 3.3% of GDP). The higher surplus was on account of the larger goods surplus and the lower deficit in the secondary income account.
The goods surplus widened to RM40.7 billion (1Q 2021: RM36.6 billion), supported by stronger external demand, despite the imposition of domestic containment measures. The services account recorded a marginally larger deficit (-RM15.4 billion;
1Q 2021: -RM15.0 billion), due to larger deficits in transportation and other business services.
The primary income account registered a larger deficit of RM9.5 billion (1Q 2021: -RM5.7 billion). This mainly reflected the higher investment income accrued to foreign companies and investors in Malaysia.
The secondary income account recorded a smaller deficit of RM1.4 billion (1Q 2021: -RM3.6 billion). This was partly due to funds received related to a wholly-owned subsidiary of the Minister of Finance (Incorporated) during the quarter.

23Quarterly Bulletin | 2Q 2021
RM billion
Direct Investment by Sector
Note: For DIA, positive values refer to net outflows, while negative values refer to net inflows. Figures may not sum due to rounding.
Source: Department of Statistics, Malaysia and Bank Negara Malaysia estimates
Financial services Non-financial services Manufacturing
Mining Construction Agriculture
C16
FDIRM8.2 billion
DIARM4 billion
RM bilion
Pelaburan Langsung Mengikut Sektor
Nota: Bagi DIA, angka positif merujuk aliran keluar bersih manakala angka negatif merujuk aliran masuk bersih. Angka-angka tidak semestinya terjumlah disebabkan oleh penggenapan.
Sumber: Jabatan Perangkaan Malaysia dan Bank Negara Malaysia
Perkhidmatan kewangan Perkhidmatan bukan kewangan Perkilangan
Perlombongan Pembinaan Pertanian
R16
FDIRM8.2 bilion
DIARM4 bilion
-2
0
2
4
6
8
10
-2
0
2
4
6
8
10
RM billion
Portfolio Investment
Source: Department of Statistics, Malaysia and Bank Negara Malaysia
Resident Non-resident Net portfolio investment
C17
RM bilion
Pelaburan Portfolio
Sumber: Jabatan Perangkaan Malaysia dan Bank Negara Malaysia
Pemastautin Bukan pemastautin Pelaburan portfolio bersih
R17
0.4
20.0
-50
-40
-30
-20
-10
0
10
20
30
40
1Q 2Q 3Q 4Q 1Q 2Q 3Q 4Q 1Q 2Q
2019 2020 2021
-20.3
-7.1
0.4
20.0
-50
-40
-30
-20
-10
0
10
20
30
40
S1 S2 S3 S4 S1 S2 S3 S4 S1 S2
2019 2020 2021
-20.3
-7.1
24 Quarterly Bulletin | 2Q 2021
Financial account registered a net outflow
The financial account recorded a net outflow of RM7.0 billion (1Q 2021: +RM16 billion), as outflows in the other investment account more than offset inflows in the direct and portfolio investment accounts. The direct investment account registered higher net inflows of RM4.2 billion (1Q 2021: +RM1.4 billion), underpinned by net inflows in foreign direct investment (FDI) of RM8.2 billion (1Q 2021: +RM9.1 billion). This was driven by larger reinvestment of earnings (+RM7.0 billion; 1Q 2021: +RM4.1 billion) notably in the manufacturing sector, and higher equity injections into Malaysia (+RM4.9 billion; 1Q 2021: +RM4.4 billion). Direct investment abroad (DIA) recorded lower net outflows of RM4.0 billion in the second quarter (1Q 2021: -RM7.8 billion). These investments abroad were channelled mainly into the services and manufacturing sectors.
The portfolio investment account recorded a higher net inflow of RM20 billion (1Q 2021:
+RM0.4 billion), due to higher non-resident (NR) portfolio investments (+RM30.5 billion; 1Q 2021: +RM14.6 billion) and lower residents’ portfolio investments abroad (-RM10.6 billion; 1Q 2021: -RM14.2 billion). Higher net NR portfolio investment inflows reflected larger inflows into domestic debt securities (+RM32.2 billion; 1Q 2021: +RM16.9 billion), particularly Government bonds. This more than offset the impact from the liquidation of domestic equity securities (-RM1.7 billion; 1Q 2021: -RM2.3 billion). More moderate residents’ portfolio investments abroad were driven by lower institutional investors’ acquisitions of equity securities.
The other investment account turned around to register a significant net outflow of RM30.5 billion (1Q 2021: +RM13.9 billion). This was due primarily to repayment of interbank borrowings by the banking system and withdrawal of NR deposits. Net errors and omissions amounted to –RM2.6 billion during the quarter, or –0.5% of total trade.

25Quarterly Bulletin | 2Q 2021
External debt remained manageable
Malaysia’s external debt amounted to RM1,020.7 billion, or 68.5% of GDP as at end-June 2021 (end-March 2021: RM1,039.7 billion or 73.2% of GDP). The decline is attributable mainly to a net repayment of interbank borrowings, withdrawal of NR deposits as well as exchange rate valuation effects following the stronger ringgit against selected major and regional foreign currencies during the period. These were partially offset by a net issuance of bonds and notes abroad and an increase in NR holdings of Government domestic debt securities. Malaysia’s external debt remained manageable, given its favourable currency and maturity profiles. Ringgit-denominated external debt amounted to RM358.2 billion and accounted for 35.1% of total external debt (end-March 2021: 33.6%). It was largely in the form of NR holdings of domestic debt
securities (68.4% share of ringgit-denominated external debt) and ringgit deposits (16.8% share) in resident banking institutions. These liabilities were not affected by fluctuations in the ringgit exchange rate. Foreign currency (FCY) external debt accounted for the remaining RM662.5 billion, or 64.9% of total external debt. 52.7% of FCY-denominated external debt were by the corporate sector, and were mainly subject to BNM’s prudential and hedging requirements. Long-term bonds and notes issued offshore stood at RM195.8 billion, accounting for 29.5% of total FCY-denominated external debt, held largely by non-financial corporates. The net issuance of bonds and notes of RM23.5 billion during the quarter partly reflect refinancing activities amid accommodative interest rate environment. Intragroup loans, which accounted for 14.3% of FCY-denominated external debt, were generally on flexible and concessionary terms.
Changes in External DebtC18
Change from 1Q 21 (RM billion)
Net change1: -RM19 billion
1 Changes in individual debt instruments exclude exchange rate valuation effects2 Comprises trade credits, IMF allocation of SDRs and other debt liabilities
Note: Figures may not add up due to rounding
Source: Ministry of Finance Malaysia, Department of Statistics, Malaysia and Bank Negara Malaysia
Perubahan dalam Hutang Luar NegeriR18
Perubahan dari S1 21 (RM bilion)
Perubahan bersih1: -RM19 bilion
Positif menunjukkan peminjaman bersih atau terbitan sekuriti hutang
1 Perubahan setiap instrumen hutang tidak termasuk kesan penilaian kadar pertukaran2 Terdiri daripada kredit perdagangan, peruntukan SDR IMF dan liabiliti hutang lain
Nota: Angka-angka tidak semestinya terjumlah disebabkan oleh penggenapan
Sumber: Kementerian Kewangan Malaysia, Jabatan Perangkaan Malaysia dan Bank Negara Malaysia
23.5
8.4
1.1
-1.5
-50 -40 -30 -20 -10 0 10 20 30
Bonds and notes
Intragroup loans
-38.6
-6.1
-5.1
-0.7
NR holdings of domestic debt securities
Positive indicates net borrowing or issuance of
debt securities
Others²
Interbank borrowings
NR deposits
Exchange rate valuation effects
Loans
23.5
8.4
1.1
-1.5
-50 -40 -30 -20 -10 0 10 20 30
Bon dan nota
Peminjaman antara syarikat berkaitan
-38.6
-6.1
-5.1
-0.7
Pemegangan sekuriti hutangdomestik oleh bukan pemastautin
Lain-lain²
Peminjaman antara bank
Deposit bukan pemastautin
Kesan penilaiankadar pertukaran
Pinjaman

26 Quarterly Bulletin | 2Q 2021
Interbank borrowings and FCY deposits in the domestic banking system accounted for 33.2% of FCY-denominated external debt. Half of the decline in interbank borrowings during the quarter was due to maturing back-to-back intragroup transactions by banks in the Labuan International Business and Financial Centre. The ample FCY liquidity and higher domestic FCY deposits domestically have also reduced the need for domestic banks to raise interbank funding from non-residents. Overall, three-quarters of outstanding interbank borrowings were in the form of intragroup borrowings from related parties located abroad, which are generally more stable, thereby limiting rollover risks faced by banks. Meanwhile, foreign-currency risk, as measured in terms of the net open position of
FCY-denominated exposures7, remained low at 4.8% of banks’ total capital (end-March 2021: 4.5%).
From a maturity perspective, 62.2% of total external debt has medium- to long-term tenure (end-March 2021: 58.4%), suggesting low rollover risks. Short-term external debt accounted for the remaining 37.8% of external debt. Of note, 42.3% of short-term external debt were in the form of intragroup borrowings, which were on-lent by parent banks or multi-national corporates located abroad and were generally stable and on concessionary terms. About another 14.3% were accounted by trade credits, largely backed by export earnings and are self-liquidating. As at 30 July 2021, international reserves stood at USD111.1 billion, sufficient to finance 8.1 months of retained imports, and is 1.2 times the short-term external debt.
7 Refers to the aggregated sum of the net short or long foreign currency positions for all currencies across banks.
Breakdown of FCY-Denominated External Debt (RM billion, % share) C19
1 Comprises trade credits, IMF allocation of SDRs, and other debt liabilities
Source: Ministry of Finance Malaysia, Department of Statistics, Malaysia, and Bank Negara Malaysia
NR depositsRM33 billion
Others1RM80 billion
LoansRM72 billion
Interbank borrowingsRM186 billion
Bonds and notesRM196 billion
Intragroup loans
RM95 billion
Butiran Hutang Luar Negeri dalam Denominasi Mata Wang Asing (RM bilion, % bahagian)
R19
1 Terdiri daripada kredit perdagangan, peruntukan SDR IMF dan liabiliti hutang lain
Sumber: Kementerian Kewangan Malaysia, Jabatan Perangkaan Malaysia dan Bank Negara Malaysia
Deposit bukan pemastautinRM33 bilion
Lain-lain1RM80 bilion
PinjamanRM72 bilion
RM95 bilion RM196 bilion
Peminjaman antara bankRM186 bilion
Bon dan notaPeminjaman antara syarikat berkaitan
28.1%
29.5%14.3%
10.9%
5.0%
12.1%
28.1%
29.5%14.3%
10.9%
5.0%
12.1%

27Quarterly Bulletin | 2Q 2021
Background
The shortage of semiconductor chips1, which began in late 2020, has highlighted how indispensable these components are in today’s modern economy. Notably, the global chip shortage has raised concerns due to its widespread impact across economic sectors and countries. In February 2021, the global automotive industry was estimated to suffer a revenue loss of USD60 billion in 2021 due to shortages of semiconductor chips. This issue has also highlighted the high degree of geographical concentration of chip manufacturing, raising national security concerns for some major economies. This box article aims to shed some light on the dynamics behind the global chip shortage, assess the potential impact to the Malaysian economy and explore policy strategies to maintain Malaysia’s strategic role as a global semiconductor player.
Supply-demand imbalances leading to the global chip shortage
The current shortage of semiconductor chips has been due to developments over the past few years as global megatrends2 such as automation, electrifi cation and connectivity propelled rising demand for semiconductors, against a backdrop of heightened uncertainty in supply and underinvestments due to the US-China trade war. From a demand perspective, the COVID-19 pandemic played a key role in accelerating trends such as the shift towards remote working, virtual learning, home entertainment, online gaming and e-commerce. This, in turn, led to a signifi cant surge in demand for chips powering computers, laptops, cloud computing and equipment for wired communications. Initially, the increase in demand was accommodated by a cutback in production by the automotive segment, as car manufacturers reduced orders for semiconductor chips in response to the lower mobility during the pandemic. Moving into 2021 however, the automotive industry experienced a faster-than-expected recovery in demand (Chart 1) following the lifting of containment measures by various governments globally. Additionally, the just-in-time inventory management practices which contributed to the low chip inventory levels among the automotive manufacturers also fuelled further demand for chips.
Box Article
The Global Chip Shortage: Implications and Opportunities for Malaysia
1 Microchip, chips, or more offi cially known as integrated circuit (IC) is the “brain” within every electronic device in the world.2 As a result of these megatrends, the content of semiconductor per unit of product has risen given the greater need for speed and connectivity (e.g. the latest 5G
phones require 40% more electronic components compared to older versions, while the semiconductor content per car is expected to reach close to USD600 per car by 2022 compared to USD300 per car in 2013)

28 Quarterly Bulletin | 2Q 2021
Global Personal Computer Sales and Global* ex-China Motor Vehicles SalesC1
*Refers to 24 countries including Australia, India, Indonesia, Japan, Malaysia, Pakistan, Philippines, Singapore, South Korea, Chinese Taipei, Thailand, Vietnam, Portugal, Russia, Turkey, South Africa, Argentina, Brazil, Canada, Chile, Colombia, Mexico, Panama, and United States. China was excluded as COVID-19 affected China mainly in 1Q 21, unlike other countries.
Source: Gartner, CEIC
Million units Million units
Continued strong PC sales amid work-from-home demands
Significant but temporary decline in motor vehicle sales at height of pandemic (RHS)
5
8
11
14
40
60
80
100
3Q 19 4Q 19 1Q 20 2Q 20 3Q 20 4Q 20
Jualan Komputer Persendirian Antarabangsa dan Jualan Kenderaan Bermotor Antarabangsa*
R1
*Merujuk 24 negara termasuk Australia, India, Indonesia, Jepun, Malaysia, Pakistan, Filipina, Singapura, Korea Selatan, China Taipei, Thailand, Vietnam, Portugal, Russia, Turki, Afrika Selatan, Argentina, Brazil, Kanada, Chile, Colombia, Mexico, Panama dan Amerika Syarikat. China dikecualikan kerana negara itu terjejas akibat COVID-19 terutamanya pada S1 2021, tidak seperti negara-negara lain.
Sumber: Gartner, CEIC
Juta unit Juta unit
Jualan PC yang kukuh disokong permintaan bekerja-dari-rumah
Jualan kenderaan bermotor yang merosot dengan ketara tetapi sementara di kemuncak pandemik (sebelah kanan)
5
8
11
14
40
60
80
100
S3 19 S4 19 S1 20 S2 20 S3 20 S4 20
From the supply perspective, chip manufacturers were unable to keep pace with the rising demand due to the lack of new capacity and underinvestment during the early stages of the pandemic (Chart 2). As global foundries operate at close to full capacity and efforts to build new foundry capacities require about 2-3 years to be production-ready, chip manufacturers were unable to accommodate the sudden surge in chip demand.
26
42
36
42
2018 2019 2020 2021f
Source: Counterpoint Research
Equipment Spending to Sales Ratio by TSMC and SamsungC2
Equipment to Sales Ratio
26
42
36
42
2018 2019 2020 2021f
Sumber: Counterpoint Research
Rajah 2: Nisbah Perbelanjaan Peralatan kepada Jualan oleh TSMC dan Samsung
C2
Nisbah Perbelanjaan kepada Jualan

29Quarterly Bulletin | 2Q 2021
There is also evidence that the shortages were contributed by the race to build buffer stock by some clients who were concerned about supply chain security amid US-China trade tension. Additionally, these shortages were exacerbated further in 2021 by sudden disruptions in production caused by winter storms in the United States, a fi re outbreak in the plant of a key Japanese producer, and COVID-19 outbreak in chip manufacturing plants in Chinese Taipei.
Globally, the impact from the chip shortages was fi rst felt by the automotive industry. Automotive players faced longer lead-times when demand recovered sharply, as chip manufacturers were unable to reprioritise chip supplies back to the automotive industry, especially for those that have cancelled chip orders earlier. This has led some automotive players to suspend production or leave out certain non-essential features due to inability to source vital components. The effects of the shortage, however, have since extended beyond the automotive sector, with other industries such as consumer electronics facing longer lead-times, minimal inventories, and higher costs to secure chips.
Ongoing capacity expansion and reshoring efforts to address shortages
As the global chip shortage continues, businesses and governments are looking for longer-term solutions by rethinking their entire semiconductor manufacturing supply chain structure. On one hand, Integrated Device Manufacturers, who are involved in both designing chips and operating own foundries have intensifi ed investment efforts to expand capacities. Fabless chip designers, who have outsourced manufacturing to third parties, have less fl exibility as they are highly reliant on a few large global chip manufacturers to fulfi l orders (the Top 3 semiconductor contract manufacturers account for close to 80% of global foundry revenue in 2020). This concentration has propelled Governments around the world to push for self-suffi ciency and strengthen national security by developing domestic chip manufacturing capabilities (announced in 2020 and 2021, Chart 3). In particular, major economies including the US, EU and China are incentivising the reshoring of chip manufacturing back to domestic markets, so as to enable better control of the supply chain and prevent future disruptions.
Source: Various newsflows
Efforts by Selected Semiconductor Companies and PolicymakersC3
Intel (2021)Investing USD 20 bil. to produce chips for others
USA (2021)Investing USD 52 bil. to bolster domestic chips manufacturing
India (2021)Plan to offer USD 1 bil. cash to firms to set up chip production in India
Europe (2021)Target to hit 20% market share in global chip production in 10 years
China (2020)Investing USD 1.4 tril. to be global leader in key technology
Global Foundries (2021)USD 4 bil. expansion plan in Singapore
TSMC (Chinese Taipei, 2021)USD 100 bil. for next 3-year expansion
Sumber: Pelbagai aliran berita
Usaha oleh Syarikat-Syarikat Semikonduktor dan Pembuat Dasar TerpilihC3
Intel (2021)Pelaburan berjumlah USD20 bilion untuk pengeluaran cip untuk pelanggan lain
AS (2021)Pelaburan berjumlah USD52 bilion untuk mengukuhkan pengeluaran cip dalam negeri
India (2021)Rancangan untuk menawarkan ~USD1 bilion kepada firma bagi membina kilang pengeluaran cip di India
Europe (2021)Sasaran untuk mencapai 20% pasaran global dalam masa 10 tahun
China (2020)Melabur USD1.4 trilion untuk menjadi peneraju global dalam teknologi utama
Global Foundries (2021)Rancangan pengembangan berjumlah USD4 bilion di Singapura
TSMC (China Taipei, 2021)USD100 bilion untuk pengembangan 3 tahun akan datang
South Korea (2021) Plans to invest USD450 bil to become chip “powerhouse”
Korea Selatan (2021)Rancangan untuk melabur USD450 bilion untuk menjadi “powerhouse”

30 Quarterly Bulletin | 2Q 2021
Malaysia has been able to withstand the impact of chip shortages
With a major presence in the global semiconductor value chain (approximately 7% of global semiconductor trade fl ows through Malaysia) it is critical to assess the implications of the chip shortage on Malaysia’s E&E production. Since the height of containment measures globally in April 2020, E&E production activity has recorded a strong rebound and continues to record markedly high levels. In particular, production has been above pre-pandemic levels since June 2020 (Chart 4).
Source: Department of Statistics Malaysia and Bank Negara Malaysia estimates
Industrial Production Index (E&E)C4
Index (2015=100), seasonally adjusted
143.9
142.7
153.5
Mar-20 Jun-20 Sep-20 Dec-20 Mar-21 Jun-21
Sumber: Jabatan Perangkaan Malaysia dan anggaran Bank Negara Malaysia
Indeks pengeluaran perindustrian (E&E)R4
Indeks (2015=100), diselaraskan secara bermusim
143.9
142.7
153.5
Mac-20 Jun-20 Sep-20 Dis-20 Mac-21 Jun-21
purata 2019: 125.9
2019 avg: 125.9
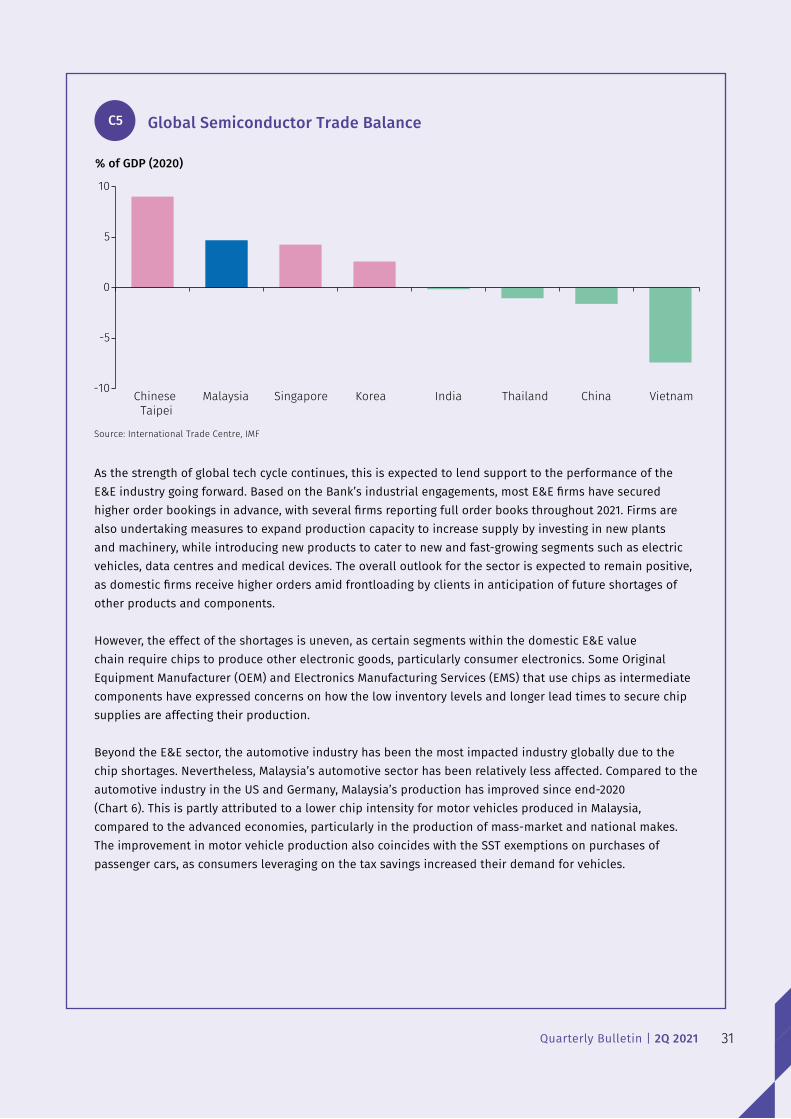
The strong and sustained production levels suggest that Malaysia’s E&E sector is currently benefi tting from the chip shortages. Malaysia holds a strategic position in global value chains, being among the larger net exporters of semiconductor products (Chart 5), with a signifi cant share of fi rms within the semiconductor value chain involved in the production of chips. As such, strong demand for semiconductors is benefi tting a large segment of the industry, outweighing the impact of shortages on segments that use chips as intermediate inputs. In particular, fi rms involved in front-end semiconductor manufacturing have experienced a surge in orders as they serve to address the global supply gap. In tandem with the strong foundry activities globally, other parts of the domestic semiconductor value chain, namely local OSAT (Outsourced Semiconductor Assembly and Testing) players and Assembly and Test Equipment (ATE) manufacturers have also benefi tted from higher demand.
31Quarterly Bulletin | 2Q 2021
Source: International Trade Centre, IMF
Global Semiconductor Trade BalanceC5
% of GDP (2020)
-10
-5
0
5
10
Chinese Taipei
Malaysia Singapore Korea India Thailand China Vietnam
Sumber: International Trade Centre, IMF
Imbangan Perdagangan Semikonduktor GlobalC5
% daripada KDNK (2020)
-10
-5
0
5
10
ChinaTaipei
Malaysia Singapura Korea India Thailand China Vietnam
As the strength of global tech cycle continues, this is expected to lend support to the performance of the E&E industry going forward. Based on the Bank’s industrial engagements, most E&E fi rms have secured higher order bookings in advance, with several fi rms reporting full order books throughout 2021. Firms are also undertaking measures to expand production capacity to increase supply by investing in new plants and machinery, while introducing new products to cater to new and fast-growing segments such as electric vehicles, data centres and medical devices. The overall outlook for the sector is expected to remain positive, as domestic fi rms receive higher orders amid frontloading by clients in anticipation of future shortages of other products and components.
However, the effect of the shortages is uneven, as certain segments within the domestic E&E value chain require chips to produce other electronic goods, particularly consumer electronics. Some Original Equipment Manufacturer (OEM) and Electronics Manufacturing Services (EMS) that use chips as intermediate components have expressed concerns on how the low inventory levels and longer lead times to secure chip supplies are affecting their production.
Beyond the E&E sector, the automotive industry has been the most impacted industry globally due to the chip shortages. Nevertheless, Malaysia’s automotive sector has been relatively less affected. Compared to the automotive industry in the US and Germany, Malaysia’s production has improved since end-2020 (Chart 6). This is partly attributed to a lower chip intensity for motor vehicles produced in Malaysia, compared to the advanced economies, particularly in the production of mass-market and national makes. The improvement in motor vehicle production also coincides with the SST exemptions on purchases of passenger cars, as consumers leveraging on the tax savings increased their demand for vehicles.

32 Quarterly Bulletin | 2Q 2021
Note: June 2021 figures are excluded as automotive production in Malaysia was more impacted by the imposition of FMCO Phase 1 which restricted production
Source: Department of Statistics Malaysia, CEIC
Motor Vehicles Industrial Production by CountryC6
Index (2015 = 100)
Avg. 2019 1Q 21 April-May 21
135
101
64
140
89
55
Malaysia US Germany
Nota: Angka-angka pada bulan Jun 2021 tidak diambil kira kerana pengeluaran kenderaan bermotor di Malaysia lebih terjejas berikutan arahan Perintah Kawalan Pergerakan Penuh Fasa 1 yang mengehadkan pengeluaran
Sumber: Jabatan Perangkaan Malaysia dan CEIC
Pengeluaran Industri Kenderaan BermotorR6
Indeks (2015 = 100)
Purata 2019 S1 21 April-Mei 21
135
101
64
140
89
55
Malaysia Amerika Syarikat Jerman
Moving forward, longer term strategies are critical to build domestic capabilities
The longer-term outlook for the Malaysian E&E industry remains supported by strong order books, introduction of new products, and commencement of new plants, which will allow fi rms to benefi t from the continued global demand. The ability of fi rms to capitalise on these opportunities remain contingent upon long-term strategies to build domestic capabilities to stay competitive.
While the current environment is positive for Malaysia, the E&E sector is confronted by challenges, both in the near- and medium-term. First, the near-term performance of the E&E industry in Malaysia is expected to be weighed down by the recent implementation of FMCO (full movement control order) and restrictions on labour capacity due to the resurgence in COVID-19 cases. Nevertheless, fi rms were able to minimise the impact given the highly automated nature of many large semiconductor fi rms. Meanwhile, some fi rms also extended the number of working days in order to catch up on production. Moving forward, fi rms that are currently focused on labour-intensive activities are most at risk of production disruptions resulting from labour restrictions. As such, embarking on automation would not only mitigate the impact of containment measures as fi rms become more capital intensive, but also help to ensure that Malaysia’s E&E sector is better able to capture the strong demand for E&E products. While automation is prevalent amongst larger E&E manufacturers, tier 2 and tier 3 suppliers, which comprise mainly SMEs, have room to automate further. Impediments to automation include an aversion to change involving new production methods, as well as high costs, including for maintenance and staff training when operating machinery3. In this regard, SMEs are encouraged to automate processes and digitalise operations by leveraging on capacity building resources, as well as grants and fi nancing facilities like the MIDA Domestic Investment Strategic Fund and High Impact Fund, and the SME Automation and Digitalisation Facility4 by Bank Negara Malaysia.
3 Findings from E&E Productivity Nexus “Study on Productivity and Contribution of the Malaysian E&E Industry” 4 For more information, please refer to https://www.bnm.gov.my/documents/20124/2294076/ADF_Eng.pdf

33Quarterly Bulletin | 2Q 2021
Second, the push towards the reshoring of chip manufacturing activities by major economies could impact the signifi cance of Malaysia as an E&E producer in the semiconductor global value chain (GVC). As major economies prioritise strengthening their own domestic capabilities, they may reduce investments in other parts of the GVC. Thus far, Malaysia’s E&E sector has been highly dependent on foreign direct investments (FDI), accounting for more than 80% of total approved investments in the past 3 years (Chart 7). A cutback in FDI could translate into slower capital accumulation, production capacity expansion and output growth. As the E&E sector is highly technology intensive, lower technology-driven FDI could also impact domestic technology development and adoption, high-skilled job creation and access to global markets for local suppliers through the MNC network.
Source: Malaysian Investment Development Authority
Foreign and Local Approved Investment in E&E Industry in MalaysiaC7
RM Billion
0
5
10
15
20
25
2018 2019 2020
Foreign Local
Sumber: Malaysian Investment Development Authority
Pelaburan asing dan dalam negeri bagi industri E&E di MalaysiaC7
RM Juta
0.0
5,000.0
10,000.0
15,000.0
20,000.0
25,000.0
2018 2019 2020
RM juta (Asing) RM juta (Domestik)
As such, there is an urgent need to grow investments by domestic fi rms while increasing Malaysia’s capability in attracting quality FDI amid global reshoring efforts. The implementation of the “National Investment Aspirations” (NIAs) can stimulate investments in segments of the value chain that are of high economic complexity, create high-value jobs, and have extensive domestic linkages. Examples would be Integrated Circuit (IC) design and design automation, which are strongly aligned with the NIAs given its high dependency on innovation. To date, there are only a few active local design houses in Malaysia as IC design activities are undertaken mostly by MNCs. In order to venture into these segments, local players, especially the new entrants, can form partnerships with MNCs by setting up offshore design centres to bring these activities to Malaysia in the medium term. Trade promotion agencies could also enhance the branding of the domestic E&E sector as an IC design hub, which will increase the exposure and create opportunities for local IC design fi rms.

34 Quarterly Bulletin | 2Q 2021
The E&E industry in Malaysia can further scale up its capabilities and competitiveness by expanding into research and development (R&D), product innovation and design activities that can add value beyond just the manufacturing front (Malaysia is ranked 70 out of 131 countries in knowledge creation, and 53 out of 131 countries in knowledge workers recorded in the Global Innovation Index 2020). These transitions can be complemented by government policies to attract R&D investment activities that encourages infl ows of know-how and new technology innovations via industry-academia collaboration. For example, Chinese Taipei’s Industrial Technology Research Institute (ITRI) is a successful model of industrial technology upgrading and innovation policy that not only drove innovation among fi rms and incubated some of the Chinese Taipei’s top home-grown companies but also bridged the gap between the industry and academia research. The ability to entice MNCs to bring R&D activities also depends on the availability of the right talent pool to undertake these higher-value tasks. This can be partly addressed by the continuous and cohesive collaboration between industry and the universities in developing industry-relevant curriculum to keep pace with the ever-evolving skills demand. To strengthen the eco-system for R&D to be undertaken locally, Malaysia’s Intellectual Property (IP) frameworks should also be updated to widen the recognition of domestic patents across key international jurisdictions, which will offer more comprehensive protection for IPs patented in Malaysia. There is also a need to strengthen and align IP arbitration to global standards to facilitate effective resolution of disputes.
Conclusion
Malaysia has been able to withstand the impact of chip shortages considerably well, given its established footprint in the global semiconductor supply chains. With higher E&E industrial production during the pandemic period compared to 2019, as well as full order books among chip manufacturers and future product diversifi cation plans, Malaysia’s E&E industry has thus far benefi tted from this unanticipated global chip shortage.
However, there is the risk that intensifying reshoring of semiconductor manufacturing activities may impact future investments into Malaysia. As such, it is timely for Malaysia to strengthen domestic capabilities by increasing productivity via automation and digitalisation, leveraging on forward-looking investment policy tools such as the NIAs, and enhancing R&D capabilities by developing the right talent pool, while improving collaboration between industry and academia.

35Quarterly Bulletin | 2Q 2021
References:
Bloomberg (2021). ‘How a Chip Shortage Snarled Everything from Phones to Cars’. https://www.bloomberg.com/graphics/2021-semiconductors-chips-shortage/
Brown, C., & Linden, G. (2008). ‘Semiconductor capabilities in the US and industrializing Asia’. In 2008 Industry Studies Conference Paper.
CEIC (2021), ‘Motor Vehicle Industrial Production’, https://insights.ceicdata.com/
CNBC (2021), ‘How Covid led to a $60 billion global chip shortage for the auto industry’, https://www.cnbc.com/2021/02/11/how-covid-led-to-a-60-billion-global-chip-shortage-for-automakers.html
Counterpoint Research (2021). https://www.counterpointresearch.com/data/
Deloitte (2019). ‘Semiconductors – the Next Wave: Opportunities and winning strategies for semiconductor companies’, https://www2.deloitte.com/content/dam/Deloitte/cn/Documents/technology-media-telecommunications/deloitte-cn-tmt-semiconductors-the-next-wave-en-190422.pdf
Department of Statistics Malaysia (2021). ‘Index of Industrial Production, Malaysia’ Jabatan Perangkaan Malaysia, Putrajaya.
Electrical & Electronics Productivity Nexus (2018). “Study on Productivity and Contribution of the Malaysian E&E Industry”.
Gartner (2020). ‘Global Traditional PC Sales’, https://www.gartner.com/
International Trade Centre (2021). ‘Trade Balance- List of markets for Product: 8542: Electronic integrated circuits; parts thereof’. https://www.trademap.org/ .
International Monetary Fund (2021). ‘GDP, current prices’. https://www.imf.org/external/datamapper/NGDPD@WEO/ADVEC/WEOWORLD
Malaysian Investment Development Authority, ‘Projects Approved by Major Industry, 2018-2020’ https://www.mida.gov.my/why-malaysia/investment-statistics/
McKinsey & Company (2021), Coping with the auto-semiconductor shortage: Strategies for success
OECD, ‘Share of E&E to Final Demand of Automotive Products by Country’, https://data.oecd.org/
Semiconductor Industry Association (2021). ‘Strengthening the Global Semiconductor Supply Chain in An Uncertain Era’. https://www.semiconductors.org/strengthening-the-global-semiconductor-supply-chain-in-an-uncertain-era/
World Bank (2021). ‘An Investment Perspective on Global Value Chains’

This page was intentionally left blank.