highlights for fy2014 · soaking powder laundry detergent for hand washing (china) attack 10 hands...
TRANSCRIPT

Highlights for FY2014(Ended December 31, 2014)
Kao Corporation
President and CEOMichitaka Sawada
February 4, 2015

2
Forward-looking statements such as earnings forecasts and other projections contained in this release are based on information available at this time and assumptions that management believes to be reasonable, and do not constitute guarantees of future performance. Actual results may differ materially from those expectations due to various factors.
These presentation materials are available on our website in PDF format: http://www.kao.com/jp/en/corp_ir/presentations.html
Fiscal year end is December 31 from FY2012
Term of consolidation for FY2012 Group companies whose fiscal year end was previously March 31*: April-December 2012 Group companies whose fiscal year end was already December 31: January-December 2012
Restated FY2012Figures for the period from January 1 to December 31, 2012 for the purpose of comparison withFY2013 (January 1 to December 31, 2013)
Adjusted growthComparison with restated FY2012
* Kao Corporation and certain consolidated subsidiaries with the same fiscal year end

3
Agenda
Summary of FY2015 Forecast
Kao Group Mid-term Plan 2015 (K15) and Summary of FY2014
The Kao Group’s Vision for the Future
4
Kao Group Mid-term Plan 2015 (K15) and Summary of FY2014Kao Group Mid-term Plan 2015 (K15) and Summary of FY2014

5
Kao Group Mid-term Plan 2015 (K15)
Numerical Management Targets for FY2015 Net sales:
1.4 trillion yen Operating income:
150 billion yen
Overseas sales ratio*:30% or more
Target 1: Break previous records for net sales and profits
Target 2: Achieve numerical management targets for FY2015
* Ratio of net sales to foreign customers to consolidated net sales

6
Growth Strategies to Achieve K151. Expand the Consumer Products Business globally
Growth markets: Expand the business significantly by proposing products in the domain of “cleanliness” including laundry detergents, baby diapers and sanitary napkins that target the growing middle-class consumer segment
Mature markets: Accelerate growth with high-value-added products
2. Further reinforce the Fabric and Home Care Business, and accelerate profitable growth in the Beauty Care and Human Health Care Businesses
Fabric and Home Care Business Maintain or capture the top share in each product categoryBeauty Care Business and Human Health Care Business Move the cosmetics business to a phase of profitable growth Propose products and services through new approaches focused on
health and the aging society
3. Reinforce the Chemical Business Promote higher added value Strengthen synergy with the Consumer Products Business

7
Targeted Sustainable Growth Model
Maximize use of Kao Group assets
Capabilities to generate profits(Transformation to a profitable structure)
Profitable growth, creation of new assets
Establish a post-deflation growth model
Proactive investment
Increase market share
and salesIncrease profits

8
Financial Overview – FY2014
¥1,401.7 billion +6.6%Net sales+4.7%EBITA1
[% of sales]+6.9%Operating income
[% of sales]+22.9%Net income
[% of sales]
+24.1%Net income per share
¥7044.7%
¥50.0 billion
+¥6Shareholder returnsCash dividends per shareConsolidated payout ratioShare repurchases
Year-on-yeargrowth .
¥162.1 billion[11.6%]
¥133.3 billion[9.5%]
¥79.6 billion[5.7%]
¥156.46
1. Operating income before amortization of goodwill and intellectual property rights related to M&A2. Forecast announced on October 28, 2014
¥1,390.0 billion
¥68
¥130.0 billion
¥75.0 billion
¥147.45
Forecast2
-
+170 bpsROE 12.4% -

9
Executive Summary (1) Targeted sustainable growth model is about to be establishedNet sales and profits grew for the fifth consecutive fiscal year*
and slightly exceeded the projections of K15Net sales and profits achieved the forecast announced on October 28, 2014Net sales and net income broke previous recordsOperating income and ordinary income broke previous records for the second year in a row 8.9 billion yen of compensation-related and other expenses in connection with brightening
products containing Rhododenol was recorded as an extraordinary loss
Growth drivers of net sales and operating incomeConsumer Products Business in Japan
• Appropriate response to last-minute surge in demand before the consumption tax increase and pullback that followed
• Market share expansion through proactive initiatives• Overall results excluding cosmetics were solid with strong performance by sanitary products, while Healthya functional drinks struggled
• In cosmetics, Kanebo Cosmetics is on the path to recovery• Impacted by adverse weather conditions in July-August, but recovered in the fourth quarter
Consumer Products Business in Asia• Indonesia, China, Hong Kong and Singapore drove growth• Sales of baby diapers targeting the middle-class consumer segment are expanding in China and Indonesia
* Excludes the impact of the change in financial term in 2012. (Please refer to slide 2 for details.)

10
Executive Summary (2)Shareholder returns Annual cash dividends per share for FY2014: Planned increase of 6 yen compared
with the previous fiscal year to 70 yen, 2 yen higher than the forecast and the 25th
consecutive fiscal year of increases in cash dividendsShare repurchases: 50 billion yenRetirement of treasury stock: 12 million shares

11
Executive Summary (3)The Kao Group’s response to vitiligo-like symptoms
experienced by some customers of Kanebo Cosmetics brightening products containing RhododenolRespond in a sincere manner to those with vitiligo-like symptoms
•Efforts to investigate the cause and establish therapeutic methods•Deal with compensation in a sincere manner (Announcement of implementation of compensation similar to damages payable for aftereffects in addition to the previous compensation)
Ensure greater safety and reliability to prevent recurrence
Corporate governance system Innovation* in corporate governanceEnhancement of outside perspective
•Equal number of inside directors and outside directors•An independent outside director has assumed the position of chairman of the Board of Directors
Separation of the supervisory function and execution•Delegation of authority•Accelerated decision-making
* Innovation is one of the values of The Kao Way, the corporate philosophy of the Kao Group.

12
FY2015
FY2013
FY2014
Investment¥269.4billion
Net sales¥1,315.2
billionOperating
income¥124.7 billion
Investment¥310.0billion
Net sales¥1,470.0billion
Operating income
¥150.0 billion
Investment¥285.7billion
Net sales¥1,401.7
billionOperating
income¥133.3 billion
* Investment = Capital expenditures + Marketingexpenditures + Research and developmentexpenditures
FY2014 actualYear-on-year growth
(Billion yen)- Investment: +16.3- Net sales: +86.5- Operating income: +8.6
Growth Model for Exiting Deflation with Proactive Investment*

13
0
10
20
30
40
50
60
70
80
90
FY08 09 10 11 12 13 14 15
Proactive Capital Expenditures1 to Accelerate Global Growth
50 billion yen level
80 billion yen level
1 Long-term prepaid expenses are included in capital expenditures.2 Fiscal year end is December 31 from FY2012. (Please refer to slide 2 for details.)
2
(Billion yen)
(Forecast)
60 billion yen level

14
1,270.0 1,370.0
1,470.0
1,220.4 1,315.2
1,401.7
116.0
130.0
150.0 111.8 124.7
133.3
0
50
100
150
200
0
500
1,000
1,500
FY2012 FY2013 FY2014 FY2015
Net sales forecast Net sales actual Operating income forecast Operating income actual
K15 Net Sales and Operating Income
Operating income(Billion yen)
Net sales(Billion yen)
1. Forecast at the beginning of each fiscal year2. Excludes the impact of the change in financial term in 2012. (Please refer to slide 2 for details.)
2
Overseas sales ratio
26.8% 30.9% 33.1% 30% or more (Target)
K15 operating income target150 billion yen
K15 net sales target1.4 trillion yen
1 1
15
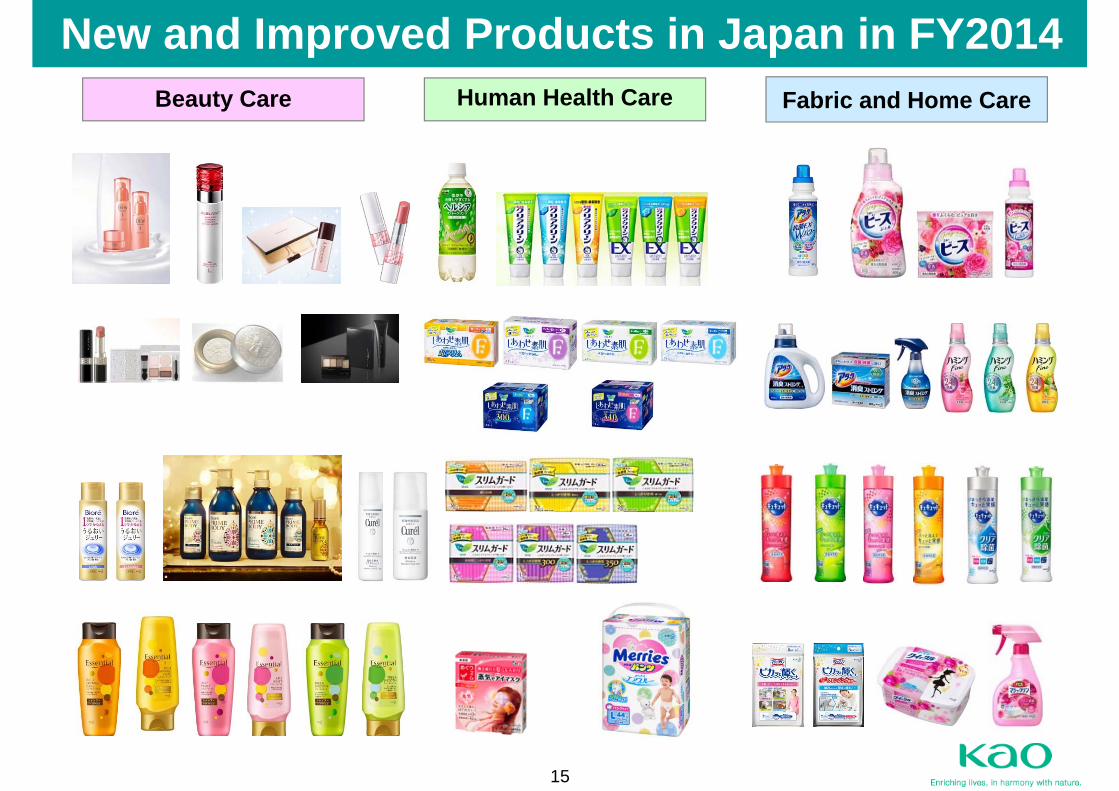
New and Improved Products in Japan in FY2014Fabric and Home CareBeauty Care Human Health Care
16
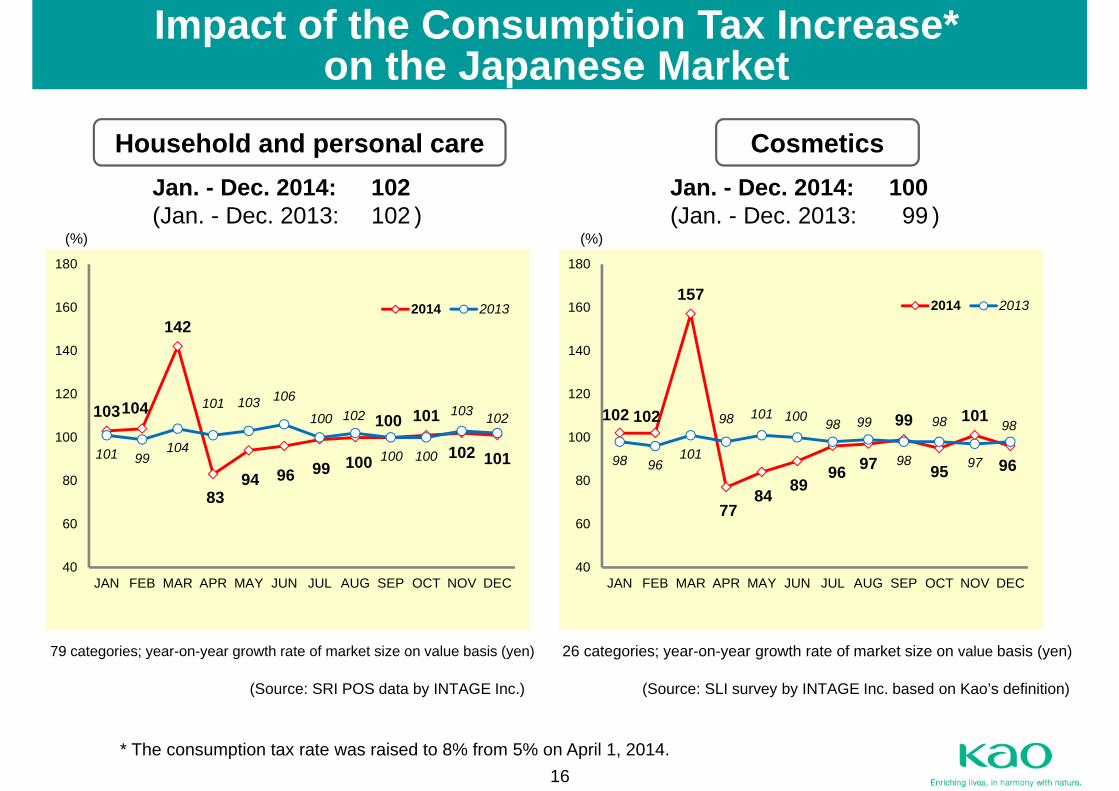
Impact of the Consumption Tax Increase*on the Japanese Market
Household and personal care Cosmetics
79 categories; year-on-year growth rate of market size on value basis (yen)
(Source: SRI POS data by INTAGE Inc.)
26 categories; year-on-year growth rate of market size on value basis (yen)
(Source: SLI survey by INTAGE Inc. based on Kao’s definition)
* The consumption tax rate was raised to 8% from 5% on April 1, 2014.
Jan. - Dec. 2014: 102(Jan. - Dec. 2013: 102 )
Jan. - Dec. 2014: 100(Jan. - Dec. 2013: 99 )
0 0
(%) (%)
103104
142
8394 96 99 100
100 101
102 101101 99104
101 103 106
100 102
100 100
103 102
40
60
80
100
120
140
160
180
JAN FEB MAR APR MAY JUN JUL AUG SEP OCT NOV DEC
2014 2013
102 102
157
7784 89
96 97
99
95
101
9698 96101
98 101 100 98 99
98
98
97
98
40
60
80
100
120
140
160
180
JAN FEB MAR APR MAY JUN JUL AUG SEP OCT NOV DEC
2014 2013

17
Consumer Products Business in Asia
To FY2012Establishment of a foundation to accelerate growth through the integration of business operations in Asia
FY2013Launch of baby diapers and laundry detergents targeting the middle-class consumer segment in China
FY2014
Launch of products targeting the middle-class consumer segment Baby diapers: Indonesia Laundry detergents: Indonesia, Vietnam
FY2015 Aiming for a 5% operating margin while expanding sales
Proactive value offerings for the growing middle-class consumer segment
Attack Jaz1 (Indonesia)
Attack Power Soaking powder
laundry detergent for hand washing
(China)
Attack 10 Hands Power
(Vietnam)
Merries Shun
Shuang Tou Qi (China)
Merries Pants Good Skin(Indonesia)

18
Summary of FY2015 ForecastSummary of FY2015 Forecast

19
Key Points in FY2015 Forecast (1)Aiming to achieve the sixth consecutive fiscal year of
increases in net sales and profits* and K15 targetsPromote a post-deflation growth model and maximize use of Kao Group assets(1) Growth of the Consumer Products Business in Japan Value offerings in response to social issues including the environment,
health, the aging society and hygiene Proactive initiatives including launch of new and improved products and
marketing investmentReinforce Healthya functional drinks
(2) Recovery of trust and improvement of business performancefor Kanebo CosmeticsRespond in a sincere manner to those with vitiligo-like symptomsOperating margin before deduction of royaltiesFY2014 actual: Slightly more than 7%FY2015 forecast: Approximately 8%
* Excludes the impact of the change in financial term in 2012. (Please refer to slide 2 for details.)

20
Key Points in FY2015 Forecast (2)(3) Proactive development of business targeting the growing
middle-class consumer segment in the Consumer Products Business in Asia
(4) Improvement of profitability of the Consumer Products Businessin the Americas and Europe
(5) Stable growth of the Chemical Business in a changing global business environment Offer high-value-added products and further reinforce oleo chemicals
Enhancement of shareholder returns Annual cash dividends per share for FY2015 of 76 yen, an increase of 6 yen
compared with the previous fiscal year (planned 26th consecutive fiscal year of increases in cash dividends)

21
Factors Affecting FY2015 Forecast
Negative factors in FY2014 Impact from the delay in recovery from the pullback after the
consumption tax increase in Japan Adverse weather conditions during the summer in Japan Negative impact from the fluctuation of raw material prices More intense competition in the FOSHU* drink market in Japan
Uncertainties in FY2015 Impact of the trend toward normalization of monetary policy in the
United States Public debt problem in European economies Unclear economic outlook in emerging nations An economic downturn overseas due to volatility of exchange rates and
crude oil prices and its impact on the operating environment in Japan
* Food for Specified Health Uses

22
Summary of FY2015 Forecast
+4.9%Net sales+8.7%EBITA*
[% of sales]
+12.6%Operating income[% of sales]
+9.3%Net income[% of sales]
+11.0% Net income per share
¥76 +¥6Shareholder returns
Cash dividends per shareConsolidated payout ratio
+30 bps ROE
43.8%
¥1,470.0 billion¥176.1 billion
[12.0%]
¥150.0 billion[10.2%]
¥87.0 billion[5.9%]
¥173.63
12.7%
* Operating income before amortization of goodwill and intellectual property rights related to M&A
Year-on-yeargrowth .
23
The Kao Group’s Vision for the FutureThe Kao Group’s Vision for the Future

24
The Kao Group’s Vision for the Future
Corporate philosophy of the Kao Group (The Kao Way)To strive for the wholehearted satisfaction and enrichment of the lives of people globally and to contribute to the sustainability of the world
Kao Sustainability StatementKao Group’s basic direction of contribution to the sustainability of the world
Key areas CommunityConservation Culture
A company with a global presence
Contributions to sustainability of the worldProfitable growth
Further innovation Products and services that Maximum use of humanare “a half-step ahead ” resources and organization

25
Direction of Mid-term Growth Strategies (3 to 5 Years) after K15
Accelerate global expansion of the Consumer Products Business
High-value-added offerings that resolve social issues including the environment, health, the aging society and hygiene
Return the cosmetics business to a growth path
Achieve sales expansion and stable profitability in the Chemical Business

26
Targeted Sustainable Growth Model
Maximize use of Kao Group assets
Capabilities to generate profits(Transformation to a profitable structure)
Profitable growth
Establish a post-deflation growth model
Proactive investment
Increase market share
and sales, andcreate markets
Increase profits
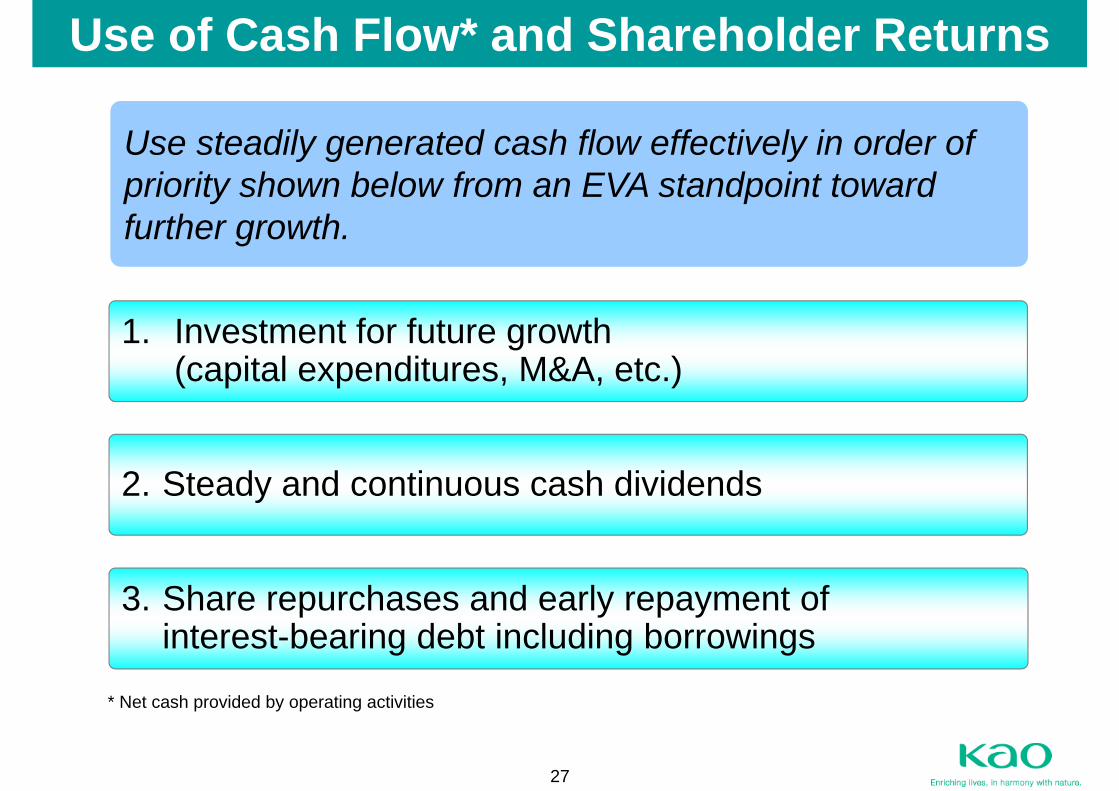
27
2. Steady and continuous cash dividends
Use steadily generated cash flow effectively in order ofpriority shown below from an EVA standpoint toward further growth.
Use of Cash Flow* and Shareholder Returns
* Net cash provided by operating activities
1. Investment for future growth(capital expenditures, M&A, etc.)
3. Share repurchases and early repayment of interest-bearing debt including borrowings
28
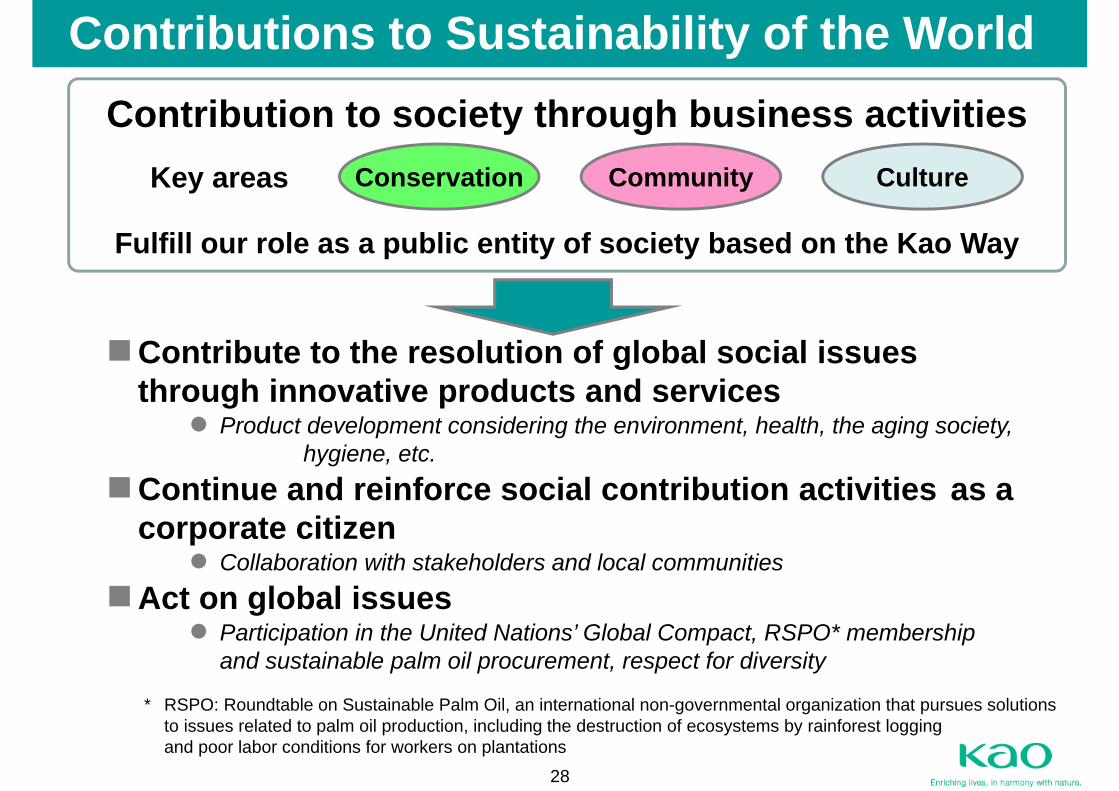
Contribution to society through business activities
Fulfill our role as a public entity of society based on the Kao Way
Contributions to Sustainability of the World
CommunityConservation CultureKey areas
Contribute to the resolution of global social issuesthrough innovative products and services
Product development considering the environment, health, the aging society, hygiene, etc.
Continue and reinforce social contribution activities as a corporate citizen
Collaboration with stakeholders and local communitiesAct on global issues
Participation in the United Nations’ Global Compact, RSPO* membership and sustainable palm oil procurement, respect for diversity
* RSPO: Roundtable on Sustainable Palm Oil, an international non-governmental organization that pursues solutionsto issues related to palm oil production, including the destruction of ecosystems by rainforest logging and poor labor conditions for workers on plantations

29
AppendicesAppendices

30
Fabric and Home Care FY2014 sales: ¥324.5 billion
ChemicalFY2014 sales: ¥288.0 billion
Beauty CareFY2014 sales: ¥589.9 billion
Human Health CareFY2014 sales: ¥240.1 billion
Business Segments and Main Product Categories
Consumerdriven
Consumerdriven
Laundry detergents and fabric treatmentsProducts for kitchen, bath, toilet and living room care
Oleo chemicalsPerformance chemicalsSpecialty chemicals
Note: Sales include intersegment sales. Share of net sales is calculated based on sales to customers.
Professional hair care productsCosmeticsSkin care (mass products)Hair care (mass products)
BeveragesOral careBlood circulation enhancement products(incl. bath additives and thermal pads)Sanitary products
Consum
er Products B
usinessC
hemical B
usiness
Consum
er Products B
usiness
[Growth: +3.4% / Share of net sales: 42.1%] [Growth: +14.0% / Share of net sales: 17.1%]
[Growth: +4.3% / Share of net sales: 23.2%] [Growth: +10.3% / Share of net sales: 17.6%]
Consum
er Products B
usiness

31
FY2014 Breakdown of Beauty Care Business
1. Includes amortization of goodwill and intellectual property rights related to M&A▪ Beauty Care: ¥28.8 billion
- Cosmetics: ¥27.9 billion- Skin care/hair care (mass products) and professional hair care products:
¥0.9 billion
Kanebo CosmeticsNet sales:
Slightly less than ¥180 billion(FY2013: Approx.¥180billion)
Profit as a % of sales2: Slightly more than 7%
(FY2013: Slightly less than 5%)
2. Operating margin before deduction of royalties
Billion yen Increase/decrease
Net sales 589.9 +3.4%
Operatingincome1 28.4 +4.5 billion yen
Operatingmargin 4.8% +60 bps
Cosmetics Net sales 260.6 +1.4%
Operatingincome1 -12.0 +5.3 billion yen
Operatingmargin -4.6% +210 bps
Skin care/hair care (massproducts) and professionalhair care products
Net sales 329.3 +5.1%
Operatingincome1 40.4 -0.8 billion yen
Operatingmargin 12.3% -90 bps
Beauty Care

32
Cosmetics in Japan – FY2014
Cosmetics market in Japan
Total market -0.2% -1.5%
Source: SLI survey by INTAGE Inc. (Data based on tracking service of 40,060 female consumers nationwide in Japanand Kao’s definition)
[Year-on-year growth on a value (yen) basis] Jan. - Dec. 14 Jan. - Dec. 13
High-priced segment (over ¥5,000): +0.1% +0.3%
Mid-priced segment (¥2,000- ¥5,000): +0.3% -3.4%
Low-priced segment (below ¥2,000): -1.2% -0.9%
Kao Group total (Kanebo Cosmetics + Kao Sofina) -0.5% -3.5%

33
7.3%
8.5%
9.8%
9.4%
10.7%
12.4%
7.9%8.8%
8.9%
10.0%
9.5% 9.5%
0%
2%
4%
6%
8%
10%
12%
14%
FY2009 2010 2011 2012 2013 2014
ROE Operating margin
ROE Enhancement
Operating margin improvement Improve operating margin while
increasing operating income
EVA perspective Proactive investment for growth Balance sheet management that
considers cost of capital
Shareholder returns as a use of cash flow Steady and continuous cash dividends (planned 25th consecutive fiscal
year of increases in cash dividends in FY2014) Share repurchases
*
* Fiscal year end is December 31 from FY2012. (Please refer to slide 2 for details.) ROE of FY2012 is for the transitional period associated with the change in fiscal year end.

34
SRI Indexes and External CSR EvaluationsSRI indexes for which Kao has been selected
CSR: Corporate Social Responsibility SRI: Socially Responsible Investment
CSR-related evaluations from external organizations
(As of February 4, 2015)
Kao Corporation also received Gold Class 2015 and Industry Mover 2015
