highlights on first half and second quarter 2014 result · pdf fileon 31 december 2013, ojk...
TRANSCRIPT

INVESTOR NEWSLETTER July 2014
Highlights on First Half and Second Quarter 2014 Result
Despite of macroeconomics challenges and tightening liquidity in the system, Bank Danamon Indonesia’s (BDI’s) average daily Loan-to-Deposit (LDR) ratio in the 2
nd quarter 2014 stood at 93.0%
or a significant improvement of 950 bps from previous year, in line with management strategy to bring LDR to the 90s level.
Total loans booked a healthy increase of 13% from previous year to Rp. 141 trillion. Mass market loan segment accounted for 51% of the total loan grew by 6%, while non-mass market loan segment reached Rp 69 trillion, a robust growth of 22%.
Asset quality has been well maintained as indicated by a 40 bps yoy decrease in NPL to 2.1% (20 bps slight increase qoq) and a constant 1H14 CoC of 2.7% (50 bps increase qoq). Qoq increase in Non-performing loan (NPL) and Cost of Credit (CoC) were mainly driven by SEMM (Self Employed Mass Market/ Danamon Simpan Pinjam/ DSP) segment where NPL and CoC increase from 5.8% to 6.5% and from 5.9% to 7.2%, respectively.
Over the past 3 quarters, yoy operating expense has been trending down and well managed at below 10%. We aim to maintain flat operating expense to end of 2014 in the midst of margin compression.
CASA ratio increase to 44% or Rp 49 trillion CASA due to lower TD. Overall funding booked a healthy growth of 16% to Rp 137 trillion.
In the 1H14, Net Interest Margin (NIM) decreased to 8.4% (1H13: 9.9%) mainly due to increase in CoF, to some extent would be compensated by lower opex.
NPAT was Rp 1,489 billion dropped from Rp 1,985 billion in the 1H13. The main factor that lead to the decrease was the newly introduced OJK’s (Otoritas Jasa Keuangan) regulation on insurance premium and acquisition cost that had impacted to recognition of income. Bank would have booked Rp 1,753 billion should there’s no change in the method of income recognition.
First Semester 2014 Financial Results
In the midst of slower economy growth, Bank Danamon continuously
consolidating and strengthening its position. Yet, the 2nd
quarter 2014 was
still a challenge. Bank Danamon had made a strategic move to reduce
LDR and keep it – on average - maximum at 95% in the midst of the
interest rate hike. Even though loan has increased by 13% compare to
1H13, net interest income only grew for 1%, as margin compression
pressure continue in 1H14 due to higher CoF.
Despites BDI’s effort to manage operating expense to reduce by 6%
compare to that at 1H13, yet NPAT came down to Rp. 1,489 billion, a
decrease from Rp. 1,985 billion of the same comparative period. More than
half of the decrease was related to non-interest income recognition method
as a result of new OJK regulation on insurance premium and acquisition
(see discussion on the next section).
7.1% 6.9%5.6%
2.8% 2.5%
2.7%
1H13 2H13 1H14
Net Interest Margin
CoC Risk Adj. NIM
9.9% 9.4%8.4%
Kienata [email protected]
Indah Hermawan [email protected]
Ridy Sudarma [email protected]
Menara Bank Danamon, 6th
floor Jl. Prof. Dr. Satrio Kav. E IV no. 6 Jakarta 12950 Tel. + 62 21 5799 1001-03 Fax. + 62 21 5799 1445 Email : [email protected]
PT Bank Danamon Indonesia, Tbk Investor Newsletter – First Half and Second Quarter 2014 Results July 2014
Page 2 of 25
OJK regulation on Insurance Fee impacting Adira Finance’s
income recognition
On 31 December 2013, OJK issued new regulation, in the form of circular
letter, No SE-06/D.05/2013 regarding vehicle insurance, which took effect
on March 1, 2014. OJK set a range of gross premium that an insurance
company could charge to customers and regulate the commission given to
agents and the discount given to customer, which are based on the gross
premium. As such, third parties (including multifinance companies and
banks) are prohibited to sell insurance at the rate higher or lower than the
premium rate set by the regulator.
On the other hand, to some extend the new regulation would benefit Adira
Insurance, due to regulated pricing that would eliminate unhealthy price
competition among general insurance companies.
Since the effective date of the new regulation, income generated from
insurance would need to be amortized vis-a-vis booked upfront previously.
Finance companies generally made some adjustments in their pricing
strategy to maintain economics of the loan. Adira Finance need to
recognize the incomes from insurance premium discount and other loan
related fee over the loan tenor using the effective interest rate (EIR)
method. Consequently, there is a timing difference between the amount
that is recognized under the EIR method and the amount should the
income recognized immediately. Depending on the loan tenor, financial
impact of the income recognition will vary. Assuming loan with tenor of 3
years, under the EIR, the related income would be recognised as much as
54% in the first year, 34% in the second year and the remaining 12% in the
third year. Throughout the years, the income would be normalized. For
comparison, ideally if regulation had not been introduced, Adira Finance
could directly recognize the income immediately.
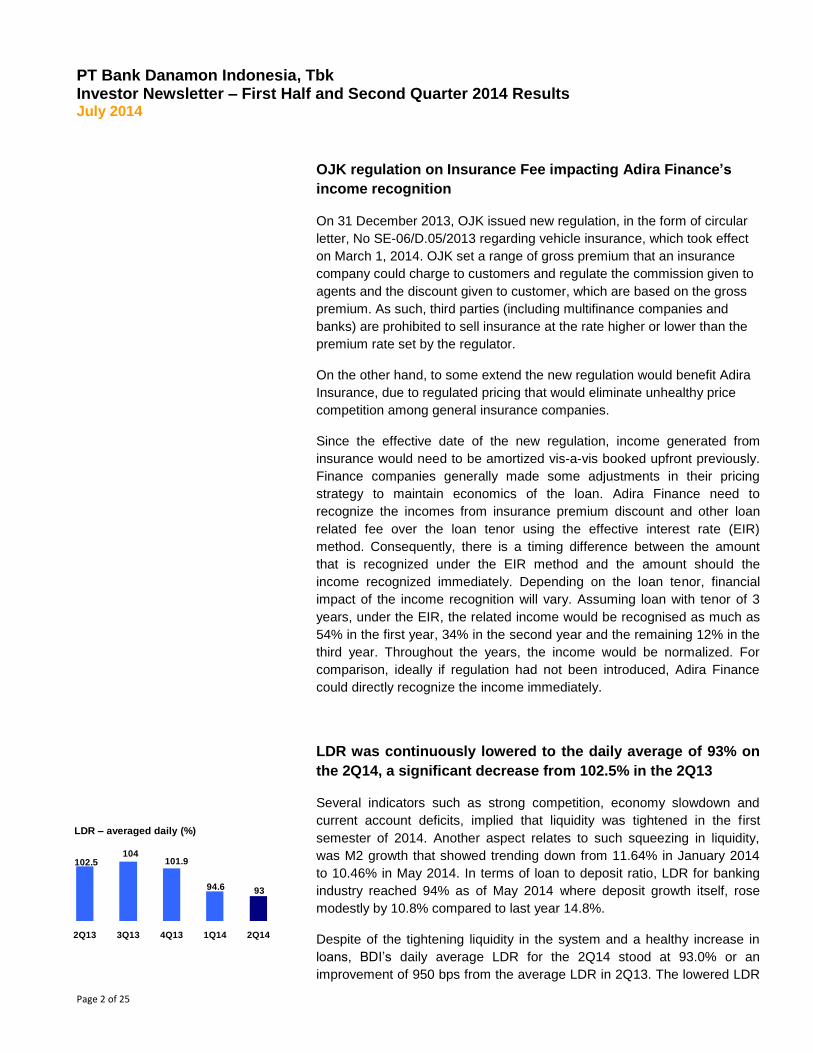
LDR was continuously lowered to the daily average of 93% on
the 2Q14, a significant decrease from 102.5% in the 2Q13
Several indicators such as strong competition, economy slowdown and
current account deficits, implied that liquidity was tightened in the first
semester of 2014. Another aspect relates to such squeezing in liquidity,
was M2 growth that showed trending down from 11.64% in January 2014
to 10.46% in May 2014. In terms of loan to deposit ratio, LDR for banking
industry reached 94% as of May 2014 where deposit growth itself, rose
modestly by 10.8% compared to last year 14.8%.
Despite of the tightening liquidity in the system and a healthy increase in
loans, BDI’s daily average LDR for the 2Q14 stood at 93.0% or an
improvement of 950 bps from the average LDR in 2Q13. The lowered LDR
102.5104
101.9
94.6 93
2Q13 3Q13 4Q13 1Q14 2Q14
LDR – averaged daily (%)
Kienata [email protected]
Indah Hermawan [email protected]
Ridy Sudarma [email protected]

PT Bank Danamon Indonesia, Tbk Investor Newsletter – First Half and Second Quarter 2014 Results July 2014
Page 3 of 25
has been managed through increasing deposits growth at the rate that
was higher than the loan growth.
The Bank would continue to use long term funding
The use of long term funding is a strategic option to diversify funding
and provide more steady liquidity amidst the increasing rate
environment, as well as to address interest rate risk and asset-liability
duration mismatch.
Back in 2010, when Indonesia’s credit rating reached the investment
grade, BDI made a strategic decision to take benefit from decreasing
CoF of wholesale funding, by leveraging long term funding. Since then,
BDI continued to use borrowings and long term funding to fund Adira
Finance business. Characteristics of wholesale funding; fixed rate with
medium/long term duration; match nicely with the duration and fixed
interest rate loan of automotive financing offered by Adira Finance.
Furthermore, it makes a perfect sense to fund high yield asset/ loan
through wholesale funding.
The use of bank borrowings and long-term funding was Rp 26 trillion in
June 2014 which represents about 19% of total deposits (customers’
deposits and long term funding). By the end of second quarter 2014,
loan to funding composition increased to 91.4%.
It is also worth a note that portion of auto financing loan channelled
through Adira Finance is a joint financing between Adira and Bank
Danamon. Over the years, Adira has become more independent in
sourcing its funding as indicated by the decreasing portion of joint
financing. Back in 2010, only 22% of loan channelled by Adira was self-
financing. As at June 2014, the portion of self-financing stood at 63%.
In Adira Finance book, as at 1H14, borrowing and bonds responsible to
85% of total funding, compare to 80% of total funding as at 1H13.
CASA ratio stood at 44%, improved from last quarter’s 42%.
Since 2008, Danamon continuously built a strong funding franchise with
the main focus in CASA. Over the period, particularly through four
champion products that have been well accepted by the market, CASA
had grown steadily at 18% CAGR. The growth in CASA outpaced the
growth in TD that came merely at 2% CAGR.
In the last 12 months, total funding had increased by 19%, supported by both CASA (grew 17%) and TD (grew 20%) with CASA ratio relatively
98.9
126.9
102.991.4
28 24
Loan to Funding - Conso 1H14 (%)
ADMF loans
LT. Fund
Bonds41%
Borrowings39%
Capital20%
ADMF Source of Fund
1H13
Rp 25.5tn
Capital
15%
Borrowi
ngs
42%
Bonds
43%
Rp 26.7 tn

PT Bank Danamon Indonesia, Tbk Investor Newsletter – First Half and Second Quarter 2014 Results July 2014
Page 4 of 25
equal at 44% (1H13: 45%). Meanwhile, compare to the earlier quarter, there’s an increase in CASA ratio from 42%. This was due to an increase in CASA (+4%) and a decrease in TD (-5%) that overall funding decrease by 1%. High cost TD was released to ease CoF. BDI will continuously innovate to better capture CASA through various initiatives including:
• Leveraging Adira and DSP’s networks potential; four Adira branches had been piloting cross selling project and will be expanded to all Adira branches by end of 2014.
• Relocation of non performing ATMs and branches. • SMS Banking (launched in the 3Q13) and Mobile Banking
application (will be launched in 3Q14). • Introduced Customer Lifecycle Management to increase the
stickiness of customers. • Improved skills and increase about 1,000 sales force to nearly
3,000 by end of 2014 from number of sales force in 2008. • Introduced Financial Supply Chain initiative, i.e. approach various
companies that are regularly transacting one another to become our customers, to boost funding.
Overall loans grew by 13%, with shift of assset mix
Compare to previous year position of June 2013, loans rose 13%
underpinned by non-mass market segment that expanded 23% to Rp 70
trillion. Mass market growth remained modest at 6% to Rp 71 trillion,
reducing the share of loan portfolio to 51% vs last year’s 54%. Meanwhile,
compare to the previous quarter, loan increase 4% with similar asset mix.
In line with the Indonesia demographic shift where people belong to middle
and affluent class (as opposed to poor and aspirant class) will increase
both in term number as well as proportion, BDI will continuously foster its
presence across all economic spectrum.
Business diversification effort was initiated in 2010 where BDI started to
focus promoting SME segment. As a result, over the last three years (June
’11 to June ’14), SME segment had grown at CAGR 20% to Rp. 23.9
trillion, though slight up tick in NPL to 1.9% in 2Q14. Over the last one
year, despite the macro economic situation, SME segment recognise 16%
increase. The growth had been backed by strong appetite from the market,
especially from the emerging SME clients (loan size below Rp 3 billion).
Commercial segment recorded a healthy growth at CAGR of 22% over the
last three years to Rp 17.4 trillion by March 2014. NPL on this segment
dropped to 0.1% from 1.4% in the previous year.
Similarly, Wholesale segment recorded CAGR of 19% over the past 3
years to Rp 19.4 trillion. NPL was at 0.9%.
Customer Deposits (Rp tn)
44%45%48%41%
26%
56%55%
52%
59%74%
2008 2011 2013 2Q13 2Q14
CASA TD
7588
11193
110
CAGR
CASA 5yr
22%
Y-y CASA
17%
Customer Deposits (Rp tn)
44%45%48%41%
26%
56%55%
52%
59%74%
2008 2011 2013 2Q13 2Q14
CASA TD
7588
11193
110
CAGR
CASA 5yr
22%
Y-y CASA
17%
26 26.532.1 29.4 29.3
51.3 55.1 57.6 61.3 61.6
Jun-13 Sep-13 Dec-13 Jan-14 Jun-14
High cost TD was released to ease CoF
SA (Rp tn) TD (Rp tn)
Mass Market
51%
Retail, 7%
SMEC, 28%
Wholesale, 14%
Loans by Segment as at March 2014
54% 53% 52% 52% 51%
7% 6% 6% 6% 7%
27% 28% 28% 28% 28%
12% 13% 14% 14% 14%
2Q13 3Q13 4Q13 1Q14 2Q14
Loan Composition
Mass market
Retail
SME & Commercial
Wholesale

PT Bank Danamon Indonesia, Tbk Investor Newsletter – First Half and Second Quarter 2014 Results July 2014
Page 5 of 25
Compare to 2Q13, Adira Finance recorded a modest growth of 7% loan or
about the same level of loan compare to the loan per end of 1Q13. New
booking grew 9% yoy (13% and 4% on two wheels and four wheels,
respectively). This was generally in line with Bank’s plan.
Micro loan, grew at 3% yoy to Rp 20.3 trillion, remain a challenge for BDI
particularly in Java. Some recovery in commodity prices had not yet
translated into loan boost in Sumatra. Nevertheless, loan to upper tier
micro segment showed a promising growth. Loan had been increased
double to Rp 1.3 trillion from Rp. 678 billion just a year ago. Management
will consistently further promote micro loan through network and capacity
optimisation.
The asset quality has been maintained amid challenge in
macroeconomic environment
Bank Danamon has been conservative in balancing the loan growth and
asset quality. The Bank continuously cautious in managing NPL, as a result
in 2Q14 NPL well managed at 2.1% which was slightly higher than previous
quarter of 1.9% despite of macroeconomic challenges. This figure is still
lower than previous year 2.4% on 2Q13. Such increment was mainly driven
by NPL rising in our Micro and smaller ticket size emerging SME lending in
that stood at 6.5% and 1.9% respectively from 5.8% and 1.6% of quarter
before. Nevertheless, it is expected that the NPL will remain flat to the end
of year.
BDI monitored its loans from various angles; based on segments and
industry sector. NPL monitoring by industry sector enable us to better
understand our customers’ profile. As per 30 June 2014, the highest NPL
came from the mining sector at 9.5% with the loan exposure of less than
2% of total loan. Other than this sector, NPL are well managed.
On auto finance segment, repossessed assets and loss on repossessed
has been manageable. Ratio of repossessed assets and repossessed
asset that had been held for more than 180 days as percentage of total
receivable had been maintained at 0.02% and 0.4%, respectively. Similarly,
loss on repossessed assets was stable at around 24.6% level.
Data of NPL for each loan segment also showed that the NPL was
manageable. Even though we saw some uptick in retail segments, the
absolute amount remained low compare to our total loan portfolio.
124 129
135 136
141
2.4%
2.2%1.9%
1.9%2.1%
0%
1%
2%
3%
4%
5%
6%
115
120
125
130
135
140
145
2Q13 3Q13 4Q13 1Q14 2Q14
Loans and NPL
Loans (Rp tn) NPL (%)
0.02
0.030.04
0.02 0.02 0.02
0.53 0.47 0.46 0.40 0.4 0.4
2010 2011 2012 2013 1Q13 1Q14
Repo Assets as % of Receivables (%)
>180 days All stock
26 27 27 2423
24.6
2010 2011 2012 2013 1H13 1H14
Loss on Repo Assets - Average (%)

PT Bank Danamon Indonesia, Tbk Investor Newsletter – First Half and Second Quarter 2014 Results July 2014
Page 6 of 25
(%) 2Q13 1Q14 2Q14 Y-y Q-q
Mass Market 2.9 2.6 2.9 - 0.3
Retail 1.1 1.2 1.5 0.4 0.3
Mid Size 1.3 1.0 1.1 -0.2 0.1
Wholesale 2.7 0.9 0.9 -1.8 -
Total 2.4 1.9 2.1 -0.3 0.2
Trade finance had expanded rapidly
Trade finance had shown a robust growth from December 2010 to June
2014. Cash loan booked a 43% CAGR while non-cash loan booked a 28%
CAGR.
The Bank believes in investment on people and infrastructure. Danamon
has invested in New Trade Finance System (NTFS) to add more customer
touch points. Twenty eight trade specialists (including additional three trade
specialists in 1H14) and Centralised Trade Operation enabled the Bank to
process and serve efficiently. The Bank has also built Trade Service Point
at Port (TSPP) in Jakarta, Medan, and Surabaya for Import Tax Payment
and B/L endorsement, as well as established trade representatives in 14
big cities in Java, Sumatra, Kalimantan, and Sulawesi. Starting from 1Q14,
the Bank had also providing product-bundling solutions through synergy
with other banking products.
Operating expense has been trending since the last quarter of
2013
Over the past 3 quarters, yoy operating expense has been trending down
and well managed at below 10%. We aim to maintain flat operating
expense to end of 2014 in the midst of margin compression.
On the other hand, yoy income growths over the same periods had been
lower. Despite the fact that the lower income was related to strategic move
to reduce LDR, resulted cost to income ratio to increase to 57.0%.
This issue had become management focus to be resolved. Accordingly
Bank will be focus to maintain operating expense at low growth while
keeping our income growth as planned. Strategic action to address this
issue including:
Resizing and redesigning SEMM distribution network by rolling out a
hub and spoke operating model, piloting a light distribution (mobile
branch) strategy in Sep 2014, automating credit underwriting
3.44.4
6.9
9.8
8.5
11.9
2010 2011 2012 2013 1H13 1H14
Cash Loans (Rp tn)
CAGR 43%
41%
4.2 4.95.6
9.9
6.8
9.8
2010 2011 2012 2013 1H13 1H14
Non - Cash Loans (Rp tn)
CAGR 34%
44%
52.0 52.8 53.4 55.2 57.0
4,603 4,743 4,659 4,511 4,338
2,391 2,507 2,489 2,489 2,472
2Q13 3Q13 4Q13 1Q14 2Q14
Operating Income Operating Expense
Operating Income and ExpenseRp billion
Cost to Income
Ratio (%)

PT Bank Danamon Indonesia, Tbk Investor Newsletter – First Half and Second Quarter 2014 Results July 2014
Page 7 of 25
processes, restructuring our credit organization at branch level and
realigning the organization end-end in the areas of sales,
collections, credit admin, regional as well as clusters.
Studying potential synergies between Adira Quantum and Adira
Finance as relate to shared middle and back office facilities. This is
considered feasible given that these subsidiaries share the same
target segment and there are similarities in origination and control
processes. This will reduce Opex/Asset ratio whilst accelerating
cross sell of Adira Quantum’s products to more than four million
Adira Finance’s customers
Resizing existing distribution network which include Retail, SEMM,
Syariah, Adira Finance and Adira Quantum.
Performing deep dive analysis on distribution channel, fine tuning
KPIs and streamlining operating model to balance revenue and
productivity.

PT Bank Danamon Indonesia, Tbk Investor Newsletter – First Half and Second Quarter 2014 Results July 2014
Page 8 of 25
Key Figures and Ratios
1H13 1H14 YoY 1Q14 2Q14 QoQ
INCOME STATEMENTS (Rp billion)
Net Interest Income 6,683 6,744 1% 3,425 3,319 -3%
Non Interest Income
2,376 2,105 -11% 1,086 1,019 -6%
Operating Income 9,059 8,849 -2% 4,511 4,338 -4%
Cost of Credit 1,598 1,829 14% 827 1,002 21%
Risk Adjusted Operating Income
7,461 7,020 -6% 3,684 3,336 -9%
Operating Expenses
4,699 4,961 6% 2,489 2,472 -1%
Net Profit after Tax 1,985 1,489 -25% 875 614 -30%
Normalised NPAT 1,985 1,753 -12% 938 816 -13%
BALANCE SHEETS (Rp billion)
Total Assets 158,103 185,433 17% 185,920 185,433 0%
Loans (gross) 123,935 140,647 13% 135,818 140,647 4%
Government Bonds 3,895 5,719 47% 5,513 5,719 4%
Customers’ Deposits 118,741 136,663 15% 138,915 136,663 -2%
Long Term Funding 25,803 26,240 2% 27,029 26,240 -3%
Equity 29,234 31,558 8% 32,106 31,558 -2%
KEY RATIOS (%)
Net Interest Margin
9.9 8.4 -1.5 8.6 8.1 -0.5
Cost of Credit 2.8 2.7 -0.0 2.5 3.0 0.5
Cost to Income
51.9 56.1 4.2 55.2 57.0 1.8
BOPO 75.7 69.7 -6.1 89.6 56.0 -33.6
ROAA 2.6 1.6 -1.0 1.9 1.3 -0.6
ROAE 14.3 9.8 -4.5 11.4 8.1 -3.3
Assets to Capital (x) 6.0 6.3 0.3 6.2 6.3 0.1
Stand Alone Loan to Funding* 91.9 91.6 -0.3 85.6 91.6 6.0
Consolidated Loan to Funding* 91.1 91.4 0.3 86.7 91.4 4.7
Regulatory LDR 105.4 98.9 -6.4 94.1 98.9 4.8
Stand Alone CAR 18.4 17.8 -0.6 18.4 17.8 -0.6
Consolidated CAR 18.7 17.7 -1.0 18.8 17.7 -1.0
NPL – Gross 2.4 2.1 -0.3 1.9 2.1 0.2
Impairment ratio (LLP/ Total Loans) 2.6 2.6 0.0 2.5 2.6 0.1
Coverage (LLP/NPL) – Mass Mkt 112.0 118.7 6.7 123.2 118.7 4.5
Coverage (LLP/NPL) – Non Mass Mkt 119.4 146.2 26.7 151.8 146.2 -5.7
*) Loan to funding is defined as (Loans + Reserves with BI + Cash in Vault + HTM bonds) / (Third Party Deposits + net borrowing and LTF
+ net capital)

PT Bank Danamon Indonesia, Tbk Investor Newsletter – First Half and Second Quarter 2014 Results July 2014
Page 9 of 25
Credit Ratings

PT Bank Danamon Indonesia, Tbk Investor Newsletter – First Half and Second Quarter 2014 Results July 2014
Page 10 of 25
BDI’s Daily Share Price and Trading Volume

PT Bank Danamon Indonesia, Tbk Investor Newsletter – First Half and Second Quarter 2014 Results July 2014
Page 11 of 25
Statements of Financial Positions As at 31 June 2014 and 31 December 2013
(in million Rupiah)
*) As reclasscified (Note 2)
30 Jun 2014 31 Des 2013 *) 30 Jun 2014 31 Des 2013 *)
ASSETS1. Cash 2,142,187 2,825,082 2,300,086 2,943,909
2. Placements with Bank Indonesia 10,424,319 12,903,138 10,424,319 12,903,138
3. Placements with other banks 5,527,047 7,127,226 7,795,127 9,210,256
4. Spot and derivative receivables 241,791 740,000 403,753 1,174,517
5. Marketable securities
a. Designated at fair value through profit/loss 660,989 126,788 660,989 126,788
b. Available for sale 10,937,894 11,272,216 11,544,730 11,881,419
c. Held to maturity 309,820 321,819 388,820 400,819
d. Loans and receivables - - - -
6. Securities sold under repurchase agreements (repo) 930,056 937,500 930,056 937,500
7. Securities purchased under resale agreements (reverse repo) 144,541 - 144,541 -
8. Acceptance receivables 5,032,596 4,107,561 5,032,596 4,107,561
9. Loans
a. Designated at fair value through profit/loss - - - -
b. Available for sale - - - -
c. Held to maturity - - - -
d. Loans and receivables 107,378,821 103,895,851 107,378,821 103,895,851
10. Sharia financing 2,139,522 1,884,790 2,139,522 1,884,790
11. Consumer financing receivables - - 29,326,825 28,091,602
Allowance for impairment losses on consumer financing receivables -/- - - (1,001,471) (913,771)
12. Premium receivables - - 104,795 118,268
13. Reinsurance Assets - - 537,980 568,311
14. Investments 2,657,392 2,657,392 12,175 12,175
15. Allowance for impairment losses on financial assets -/-
a. Marketable securities (20,942) (21,122) (20,942) (21,122)
b. Loans (2,613,834) (2,312,387) (2,613,834) (2,312,387)
c. Others (27,078) (28,260) (50,553) (42,440)
16. Intangible assets 935,222 926,022 3,013,179 2,990,289
Accumulated amortisation on intangible assets -/- (737,259) (681,198) (1,676,926) (1,611,864)
17. Fixed assets and equipment 3,849,378 3,702,845 4,785,532 4,587,425
Accumulated depreciation of fixed assets and equipment -/- (1,987,739) (1,825,780) (2,412,584) (2,203,431)
18. Non earning asset
a. Idle properties 16,289 16,289 16,289 16,289
b. Foreclosed assets 974 1,626 974 1,626
c. Suspense accounts 1,148 570 1,148 570
d. Interbranch assets
i. Conducting operational activities in Indonesia - - 515 117
ii. Conducting operational activities outside Indonesia - - - -
19. Allowance for impairment losses on other assets -/- - - - -
20. Leased receivables - - 1,801,119 1,511,042
21. Deferred tax assets 924,582 946,200 992,941 1,022,113
22. Other assets 5,561,200 2,496,869 3,472,849 2,955,988
TOTAL ASSETS 154,428,916 152,021,037 185,433,371 184,237,348
CONSOLIDATEDNO. ACCOUNTS
BANK

PT Bank Danamon Indonesia, Tbk Investor Newsletter – First Half and Second Quarter 2014 Results July 2014
Page 12 of 25
*) As reclasscified (Note 2)
30 Jun 2014 31 Des 2013 *) 30 Jun 2014 31 Des 2013 *)
LIABILITIES AND EQUITY
1. Current accounts 18,331,304 20,123,886 18,033,119 19,538,749
2. Savings 28,977,261 31,610,413 28,977,261 31,610,413
3. Time deposits 60,323,444 57,159,885 60,271,444 56,637,058
4. Revenue sharing investment funds 1,931,076 1,402,833 1,868,765 1,374,962
5. Deferred premium income - - 1,049,113 1,004,137
6. Unearned premium reserve - - 891,216 940,109
7. Loans from Bank Indonesia - - - -
8. Borrowings from other banks 4,140,326 1,699,244 4,140,326 1,699,244
9. Spot and derivative liabilities 286,773 456,211 370,096 458,850
10. Securities sold under repurchase agreements (repo) 750,000 759,245 750,000 759,245
11. Acceptance payables 5,032,687 4,103,382 5,032,687 4,103,382
12. Marketable securities issued 919,465 918,972 12,319,374 12,122,028
13. Borrowingsa. Loans that can be counted as capital - - - -
b. Other Borrowings 1,907,979 4,816,559 13,078,033 16,068,470
14. Security deposits 40,849 46,981 40,849 46,981
15. Interbranch liabilities
a. Conducting operational activities in Indonesia - - - -
b. Conducting operational activities outside Indonesia - - - -
16. Deferred tax liabilities - - 410,565 347,424
17. Other liabilities 3,732,887 3,167,200 6,445,620 5,973,313
18. Profit sharing investment funds - - - -
TOTAL LIABILITIES 126,374,051 126,264,811 153,678,468 152,684,365
EQUITY
19. Issued and fully paid capital
a. Authorized capital 12,238,589 12,238,589 12,238,589 12,238,589
b. Unpaid capital -/- (6,337,468) (6,337,467) (6,337,468) (6,337,467)
c. Treasury stock -/- - - - -
20. Additional paid-up capital
a. Agio 7,391,756 7,391,756 7,391,756 7,391,756
b. Disagio -/- - - - -
c. Donated capital - - - -
d. Capital paid in advance - - - -
e. Others - - - -
21. Other comprehensive incomea. Difference in foreign currencies translation - - - -
b. Gains (losses) from changes in the value of financial
assets (51,597) (71,161) (90,116) (116,646)
c. Cash flow hedges 11,912 31,273 9,967 5,625
d. Revaluation reserves of fixed asset - - - -
e. Part of other comprehensive income of associates - - - -
f. Gains (losses) on defined benefit actuarial program - - - -
g. Income tax related to other comprehensive income - - - -
h. Others - - - -
22. Difference in quasi- reorganisation - - - -
23. Difference in restructuring value of transaction of entities
under - - - -
24. Others Equity - - - -
25. Reserves
a. General reserves 276,767 236,350 276,767 236,350
b. Specific reserves - - - -
26. Retained earnings
a. Previous years *) 11,013,916 9,303,232 16,580,293 13,791,582
b. Current year 3,510,990 2,963,654 1,488,624 4,041,684
TOTAL EQUITY ATTRIBUTABLE TO EQUITY
HOLDERS OF THE PARENT EQUITY 28,054,865 25,756,226 31,558,412 31,251,473
27. Non-controlling interests - - 196,491 301,510
TOTAL EQUITY 28,054,865 25,756,226 31,754,903 31,552,983
TOTAL LIABILITIES AND EQUITY 154,428,916 152,021,037 185,433,371 184,237,348
NO. ACCOUNTSBANK CONSOLIDATED

PT Bank Danamon Indonesia, Tbk Investor Newsletter – First Half and Second Quarter 2014 Results July 2014
Page 13 of 25
Statements of Comprehensive Income For the 6 Months Periods Ended 31 June 2014 and 2013 (in million Rupiah, except earnings per share)
*) As reclasscified (Note 2)
30 Jun 2014 30 Jun 2013 *) 30 Jun 2014 30 Jun 2013 *)
INCOME AND EXPENSES FROM OPERATIONS
A. Interest Income and Expenses
1. Interest Income
a. Rupiah 7,646,416 6,541,200 10,832,874 9,316,685
b. Foreign currencies 351,651 271,653 351,653 271,655
2. Interest Expense
a. Rupiah 3,050,703 2,013,153 3,904,042 2,709,010
b. Foreign currencies 282,264 107,718 484,605 164,022
Net Interest Income 4,665,100 4,691,982 6,795,880 6,715,308
3. Underwriting income
3.1. Premium income - - 754,921 596,082
3.2. Underwriting expense - - 501,132 369,826
Net Underwriting Income - - 253,789 226,256
Net Interest and underwriting income 4,665,100 4,691,982 7,049,669 6,941,564
4. Sharia Income
4.1. Margin 15,763 12,735 15,763 12,735
4.2. Profit sharing 93,043 69,268 93,043 69,268
4.3. Bonus income 1,549 496 1,549 496
Total Sharia Income 110,355 82,499 110,355 82,499
5. Sharia Expenses
5.1. iB loss sharing 46,805 22,505 46,805 22,505
5.2. iB bonus expense 1,224 782 1,224 782
Total Sharia Expenses 48,029 23,287 48,029 23,287
Net Sharia Interest Income 62,326 59,212 62,326 59,212
B. Other Operating Income and Expense
1. Other Operating Income 4,471,087 1,922,219 2,890,551 2,567,489
a. Increase in fair value of financial assets (mark to market)
i. Marketable securities - 2 - 2
ii. Loans - - - -
iii. Spot and derivatives 570,302 21,178 570,302 21,178
iv. Other financial assets - 18,375 - 18,375
b. Decrease in fair value of financial liabilities (mark to
market) - - - -
c. Gain from sale of financial assets - -
i. Marketable securities 12,857 3,713 13,995 2,962
ii. Loans - - - -
iii. Other financial assets - - - -
d. Gain from spot and derivative transaction (realised) 47,975 99,855 47,975 99,855
e. Gain from investment under equity method - - - -
f. Dividend 2,725,479 674,221 705 3,481
g. Fees/commissions and administrative 765,367 787,016 1,102,322 1,090,369
h. Recovery of impairment loss reserves - - - -
i. Other income 349,107 317,859 1,155,252 1,331,267
CONSOLIDATEDNO. ACCOUNTS
BANK

PT Bank Danamon Indonesia, Tbk Investor Newsletter – First Half and Second Quarter 2014 Results July 2014
Page 14 of 25
*) As reclasscified (Note 2)
30 Jun 2014 30 Jun 2013 *) 30 Jun 2014 30 Jun 2013 *)
2. Other Operating Expenses 5,393,210 4,534,351 7,931,380 6,808,405
a. Decrease in fair value of financial assets
(mark to market)
i. Marketable securities 669 - 669 -
ii. Loans - - - -
iii. Spot and derivatives 425,760 45,419 425,760 45,419
iv. Other financial assets - - - -
b. Increase in fair value of financial liabilities
(mark to market) - - - -
c. Losses from sale of financial assets
i. Marketable securities 2,206 5,921 2,206 5,921
ii. Loans - - - -
iii. Other financial assets - - - -
d. Losses from spot and derivative transaction (realised) 237,724 6,534 237,724 15,614
e. Impairment losses on financial assets
i. Marketable securities - 477 - 477
ii. Loans 1,172,508 1,097,287 1,867,581 1,678,420
iii. Sharia financing 7,531 10,805 7,531 10,805
iv. Other financial assets 8,165 (5,836) 45,811 5,324
f. Losses related to operational risk 2,532 3,382 3,174 3,510
g. Losses from investment in shares under
equity method - - - -
h. Fees/commissions and administrative 169,138 161,684 169,890 159,881
i. Losses from decrease in value of non financial assets - 1,676 13 1,676
j. Salaries and employee benefits 1,806,658 1,699,877 2,912,769 2,716,064
k. Promotion expenses 101,713 89,113 126,843 118,193
l. Other expenses 1,458,606 1,418,012 2,131,409 2,047,101
Net Other Operating Expenses (922,123) (2,612,132) (5,040,829) (4,240,916)
OPERATING INCOME 3,805,303 2,139,062 2,071,166 2,759,860
NON OPERATING INCOME
1. Gain/(loss) from sale of premisses and equipment 1,059 3,534 1,200 2,246
2. Gain (loss) on foreign currencies translation (52) (27) (533) 791
3. Income(expenses) non operating expenses (7,301) (2,758) (34,909) (47,534)
NON OPERATING LOSS (6,294) 749 (34,242) (44,497)
INCOME BEFORE INCOME TAX 3,799,009 2,139,811 2,036,924 2,715,363
1 Income tax
a. Income tax expenses 276,893 337,454 429,105 612,670
b. Deferred tax expenses (income) 11,126 43,597 73,502 64,942
NET INCOME 3,510,990 1,758,760 1,534,317 2,037,751
OTHER COMPREHENSIF INCOME NET OF TAX
a. Foreign exchange difference from translation of financial
statements in foreign currency - - - -
b. Gains from change financial assets available for sale 26,084 (107,765) 34,291 (118,060)
c. Cash flow hedges (15,390) 10,489 17,427 50,375
d. Gain fixed asset revalutioan - - - -
e. Part of other comprehensive income of associates - - - -
f. Gains (losses) on defined benefit actuarial program - - - -
g. Income tax relating to components of other
comprehensive (10,491) 26,941 (18,807) 26,941
h. Others - - - -
Other comprehensive income, net of tax 203 (70,335) 32,911 (40,744)
TOTAL COMPREHENSIVE INCOME 3,511,193 1,688,425 1,567,228 1,997,007
Comprehensive income attribute to :
EQUITY HOLDERS OF THE PARENT ENTITY 3,510,990 1,758,760 1,488,624 1,985,001
NON-CONTROLLING INTERESTS - - 45,693 52,750
TOTAL INCOME FOR THE YEAR ENDED 3,510,990 1,758,760 1,534,317 2,037,751
Total comprehensive income attribute to :
EQUITY HOLDERS OF THE PARENT ENTITY 3,511,193 1,688,425 1,519,495 1,943,553
NON-CONTROLLING INTERESTS - - 47,733 53,454
TOTAL COMPREHENSIVE INCOME IN CURRENT
YEARS 3,511,193 1,688,425 1,567,228 1,997,007
PROFIT (LOSS) TRANSFERRED TO HEAD OFFICE
DIVIDEND 1,212,553 (1,203,640) 1,212,553 (1,203,640)
OTHERS 40,417 (40,118) 40,417 (40,118)
EARNINGS PER SHARE 366.31 183.50 155.31 207.10
CONSOLIDATEDNO. ACCOUNTS
BANK

PT Bank Danamon Indonesia, Tbk Investor Newsletter – First Half and Second Quarter 2014 Results July 2014
Page 15 of 25
Reconciliation between amounts stated in the statement of comprehensive income and those stated in the discussion section/ analyst briefing For the 6 Months Period ended 30 June 2014
a b c d e f g h i
Net
Interest
Income
Net Under-
writing
Income
Net Sharia
Interest
Income
Other
Operating
Income
Other
Operating
Expenses
Non
Operating
Income
Non
Operating
Loss
Income
before
Tax Taxes
Minority
Interest Income after Minority Interest
6,796 254 62 2,891 (7,931) - (34) 2,037 (503) (46) 1,489
a+c b+d e f+g h i
Net
Interest
Income
Non-
Interest
Income
Operating
Income
Operating
Expenses
Pre-
Provision
Operating
Profit Cost of Credit
Non
Operating
Income/
(Loss) Taxes
Minority
Interest
Net Profit
after Tax
and
Minority
Interest Remark
6,858 3,144 10,003 (7,931) 2,071 - (34) (503) (46) 1,489
(115) (115) 115 - - LPS Deposit Insurance
(11) (11) (11) 11 - Provision for ADMF acquisition cost
(82) (82) (82) 82 - Write off on amortization cost
(100) (100) 100 - - ADMF indirect acquisition cost
(426) (426) 426 - - Decrease in fair value of f inancial assets (MTM)
(2) (2) 2 - - Losses from sale of f inancial assets (marketable securities)
(238) (238) 238 - - - Losses from spot and derivative transaction (realised)
- 1,921 1,921 (1,921) - Impairment losses on f inancial assets
(170) (170) 170 - - Fees/commissions and administrative expenses
(10) (10) (1) (11) 11 - Others
6,744 2,105 8,849 (4,961) 3,888 (1,829) (23) (503) (46) 1,489
Newsletter
Analyst Briefing Presentation

PT Bank Danamon Indonesia, Tbk Investor Newsletter – First Half and Second Quarter 2014 Results July 2014
Page 16 of 25
Key Financial Ratios As at 30 June 2014 and 2013
*) As reclasscified (Note 2)
30 Jun 2014 30 Jun 2013 *)
CONSOLIDATED RATIOS :I. Capital
1. Capital Adequacy Ratio (CAR) 17.75% 18.71%II. Earning assets
1. Non-performing earning assets and non productive assets to total earnings and non
productive assets 1.41% 1.70%
2. Non-performing earning assets to total productive assets 1.77% 2.10%
3. Allowance for impairment losses for financial asset to productive asset 2.22% 2.43%
4. NPL gross 2.09% 2.38%
5. NPL net 1.24% 0.00%
III. Rentability1. Return on Assets (ROA) 2.19% 3.51%
2. Return on Equity (ROE) 9.78% 14.33%
3. NIM including third party premium expenses 8.38% 9.88%
4. Cost to income 56.06% 51.87%
BANK RATIOS :I. Capital
1. CAR 17.81% 18.37%
II. Earning assets1. Non-performing earning assets and non productive assets to total earnings and non
productive assets 1.37% 1.72%
2. Non-performing earning assets to total productive assets 1.79% 2.21%
3. Allowance for impairment losses for financial asset to productive asset 1.96% 2.15%
4. NPL gross 2.23% 2.62%
5. NPL net after impairment value 1.26% 0.13%
6. Non performing iB receivables and financing with contract 1.56% 1.69%III. Rentability
1. ROA 4.93% 3.36%
2. ROE 28.23% 15.46%
3. NIM 7.29% 8.62%
4. NIM including third party premium expenses 7.11% 8.45%
5. Operating expenses to operating income 69.75% 75.74%
6. Cost to income 58.92% 55.01%IV. Liquidity
LDR 98.93% 105.39%V. Compliance
1. a. Percentage violation on Legal Lending Limit a.1. Related parties 0.00% 0.00% a.2. Third parties 0.00% 0.00%
b. Percentage lending in excess of Legal Lending Limit b.1. Related parties 0.00% 0.00% b.2. Third parties 0.00% 0.00%
2. Statutory Reserve Requirements (GWM)a. GWM Primary Idr 8.07% 8.09%b. GWM Foreign Currency 8.17% 8.24%
4. Net Open Position 0.29% 1.18%
NO. RATIOS (%)

PT Bank Danamon Indonesia, Tbk Investor Newsletter – First Half and Second Quarter 2014 Results July 2014
Page 17 of 25
Statements of Commitments and Contingencies As at 30 June 2014 and 31 December 2013 (in million Rupiah)
30 Jun 2014 31 Des 2013 30 Jun 2014 31 Des 2013
I COMMITMENT RECEIVABLES
1. Unused borrowing facilities
a. Rupiah - - - -
b. Foreign currencies - - - -
2. Outstanding buying of spot and derivative contract 10,607,807 8,927,047 10,607,807 8,927,047
3. Others - - - -
II COMMITMENT PAYABLES
1. Unused loans facilities granted to debtors
a. BUMN
i. Committed
- Rupiah - - - -
- Foreign currencies - - - -
ii. Uncommitted
- Rupiah 50,611 49,551 50,611 49,551
- Foreign currencies - - - -
b. Others
i. Committed 220,454 294,125 220,454 294,125
ii. Uncommitted 38,543,771 31,106,414 38,543,771 31,106,414
2. Unused loan facilities granted to other banks
a. Committed
i. Rupiah 13,436 23,155 13,436 23,155
ii. Foreign currencies - - - -
b. Uncommitted
i. Rupiah 289,085 217,207 289,085 217,207
ii. Foreign currencies - - - -
3. Outstanding Irrevocable L/C
a. Offshore L/C 1,447,412 1,573,293 1,447,412 1,573,293
b. Local L/C 238,589 914,713 238,589 914,713
4. Outstanding selling of spot and derivative contract 3,267,775 3,208,393 3,267,775 3,208,393
5. Others - - - -
III. CONTINGENT RECEIVABLES
1. Guarantees received
a. Rupiah - - - -
b. Foreign currencies 82,817 85,902 82,817 85,902
2. Interest receivables on non performing assets
a. Loan interest income 340,060 292,383 340,060 292,383
b. Other interest - 2,538 - 2,538
3. Others - - - -
IV. CONTINGENT PAYABLES
1. Guarantees issued
a. Rupiah 2,591,401 2,764,076 2,591,401 2,764,076
b. Foreign currencies 521,638 588,719 521,638 588,719
2. Others - - - -
BANK DANAMON KONSOLIDASIANNO. ACCOUNTS

PT Bank Danamon Indonesia, Tbk Investor Newsletter – First Half and Second Quarter 2014 Results July 2014
Page 18 of 25
Asset Quality and Other Information As at 30 June 2014 and 2013 (in million Rupiah)
"
CurrentSpecial
MentionSubstandard Doubtful Loss Total Current
Special
MentionSubstandard Doubtful Loss Total
L DPK KL D M JUMLAH L DPK KL D M JUMLAH
I. RELATED PARTIES
1. Placements with other banks
a. Rupiah 127,558 - - - - 127,558 101,567 - - - - 101,567
b. Foreign currencies 269,167 - - - - 269,167 163,662 - - - - 163,662
2. Spot and derivative receivables
a. Rupiah - - - - - - - - - - - -
b. Foreign currencies - - - - - - - - - - - -
3. Marketable securities
a. Rupiah 74,178 - - - - 74,178 5,078 - - - - 5,078
b. Foreign currencies 10,227 - - - - 10,227 9,245 - - - - 9,245
4. Securities sold under repurchase agreements (repo)
a. Rupiah - - - - - - - - - - - -
b. Foreign currencies - - - - - - - - - - - -
5. Securities purchased under resale agreements (reverse repo)
a. Rupiah - - - - - - - - - - - -
b. Foreign currencies - - - - - - - - - - - -
6. Acceptance receivables 2,602 - - - - 2,602 - - - - - -
7. Loans
a. Debtor micro, small and medium
i. Rupiah 9 - - - - 9 2,634 - - - - 2,634
ii. Foreign currencies - - - - - - - - - - - -
b. Non debtor micro, small and medium
i. Rupiah 25,081 - 2 - - 25,083 837,912 - - - - 837,912
ii. Foreign currencies - - - - - - - - - - - -
c. Restructured
i. Rupiah - - - - - - - - - - - -
i. Foreign currencies - - - - - - - - - - - -
d. Properties loan 21,749 - - - - 21,749 16,424 - - - - 16,424
8. Investments 2,645,312 - - - - 2,645,312 2,645,312 - - - - 2,645,312
9. Temporary equity investment - - - - - - - - - - - -
10. Others receivables - - - - - - - - - - - -
11. Commitments and contingencies to third parties
a. Rupiah 1,251,553 - - - - 1,251,553 64 - - - - 64
b. Foreign currencies - - - - - - - - - - - -
12. Idle properties - - - - - - - - - - - -
13. Foreclosed assets - - - - - - - - - - - -
14. Suspense accounts - - - - - - - - - - - -
II. NON RELATED PARTIES
1. Placements with other banks
a. Rupiah 459,276 - - - - 459,276 78,195 - - - - 78,195
b. Foreign currencies 4,671,046 - - - - 4,671,046 2,196,961 - - - - 2,196,961
2. Spot and derivative receivables
a. Rupiah 198,577 - - - - 198,577 127,377 - - - - 127,377
b. Foreign currencies 43,214 - - - - 43,214 9,079 - - - - 9,079
3. Marketable securities
a. Rupiah 11,107,170 - - - 20,000 11,127,170 9,141,586 - - - 20,000 9,161,586
b. Foreign currencies 697,128 - - - - 697,128 169,702 - - - - 169,702
4. Securities sold under repurchase agreements (repo)
a. Rupiah 930,056 - - - - 930,056 926,691 - - - - 926,691
b. Foreign currencies - - - - - - - - - - - -
5. Securities purchased under resale agreements (reverse repo)
a. Rupiah 144,541 - - - - 144,541 462,390 - - - - 462,390
b. Foreign currencies - - - - - - - - - - - -
6. Acceptance receivables 4,985,512 44,482 - - - 5,029,994 1,892,635 - - - - 1,892,635
7. Loans
a. Debtor micro, small and medium
i. Rupiah 30,098,315 2,161,315 324,297 514,628 736,135 33,834,690 29,376,244 1,770,680 259,712 430,986 626,496 32,464,118
ii. Foreign currencies 305,926 3,070 - - 571 309,567 318,089 1,975 - 2,806 1,050 323,920
b. Non debtor micro, small and medium
i. Rupiah 57,987,272 4,564,331 146,490 240,523 279,718 63,218,334 48,284,046 5,012,686 140,871 252,256 342,103 54,031,962
ii. Foreign currencies 11,363,520 590,098 6,618 24,070 146,353 12,130,659 9,594,316 376,661 - - 493,289 10,464,266 c. Restructured
i. Rupiah 730,518 407,885 80,039 72,792 142,287 1,433,521 656,153 300,913 44,640 47,854 98,513 1,148,073
ii. Foreign currencies 184,883 508,100 3,518 24,070 38,826 759,397 324,170 367,844 - - 32,505 724,519
d. Properties loan 4,412,540 180,644 11,540 9,748 39,376 4,653,848 3,967,040 181,635 6,331 8,577 26,088 4,189,671
8. Investments 12,055 25 - - - 12,080 12,055 25 - - - 12,080
9. Temporary equity investment - - - - - - - - - - - -
10. Others receivables 38,140 - - - - 38,140 141,965 - - - 1,688 143,653
11. Commitments and contingencies to third parties
a. Rupiah 31,022,380 212,692 5,823 - 4,902 31,245,797 26,070,595 157,565 - - - 26,228,160
b. Foreign currencies 11,023,297 395,751 - - - 11,419,048 8,383,683 64,082 - - - 8,447,765
12. Idle properties - - - - 16,289 16,289 - - - 1,908 14,381 16,289
13. Foreclosed assets - - - 540 434 974 - - 80 593 1,265 1,938
14. Suspense accounts 1,148 - - - - 1,148 2,023 - - - - 2,023
III. OTHERS INFORMATION
1. Collateralised assets
a. To Bank Indonesia - 62,560
b. To other parties - -
2. Total Allowance for impairment losses on financial assets -/- 2,661,854 2,497,014
3. Minimum required allowance for possible losses on assets 2,865,901 2,960,901
4. Percentage of micro, small and medium enterprises credit to total loans 31.18% 33.42%
5. Percentage of micro and small enterprises credit to total loans 12.74% 14.52%
6. Percentage of micro, small and medium enterprises debtors to total
debtors 9.42% 9.63%
7. Percentage of micro and small enterprises debtor to total debtors 7.85% 8.33%
8. Others
a. Chanelling loans 350,638 350,644
b. Chanelling loans Mudharabah Muqayadah - -
c. Written-off earning assets 1,154,193 1,207,502
d. Recovery on written-off earning assets 349,858 343,743
e. Charged-off earning assets 618,626 311,532
30 June 2014 30 June 2013
NO. ACCOUNTS

PT Bank Danamon Indonesia, Tbk Investor Newsletter – First Half and Second Quarter 2014 Results July 2014
Page 19 of 25
Allowance for Impairment Losses As at 30 June 2014 and 2013 (in million Rupiah)
Statement of Foreign Exchange and Derivative Transactions As at 30 June 2014 (in million Rupiah)
Individual Collective General Specific Individual Collective General Specific
1 Placements with other banks - 4,167 55,270 - - 1,286 25,404 -
2 Spot and derivative receivables - - 2,418 - - - 1,365 -
3 Marketable securities 20,000 942 31,266 20,000 20,000 1,227 26,309 20,000
4 Securities sold under repurchase
agreements (repo) - - - - - - - -
5 Securities purchased under resale
agreements (reverse repo) - - - - - 20 249 -
6 Acceptance receivables - - 49,881 2,224 - - 18,926 -
7 Loans 327,449 2,286,385 972,157 1,604,814 585,143 1,842,842 870,866 1,890,883
8 Others receivable 22,911 - 381 - 46,496 - 1,420 1,688
9 Investments - - 26,574 1 - - 26,574 1
10 Temporary equity investment - - - - - - - -
11 Transaction administrative accounts - - 47,723 36,197 - - 49,227 11,082
370,360 2,291,494 1,185,671 1,663,236 651,639 1,845,375 1,020,338 1,923,655
No. Impairment Loss Allowance Minimum Required Regulatory
30 Jun 2014 30 Jun 2013
Impairment Loss Allowance Minimum Required RegulatoryACCOUNTS
Notional
Amount Trading Hedging Receivables Liabilities
A. Related to exchange rate
1. Spot 579,242 579,242 - 1,462 2,442
2. Forward 628,904 628,904 - 10,896 3,848
3. Option - - - - -
a. Purchased - - - - -
b. Written - - - - -
4. Future - - - - -
5. Swap 12,083,552 11,490,802 592,750 226,892 280,234
6. Others - - - - -
B. Related to interest rate
1. Forward - - - - -
2. Option
a. Purchased - - - - -
b. Written - - - - -
3. Future 23,710 23,710 - - 78
4. Swap 178,534 178,534 - 2,541 171
5. Others - - - - -
C. Others - - - - -
TOTAL 13,493,942 12,901,192 592,750 241,791 286,773
Purpose Derivative Receivable and LiabilitiesNO. TRANSACTION

PT Bank Danamon Indonesia, Tbk Investor Newsletter – First Half and Second Quarter 2014 Results July 2014
Page 20 of 25
Capital Adequacy Ratio As at 30 June 2014 and 2013 (in million Rupiah)
Bank Konsolidasian Bank KonsolidasianI. COMPONENTS
A. CORE CAPITAL 23,712,419 28,363,924 20,809,615 25,786,144 1. Paid up capital 5,901,122 5,901,122 5,901,122 5,901,122 2. Disclosed reserves
2.1 Additional factors a. Additional paid up capital 7,391,756 7,391,756 7,391,756 7,391,756 b. Donated capital - - - - c. General reserve 276,767 276,767 236,350 236,350 d. Specific reserves - - - - e. Prior years' profit after tax (100%) 10,102,564 15,660,350 8,489,868 12,978,222 f. Current year profit net of taxes (50%) 1,755,495 743,791 879,380 992,500 g. Positive adjustment in foreign currency translation of overseas branch - - - - h. Paid up capital fund - - - - i. Issued warrant (50%) - - - -
j. Issued share options on shares option compensation programs (50%) - - - - 2.2 Deduction factors
a. Disagio - - - - b. Prior years' losses (100%) - - - - c. Current year losses (100%) - - - - d. Negative adjustment in foreign currency translation of overseas branch - - - -
e. Other comprehensive income: loss on declining value on available for sale investment (51,597) (26,038) - -
f. Under provision between regulatory provision and impairment value on productive assets (187,054) - (446,979) (135,731)
g. Under provision between regulatory provision and impairment value on non productive assets (16,993) (16,993) (16,908) (16,908)
h. Negative difference on fair value of financial instrument in trading book - - - - 3. Inovative Capital
3.1 Subordinated marketable securities (perpetual non cummulative) - - - - 3.2 Subordinated loan (perpetual non cummulative) - - - - 3.3 Other innovative capital instruments - - - -
4. Deduction factor to core capital 4.1 Goodwill - (1,074,532) - (1,074,532) 4.2 Other intangible assets - - - - 4.3 Investment (50%) (1,459,641) (492,299) (1,624,974) (486,635) 4.4 Short of capital on insurance subsidiary company (50%) - - - -
5. Minority interest - - - -
B. SUPPLEMENTARY CAPITAL - 903,133 - 701,419 1. Upper Tier 2
1.1 Preferen stock (perpetual cummulative)1.2 Subordinated marketable securities (perpetual cummulative) - - - - 1.3 Subordinated loan (perpetual cummulative) - - - - 1.4 Mandatory covertible bond - - - - 1.5 Remaining innovative capital which has not been calculated in core capital - - - - 1.6 Other supplementary capital upper tier 2 - - - - 1.7 Fixed assets revaluation - - - -
1.8 General allowance for possible losses on earning assets (max. 1.25% of weighted risk-based
assets) 1,185,671 1,395,432 1,020,338 1,188,054
1.9 Other comprehensive income: Increase in fair value of available for sale investment (45%) - - - - 2. Lower Tier 2 max 50% core capital
2.1 Redemable preference shares - - - - 2.1 Subordinated borrowings or bonds which can be calculated - - - - 2.3 Other supplementary capital lower tier 2 - - - -
3. Deduction factor supplementary capital 3.1 Investments (50%) (1,185,671) (492,299) (1,020,338) (486,635) 3.2 Short of capital on insurance subsidiary company (50%) - - - -
C. - - - - - - - -
D. Other supplementary capital which meet the criterias (Tier 3) - - - - E. Other supplementary capital allocated to anticipate market risk - - - -
II. TOTAL CORE AND SUPPLEMENTARY CAPITAL (A+B-C) 23,712,419 29,267,057 20,809,615 26,487,563
III.23,712,419 29,267,057 20,809,615 26,487,563
IV. RISK WEIGHTED ASSETS - CREDIT RISK *) 110,628,050 132,585,428 92,609,813 112,546,114 V. RISK WEIGHTED ASSETS - OPERATIONAL RISK 22,214,233 32,060,719 20,269,187 28,600,198 VI. RISK WEIGHTED ASSETS - MARKET RISK 277,117 279,313 376,257 385,572 VII.
17.85% 17.78% 18.44% 18.77%VIII.
17.81% 17.75% 18.37% 18.71%
CAPITAL ADEQUACY RATIO WITH CREDIT RISK AND OPERATIONAL RISK CHARGE
(III:(IV+V))
NO. DESCRIPTION
CAPITAL ADEQUACY RATIO WITH CREDIT RISK, MARKET RISK AND OPERATIONAL
RISK CHARGE (III:(IV+V+VI))
Deduction factors on core and supplementary capital securitisation exposure
TOTAL CORE, SUPPLEMENTARY CAPITAL AND ADDITIONAL SUPPLEMENTARY CAPITAL
ALLOCATED TO ANTICIPATE MARKET RISK (A+B-C+E)
30 Jun 201330 Jun 2014

PT Bank Danamon Indonesia, Tbk Investor Newsletter – First Half and Second Quarter 2014 Results July 2014
Page 21 of 25
Syariah Unit

PT Bank Danamon Indonesia, Tbk Investor Newsletter – First Half and Second Quarter 2014 Results July 2014
Page 22 of 25
BALANCE SHEETS
AS AT 30 JUNE 2014 AND 2013
(In million Rupiah)
NO. ACCOUNTS 30 Jun 2014 30 Jun 2013
A. ASSETS
1. Cash 47,493 42,501
2. Current accounts with Bank Indonesia 100,709 77,564
3. Certificates of Bank Indonesia Sharia 377,000 478,000
4. Placement with other sharia banks - -
Allowance for possible losses on placement with other sharia banks -/- - -
5. Marketable securities - sharia bonds 95,000 95,000
Allowance for possible losses on marketable securities - sharia bonds -/- (20,750) (20,750)
6. iB receivables *) 220,416 230,048
Allowance for possible losses on iB receivables -/- (16,178) (17,742)
7. Others iB receivables 97,675 167,515
Allowance for possible losses on others iB receivables -/- (117) (543)
8. iB financing 1,821,431 1,360,745
Allowance for possible losses on iB financing -/- (22,446) (23,179)
9. Fixed assets 27,614 26,555
Accumulated depreciation of fixed assets -/- (11,886) (8,106)
10. Accrued income 15,194 14,407
11. Prepaid expenses 33,251 45,714
12. Other assets 2,747 12,815
TOTAL ASSETS 2,767,151 2,480,544
B. LIABILITIES
1. iB funds
a. iB deposit current accounts 244,135 256,507
b. iB deposit savings 3,729 32,427
2. Others iB current liabilities 5,928 2,590
3. Liabilities to Bank Indonesia (FPJPS) - -
4. Deposits from other banks 40,859 28,323
5. iB marketable securities issued - 200,000
6. Others liabilities 787,632 474,156
7. Investment funds
a. iB savings 440,865 378,997
b. iB deposits 1,242,347 1,107,914
8. Accumulated (loss)/gain 1,658 (370)
TOTAL LIABILITIES 2,767,153 2,480,544
(2) -
STATEMENTS OF INCOME
FOR THE PERIOD 6 MONTHS 30 JUNE 2014 AND 2013
(In million Rupiah)
NO. ACCOUNTS 30 Jun 2014 30 Jun 2013
A. OPERATING INCOME
1. Margin 15,763 12,735
2. Profit sharing 93,042 69,268
3. iB Bonus 1,549 496
4. Other operating income 30,001 38,396
B. TOTAL OPERATING INCOME 140,355 120,895
C. Margin distribution for non - discretionary investment funds
a. Bank 320 514
b. Non Bank 46,485 21,991
c. Bank Indonesia (FPJPS) - -
D. TOTAL PROFIT SHARING 46,805 22,505
E. Income from operation after deducting margin
distribution for non-discretionary investment funds 93,550 98,390
F. OPERATING EXPENSES
1, iB bonus 1,224 782
2. Allowance for possible losses on assets 8,462 11,016
3. General and administrative 12,054 11,333
4. Salaries and employee benefits 54,184 52,279
5. Others 13,630 19,448
G. TOTAL OPERATING EXPENSE 89,554 94,858
H. NET OPERATING INCOME 3,996 3,532
I. Other non-operating income 2,868 139
J. Other non-operating expenses 5,206 4,041
K. NON-OPERATING LOSS (2,337) (3,902)
L. NET INCOME/(LOSS) DURING YEAR ENDED 1,658 (370)
STATEMENTS OF COMMITMENTS AND CONTINGENCIES
AS AT 30 JUNE 2014 AND 2013
(In million Rupiah)
NO. ACCOUNTS 30 Jun 2014 30 Jun 20131. Unused iB financing facilites **) - -
2. Outstanding iB irrevocable letters of credit - -
3. iB guarantees issued - -
4. Others 2,973 2,635
Notes:
-
-
-
*)
**)
Danamon Sharia Branches were started in May 2002. Until June 2014 Danamon Sharia has 160 Sharia sub-
branches.Danamon Sharia Branches : Jakarta, Bukit Tinggi, Aceh, Surabaya, Martapura, Solo, Makasar, Bandung,
Cirebon, Malang, Tasikmalaya, Kediri, Semarang, Jember, Mataram, Lampung, Serang, Yogyakarta,
Palembang, Pekanbaru, Medan, Purwokerto, Denpasar, Batam and Tegal.In accordance with Letter from Bank Indonesia No. 10/57/DpG/DPbS dated 27 May 2008 regarding
"Equalisation of Sharia Banking Products and Services", starting June 2008 all sharia banking products/sevices
equalized as islamic Banking (iB).iB receivables exclude margin to be received of Rp 44,898 million and Rp 57,503 million as at 30 June 2014
and 2013, respectively.This unused iB financing facilites is only for committed facilities.

PT Bank Danamon Indonesia, Tbk Investor Newsletter – First Half and Second Quarter 2014 Results July 2014
Page 23 of 25
Table of Margin Distribution For the month of June 2014 (in million Rupiah)
Nisbah
(%)
Total bonus &
profit sharing
Rate of return
indication (%)
1. iB deposit current accounts
a. Bank 4,972 41 0.00 - -
b. Non Bank 293,259 2,416 0.00 - -
2. iB deposit savings
a. Bank - - 0.00 - -
b. Non Bank 4,314 36 0.00 - -
3. iB savings
a. Bank 17,715 146 13.00 19 1.30
b. Non Bank 377,741 3,112 13.00 405 1.30
4. iB deposits
a. Bank
- 1 month 4,626 38 46.00 18 4.61
- 3 months 0 0 46.00 0 4.61
- 6 months 0 0 46.00 0 4.61
- 12 months 3,330 27 46.00 13 4.61
b. Non Bank
- 1 month 874,889 7,209 46.00 3,316 4.61
- 3 months 27,600 227 46.00 105 4.61
- 6 months 120,568 993 46.00 457 4.61
- 12 months 9,183 76 46.00 35 4.61
TOTAL 1,738,197 14,322 4,366
NO.
Depositor's portion
Type of fundingAverage
balance
Revenues to
be
distributed

PT Bank Danamon Indonesia, Tbk Investor Newsletter – First Half and Second Quarter 2014 Results July 2014
Page 24 of 25
Notes to the Financial Statements
1. Information in the consolidated statements of financial position and consolidated statements of commitments
and contingencies as at 30 June 2014 and 31 December 2013, and in the consolidated statements of
comprehensive income and consolidated statements of cash flows for the six-month periods ended 30 June
2014 and 2013, were taken from the consolidated financial statements for the six-month periods ended 30
June 2014 and 2013 and as at 31 December 2013.
The above financial information are published in order to comply with the Circular Letter of Bank Indonesia (SE
BI) No. 13/30/DPnP dated 16 December 2011 regarding “Third Amendment on Bank Indonesia Circular Letter
No. 3/30/DPnP dated 14 December 2001 regarding Quarterly and Monthly Published Financial Statements of
Commercial Bank and Certain Reports Submitted to Bank Indonesia” and in accordance with Regulation of
Capital Market and Financial Institution Supervisory Agency (“Bapepam-LK” which function has been
transferred to Financial Service Authority (”OJK”) starting 1 January 2013) No. VIII.G.7. Attachment to Decision
of Chairman of Bapepam and LK No. Kep-347/BL/2012 regarding “Financial Statements Presentation and
Disclosure of Issuer or Public Companies” jo. Decision of Chairman of Bapepam and LK. No. KEP-554/BL/2010
dated 30 December 2010 regarding “Amendment on Decision of Chairman of Capital Market Supervisory
Agency No. KEP-06/PM/2000 dated 13 March 2000 regarding Guidelines for the Preparation of Financial
Statements” jo. Circular Letter of Chairman of Bapepam No. SE-02/PM/2002 regarding “Guidelines for
Presentation and Disclosure of Financial Statements of Issuer or Public Companies”, and Regulation No. X.K.2
Attachment to Decision of Chairman of Bapepam-LK No. Kep-346/BL/2011 dated 5 July 2011 regarding
“Submission Obligation of Periodic Financial Statements”.
2. Certain account in the consolidated financial statements for the year ended 31 December 2013 and the six-
month period ended 30 June 2013 have been reclassified to conform with the presentation of consolidated
financial statements for the six-month period ended 30 June 2014.
3. The consolidated financial statements for the six-month periods ended 30 June 2014 and 2013 and for the
year then ended 31 December 2013 and for periods/year then ended included financial statements of
subsidiaries, i.e. PT Adira Dinamika Multi Finance Tbk, PT Asuransi Adira Dinamika, and PT Adira Quantum
Multifinance.
4. The ultimate shareholder of Asia Financial (Indonesia) Pte. Ltd. (AFI) is Temasek Holding Pte. Ltd., an
investment holding company based in Singapore which is wholly owned by the Ministry of Finance of
Singapore.
As at 2 April 2012, the Bank has been informed by Fullerton Financial Holding Pte. Ltd. (FFH), that it has
entered into a contingent share purchase agreement with DBS Group Holdings (DBS) to sell the entire FFH
interest in the share capital of AFI to DBS. Currently, AFI holds approximately 67.37% of the total issued shares
of the Bank. This transaction is subject to the approvals, among others, of DBS shareholders and regulators,
including Bank Indonesia.

PT Bank Danamon Indonesia, Tbk Investor Newsletter – First Half and Second Quarter 2014 Results July 2014
Page 25 of 25
On June 3, 2013, the Bank has been informed by FFH that DBS and FFH has mutually agree to renew the
conditional share purchase agreement of the entire FFH interest in the share capital of AFI, which previously
expired at April 4, 2013 and June 2, 2013 changed to August 1, 2013.
On 31 July 2013, the Bank has been informed by FFH that the conditional share purchase agreement between
FFH and DBS to purchase AFI shares will be expired after the date of August 1, 2013, and will not be renewed,
and therefore the agreement is no longer valid after August 1, 2013.
5. Exchange rate as at 30 June 2014: USD 1 = Rp11,855; Exchange rate as at 31 December 2013: USD 1 =
Rp12,170.00 ; exchange rate as at 30 June 2013: USD 1 = Rp9,925.