highly selective determination of copper corrosion …highly selective determination of copper...
TRANSCRIPT

ANALYTICAL SCIENCES APRIL 2012, VOL. 28 323
1 Introduction
Copper is the metal that has been used longest by mankind. Besides the relatively high corrosion resistance, copper has characteristics of high electrical and thermal conductivities.
Therefore, copper and its alloys have been widely used to fabricate industrial products, coins, and artifacts. When copper is exposed to an air-containing moisture and pollutants, however, various corrosion products are formed on copper surfaces.1 It is generally known that cuprous oxide (Cu2O) forms at an early stage of the corrosion process. Upon further oxidation, a new
2012 © The Japan Society for Analytical Chemistry
† To whom correspondence should be addressed.E-mail: [email protected]; [email protected]
1 Introduction 3232 Reduction Order of Copper Oxides 3243 Effects of Electrolytes 3264 Effects of Scan Rate 3265 Analysis of Copper Sulfides 327
6 Analysis of Cu(OH)2 and Patina 3297 Growth Mechanism of Copper Oxides 3298 Conclusions 3309 References and Notes 330
Highly Selective Determination of Copper Corrosion Products by Voltammetric Reduction in a Strongly Alkaline Electrolyte
Shigeyoshi NAKAYAMA,*† Takenori NOTOYA,** and Toshiyuki OSAKAI***†
*AnalysisTechnologyResearchCenter,SumitomoElectricIndustriesLtd.,1-1-3Shimaya,Konohana,Osaka554–0024,Japan
**JapanCopperandBrassAssociation,1-10-10Ueno,Taitou,Tokyo110–0005,Japan***DepartmentofChemistry,GraduateSchoolofScience,KobeUniversity,Nada,Kobe657–8501,Japan
Until recently, there had been two conflicting views about the order of copper oxides (Cu2O and CuO) in their cathodic reduction with a neutral or weak alkaline electrolyte (typically 0.1 M KCl). In 2001, we successfully employed a strongly alkaline electrolyte (SAE; i.e., 6 M KOH + 1 M LiOH) to achieve a perfect separation of the reduction peaks of the two oxides. It was then found that the oxides were reduced in SAE according to a thermodynamic order, i.e., “CuO → Cu2O”, and also that the reduction of CuO occurred in one step. At an extremely slow scan rate of <0.2 mV s–1, however, CuO appears to be reduced in two steps via Cu2O. It has also been shown that the developed method with SAE can be applied to analysis of various corrosion products, including Cu2S, Cu(OH)2, and patinas. Use of the developed method has allowed researchers to clarify the mechanism of the atmospheric corrosion of copper.
(Received December 22, 2011; Accepted January 24, 2012; Published April 10, 2012)
Shigeyoshi NAKAYAMA obtained his MS degree in chemistry in 1986 from Tohoku University. After that, he started working at Sumitomo Electric Industries (SEI) Ltd. and has been engaged in the development
of technology for inorganic chemical analysis and electrochemical analysis of metal products and also in the provision of analysis services. In 2008, he was promoted to the present “manager” position in the Analysis Technology Research Center of SEI. In 2010, he, with the coauthors of this article, received the best paper award of the Japan Society of Corrosion Engineering.
Takenori NOTOYA was appointed to the position of Research Associate at Metallurgical Engineering in 1966 after finishing the graduate course in applied chemistry at Hokkaido University and was appointed
to the position of Senior Lecturer at the same university in 1994. He earned his doctor’s degree from Hokkaido University in 1972 and became a postdoctoral fellow at the University of British Columbia, Canada in 1972 – 1975. He received the Japan Copper Center Award in 1999 for elucidation of corrosion mechanisms of copper and its alloys and development of protection methods. He has been served as a technical adviser at Japan Copper and Brass Association since 2005.
Toshiyuki OSAKAI received his PhD degree in 1985 from Kyoto University under the supervision of Emeritus Prof. Mitsugi Senda. Two years later, he became Assistant Professor and then Senior Assistant Professor at the
College of Liberal Arts, Kobe University. In 1990, he received the JSAC award for young scientists. In 1992, he moved to the Department of Chemistry in the Faculty of Science at the same university, and he was promoted two years later to Associate Professor. His current research focuses on the electroanalytical chemistry at liquid/liquid and metal/solution interfaces.
Reviews

324 ANALYTICAL SCIENCES APRIL 2012, VOL. 28
top layer of cupric oxide (CuO) grows preferentially over the Cu2O layer.2,3 Eventually, corrosion products on copper change to a stable patina.1,4 In addition, copper sulfides, mainly cupric sulfide (Cu2S), are formed on copper surfaces in air containing H2S2,5–7 or in a solution containing S2– ions.8
Copper corrosion products often have a bad influence on industrial products. Tarnishing by oxidation frequently reduces the commercial value of copper products. Problems such as defects of wire bonding,9 stress corrosion cracking,10 and contact resistance of connectors11 have also been reported. On the other hand, copper oxides have been actively utilized for various purposes, such as adhesion of a copper product and another material,12 solar cells,13 and sealing of electronic packaging.14 For these purposes as well as for corrosion management, it is important to perform qualitative and quantitative analyses of different surface species on copper, which have different chemical properties.
For selective determination of corrosion products of copper, surface analytical techniques such as X-ray photoelectron spectroscopy (XPS),3,15–17 X-ray diffraction (XRD),6 and infrared reflection absorption spectroscopy (IRAS)18 have been extensively employed. These spectroscopic techniques are very useful for qualitative analysis, but are not necessarily adequate for quantitative analysis, whereas electrochemical techniques provide more reliable information on the “quantities” of corrosion products. Chronopotentiometry (CP) using a neutral or weak alkaline electrolyte such as 0.1 M KCl or 0.1 M Na2CO3 (M = mol dm–3) has been most frequently applied for quantitative analysis of copper oxides or cuprous sulfide (Cu2S). However, there were conflicting views regarding the reduction order of copper oxides.19,20 Miley21 and other authors22–25 claimed that the reduction of Cu2O first occurred, followed by the reduction of CuO. This view is the basis of the standard method26 proposed by the American Society for Testing and Materials (ASTM); however, no convincing evidence has been presented. On the other hand, several authors proposed that CuO was reduced prior to the reduction of Cu2O.27–31 Su and Marek30 proposed a two-step reaction mechanism in which the reduction of CuO to Cu2O occurs first, and the generated Cu2O and also the originally existing Cu2O are then reduced simultaneously. The reports claiming the two different reduction orders of copper oxides are listed in Table 1. CP was employed in all the reports shown in the table except for our study,32 in which double sweep cyclic voltammetry was employed. Linear sweep voltammetry (LSV) has also been frequently used for characterization of copper oxide films.17,33,34 Regardless of the electrochemical method employed, however, the signals obtained for reduction of Cu2O and CuO are generally unclear and have insufficient separation in a neutral or weak alkaline electrolyte (e.g., 0.1 M KCl). This seems to have been the
cause of the two conflicting views about the reduction order of the oxides.
In 2001, our group32 developed a potentially groundbreaking method in which a strongly alkaline electrolyte (i.e., 6 M KOH + 1 M LiOH; abbreviated as SAE) was used as the supporting electrolyte for voltammetric reduction of copper oxides. In contrast to conventional methods with a neutral or weak alkaline electrolyte, perfect separation of the reduction peaks of Cu2O and CuO was achieved. In SAE, CuO was firstly reduced to Cu in one step, followed by the reduction of Cu2O to Cu. In a succeeding study,35 we showed that the reduction order of Cu2O and CuO in 0.1 M KCl was basically the same as that in SAE, but the reductions of both oxides occurred almost simultaneously. This might have led to the different views listed above regarding the reduction order. In subsequent studies, we showed that the developed method could also be applied to the determination of copper hydroxide36 (Cu(OH)2) and sulfides37 (e.g., Cu2S). Thus, a new voltammetric method was developed for simultaneous determination of various corrosion products including Cu2O, CuO, Cu(OH)2, and Cu2S. This method was successfully applied to clarify the corrosion mechanism of copper under atmospheric conditions.38 In this article, we reviewed our previous papers on voltammetric study of copper corrosion. Some new results regarding the reduction mechanism of CuO and an application to the analysis of patinas are also reported.
2 Reduction Order of Copper Oxides
For the clarification of this issue, we have prepared three standard samples (i.e., Cu2O/Cu,35,39 CuO/Cu39 and CuO/Cu2O/Cu35), each of which has an almost constant thickness (~1 μm) of Cu2O and/or CuO layer(s) formed on metal Cu. To our knowledge, there have been only a few studies19,30 in which the reduction order of copper oxides was investigated by using standard samples. However, the previous standard samples were composed of a rather thin and not fully identified oxide layer. Figure 1 shows FIB (focused ion beam)/SIM (scanning ion microscopy) images of cross sections of our standard samples.35,39 As can be seen in the figure, all of the standard samples are comprised of ~1-μm-thick Cu2O and/or CuO layers.
Figure 2A shows current–potential curves obtained by LSV with SAE for the three standard samples. Here, the potential was swept in the cathodic direction from the rest potential around –0.5 V vs. Ag/AgCl (in 3 M NaCl)40 to the potential of hydrogen evolution. As clearly demonstrated in the figure, CuO is firstly reduced, prior to the reduction of Cu2O. As reported in our previous paper,35 the use of SAE in CP also achieves a clear separation of the potential plateaus for the reductions of CuO and Cu2O. It should be noted here that the LSV measurements were made without deaeration of the electrolyte, because the voltammograms were not entirely changed by deaeration. The reduction current of dissolved oxygen appears to be very low compared with the reduction currents of the copper oxides. On the basis of the results shown in Fig. 2A, it can be considered that each oxide is reduced according to:
Cu2O + H2O + 2e– → 2Cu + 2OH– (1)
CuO + H2O + 2e– → Cu + 2OH– (2)
Thus, CuO as well as Cu2O is reduced to metal Cu in one step. If CuO was reduced in two steps, i.e., via the intermediate Cu2O, a reduction peak for Cu2O would be observed in the voltammogram for CuO in panel (a) of Fig. 2A. From each
Table 1 List of reports claiming the two different reduction orders of copper oxides
Cu2O → CuO CuO → Cu2O
Miley21 (1937)Koizumi etal.22 (1976)Pops and Hennessy23 (1977)Krumbein etal.24 (1989)Rickett and Payer25 (1995)ASTM26 (2008)
Mills and Evans27 (1956)Booker and Salim28 (1972)Peide etal.29 (1983)Su and Marek30 (1994)Nakayama etal.32 (2001)a
Reid etal.31 (2008)
a. Only this study was performed using double sweep cyclic voltammetry. CP was employed in other reports.

ANALYTICAL SCIENCES APRIL 2012, VOL. 28 325
peak area (i.e., the quantity of electricity), the amount of Cu2O or CuO can be obtained using Faraday’s law.39 Furthermore, the average thickness of each oxide layer can be calculated by assuming that the density of each oxide layer is equal to the theoretical one.32 Thus, a highly selective determination of Cu2O and CuO can be performed using SAE. On the other hand, when 0.1 M KCl was used, no clear separation was found between the reduction peaks of Cu2O and CuO, as shown in Fig. 2B.
To determine which oxide is preferentially reduced in 0.1 M KCl, we employed XRD to examine the change in the oxide layers during the reduction of a CuO/Cu2O/Cu sample.35 Figure 3(b) shows the XRD patterns for the samples that were (1) not reduced and (2) – (4) partially reduced in 0.1 M KCl by interrupting the CP measurement at different times indicated by the arrows in Fig. 3(a). From the change in the XRD pattern, one can conclude that CuO is preferentially reduced even in 0.1 M KCl.
From such discussions, we predicted that the partial reduction of a CuO/Cu2O/Cu sample would provide a Cu/Cu2O/Cu sandwich structure.32 As predicted, we could obtain the
sandwich structure by a partial reduction in CP with 0.1 M KCl, as shown in Fig. 4.35 As is seen in the FIB/SIM image, the outer CuO layer of a CuO/Cu2O/Cu sample (as in Fig. 1C) was changed to metal Cu, but the intermediate Cu2O layer remained in the structure.
In the 1st edition41 of a data book published by the Japan Copper and Brass Association (JCBA), the reduction order in CP with 0.1 M KCl was incorrectly shown as “Cu2O → CuO”. In the 2nd edition,42 however, the reduction order has been corrected in accordance with our view. On the other hand, the CP method using 0.1 M KCl is standardized by ASTM for testing surface films on copper. Even in the latest edition of the standard,26 the reduction order is still “Cu2O → CuO” in the same manner as that claimed originally by Miley.21
In recent publications, we have described the recommended procedure43 and its instructions44 for voltammetric determination of copper oxides. The developed method has been successfully employed to show that the reddish-brown copper oxide called “hido”, which was developed more than 100 years ago for the decoration of a Japanese sword hilt and other artifacts, is composed of Cu2O.45
Fig. 1 FIB/SIM images of cross sections of (A) Cu2O/Cu,35 (B) CuO/Cu,39 and (C) CuO/Cu2O/Cu35 samples.
Fig. 2 Current–potential curves recorded by LSV for (a) CuO/Cu, (b) Cu2O/Cu, and (c) CuO/Cu2O/Cu samples. Measurement area: 1.0 cm2. Electrolyte solution: (A) SAE and (B) 0.1 M KCl. Scan rate: 1 mV s–1.

326 ANALYTICAL SCIENCES APRIL 2012, VOL. 28
3 Effects of Electrolytes
As described above, SAE has been found to be a very favorable electrolyte for the selective determination of Cu2O and CuO, compared with conventional electrolytes such as 0.1 M KCl. There are two principal factors related to the advantages of SAE: i.e., (1) Li+ ions and (2) high alkalinity.46
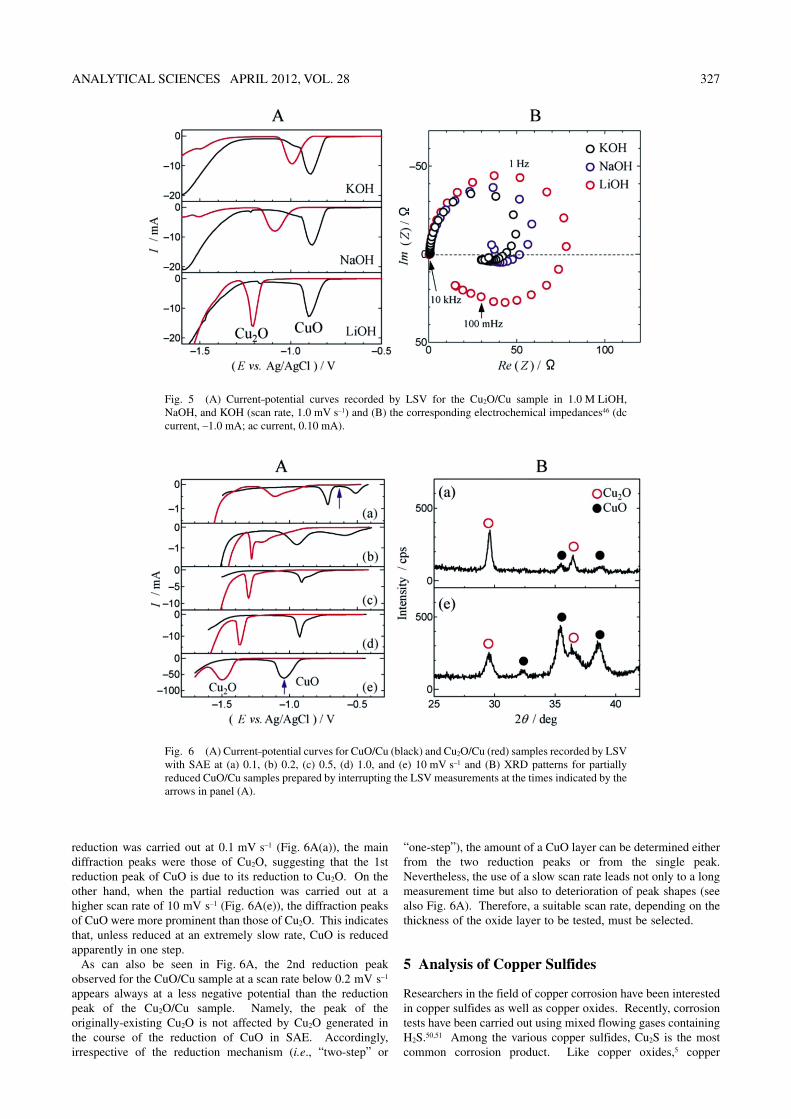
Figure 5A shows current–potential curves recorded by LSV for the Cu2O/Cu sample in 1.0 M of alkali hydroxides (LiOH, NaOH, and KOH). As can be seen in the figure, the reduction of Cu2O is thermodynamically easier in the order of KOH > NaOH > LiOH. A similar dependence has been observed when alkali chlorides (LiCl, NaCl, and KCl) are used as the supporting electrolytes.47 On the other hand, as also shown in Fig. 5A, the reduction potential of CuO is hardly affected by the kind of alkali hydroxide.
Figure 5B shows electrochemical impedances for the reduction of the Cu2O/Cu sample in the three different alkali hydroxides.46 In every case, a capacitive loop is observed in the upper part of the complex plane. The diameter of the capacitive loop corresponds to the charge-transfer resistance (Rct) for the reduction of Cu2O. The value of Rct increased with increase in the solution alkalinity.46 It should also be noted that Rct was the largest for LiOH and decreased in the order of LiOH > NaOH > KOH. Thus, it has been shown that Li+ ions have an increasing effect on Rct, i.e., an inhibitory effect on the reduction of Cu2O. On the other hand, the electrochemical impedance of CuO is hardly affected by the kind of alkali hydroxide. These results are in harmony with the LSV data shown in Fig. 5A. When LiOH is used, a sufficient separation of the reduction peaks for Cu2O and CuO can be achieved at concentrations of >0.2 M.
Also when KOH is used, the reduction potential of Cu2O is shifted to lower values with increase in KOH concentration.46 A sufficient separation between the two reduction potentials may be achieved for KOH concentrations of >6 M. However, a much higher concentration than that of LiOH is required for
KOH. It has thus been found that, though the solution alkalinity has a definitive effect, Li+ ions have a more specific effect on the reduction behavior of Cu2O. Taking into consideration the solubility of reagents, we have then proposed “6 M KOH + 1 M LiOH” as the best electrolyte for the selective determination of copper oxides.
The reason for the specific effect of Li+ ions is associated with the inductive loop, which is observed specifically in the lower part of the complex plane for LiOH (Fig. 5B). The inductive loop appearing at higher concentrations of LiOH (>0.2 M) and KOH (>6 M) suggests the existence of an intermediate species (a possible candidate being CuOH).48 The specific inhibitory effect of Li+ ions on Cu2O reduction might be explained by a stabilization of CuOH by Li+ ions.
4 Effects of Scan Rate
As described in Sect. 2 (Reduction Order of Copper Oxides), our previous study using LSV showed that CuO is reduced to metal Cu in one step. However, it has been generally considered that CuO is reduced to Cu in two steps via Cu2O.30,49 In a recent paper,49 Jones etal. claimed the two-step mechanism. In their LSV measurements with 6 M KOH, two successive peaks were obtained for the cathodic reduction of CuO. This is in contrast to our results shown in Fig. 2A(a), in which the voltammogram has only one reduction peak. However, the voltage scan rate employed by Jones etal.49 was extremely slow (0.02 mV s–1), whereas that employed in the experiment for which results are shown in Fig. 2A(a) was moderately slow but 50-times higher (1 mV s–1). We therefore examined the scan-rate dependence of the voltammetric behavior of CuO. Figure 6A shows current–potential curves recorded by LSV at 0.1 to 10 mV s–1 for Cu2O/Cu and CuO/Cu samples in SAE. When the scan rate is below 0.2 mV s–1, the CuO/Cu sample gives two reduction peaks of nearly equal areas, as reported by Jones etal.49 Figure 6B shows XRD patterns for the partially reduced CuO/Cu samples prepared by interrupting the LSV measurements at the times indicated by arrows shown in Fig. 6A. When partial
Fig. 3 (a) Potential–time curve for a CuO/Cu2O/Cu sample recorded by CP with 0.1 M KCl at –1.0 mA cm–2 and (b) XRD patterns for samples (1) not reduced and (2) – (4) partially reduced by interrupting the CP measurement at different times indicated by arrows in the upper panel (a).35
Fig. 4 FIB/SIM image for the Cu/Cu2O/Cu sandwich structure, which was obtained by a partial reduction of a CuO/Cu2O/Cu sample (as in Fig. 1C).
ANALYTICAL SCIENCES APRIL 2012, VOL. 28 327
reduction was carried out at 0.1 mV s–1 (Fig. 6A(a)), the main diffraction peaks were those of Cu2O, suggesting that the 1st reduction peak of CuO is due to its reduction to Cu2O. On the other hand, when the partial reduction was carried out at a higher scan rate of 10 mV s–1 (Fig. 6A(e)), the diffraction peaks of CuO were more prominent than those of Cu2O. This indicates that, unless reduced at an extremely slow rate, CuO is reduced apparently in one step.
As can also be seen in Fig. 6A, the 2nd reduction peak observed for the CuO/Cu sample at a scan rate below 0.2 mV s–1 appears always at a less negative potential than the reduction peak of the Cu2O/Cu sample. Namely, the peak of the originally-existing Cu2O is not affected by Cu2O generated in the course of the reduction of CuO in SAE. Accordingly, irrespective of the reduction mechanism (i.e., “two-step” or
“one-step”), the amount of a CuO layer can be determined either from the two reduction peaks or from the single peak. Nevertheless, the use of a slow scan rate leads not only to a long measurement time but also to deterioration of peak shapes (see also Fig. 6A). Therefore, a suitable scan rate, depending on the thickness of the oxide layer to be tested, must be selected.
5 Analysis of Copper Sulfides
Researchers in the field of copper corrosion have been interested in copper sulfides as well as copper oxides. Recently, corrosion tests have been carried out using mixed flowing gases containing H2S.50,51 Among the various copper sulfides, Cu2S is the most common corrosion product. Like copper oxides,5 copper
Fig. 5 (A) Current–potential curves recorded by LSV for the Cu2O/Cu sample in 1.0 M LiOH, NaOH, and KOH (scan rate, 1.0 mV s–1) and (B) the corresponding electrochemical impedances46 (dc current, –1.0 mA; ac current, 0.10 mA).
Fig. 6 (A) Current–potential curves for CuO/Cu (black) and Cu2O/Cu (red) samples recorded by LSV with SAE at (a) 0.1, (b) 0.2, (c) 0.5, (d) 1.0, and (e) 10 mV s–1 and (B) XRD patterns for partially reduced CuO/Cu samples prepared by interrupting the LSV measurements at the times indicated by the arrows in panel (A).

328 ANALYTICAL SCIENCES APRIL 2012, VOL. 28
sulfides cause various discolorations of copper surfaces, depending on the thickness of the sulfide layer.52
Figure 7 shows current–potential curves for commercially available powder samples of Cu2O, CuO, Cu2S, CuS, and Cu(OH)2, which were recorded using two different electrolytes: (A) SAE and (B) 0.1 M KCl. The powder samples were prepared by kneading the material into a carbon paste and sticking the paste onto a glassy carbon disk electrode.36 In the same manner as that for the above-shown plate samples (e.g., in Fig. 2), the reduction peaks of the powder Cu2O and CuO samples are more clearly separated in SAE than in 0.1 M KCl. In contrast, the reduction peaks of copper sulfides (Cu2S and CuS) are not greatly affected by the kind of electrolyte. In the voltammogram for the CuS powder sample in either electrolyte, two peaks of nearly equal peak areas were observed. This two-step reduction mechanism is different from the one-step mechanism of CuO under the same measurement conditions. In SAE, the peak of Cu2S is obtained at a higher potential than that of Cu2O. However, in neutral or weak alkaline electrolytes, Cu2O is reduced prior to Cu2S.5,7 The reduction order observed in Fig. 7B is the same as the one reported.5,7
As shown in Fig. 7A, Cu2S and Cu2O give their reduction peaks at close potentials in SAE. Therefore, it is a concern that the reduction peaks of the oxide and sulfide cannot be clearly separated in some cases, depending on the existing ratio of Cu2S and Cu2O. With reference to previous papers,53,54 we have examined in detail the voltammetric behaviors of Cu2S in SAE. Figure 8 (upper) shows a current–potential curve recorded by cyclic voltammetry (CV) for a copper plate corroded in 5 mM Na2S for 1 h.37 Three cathodic peaks were observed around –0.9, –1.15, and –1.25 V. Referring to the results for the powder samples (Fig. 7A), one can assign the peaks at –0.9 and –1.25 V to Cu(OH)2 and Cu2S, respectively. The peak at –1.15 V has been assigned to Cu9S5 based on XRD measurement.37 The lower voltammogram shown in Fig. 8 was recorded by a successive cyclic scan. In contrast to the case of oxides,32 reduction peaks of sulfides are still observed in the 2nd scan, though the peaks become smaller and move toward less negative potentials. This is because the sulfides are reproduced in the reverse (anodic) scan of the 1st voltamongram. As shown by arrows in Fig. 8, a weak anodic peak appears at –1.0 V in either
the 1st or 2nd scan. This peak is due to oxidation of the Cu substrate by S2– yielded from the sulfides in their cathodic reductions. Thus, the small anodic peak can be used for an indication of the existence of copper sulfide(s) in a test sample. Using the proposed method, one can determine a nanometer-level thickness of copper sulfide(s) separately from coexisting copper oxide(s). In practice, CuS, Cu9S5, and Cu2O have been successfully detected in an enamel copper wire exposed to the air.37 The proposed method is promising for the management of copper products.
Fig. 7 Current–potential curves recorded by LSV for powder samples. Electrolyte solutions: (A) SAE, (B) 0.1 M KCl. Scan rate: 10 mV s–1. Similar data were reported in Ref. 36.
Fig. 8 Current–potential curves recorded by CV for a copper plate corroded in 5 mM Na2S for 1 h at 25°C. The upper voltammogram was recorded with the 1st scan from the rest potential to –1.6 V and the reverse. The lower voltammogram was recorded with the 2nd successive scan. Electrolyte solution: SAE. Scan rate: 10 mV s–1. For arrows, see the text. Modified from Ref. 37.
ANALYTICAL SCIENCES APRIL 2012, VOL. 28 329
6 Analysis of Cu(OH)2 and Patina
So far, Cu(OH)2 has not been subjected to electrochemical detection by CP or LSV. It has been found that the LSV method using SAE enables detection of Cu(OH)2 separately from copper oxides and sulfides, as shown in Fig. 7A. In SAE, Cu(OH)2 gives its reduction peak at the most negative potential, around –0.9 V. In 0.1 M KCl (Fig. 7B), however, the reduction peak of Cu(OH)2 is obtained at a more negative potential, suggesting difficulty of reduction in a neutral solution.
“Patina” is the general term for “rusts of copper” produced by long-term exposure to air,1,4 and it refers to basic copper minerals, which include basic copper chlorides, sulfides, carbonates, and others. Basic copper sulfates are the main chemical species of the patinas on the Statue of Liberty in New York. The patina on the Great Buddha at Kamakura, which was made in 1252, is generally covered with brochantite, basic copper sulfate. Malachite, basic copper carbonate, was also detected with the brochantite, suggesting that a malachite patina originally formed and was partially transformed into brochantite by more recent environmental pollution, including increased sulfur dioxide in the atomosphere. Antlerite, another type of basic copper sulfate, was detected on the back and west-facing sides of the Buddha, while atacamite, basic copper chloride, was dominant in the south-facing side patina.55
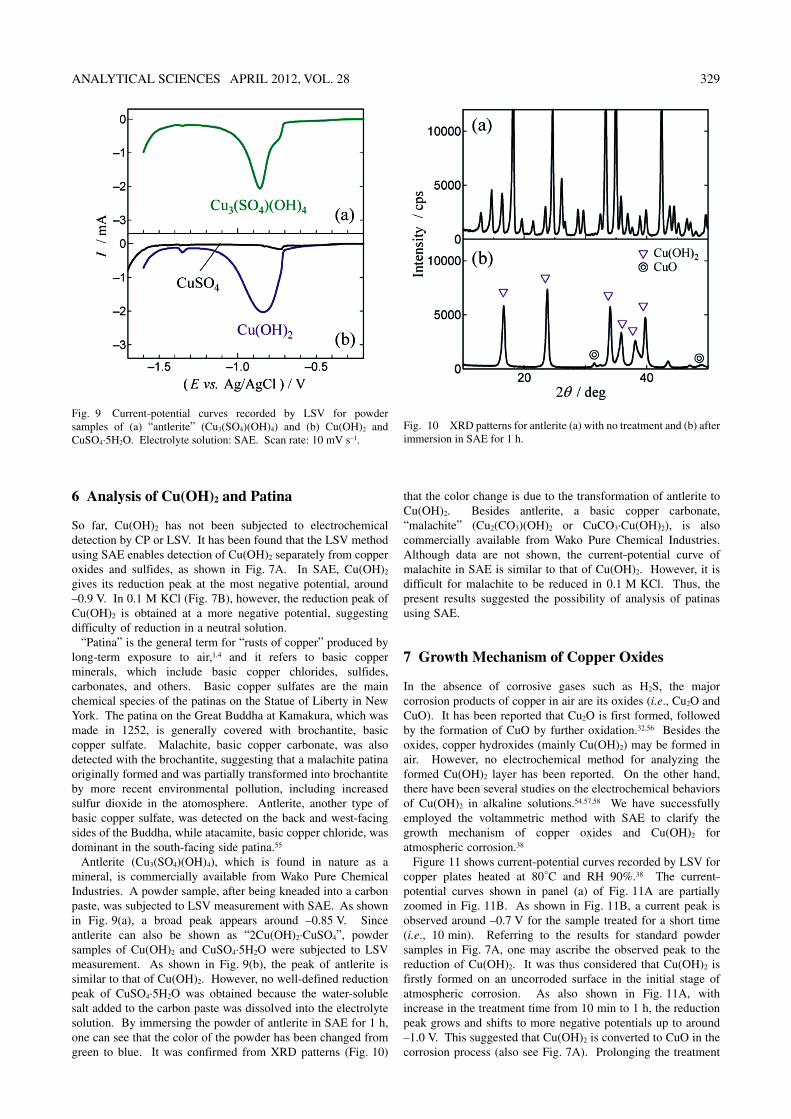
Antlerite (Cu3(SO4)(OH)4), which is found in nature as a mineral, is commercially available from Wako Pure Chemical Industries. A powder sample, after being kneaded into a carbon paste, was subjected to LSV measurement with SAE. As shown in Fig. 9(a), a broad peak appears around –0.85 V. Since antlerite can also be shown as “2Cu(OH)2·CuSO4”, powder samples of Cu(OH)2 and CuSO4·5H2O were subjected to LSV measurement. As shown in Fig. 9(b), the peak of antlerite is similar to that of Cu(OH)2. However, no well-defined reduction peak of CuSO4·5H2O was obtained because the water-soluble salt added to the carbon paste was dissolved into the electrolyte solution. By immersing the powder of antlerite in SAE for 1 h, one can see that the color of the powder has been changed from green to blue. It was confirmed from XRD patterns (Fig. 10)
that the color change is due to the transformation of antlerite to Cu(OH)2. Besides antlerite, a basic copper carbonate, “malachite” (Cu2(CO3)(OH)2 or CuCO3·Cu(OH)2), is also commercially available from Wako Pure Chemical Industries. Although data are not shown, the current–potential curve of malachite in SAE is similar to that of Cu(OH)2. However, it is difficult for malachite to be reduced in 0.1 M KCl. Thus, the present results suggested the possibility of analysis of patinas using SAE.
7 Growth Mechanism of Copper Oxides
In the absence of corrosive gases such as H2S, the major corrosion products of copper in air are its oxides (i.e., Cu2O and CuO). It has been reported that Cu2O is first formed, followed by the formation of CuO by further oxidation.32,56 Besides the oxides, copper hydroxides (mainly Cu(OH)2) may be formed in air. However, no electrochemical method for analyzing the formed Cu(OH)2 layer has been reported. On the other hand, there have been several studies on the electrochemical behaviors of Cu(OH)2 in alkaline solutions.54,57,58 We have successfully employed the voltammetric method with SAE to clarify the growth mechanism of copper oxides and Cu(OH)2 for atmospheric corrosion.38
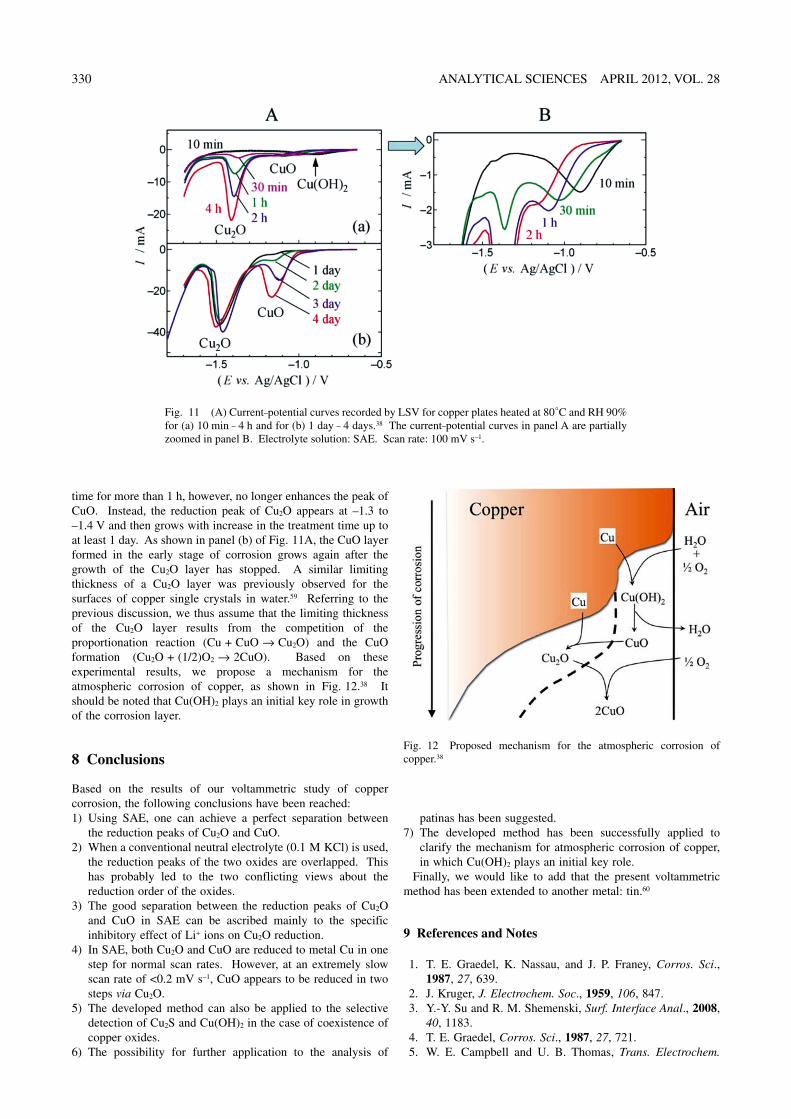
Figure 11 shows current–potential curves recorded by LSV for copper plates heated at 80°C and RH 90%.38 The current–potential curves shown in panel (a) of Fig. 11A are partially zoomed in Fig. 11B. As shown in Fig. 11B, a current peak is observed around –0.7 V for the sample treated for a short time (i.e., 10 min). Referring to the results for standard powder samples in Fig. 7A, one may ascribe the observed peak to the reduction of Cu(OH)2. It was thus considered that Cu(OH)2 is firstly formed on an uncorroded surface in the initial stage of atmospheric corrosion. As also shown in Fig. 11A, with increase in the treatment time from 10 min to 1 h, the reduction peak grows and shifts to more negative potentials up to around –1.0 V. This suggested that Cu(OH)2 is converted to CuO in the corrosion process (also see Fig. 7A). Prolonging the treatment
Fig. 9 Current–potential curves recorded by LSV for powder samples of (a) “antlerite” (Cu3(SO4)(OH)4) and (b) Cu(OH)2 and CuSO4·5H2O. Electrolyte solution: SAE. Scan rate: 10 mV s–1.
Fig. 10 XRD patterns for antlerite (a) with no treatment and (b) after immersion in SAE for 1 h.
330 ANALYTICAL SCIENCES APRIL 2012, VOL. 28
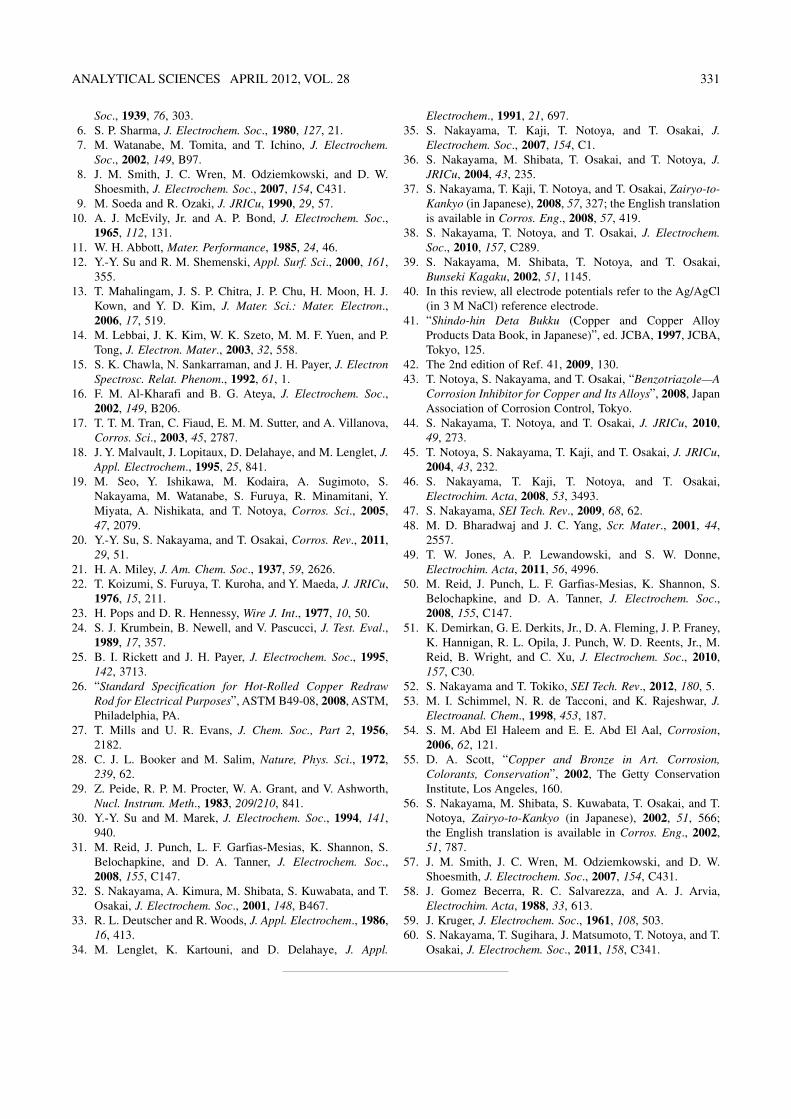
time for more than 1 h, however, no longer enhances the peak of CuO. Instead, the reduction peak of Cu2O appears at –1.3 to –1.4 V and then grows with increase in the treatment time up to at least 1 day. As shown in panel (b) of Fig. 11A, the CuO layer formed in the early stage of corrosion grows again after the growth of the Cu2O layer has stopped. A similar limiting thickness of a Cu2O layer was previously observed for the surfaces of copper single crystals in water.59 Referring to the previous discussion, we thus assume that the limiting thickness of the Cu2O layer results from the competition of the proportionation reaction (Cu + CuO → Cu2O) and the CuO formation (Cu2O + (1/2)O2 → 2CuO). Based on these experimental results, we propose a mechanism for the atmospheric corrosion of copper, as shown in Fig. 12.38 It should be noted that Cu(OH)2 plays an initial key role in growth of the corrosion layer.
8 Conclusions
Based on the results of our voltammetric study of copper corrosion, the following conclusions have been reached:1) Using SAE, one can achieve a perfect separation between
the reduction peaks of Cu2O and CuO.2) When a conventional neutral electrolyte (0.1 M KCl) is used,
the reduction peaks of the two oxides are overlapped. This has probably led to the two conflicting views about the reduction order of the oxides.
3) The good separation between the reduction peaks of Cu2O and CuO in SAE can be ascribed mainly to the specific inhibitory effect of Li+ ions on Cu2O reduction.
4) In SAE, both Cu2O and CuO are reduced to metal Cu in one step for normal scan rates. However, at an extremely slow scan rate of <0.2 mV s–1, CuO appears to be reduced in two steps via Cu2O.
5) The developed method can also be applied to the selective detection of Cu2S and Cu(OH)2 in the case of coexistence of copper oxides.
6) The possibility for further application to the analysis of
patinas has been suggested.7) The developed method has been successfully applied to
clarify the mechanism for atmospheric corrosion of copper, in which Cu(OH)2 plays an initial key role.
Finally, we would like to add that the present voltammetric method has been extended to another metal: tin.60
9 References and Notes
1. T. E. Graedel, K. Nassau, and J. P. Franey, Corros. Sci., 1987, 27, 639.
2. J. Kruger, J.Electrochem.Soc., 1959, 106, 847. 3. Y.-Y. Su and R. M. Shemenski, Surf.InterfaceAnal., 2008,
40, 1183. 4. T. E. Graedel, Corros.Sci., 1987, 27, 721. 5. W. E. Campbell and U. B. Thomas, Trans. Electrochem.
Fig. 11 (A) Current–potential curves recorded by LSV for copper plates heated at 80°C and RH 90% for (a) 10 min – 4 h and for (b) 1 day – 4 days.38 The current–potential curves in panel A are partially zoomed in panel B. Electrolyte solution: SAE. Scan rate: 100 mV s–1.
Fig. 12 Proposed mechanism for the atmospheric corrosion of copper.38
ANALYTICAL SCIENCES APRIL 2012, VOL. 28 331
Soc., 1939, 76, 303. 6. S. P. Sharma, J.Electrochem.Soc., 1980, 127, 21. 7. M. Watanabe, M. Tomita, and T. Ichino, J. Electrochem.
Soc., 2002, 149, B97. 8. J. M. Smith, J. C. Wren, M. Odziemkowski, and D. W.
Shoesmith, J.Electrochem.Soc., 2007, 154, C431. 9. M. Soeda and R. Ozaki, J.JRICu, 1990, 29, 57.10. A. J. McEvily, Jr. and A. P. Bond, J. Electrochem. Soc.,
1965, 112, 131.11. W. H. Abbott, Mater.Performance, 1985, 24, 46.12. Y.-Y. Su and R. M. Shemenski, Appl.Surf.Sci., 2000, 161,
355.13. T. Mahalingam, J. S. P. Chitra, J. P. Chu, H. Moon, H. J.
Kown, and Y. D. Kim, J. Mater. Sci.: Mater. Electron., 2006, 17, 519.
14. M. Lebbai, J. K. Kim, W. K. Szeto, M. M. F. Yuen, and P. Tong, J.Electron.Mater., 2003, 32, 558.
15. S. K. Chawla, N. Sankarraman, and J. H. Payer, J.ElectronSpectrosc.Relat.Phenom., 1992, 61, 1.
16. F. M. Al-Kharafi and B. G. Ateya, J. Electrochem. Soc., 2002, 149, B206.
17. T. T. M. Tran, C. Fiaud, E. M. M. Sutter, and A. Villanova, Corros.Sci., 2003, 45, 2787.
18. J. Y. Malvault, J. Lopitaux, D. Delahaye, and M. Lenglet, J.Appl.Electrochem., 1995, 25, 841.
19. M. Seo, Y. Ishikawa, M. Kodaira, A. Sugimoto, S. Nakayama, M. Watanabe, S. Furuya, R. Minamitani, Y. Miyata, A. Nishikata, and T. Notoya, Corros. Sci., 2005, 47, 2079.
20. Y.-Y. Su, S. Nakayama, and T. Osakai, Corros.Rev., 2011, 29, 51.
21. H. A. Miley, J.Am.Chem.Soc., 1937, 59, 2626.22. T. Koizumi, S. Furuya, T. Kuroha, and Y. Maeda, J.JRICu,
1976, 15, 211.23. H. Pops and D. R. Hennessy, WireJ.Int., 1977, 10, 50.24. S. J. Krumbein, B. Newell, and V. Pascucci, J.Test.Eval.,
1989, 17, 357.25. B. I. Rickett and J. H. Payer, J. Electrochem. Soc., 1995,
142, 3713.26. “Standard Specification for Hot-Rolled Copper Redraw
RodforElectricalPurposes”, ASTM B49-08, 2008, ASTM, Philadelphia, PA.
27. T. Mills and U. R. Evans, J. Chem. Soc., Part 2, 1956, 2182.
28. C. J. L. Booker and M. Salim, Nature, Phys. Sci., 1972, 239, 62.
29. Z. Peide, R. P. M. Procter, W. A. Grant, and V. Ashworth, Nucl.Instrum.Meth., 1983, 209/210, 841.
30. Y.-Y. Su and M. Marek, J. Electrochem. Soc., 1994, 141, 940.
31. M. Reid, J. Punch, L. F. Garfias-Mesias, K. Shannon, S. Belochapkine, and D. A. Tanner, J. Electrochem. Soc., 2008, 155, C147.
32. S. Nakayama, A. Kimura, M. Shibata, S. Kuwabata, and T. Osakai, J.Electrochem.Soc., 2001, 148, B467.
33. R. L. Deutscher and R. Woods, J.Appl.Electrochem., 1986, 16, 413.
34. M. Lenglet, K. Kartouni, and D. Delahaye, J. Appl.
Electrochem., 1991, 21, 697.35. S. Nakayama, T. Kaji, T. Notoya, and T. Osakai, J.
Electrochem.Soc., 2007, 154, C1.36. S. Nakayama, M. Shibata, T. Osakai, and T. Notoya, J.
JRICu, 2004, 43, 235.37. S. Nakayama, T. Kaji, T. Notoya, and T. Osakai, Zairyo-to-
Kankyo (in Japanese), 2008, 57, 327; the English translation is available in Corros.Eng., 2008, 57, 419.
38. S. Nakayama, T. Notoya, and T. Osakai, J. Electrochem.Soc., 2010, 157, C289.
39. S. Nakayama, M. Shibata, T. Notoya, and T. Osakai, BunsekiKagaku, 2002, 51, 1145.
40. In this review, all electrode potentials refer to the Ag/AgCl (in 3 M NaCl) reference electrode.
41. “Shindo-hin Deta Bukku (Copper and Copper Alloy Products Data Book, in Japanese)”, ed. JCBA, 1997, JCBA, Tokyo, 125.
42. The 2nd edition of Ref. 41, 2009, 130.43. T. Notoya, S. Nakayama, and T. Osakai, “Benzotriazole—A
CorrosionInhibitorforCopperandItsAlloys”, 2008, Japan Association of Corrosion Control, Tokyo.
44. S. Nakayama, T. Notoya, and T. Osakai, J. JRICu, 2010, 49, 273.
45. T. Notoya, S. Nakayama, T. Kaji, and T. Osakai, J.JRICu, 2004, 43, 232.
46. S. Nakayama, T. Kaji, T. Notoya, and T. Osakai, Electrochim.Acta, 2008, 53, 3493.
47. S. Nakayama, SEITech.Rev., 2009, 68, 62.48. M. D. Bharadwaj and J. C. Yang, Scr. Mater., 2001, 44,
2557.49. T. W. Jones, A. P. Lewandowski, and S. W. Donne,
Electrochim.Acta, 2011, 56, 4996.50. M. Reid, J. Punch, L. F. Garfias-Mesias, K. Shannon, S.
Belochapkine, and D. A. Tanner, J. Electrochem. Soc., 2008, 155, C147.
51. K. Demirkan, G. E. Derkits, Jr., D. A. Fleming, J. P. Franey, K. Hannigan, R. L. Opila, J. Punch, W. D. Reents, Jr., M. Reid, B. Wright, and C. Xu, J. Electrochem. Soc., 2010, 157, C30.
52. S. Nakayama and T. Tokiko, SEITech.Rev., 2012, 180, 5.53. M. I. Schimmel, N. R. de Tacconi, and K. Rajeshwar, J.
Electroanal.Chem., 1998, 453, 187.54. S. M. Abd El Haleem and E. E. Abd El Aal, Corrosion,
2006, 62, 121.55. D. A. Scott, “Copper and Bronze in Art. Corrosion,
Colorants, Conservation”, 2002, The Getty Conservation Institute, Los Angeles, 160.
56. S. Nakayama, M. Shibata, S. Kuwabata, T. Osakai, and T. Notoya, Zairyo-to-Kankyo (in Japanese), 2002, 51, 566; the English translation is available in Corros. Eng., 2002, 51, 787.
57. J. M. Smith, J. C. Wren, M. Odziemkowski, and D. W. Shoesmith, J.Electrochem.Soc., 2007, 154, C431.
58. J. Gomez Becerra, R. C. Salvarezza, and A. J. Arvia, Electrochim.Acta, 1988, 33, 613.
59. J. Kruger, J.Electrochem.Soc., 1961, 108, 503.60. S. Nakayama, T. Sugihara, J. Matsumoto, T. Notoya, and T.
Osakai, J.Electrochem.Soc., 2011, 158, C341.