highway loss data institute bulletin · highway loss data institute bulletin ... bmw x6 4d 1 0.4209...
TRANSCRIPT

INTRODUCTIONThis Highway Loss Data Institute (HLDI) bulletin provides an initial look at the effects of Volvo’s City Safety technology on insurancelosses. The loss experience for Volvo XC60s equipped with City Safety was compared with losses for comparable vehicles withoutthe system. Losses under property damage liability, bodily injury liability, and collision coverage were examined.
City Safety, a low-speed collision avoidance system, was released as standard equipment on the 2010 Volvo XC60, a midsize lux-ury SUV. The system was developed by Volvo to reduce low-speed front-to-rear crashes, which commonly occur in urban traffic,by assisting the driver in braking. According to a Volvo news release, 75 percent of all crashes occur at speeds up to 19 mph, andhalf of these occur in city traffic. The City Safety system has an infrared laser sensor built into the windshield that detects othervehicles traveling in the same direction up to 18 feet in front of the XC60. The system initially reacts to slowing or stopped vehi-cles by pre-charging the brakes. The vehicle will brake automatically if forward collision risk is detected and the driver does notreact in time, but only at travel speeds up to 19 mph. If the relative speed difference is less than 9 mph, a collision can be avoid-ed entirely. If the speed difference is between 9 and 19 mph, the XC60 speed will be reduced to lessen the collision severity. CitySafety is automatically activated when the vehicle ignition is turned on but can be manually deactivated by the driver.
When examining the magnitude of City Safety on insurance losses, it is important to consider that the system is not designed tomitigate all types of crashes and that many factors can limit the system’s ability to perform its intended function. City Safety worksequally well during the day and night, but fog, heavy rain, or snow may limit the ability of the system’s infrared laser to detect vehi-cles. If the sensor becomes blocked by dirt, ice, or snow, the driver is advised.
METHODSInsurance Data – Automobile insurance covers damages to vehicles and property as well as injuries to people involved in crash-es. Different insurance coverages pay for vehicle damage versus injuries, and different coverages may apply depending on who isat fault. The current study is based on property damage liability, bodily injury liability, and collision coverages. Data are suppliedto HLDI by its member companies.
Property damage liability coverage insures against physical damage that at-fault drivers cause to other people's vehicles and prop-erty in crashes. Bodily injury liability coverage insures against medical, hospital, and other expenses for injuries that at-fault driv-ers inflict on occupants of other vehicles or others on the road. In the current study, bodily injury liability losses were restricted todata from traditional tort states. Collision coverage insures against physical damage to an at-fault driver’s vehicle sustained in acrash with an object or other vehicle.
Analysis Methods – Loss data for the 2010 Volvo XC60 were compared with two control groups: other midsize luxury SUVs andother Volvo vehicles. Vehicle models with two- and four-wheel drive versions were combined to provide sufficient data for analysis.
Regression analysis was used to quantify the effect of City Safety while controlling for other covariates. The covariates included cal-endar year, model year, garaging state, vehicle density (number of registered vehicles per square mile), rated driver age, rated driv-er gender, marital status, deductible, and risk. Claim frequency was modeled using a Poisson distribution, whereas claim severity(average loss payment per claim) was modeled using a Gamma distribution. Both models used a logarithmic link function.Estimates for overall losses were derived from the claim frequency and claim severity models.
Vehicle series was included as a variable in the regression models, with the Volvo XC60 assigned as the reference group. The modelproduced estimates for each series' losses relative to the XC60. When predicted losses were calculated, the XC60's value was pos-tulated to be equal to the actual losses, whereas for any other series the losses were calculated by multiplying the XC60’s value bythe relative estimate obtained from the regression. For example, the actual property damage liability claim frequency for the VolvoXC60 equaled 2.2 claims per 100 insured vehicle years. The model estimated that the claim frequency for the Volvo XC70 wouldbe 9.6 percent higher than that for the Volvo XC60 if these vehicles had the same distribution of drivers and garaging locations.Therefore, the comparable estimate for the Volvo XC70 property damage liability claim frequency was calculated as 2.2 x 1.096= 2.4 claims per 100 insured vehicle years.
VOL. 28, NO. 6 JUNE 2011
Highway Loss Data Institute BulletinVolvo City Safety Loss Experience – Initial Results

Additionally, the estimated losses for all control vehicles (i.e., all vehicle series in the analysis except for the Volvo XC60)were calculated as the weighted average of the estimates for the individual vehicle series included. The weights in theaverage were proportional to the inverse variance of the respective estimates, meaning that the estimates with high vari-ance (those with large confidence intervals, typically due to little exposure and/or claims) contributed less than estimateswith low variance (those with small confidence intervals).
Subject Vehicles – The XC60 was one of the first model year 2010 vehicles offered for sale in the United States. Sales ofthe vehicle began in February 2009. Consequently, the control population included Volvo vehicles and midsize luxurySUVs from both model years 2009 and 2010. However, only calendar years 2009 and 2010 were included. The loss expe-rience of the model year 2009 vehicles in calendar year 2008 were excluded because no XC60s were on the road dur-ing this time period.
RESULTSSummary results of the regression analysis for property damage liability claim frequencies using a Poisson distribution arelisted in Table 1. Results for all independent variables in the model had p-values less than 0.05, indicating their effectson claim frequency were statistically significant. Detailed results of the regression analysis using property damage liabil-ity claim frequency as the dependent variable are listed in Table 2. The table shows estimates and significance levels forthe individual values of the categorical variables. The intercept outlines losses for the reference (baseline) categories: theestimate corresponds to the claim frequency for a 2010 Volvo XC60, garaged in a high vehicle density area in Texas, anddriven by a married female age 40-49 with standard risk. The remaining estimates are in the form of multiples, or ratiosrelative to the reference categories. In an effort to condense the regression results, Table 2 also includes an abbreviated listof results by state. Only states with the five highest and five lowest effects are listed, along with the comparison state of Texas.Detailed results for all states are listed in the Appendix.
Calendar Year 1 7.16 0.0075Vehicle Make and Series 22 151.2 <0.0001State 50 270.42 <0.0001Registered Vehicle Density 6 209.49 <0.0001Rated Driver Age 10 172.87 <0.0001Rated Driver Gender 2 29.42 <0.0001Rated Driver Marital Status 2 74.74 <0.0001Risk 1 58.62 <0.0001
TABLE 1 SUMMARY RESULTS OF LINEAR REGRESSION ANALYSIS OFPROPERTY DAMAGE LIABILITY CLAIM FREQUENCIES
DEGREES OF FREEDOM CHI-SQUARE P-VALUE
INTERCEPT 1 -9.4684 0.0700 -9.6056 -9.3312 18296.3 <0.0001CALENDAR YEAR2009 1 0.0480 4.9% 0.0179 0.0128 0.0831 7.16 0.00752010 0 0 0 0 0 0
VEHICLE MAKE AND SERIESAcura MDX 4D 1 0.3084 36.1% 0.0671 0.1769 0.4400 21.11 <0.0001Acura RDX 4D 1 0.1853 20.4% 0.0763 0.0357 0.3349 5.9 0.0152Acura ZDX 4D 1 0.3993 49.1% 0.2176 -0.0273 0.8259 3.37 0.0666Audi Q5 QUATTRO 4D 1 0.1347 14.4% 0.0773 -0.0168 0.2862 3.04 0.0813BMW X3 4D 1 0.1388 14.9% 0.0949 -0.0473 0.3249 2.14 0.1437BMW X5 4D 1 0.4846 62.4% 0.0680 0.3514 0.6177 50.85 <0.0001BMW X6 4D 1 0.4209 52.3% 0.0977 0.2295 0.6124 18.57 <0.0001BMW X6 HYBRID 4D 1 0.0082 0.8% 1.0020 -1.9556 1.9719 0 0.9935Cadillac SRX 4D 1 0.2943 34.2% 0.0721 0.1531 0.4355 16.68 <0.0001Infiniti EX35 4D 1 0.0055 0.6% 0.1062 -0.2026 0.2136 0 0.9587Infiniti FX35 4D 1 0.3742 45.4% 0.0755 0.2263 0.5221 24.59 <0.0001
DEGREES OF STANDARD WALD 95% PARAMETER FREEDOM ESTIMATE EFFECT ERROR CONFIDENCE LIMITS CHI-SQUARE P-VALUE
TABLE 2 DETAILED RESULTS OF LINEAR REGRESSION ANALYSIS OF PROPERTY DAMAGE LIABILITY CLAIM FREQUENCIES

Infiniti FX50 4D 1 0.2224 24.9% 0.1632 -0.0974 0.5423 1.86 0.1729Land Rover LR2 4D 1 0.6382 89.3% 0.0965 0.4491 0.8274 43.73 <0.0001Lexus RX 350 4D 1 0.2971 34.6% 0.0638 0.1721 0.4221 21.7 <0.0001Lexus RX 450H HYBRID 4D 1 0.3507 42.0% 0.0826 0.1889 0.5125 18.04 <0.0001Lincoln MKT 4D 1 0.1549 16.8% 0.1342 -0.1082 0.4180 1.33 0.2485Lincoln MKX 4D 1 0.3677 44.4% 0.0756 0.2196 0.5158 23.68 <0.0001Mercedes Benz GLK CLASS 4D 1 0.2340 26.4% 0.0720 0.0928 0.3752 10.55 0.0012Mercedes Benz M CLASS 4D 1 0.2707 31.1% 0.0682 0.1370 0.4044 15.75 <0.0001Mercedes Benz M CLASS HYBRID 4D 1 -0.2721 -23.8% 0.4130 -1.0815 0.5374 0.43 0.510Saab 9-7X 4D 1 0.4560 57.8% 0.1434 0.1750 0.7370 10.12 0.0015Volvo XC90 4D 1 0.4243 52.9% 0.0763 0.2748 0.5738 30.94 <0.0001Volvo XC60 4D 0 0 0 0 0 0
STATEWyoming 1 -2.0656 -87.3% 0.9922 -4.0102 -0.1209 4.33 0.0374Michigan 1 -1.4984 -77.7% 0.1153 -1.7245 -1.2723 168.75 <0.0001Idaho 1 -0.7537 -52.9% 0.3553 -1.4501 -0.0573 4.5 0.0339Delaware 1 -0.4888 -38.7% 0.1882 -0.8577 -0.1200 6.75 0.0094Maine 1 -0.4282 -34.8% 0.3181 -1.0517 0.1952 1.81 0.1782Rhode Island 1 0.0696 7.2% 0.1297 -0.1845 0.3237 0.29 0.5913South Dakota 1 0.1029 10.8% 0.3568 -0.5963 0.8022 0.08 0.7729DC 1 0.1467 15.8% 0.1332 -0.1143 0.4077 1.21 0.2706West Virginia 1 0.1926 21.2% 0.1525 -0.1063 0.4915 1.59 0.2066North Dakota 1 0.6982 101.0% 0.3196 0.0718 1.3246 4.77 0.0289Texas 0 0 0 0 0 0
REGISTERED VEHICLE DENSITYUnknown 1 -0.1622 -15.0% 0.708 -1.5499 1.2254 0.05 0.8188<50 1 -0.5654 -43.2% 0.0589 -0.6807 -0.4500 92.29 <0.000150-99 1 -0.4151 -34.0% 0.0451 -0.5036 -0.3266 84.55 <0.0001100-249 1 -0.3188 -27.3% 0.0332 -0.3839 -0.2538 92.21 <0.0001250-499 1 -0.2282 -20.4% 0.0271 -0.2813 -0.1752 71.07 <0.0001500-999 1 -0.1665 -15.3% 0.0274 -0.2202 -0.1128 36.96 <0.00011,000+ 0 0 0 0 0 0
RATED DRIVER AGEUnknown 1 -0.0364 -3.6% 0.0469 -0.1284 0.0556 0.6 0.438115-19 1 0.3871 47.3% 0.0705 0.2489 0.5254 30.13 <0.000120-24 1 0.1264 13.5% 0.0595 0.0098 0.2429 4.51 0.033625-29 1 0.0762 7.9% 0.0445 -0.0110 0.1633 2.94 0.086730-39 1 0.0270 2.7% 0.0255 -0.0230 0.0771 1.12 0.290050-59 1 -0.1400 -13.1% 0.0255 -0.1900 -0.0899 30.02 <0.000160-64 1 -0.0860 -8.2% 0.0324 -0.1496 -0.0225 7.04 0.008065-69 1 0.0123 1.2% 0.0361 -0.0586 0.0831 0.12 0.733970-74 1 0.1526 16.5% 0.0431 0.0683 0.2370 12.57 0.000475+ 1 0.2911 33.8% 0.0441 0.2048 0.3774 43.66 <0.000140-49 0 0 0 0 0 0
RATED DRIVER GENDERMale 1 -0.0894 -8.6% 0.0204 -0.1294 -0.0495 19.27 <0.0001Unknown 1 -0.1861 -17.0% 0.0484 -0.2810 -0.0912 14.78 0.0001Female 0 0 0 0 0 0
RATED DRIVER MARITAL STATUSSingle 1 0.1890 20.8% 0.0241 0.1417 0.2363 61.44 <0.0001Unknown 1 0.2208 24.7% 0.0471 0.1284 0.3132 21.95 <0.0001Married 0 0 0 0 0 0
RISKNonstandard 1 0.2035 22.6% 0.0266 0.1514 0.2555 58.62 <0.0001Standard 0 0 0 0 0 0
DEGREES OF STANDARD WALD 95% PARAMETER FREEDOM ESTIMATE EFFECT ERROR CONFIDENCE LIMITS CHI-SQUARE P-VALUE
TABLE 2 DETAILED RESULTS OF LINEAR REGRESSION ANALYSIS OF PROPERTY DAMAGE LIABILITY CLAIM FREQUENCIES (CONT’D)

5.0
4.0
3.0
Clai
ms p
er 1
00 in
sure
d ve
hicl
e ye
ars
2.0
1.0
All Othe
rs
FIGURE 1 PROPERTY DAMAGE LIABILITY CLAIM FREQUENCIES FOR 2010 VOLVO XC60 WITH CITY SAFETY VS. OTHER 2009-10 MIDSIZE LUXURY SUVS
Property damage liability claim frequencies (measured in claims per 100 insured vehicle years) were calculated for the2010 Volvo XC60 equipped with City Safety and compared with claim frequencies for other 2009-10 midsize luxurySUVs and for other Volvo vehicles without the system. Results for the XC60 were based on 260 claims and 11,641 insuredvehicle years. Figure 1 shows the property damage liability claim frequency for the 2010 Volvo XC60 compared withthose for other midsize luxury SUVs. The estimated claim frequency for the Volvo XC60 was 27 percent lower than thatfor all other midsize luxury SUVs combined. At the 95 percent confidence level, the range for this estimate was 24 to 29percent. Compared with individual vehicle series in the control group, only the Mercedes M class hybrid had a lowerestimated claim frequency. However, the difference between the estimates for the Mercedes M class hybrid and VolvoXC60 did not reach statistical significance. Note that the vertical I-bars for each comparison group are the 95 percentconfidence limits for the comparison of that group with the XC60, not the 95 percent confidence interval for that group'sfrequency estimate.
Figure 2 shows the property damage liability claim frequency for the 2010 Volvo XC60 compared with those for otherVolvo vehicles. The estimated claim frequency for the Volvo XC60 (2.2 claims per 100 insured vehicle years) was 19 per-cent lower than that for all other Volvos combined (2.8 claims per 100 insured vehicle years). At the 95 percent confidencelevel, the range for this estimate was 14 to 24 percent. Compared with individual vehicle series, only the C70, a convert-ible, had a lower estimated claim frequency. The difference between the estimates for the XC60 and C70 did not reach sta-tistical significance. Furthermore, it is likely that because the C70 is a convertible, it has fewer annual miles driven, whichleads to lower claim frequencies. It also is interesting to note that the XC60 did significantly better than the only other SUVfrom Volvo, the XC90, which had the highest estimated claim frequency (3.5 claims per 100 insured vehicle years).

Summary results of the regression analysis for property damage liability claim severities using a Gamma distribution arelisted in Table 3. Estimates for most independent variables in the model had p-values less than 0.05, indicating their effectson claim severity were statistically significant. Estimates for vehicle density and risk had p-values slightly above 0.05.Detailed results of the regression analysis using property damage liability claim severity as the dependent variable are list-ed in Table 4. The table shows estimates and significance levels for the individual values of the categorical variables. Theintercept outlines losses for the reference (baseline) categories: the estimate corresponds to the claim severity for a 2010Volvo XC60, garaged in a high vehicle density area in Texas, and driven by a married female age 40-49 with standardrisk. The remaining estimates are in the form of multiples, or ratios relative to the reference categories. In an effort to con-dense the regression results, Table 4 also includes an abbreviated list of results by state. Only states with the five highest andfive lowest effects are listed, along with the comparison state of Texas. Detailed results for all states are listed in the Appendix.
3.5
4.0
3.0
2.5
2.0
1.0
1.5
0.5
XC60 XC90 S40 V70 V50 S60 S80 C30 XC70 C70 All Others
Clai
ms p
er 1
00 in
sure
d ve
hicl
e ye
ars
FIGURE 2 PROPERTY DAMAGE LIABILITY CLAIM FREQUENCIES FOR 2010 VOLVO XC60 WITH CITY SAFETY VS. OTHER 2009-10 VOLVO VEHICLES
Calendar Year 1 28.04 <0.0001Vehicle Make and Series 22 64.01 <0.0001State 50 292.76 <0.0001Registered Vehicle Density 6 12.28 0.0560Rated Driver Age 10 25.39 0.0047Rated Driver Gender 2 23.37 <0.0001Rated Driver Marital Status 2 7.66 0.0217Risk 1 3.79 0.0514
TABLE 3 SUMMARY RESULTS OF LINEAR REGRESSION ANALYSIS OFPROPERTY DAMAGE LIABILITY CLAIM SEVERITIES
DEGREES OF FREEDOM CHI-SQUARE P-VALUE

INTERCEPT 1 7.9923 0.0645 7.8658 8.1187 15347.6 <0.0001CALENDAR YEAR2009 1 0.0873 9.1% 0.0165 0.0550 0.1196 28.04 <0.00012010 0 0 0 0 0 0
VEHICLE MAKE AND SERIESAcura MDX 4D 1 -0.2018 -18.3% 0.0617 -0.3228 -0.0808 10.69 0.0011Acura RDX 4D 1 -0.1877 -17.1% 0.0700 -0.3248 -0.0506 7.2 0.0073Acura ZDX 4D 1 0.1543 16.7% 0.2031 -0.2437 0.5523 0.58 0.4473Audi Q5 QUATTRO 4D 1 -0.0392 -3.8% 0.0709 -0.1781 0.0997 0.31 0.5800BMW X3 4D 1 -0.0109 -1.1% 0.0874 -0.1822 0.1603 0.02 0.9005BMW X5 4D 1 -0.0786 -7.6% 0.0624 -0.2009 0.0437 1.59 0.2077BMW X6 4D 1 -0.0645 -6.2% 0.0896 -0.2401 0.1111 0.52 0.4716BMW X6 HYBRID 4D 1 -0.0196 -1.9% 0.9136 -1.8102 1.7711 0 0.9829Cadillac SRX 4D 1 -0.1304 -12.2% 0.0661 -0.2599 -0.0008 3.89 0.0486Infiniti EX35 4D 1 -0.1318 -12.3% 0.0973 -0.3225 0.0589 1.83 0.1756Infiniti FX35 4D 1 -0.1155 -10.9% 0.0692 -0.2511 0.0200 2.79 0.0949Infiniti FX50 4D 1 0.2699 31.0% 0.1497 -0.0234 0.5633 3.25 0.0713Land Rover LR2 4D 1 0.0971 10.2% 0.0882 -0.0759 0.2700 1.21 0.2713Lexus RX 350 4D 1 -0.0978 -9.3% 0.0584 -0.2123 0.0168 2.8 0.0944Lexus RX 450H HYBRID 4D 1 -0.1255 -11.8% 0.0756 -0.2737 0.0228 2.75 0.0972Lincoln MKT 4D 1 -0.2495 -22.1% 0.1231 -0.4908 -0.0083 4.11 0.0426Lincoln MKX 4D 1 -0.0391 -3.8% 0.0692 -0.1748 0.0965 0.32 0.5717Mercedes Benz GLK CLASS 4D 1 -0.0286 -2.8% 0.0663 -0.1585 0.1013 0.19 0.6659Mercedes Benz M CLASS 4D 1 -0.1088 -10.3% 0.0625 -0.2314 0.0137 3.03 0.0818Mercedes Benz M CLASS HYBRID 4D 1 -0.0456 -4.5% 0.3773 -0.7851 0.6939 0.01 0.9038Saab 9-7X 4D 1 0.0220 2.2% 0.1312 -0.2352 0.2791 0.03 0.8670Volvo XC90 4D 1 -0.1871 -17.1% 0.0701 -0.3245 -0.0497 7.12 0.0076Volvo XC60 4D 0 0 0 0 0 0
STATEMontana 1 -0.7821 -54.3% 0.3274 -1.4238 -0.1404 5.71 0.0169Michigan 1 -0.7671 -53.6% 0.1046 -0.9722 -0.5621 53.78 <.0001North Dakota 1 -0.5712 -43.5% 0.2914 -1.1422 -0.0001 3.84 0.0500Hawaii 1 -0.5323 -41.3% 0.1335 -0.7940 -0.2705 15.88 <0.0001New Hampshire 1 -0.4185 -34.2% 0.1371 -0.6872 -0.1498 9.32 0.0023Connecticut 1 0.1299 13.9% 0.0580 0.0162 0.2436 5.02 0.0251Iowa 1 0.1344 14.4% 0.1525 -0.1645 0.4332 0.78 0.3782Oklahoma 1 0.2904 33.7% 0.0976 0.0991 0.4817 8.85 0.0029Arkansas 1 0.3024 35.3% 0.1320 0.0437 0.5611 5.25 0.0220Delaware 1 0.5303 69.9% 0.1718 0.1936 0.8670 9.53 0.0020Texas 0 0 0 0 0 0
REGISTERED VEHICLE DENSITYUnknown 1 -1.0077 -63.5% 0.6467 -2.2751 0.2598 2.43 0.1192<50 1 -0.0622 -6.0% 0.0542 -0.1684 0.044 1.32 0.250850-99 1 -0.1053 -10.0% 0.0416 -0.1870 -0.0237 6.4 0.0114100-249 1 -0.0257 -2.5% 0.0308 -0.0860 0.0346 0.7 0.4043250-499 1 -0.0145 -1.4% 0.0255 -0.0644 0.0354 0.32 0.5696500-999 1 0.0218 2.2% 0.0257 -0.0285 0.0721 0.72 0.39541,000+ 0 0 0 0 0 0
RATED DRIVER AGEUnknown 1 0.0395 4.0% 0.0428 -0.0444 0.1233 0.85 0.356615-19 1 0.1705 18.6% 0.0646 0.0439 0.2972 6.97 0.008320-24 1 0.1043 11.0% 0.0548 -0.0031 0.2116 3.63 0.056925-29 1 0.1148 12.2% 0.0409 0.0347 0.1949 7.89 0.0050
DEGREES OF STANDARD WALD 95% PARAMETER FREEDOM ESTIMATE EFFECT ERROR CONFIDENCE LIMITS CHI-SQUARE P-VALUE
TABLE 4 DETAILED RESULTS OF LINEAR REGRESSION ANALYSIS OF PROPERTY DAMAGE LIABILITY CLAIM SEVERITIES

30-39 1 -0.0174 -1.7% 0.0234 -0.0632 0.0284 0.56 0.455950-59 1 0.0075 0.8% 0.0234 -0.0384 0.0534 0.1 0.748760-64 1 -0.0463 -4.5% 0.0297 -0.1045 0.0119 2.43 0.119165-69 1 -0.0233 -2.3% 0.0331 -0.0881 0.0414 0.5 0.480170-74 1 0.0120 1.2% 0.0394 -0.0651 0.0891 0.09 0.760475+ 1 0.0204 2.1% 0.0406 -0.0592 0.1000 0.25 0.615640-49 0 0 0 0 0 0
RATED DRIVER GENDERMale 1 0.0695 7.2% 0.0186 0.0331 0.1060 13.97 0.0002Unknown 1 -0.1077 -10.2% 0.0439 -0.1938 -0.0217 6.02 0.0142Female 0 0 0 0 0 0
RATED DRIVER MARITAL STATUSSingle 1 0.0413 4.2% 0.0220 -0.0019 0.0845 3.51 0.0609Unknown 1 0.0980 10.3% 0.0428 0.0140 0.1819 5.23 0.0222Married 0 0 0 0 0 0
RISKNonstandard 1 -0.0469 -4.6% 0.0241 -0.0940 0.0003 3.79 0.0514Standard 0 0 0 0 0 0
DEGREES OF STANDARD WALD 95% PARAMETER FREEDOM ESTIMATE EFFECT ERROR CONFIDENCE LIMITS CHI-SQUARE P-VALUE
TABLE 4 DETAILED RESULTS OF LINEAR REGRESSION ANALYSIS OF PROPERTY DAMAGE LIABILITY CLAIM SEVERITIES (CONT’D)
Property damage liability claim severities (measured in average loss payments per claim) were calculated for the 2010Volvo XC60 equipped with City Safety and compared with claim severities for other 2009-10 midsize luxury SUVs andfor other Volvo vehicles without the system. Figure 3 shows the property damage liability claim severity for the 2010 VolvoXC60 compared with those for other midsize luxury SUVs. The estimated claim severity for the Volvo XC60 was 10 per-cent higher than that for all other midsize luxury SUVs combined ($2,789 per claim). At the 95 percent confidence level,this estimated increase fell between 13 and 6 percent. Compared with individual vehicle series, the XC60 outperformedonly four vehicles.
$6,000
$5,000
$4,000
$2,000
$3,000
Aver
age
loss
pay
men
t per
cla
im
$1,000
All Othe
rs
FIGURE 3 PROPERTY DAMAGE LIABILITY CLAIM SEVERITIES FOR 2010 VOLVO XC60 WITH CITY SAFETY VS. OTHER 2009-10 MIDSIZE LUXURY SUVS

TABLE 5 ESTIMATED PROPERTY DAMAGE LIABILITY CLAIM FREQUENCIES BY CLAIM SEVERITYRANGE FOR COMPARISON GROUPS RELATIVE TO VOLVO XC60
STANDARD LOWER UPPERCONTROL GROUP CLAIM SIZE ESTIMATE ERROR EFFECT BOUND BOUND
Midsize Luxury SUVs <$1,500 0.3015 0.0277 35% 28% 43%
Midsize Luxury SUVs $1,500-$6,999 0.3528 0.0276 42% 35% 50%
Midsize Luxury SUVs $7,000+ 0.1277 0.0629 14% 0% 29%
Volvos <$1,500 0.3318 0.0488 39% 27% 53%
Volvos $1,500-$6,999 0.1671 0.0516 18% 7% 31%
Volvos $7,000+ -0.1844 0.1270 -17% -35% 7%
An examination of claim frequency by claim size explains this result. Table 5 summarizes results of several regressionanalyses conducted for property damage liability coverage. The table includes an analysis of claim frequencies for theXC60 by claim size compared with those for other midsize luxury SUVs and other Volvo vehicles. Detailed results are list-ed in the Appendix. The estimated effects indicate that the frequency of low-severity claims was much higher for other mid-size SUVs and other Volvos, compared with the XC60, whereas the frequency of high-severity claims was about the same.
$3,000
$3,500
Aver
age
loss
pay
men
t per
cla
im
$2,500
$2,000
$1,000
$1,500
$500
XC60 S60 C70 XC70 S40 XC90 C30 S80 V70 V50 All Others
FIGURE 4 PROPERTY DAMAGE LIABILITY CLAIM SEVERITIES FOR 2010 VOLVO XC60 WITH CITY SAFETY VS. OTHER 2009-10 VOLVO VEHICLES
Figure 4 shows the property damage liability claim severity for the 2010 Volvo XC60 compared with those for other Volvovehicles. The estimated claim severity for the Volvo XC60 was 27 percent higher than that for all other Volvos combined.At the 95 percent confidence level, this estimated increase fell between 35 and 19 percent. Additionally, the claim sever-ity for the XC60 was higher than that for each individual Volvo vehicle.

Figure 5 shows these results for the XC60 compared with those for other midsize luxury SUVs. The property damage liabil-ity claim frequency for the XC60 was lower than those for other midsize luxury SUVs at all claim amounts. The differencein claim frequencies was much greater at the two lowest claim severity ranges. The difference at the highest claim severityrange was the smallest but was statistically significant. This finding is consistent with expectations based on what is knownabout the City Safety system. It is designed to eliminate, or at least mitigate, low-speed and low-severity front-to-rear crash-es. By removing many of the lowest cost claims, City Safety shifted the distribution of claim severity to a higher mean.
Volvo XC60
All Other Midsize Luxury SUVs
1.2
1.4
1.0
0.8
0.4
0.6
0.2
Low <$1,500 Mid $1,500-$6,999 High $7,000+
Clai
ms p
er 1
00 in
sure
d ve
hicl
e ye
ars
FIGURE 5 PROPERTY DAMAGE LIABILITY CLAIM FREQUENCIESBY CLAIM SEVERITY RANGE, VOLVO XC60 VS. OTHER MIDSIZE LUXURY SUVS
Figure 6 shows property damage liability claim frequencies for the 2010 Volvo XC60 by claim severity range comparedwith those for other Volvo vehicles. Claim frequencies exhibited a similar pattern to those in Figure 5. As the dollar valueof claims increased, the difference in claim frequencies between the XC60 and other Volvos narrowed until the highestclaim severity range, where there was no measurable difference.
Volvo XC60
All Other Volvos
1.2
1.4
1.6
1.0
0.8
0.4
0.6
0.2
Low <$1,500 Mid $1,500-$6,999 High $7,000+
Clai
ms p
er 1
00 in
sure
d ve
hicl
e ye
ars
FIGURE 6 PROPERTY DAMAGE LIABILITY CLAIM FREQUENCIESBY CLAIM SEVERITY RANGE, VOLVO XC60 VS. OTHER VOLVO VEHICLES
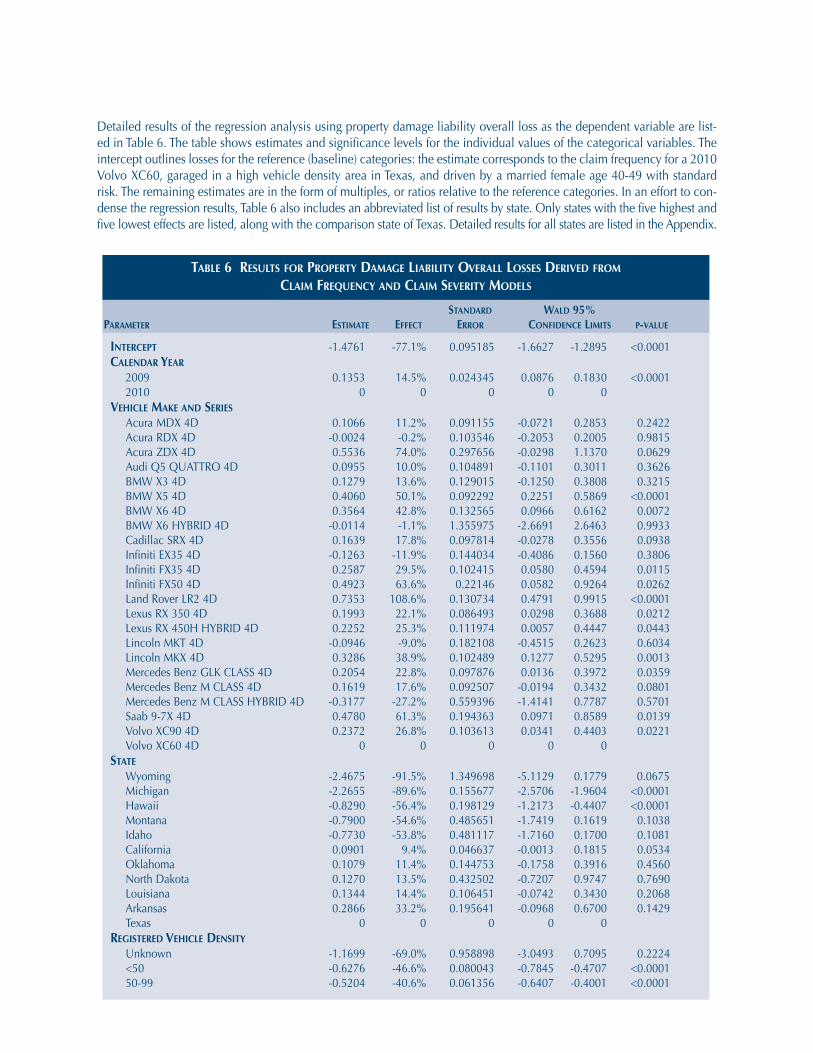
INTERCEPT -1.4761 -77.1% 0.095185 -1.6627 -1.2895 <0.0001CALENDAR YEAR2009 0.1353 14.5% 0.024345 0.0876 0.1830 <0.00012010 0 0 0 0 0
VEHICLE MAKE AND SERIESAcura MDX 4D 0.1066 11.2% 0.091155 -0.0721 0.2853 0.2422Acura RDX 4D -0.0024 -0.2% 0.103546 -0.2053 0.2005 0.9815Acura ZDX 4D 0.5536 74.0% 0.297656 -0.0298 1.1370 0.0629Audi Q5 QUATTRO 4D 0.0955 10.0% 0.104891 -0.1101 0.3011 0.3626BMW X3 4D 0.1279 13.6% 0.129015 -0.1250 0.3808 0.3215BMW X5 4D 0.4060 50.1% 0.092292 0.2251 0.5869 <0.0001BMW X6 4D 0.3564 42.8% 0.132565 0.0966 0.6162 0.0072BMW X6 HYBRID 4D -0.0114 -1.1% 1.355975 -2.6691 2.6463 0.9933Cadillac SRX 4D 0.1639 17.8% 0.097814 -0.0278 0.3556 0.0938Infiniti EX35 4D -0.1263 -11.9% 0.144034 -0.4086 0.1560 0.3806Infiniti FX35 4D 0.2587 29.5% 0.102415 0.0580 0.4594 0.0115Infiniti FX50 4D 0.4923 63.6% 0.22146 0.0582 0.9264 0.0262Land Rover LR2 4D 0.7353 108.6% 0.130734 0.4791 0.9915 <0.0001Lexus RX 350 4D 0.1993 22.1% 0.086493 0.0298 0.3688 0.0212Lexus RX 450H HYBRID 4D 0.2252 25.3% 0.111974 0.0057 0.4447 0.0443Lincoln MKT 4D -0.0946 -9.0% 0.182108 -0.4515 0.2623 0.6034Lincoln MKX 4D 0.3286 38.9% 0.102489 0.1277 0.5295 0.0013Mercedes Benz GLK CLASS 4D 0.2054 22.8% 0.097876 0.0136 0.3972 0.0359Mercedes Benz M CLASS 4D 0.1619 17.6% 0.092507 -0.0194 0.3432 0.0801Mercedes Benz M CLASS HYBRID 4D -0.3177 -27.2% 0.559396 -1.4141 0.7787 0.5701Saab 9-7X 4D 0.4780 61.3% 0.194363 0.0971 0.8589 0.0139Volvo XC90 4D 0.2372 26.8% 0.103613 0.0341 0.4403 0.0221Volvo XC60 4D 0 0 0 0 0
STATEWyoming -2.4675 -91.5% 1.349698 -5.1129 0.1779 0.0675 Michigan -2.2655 -89.6% 0.155677 -2.5706 -1.9604 <0.0001Hawaii -0.8290 -56.4% 0.198129 -1.2173 -0.4407 <0.0001Montana -0.7900 -54.6% 0.485651 -1.7419 0.1619 0.1038Idaho -0.7730 -53.8% 0.481117 -1.7160 0.1700 0.1081California 0.0901 9.4% 0.046637 -0.0013 0.1815 0.0534Oklahoma 0.1079 11.4% 0.144753 -0.1758 0.3916 0.4560North Dakota 0.1270 13.5% 0.432502 -0.7207 0.9747 0.7690Louisiana 0.1344 14.4% 0.106451 -0.0742 0.3430 0.2068Arkansas 0.2866 33.2% 0.195641 -0.0968 0.6700 0.1429Texas 0 0 0 0 0
REGISTERED VEHICLE DENSITYUnknown -1.1699 -69.0% 0.958898 -3.0493 0.7095 0.2224<50 -0.6276 -46.6% 0.080043 -0.7845 -0.4707 <0.000150-99 -0.5204 -40.6% 0.061356 -0.6407 -0.4001 <0.0001
STANDARD WALD 95% PARAMETER ESTIMATE EFFECT ERROR CONFIDENCE LIMITS P-VALUE
TABLE 6 RESULTS FOR PROPERTY DAMAGE LIABILITY OVERALL LOSSES DERIVED FROMCLAIM FREQUENCY AND CLAIM SEVERITY MODELS
Detailed results of the regression analysis using property damage liability overall loss as the dependent variable are list-ed in Table 6. The table shows estimates and significance levels for the individual values of the categorical variables. Theintercept outlines losses for the reference (baseline) categories: the estimate corresponds to the claim frequency for a 2010Volvo XC60, garaged in a high vehicle density area in Texas, and driven by a married female age 40-49 with standardrisk. The remaining estimates are in the form of multiples, or ratios relative to the reference categories. In an effort to con-dense the regression results, Table 6 also includes an abbreviated list of results by state. Only states with the five highest andfive lowest effects are listed, along with the comparison state of Texas. Detailed results for all states are listed in the Appendix.

100-249 -0.3445 -29.1% 0.045287 -0.4333 -0.2557 <0.0001250-499 -0.2427 -21.5% 0.037211 -0.3156 -0.1698 <0.0001500-999 -0.1447 -13.5% 0.037567 -0.2183 -0.0711 0.00011,000+ 0 0 0 0 0
RATED DRIVER AGEUnknown 0.0031 0.3% 0.063494 -0.1213 0.1275 0.961115-19 0.5576 74.6% 0.095621 0.3702 0.7450 <0.000120-24 0.2307 25.9% 0.080891 0.0722 0.3892 0.004325-29 0.1910 21.0% 0.060441 0.0725 0.3095 0.001630-39 0.0096 1.0% 0.034609 -0.0582 0.0774 0.781550-59 -0.1325 -12.4% 0.034609 -0.2003 -0.0647 0.000160-64 -0.1323 -12.4% 0.043953 -0.2184 -0.0462 0.002665-69 -0.0110 -1.1% 0.048978 -0.1070 0.0850 0.822370-74 0.1646 17.9% 0.058395 0.0501 0.2791 0.004875+ 0.3115 36.5% 0.059943 0.1940 0.4290 <0.000140-49 0 0 0 0 0
RATED DRIVER GENDERMale -0.0199 -2.0% 0.027607 -0.0740 0.0342 0.4710Unknown -0.2938 -25.5% 0.065343 -0.4219 -0.1657 <0.0001Female 0 0 0 0 0
RATED DRIVER MARITAL STATUSSingle 0.2303 25.9% 0.032631 0.16634 0.29426 <0.0001Unknown 0.3188 37.5% 0.063642 0.19406 0.44354 <0.0001Married 0 0 0 0 0
RISKNonstandard 0.1566 17.0% 0.035894 0.08625 0.22695 <0.0001Standard 0 0 0 0 0
STANDARD WALD 95% PARAMETER ESTIMATE EFFECT ERROR CONFIDENCE LIMITS P-VALUE
TABLE 6 RESULTS FOR PROPERTY DAMAGE LIABILITY OVERALL LOSSES DERIVED FROMCLAIM FREQUENCY AND CLAIM SEVERITY MODELS (CONT’D)
Table 7 summarizes results of the regression analysis conducted for property damage liability coverage. It includes esti-mates of claim frequency, claim severity, and overall loss for other midsize luxury SUVs and other Volvo vehicles relativeto the XC60.
Property damage liability overall losses (measured in average loss payments per insured vehicle year) were calculated forthe 2010 Volvo XC60 equipped with City Safety and compared with overall losses for other 2009-10 midsize luxury SUVsand for other Volvo vehicles without the system. Figure 7 shows the property damage liability overall loss for the 2010
TABLE 7 ESTIMATED PROPERTY DAMAGE LIABILITY LOSS RESULTS FORCOMPARISON GROUPS RELATIVE TO VOLVO XC60
STANDARD LOWER UPPERCONTROL GROUP ESTIMATE ERROR EFFECT BOUND BOUND
CLAIM FREQUENCY
Midsize Luxury SUVs 0.3095 0.0187 36% 31% 41%
Volvos 0.2138 0.0340 24% 16% 32%
CLAIM SEVERITY
Midsize Luxury SUVs -0.0923 0.0171 -9% -12% -6%
Volvos -0.2373 0.0324 -21% -26% -16%
OVERALL LOSS
Midsize Luxury SUVs 0.2173 0.0253 24% 18% 31%
Volvos -0.0235 0.0470 -2% -11% 7%

Volvo XC60 compared with those for other midsize luxury SUVs. The estimated overall loss for the Volvo XC60 was 20percent lower than that for all other midsize luxury SUVs combined ($85 per insured vehicle year). At the 95 percent con-fidence level, the range for this estimate was 15 to 23 percent. Compared with individual vehicle series, the XC60 had alower overall loss than most other midsize luxury SUVs.
Figure 8 shows the property damage liability overall loss for the 2010 Volvo XC60 compared with those for other Volvovehicles. The estimated overall loss for the Volvo XC60 was only 2 percent higher than that for all other Volvos combined.At the 95 percent confidence level, this estimate fell between a 12 percent increase and a 7 percent decease. Additionally,the overall loss for XC60 was higher than those for most other Volvo vehicles.
$50
$100
$150
$200
Aver
age
loss
pay
men
t per
insu
red
vehi
cle
year
FIGURE 7 PROPERTY DAMAGE LIABILITY OVERALL LOSSES FOR 2010 VOLVO XC60 WITH CITY SAFETY VS. OTHER 2009-10 MIDSIZE LUXURY SUVS
$100
$40
$60
$80
$20
XC60 XC90 S40 S60 V70 XC70 C30 S80 V70 V50 All Others
Aver
age
loss
pay
men
t per
insu
red
vehi
cle
year
FIGURE 8 PROPERTY DAMAGE LIABILITY OVERALL LOSSES FOR 2010 VOLVO XC60 WITH CITY SAFETY VS. OTHER 2009-10 VOLVO VEHICLES
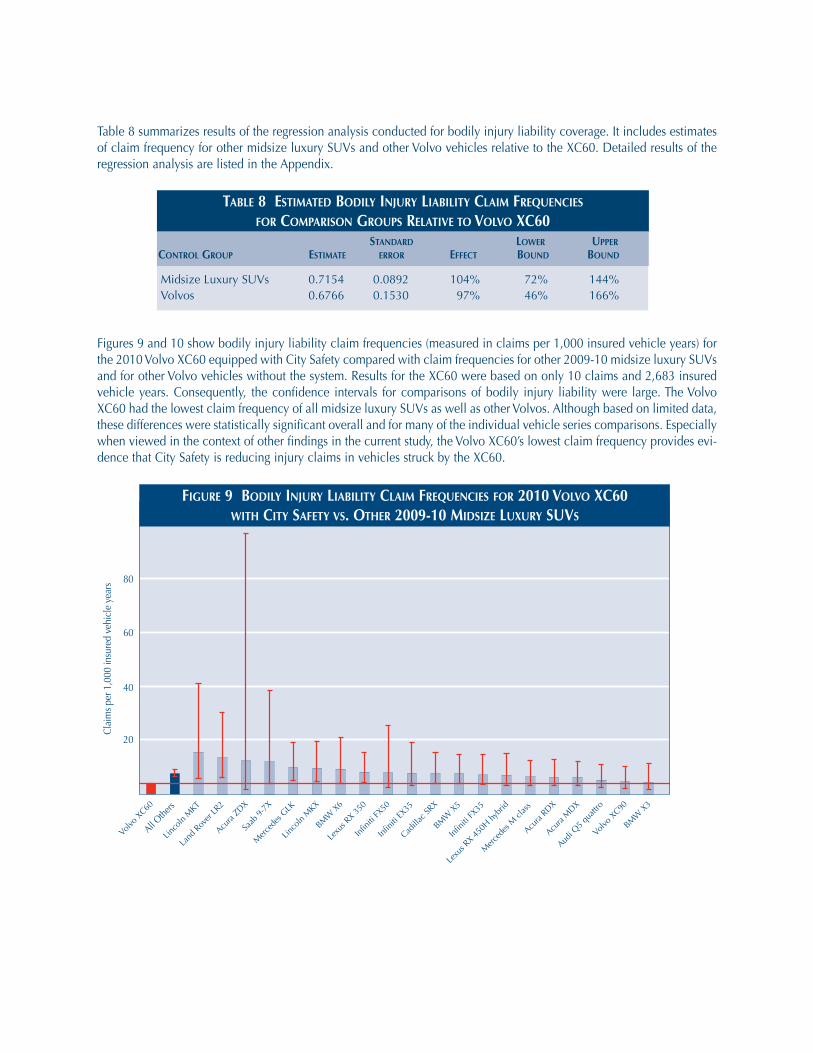
Table 8 summarizes results of the regression analysis conducted for bodily injury liability coverage. It includes estimatesof claim frequency for other midsize luxury SUVs and other Volvo vehicles relative to the XC60. Detailed results of theregression analysis are listed in the Appendix.
Figures 9 and 10 show bodily injury liability claim frequencies (measured in claims per 1,000 insured vehicle years) forthe 2010 Volvo XC60 equipped with City Safety compared with claim frequencies for other 2009-10 midsize luxury SUVsand for other Volvo vehicles without the system. Results for the XC60 were based on only 10 claims and 2,683 insuredvehicle years. Consequently, the confidence intervals for comparisons of bodily injury liability were large. The VolvoXC60 had the lowest claim frequency of all midsize luxury SUVs as well as other Volvos. Although based on limited data,these differences were statistically significant overall and for many of the individual vehicle series comparisons. Especiallywhen viewed in the context of other findings in the current study, the Volvo XC60’s lowest claim frequency provides evi-dence that City Safety is reducing injury claims in vehicles struck by the XC60.
Midsize Luxury SUVs 0.7154 0.0892 104% 72% 144%Volvos 0.6766 0.1530 97% 46% 166%
TABLE 8 ESTIMATED BODILY INJURY LIABILITY CLAIM FREQUENCIESFOR COMPARISON GROUPS RELATIVE TO VOLVO XC60
STANDARD LOWER UPPERCONTROL GROUP ESTIMATE ERROR EFFECT BOUND BOUND
80
60
40
Clai
ms p
er 1
,000
insu
red
vehi
cle
year
s
20
All Othe
rs
FIGURE 9 BODILY INJURY LIABILITY CLAIM FREQUENCIES FOR 2010 VOLVO XC60 WITH CITY SAFETY VS. OTHER 2009-10 MIDSIZE LUXURY SUVS

Collision claim frequencies (measured in claims per 100 insured vehicle years) were calculated for the 2010 Volvo XC60equipped with City Safety and compared with claim frequencies for other 2009-10 midsize luxury SUVs and for otherVolvo vehicles without the system. Results for the XC60 were based on 628 claims and 11,641 insured vehicle years.Figure 11 shows the collision claim frequency for the 2010 Volvo XC60 compared with those for other midsize luxury
30
25
20
10
15
5
XC60 All Others
S60 V70 S40 C30 V50 C70 XC70 XC90 S80
Clai
ms p
er 1
,000
insu
red
vehi
cle
year
s
FIGURE 10 BODILY INJURY LIABILITY CLAIM FREQUENCIES FOR 2010 VOLVO XC60 WITH CITY SAFETY VS. OTHER 2009-10 VOLVO VEHICLES
Table 9 summarizes results of the regression analysis conducted for collision coverage. It includes estimates of claim fre-quency, claim severity, and overall loss for other midsize luxury SUVs and other Volvo vehicles relative to the XC60.Detailed results of the regression analysis are listed in the Appendix.
TABLE 9 ESTIMATED COLLISION LOSS RESULTSFOR COMPARISON GROUPS RELATIVE TO VOLVO XC60
STANDARD LOWER UPPERCONTROL GROUP ESTIMATE ERROR EFFECT BOUND BOUND
CLAIM FREQUENCY
Midsize Luxury SUVs 0.2482 0.0121 28% 25% 31%
Volvos 0.1824 0.0220 20% 15% 25%
CLAIM SEVERITY
Midsize Luxury SUVs 0.1196 0.0140 13% 10% 16%
Volvos 0.0355 0.0254 4% -1% 9%
OVERALL LOSS
Midsize Luxury SUVs 0.3678 0.0186 44% 39% 50%
Volvos 0.2179 0.0336 24% 16% 33%
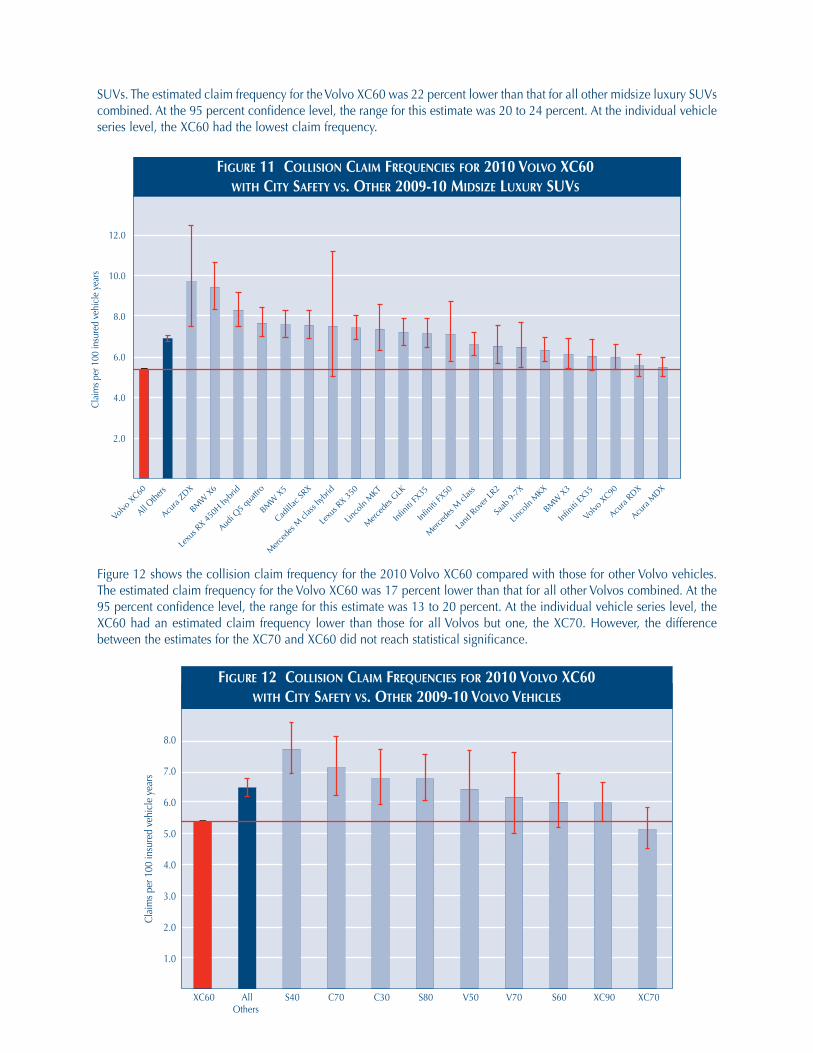
Figure 12 shows the collision claim frequency for the 2010 Volvo XC60 compared with those for other Volvo vehicles.The estimated claim frequency for the Volvo XC60 was 17 percent lower than that for all other Volvos combined. At the95 percent confidence level, the range for this estimate was 13 to 20 percent. At the individual vehicle series level, theXC60 had an estimated claim frequency lower than those for all Volvos but one, the XC70. However, the differencebetween the estimates for the XC70 and XC60 did not reach statistical significance.
12.0
10.0
8.0
4.0
2.0
6.0
Clai
ms p
er 1
00 in
sure
d ve
hicl
e ye
ars
All Othe
rs
FIGURE 11 COLLISION CLAIM FREQUENCIES FOR 2010 VOLVO XC60 WITH CITY SAFETY VS. OTHER 2009-10 MIDSIZE LUXURY SUVS
8.0
7.0
6.0
4.0
5.0
1.0
2.0
3.0
XC60 AllOthers
S40 C70 C30 S80 V50 V70 S60 XC90 XC70
Clai
ms p
er 1
00 in
sure
d ve
hicl
e ye
ars
FIGURE 12 COLLISION CLAIM FREQUENCIES FOR 2010 VOLVO XC60 WITH CITY SAFETY VS. OTHER 2009-10 VOLVO VEHICLES
SUVs. The estimated claim frequency for the Volvo XC60 was 22 percent lower than that for all other midsize luxury SUVscombined. At the 95 percent confidence level, the range for this estimate was 20 to 24 percent. At the individual vehicleseries level, the XC60 had the lowest claim frequency.

Figures 13 and 14 show the collision claim severity for the 2010 Volvo XC60 compared with those for other midsize lux-ury SUVs and other Volvo vehicles. The estimated claim severity for the Volvo XC60 was 11 percent lower than that forall other midsize luxury SUVs combined. At the 95 percent confidence level, the range for this estimate was 9 to 14 per-cent. The estimated claim severity for the Volvo XC60 was only 3 percent lower than that for all other Volvos combined.At the 95 percent confidence level, this estimate fell between a 1 percent increase and an 8 percent decease. Results weremixed at the individual vehicle series level.
$1,000
$2,000
$3,000
$4,000
$5,000
$6,000
$7,000
$8,000
$9,000
Aver
age
loss
pay
men
t per
cla
im
FIGURE 13 COLLISION CLAIM SEVERITIES FOR 2010 VOLVO XC60 WITH CITY SAFETY VS. OTHER 2009-10 MIDSIZE LUXURY SUVS
XC60 All Others S60 XC70 S40 S80 C70 C30 XC90 V50 V70
$1,000
$2,000
$3,000
$4,000
$5,000
Aver
age
loss
pay
men
t per
cla
im
FIGURE 14 COLLISION CLAIM SEVERITIES FOR 2010 VOLVO XC60 WITH CITY SAFETY VS. OTHER 2009-10 VOLVO VEHICLES

As with the analysis of property damage liability claim frequencies reported in Table 5, Table 10 summarizes results ofregression analysis conducted for collision coverage. Detailed results are listed in the Appendix. The XC60 had lower col-lision claim frequencies compared with other Volvos or other midsize luxury SUVs for all claim severity ranges. However,the effect was greatest for the $5,000-$11,999 range.
TABLE 10 ESTIMATED COLLISION CLAIM FREQUENCIES BY SEVERITY RANGEFOR COMPARISON GROUPS RELATIVE TO VOLVO XC60
STANDARD LOWER UPPERCONTROL GROUP CLAIM SIZE ESTIMATE ERROR EFFECT BOUND BOUND
Midsize Luxury SUVs <$2,000 0.1373 0.0166 14.7% 11.0% 18.5%
Midsize Luxury SUVs $2,000-$4,999 0.3177 0.0256 37.4% 30.7% 44.4%
Midsize Luxury SUVs $5,000-$11,999 0.4138 0.0327 51.3% 41.9% 61.3%
Midsize Luxury SUVs $12,000+ 0.3985 0.0394 49.0% 37.9% 60.9%
Volvos <$2,000 0.1255 0.0298 13.4% 6.9% 20.2%
Volvos $2,000-$4,999 0.1442 0.0475 15.5% 5.2% 26.8%
Volvos $5,000-$11,999 0.3920 0.0583 48.0% 32.0% 65.9%
Volvos $12,000+ 0.3032 0.0719 35.4% 17.6% 55.9%
Volvo XC60
All Other Midsize Luxury SUVs
3.0
3.5
2.5
2.0
1.0
1.5
0.5
Low: <$2,000 High: $12,000+ Mid: $2,000-$4,999 Mid-High: $5,000-$11,999
Clai
ms p
er 1
00 in
sure
d ve
hicl
e ye
ars
FIGURE 15 COLLISION CLAIM FREQUENCIES BY CLAIM SEVERITY RANGE, VOLVO XC60 VS. OTHER MIDSIZE LUXURY SUVS
Figures 15 and 16 illustrate these results for the XC60 compared with those for other midsize luxury SUVs and other Volvovehicles, respectively. In both comparisons, the smallest reduction was for the lowest severity range, claims less than$2,000.
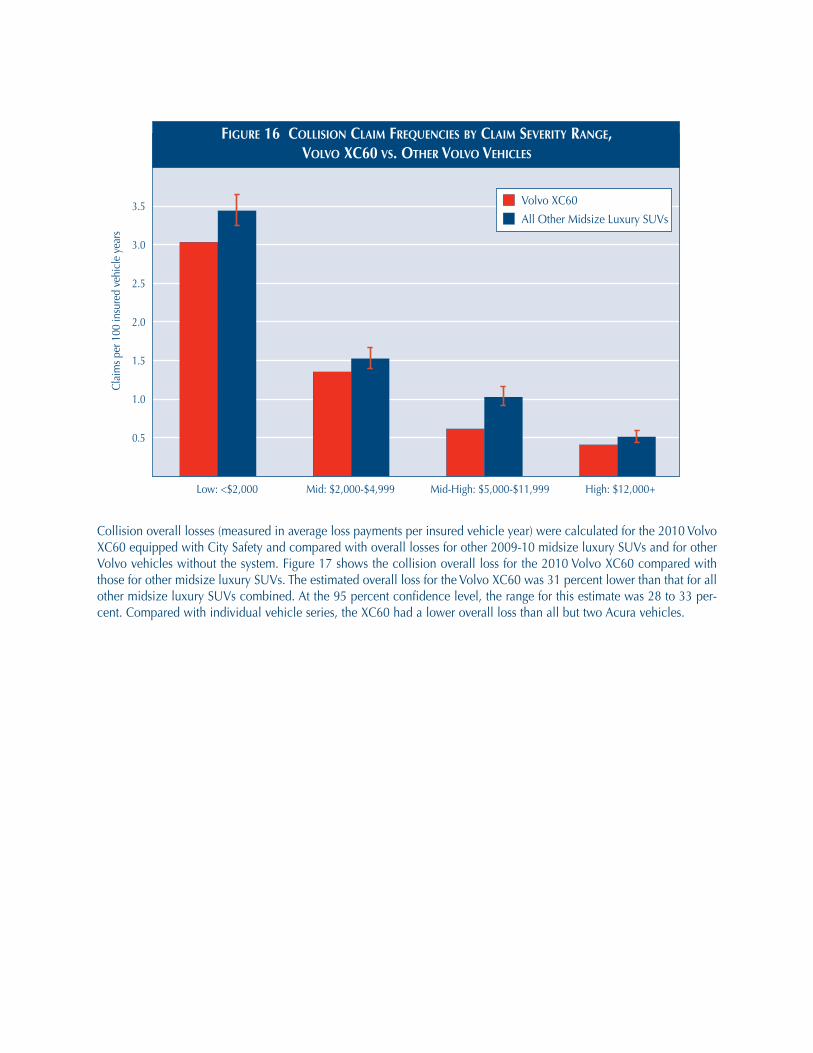
Collision overall losses (measured in average loss payments per insured vehicle year) were calculated for the 2010 VolvoXC60 equipped with City Safety and compared with overall losses for other 2009-10 midsize luxury SUVs and for otherVolvo vehicles without the system. Figure 17 shows the collision overall loss for the 2010 Volvo XC60 compared withthose for other midsize luxury SUVs. The estimated overall loss for the Volvo XC60 was 31 percent lower than that for allother midsize luxury SUVs combined. At the 95 percent confidence level, the range for this estimate was 28 to 33 per-cent. Compared with individual vehicle series, the XC60 had a lower overall loss than all but two Acura vehicles.
Volvo XC60
All Other Midsize Luxury SUVs
3.0
3.5
2.5
2.0
1.0
1.5
0.5
Low: <$2,000 High: $12,000+ Mid: $2,000-$4,999 Mid-High: $5,000-$11,999
Clai
ms p
er 1
00 in
sure
d ve
hicl
e ye
ars
FIGURE 16 COLLISION CLAIM FREQUENCIES BY CLAIM SEVERITY RANGE, VOLVO XC60 VS. OTHER VOLVO VEHICLES
$100
$200
$300
$400
$500
$600
$700
$800
Aver
age
loss
pay
men
t per
insu
red
vehi
cle
year
FIGURE 17 COLLISION OVERALL LOSSES FOR 2010 VOLVO XC60 WITH CITY SAFETY VS. OTHER 2009-10 MIDSIZE LUXURY SUVS
$50
$100
$150
$200
$250
$300
$350
XC60 All Others
S40 C70 S60 S80 C30 XC70 V50 XC90 V70
Aver
age
loss
pay
men
t per
insu
red
vehi
cle
year
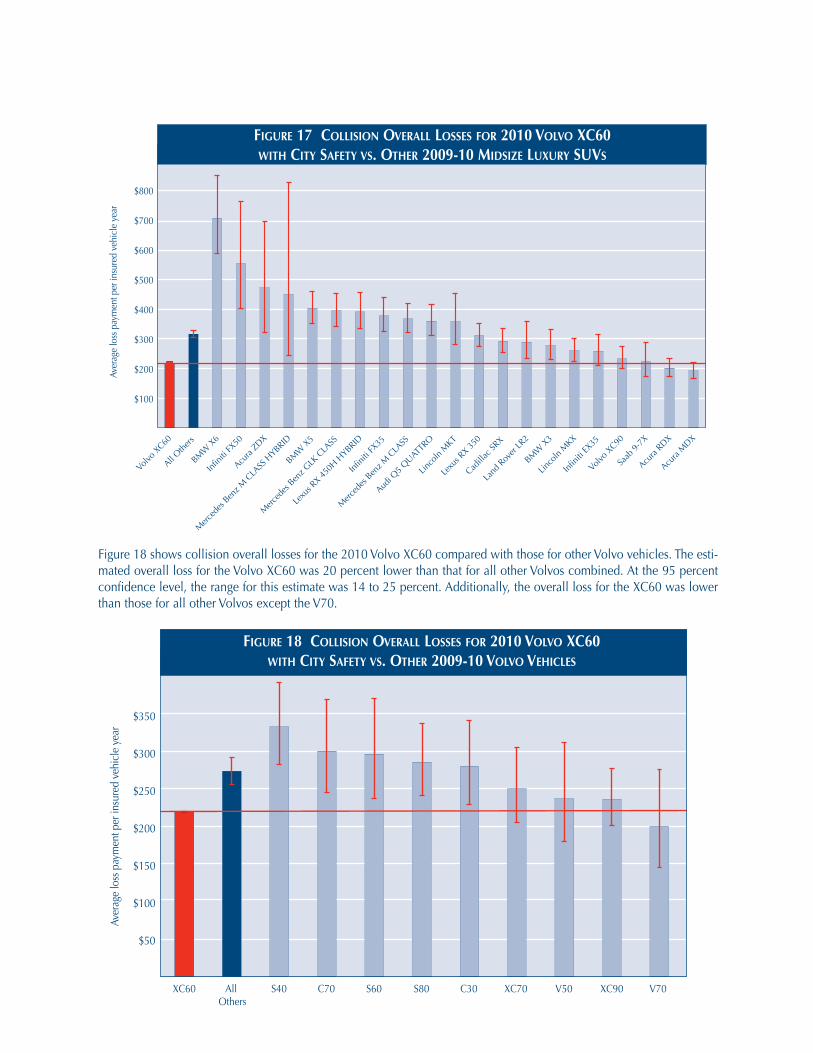
FIGURE 18 COLLISION OVERALL LOSSES FOR 2010 VOLVO XC60 WITH CITY SAFETY VS. OTHER 2009-10 VOLVO VEHICLES
Figure 18 shows collision overall losses for the 2010 Volvo XC60 compared with those for other Volvo vehicles. The esti-mated overall loss for the Volvo XC60 was 20 percent lower than that for all other Volvos combined. At the 95 percentconfidence level, the range for this estimate was 14 to 25 percent. Additionally, the overall loss for the XC60 was lowerthan those for all other Volvos except the V70.

DISCUSSIONVolvo’s City Safety system appears to be preventing crashes, at least in comparison with other midsize luxury SUVs andother Volvo models. Estimated claim frequency rates for the Volvo XC60, the only Volvo model equipped with City Safetyin the current study, were considerably lower for property damage liability and collision coverages relative to losses forboth control groups. All four of these estimates were substantial and statistically significant — 27 percent for propertydamage liability and 22 percent for collision relative to midsize luxury SUVs. Relative to other Volvos, claim frequencybenefits were significant but not as large as the benefit relative to other midsize luxury SUVs.
It was expected that property damage liability losses would be a more sensitive measure of City Safety effectivenessbecause it involves a larger proportion of vehicle-to-vehicle crashes than collision coverage. Past HLDI (2007) researchhas shown that 57 percent of vehicles repaired under property damage liability coverage were struck in the rear, likelyby the front of the covered vehicle. In contrast, only 48 percent of collision claims were for front impacts, some of whichwould not have involved another vehicle. Still, the effect on collision claim frequency observed in the current study wassubstantial and suggests that City Safety also may be preventing collisions with some nonvehicle objects. This may not beso surprising considering that, despite City Safety being designed especially for the vehicle-to-vehicle situation, the sys-tem sometimes is demonstrated with nonvehicle crash targets.
City Safety not only is preventing crashes but also appears to be preventing injuries through a combination of preventingsome crashes and reducing the severity of other crashes. Claim frequencies under bodily injury liability coverage for theXC60 were only half (51 percent) of those for other midsize luxury SUVs and slightly less than half (49 percent) of thosefor other Volvo vehicles. Both estimates were statistically significant, although based on limited data. Because the crashesbeing prevented are minor, it is expected that the injuries being prevented also are minor, but the data cannot address this.
Claim severities under property damage liability coverage were higher, on average, for the XC60 than for vehicles in eithercontrol group — 10 percent higher than for other midsize luxury SUVs and 27 percent higher than for other Volvo vehi-cles. Analysis of claim size distribution suggested this largely was a result of shifting the mean due to elimination of manylow-cost claims from the low-speed crashes that City Safety is intended to prevent. Another factor in the differencebetween the XC60 and the rest of the Volvo fleet is that the XC60 is an SUV and all other Volvos, except the XC90, arecars. The bottom of the XC60’s front bumper is higher off the ground than the front bumpers of Volvo cars and even slight-ly higher than the front bumper of the Volvo XC90. Prior research from HLDI (2006) and the Insurance Institute forHighway Safety (2008) has illustrated the effect on struck vehicle damage when a striking vehicle’s front bumper over-rides the struck vehicle’s rear bumper.
Unlike for property damage liability, average claim severity for collision claims did not increase for the Volvo XC60. Ananalysis of the differences between collision claim frequencies for the XC60 and the control groups for different claimseverities showed that, although City Safety reduced low-severity collision claims, as was true for property damage lia-bility claims, the technology had even larger effects on higher severity collision claims. Thus, average claim severity didnot change. These different results may seem contradictory, but it is likely they result from the difference in typical costsof property damage liability claims and collision claims.
In 2007, HLDI published an evaluation of collision and property damage liability claim severities by point of vehicleimpact. Information on point of impact was supplied by CCC Information Services, Inc. The study showed that the mostexpensive damage repair claims were collision claims for the 12 o’clock position (front of the striking vehicle), with aclaim severity of $4,658. At the same time, the least expensive damage repair claims were property damage liabilityclaims for the 6 o’clock position (rear of the struck vehicle), with a claim severity of $1,714. In other words, the averagecost of a front-strike collision claim was well more than double the cost of a rear-strike property damage liability claim.The implication of this pattern is that, even though City Safety reduces the frequency of low-severity front-to-rear colli-sions, the cost of these low-speed collisions that are prevented is higher than for property damage liability claims. At thesame time, City Safety is not expected to affect many of the crashes leading to the lowest severity collision claims.
Despite a higher claim severity under property damage liability coverage, the overall loss ($68 per insured vehicle year)for the XC60 was lower than that for other midsize luxury SUVs combined by 20 percent, a statistically significant result.The property damage liability overall loss for the XC60 was about the same as the average for all other Volvo models.Thus, City Safety appears able to prevent crashes and reduce insurance costs. There also is the indication that the systemreduces injury rates, though the confidence bounds of the estimates still are quite large.

HIGHWAY LOSSDATA INSTITUTE1005 North Glebe RoadArlington, VA 22201
The Highway Loss Data Institute is a nonprofit public service organization that gathers, processes, and publishes insurance data on the human and economic lossesassociated with owning and operating motor vehicles.
COPYRIGHTED DOCUMENT, DISTRIBUTION RESTRICTED © 2011 by the Highway Loss Data Institute, 1005 N. Glebe Road, Arlington, VA 22201. All rightsreserved. Distribution of this report is restricted. No part of this publication may be reproduced, or stored in a retrieval system, or transmitted, in any form or byany means, electronic, mechanical, photocopying, recording, or otherwise, without the prior written permission of the copyright owner. Possession of this publicationdoes not confer the right to print, reprint, publish, copy, sell, file, or use this material in any manner without the written permission of the copyright owner.Permission is hereby granted to companies that are supporters of the Highway Loss Data Institute to reprint, copy, or otherwise use this material for their own businesspurposes, provided that the copyright notice is clearly visible on the material.
LIMITATIONSAll of the XC60s included in the current study were equipped with the City Safety technology, but there was no way toknow how many, if any, of the drivers in these crash-involved vehicles had manually turned off the system prior to thecrash. Also, most of the vehicles in this study, including the XC60, can be equipped with a variety of collision avoidancefeatures that might also affect claim frequencies; however, based on data available to HLDI at the time of the study, it wasnot possible to control for the presence of these other features. Finally, 2010 was the first available model year for the XC60,and drivers of prior model year XC60s may differ in ways that were not adjusted for in analysis. To fully understand the ben-efits of City Safety, subsequent analysis will be required as additional loss data become available. Therefore, it will be impor-tant to continue monitoring the performance of City Safety as more and potentially different drivers insure the vehicle.
REFERENCESHighway Loss Data Institute. 2006. Vehicle compatibility. HLDI Bulletin 23(5). Arlington, VA.
Highway Loss Data Institute. 2007. Point of impact distribution. HLDI Bulletin 24(3). Arlington, VA.
Insurance Institute for Highway Safety. 2008. Bumper rules should extend to light trucks, Institute tells NHTSA. StatusReport 43(5):1-3. Arlington, VA