highway motor transportation concentrate on commercial motor vehicles (cmv) trucks busses
TRANSCRIPT

Highway Motor Transportation
Concentrate On
Commercial Motor Vehicles (CMV)• Trucks• Busses
History
• 1913 Lincoln Highway• 1916 1st Federal Aid Legislation• 1919 Army Convoy took 62 days• 1921 2nd Federal Aid Legislation• 1925 Adopted Numbered System Even #s east-west routes Odd #s north-south routes
The rest is history
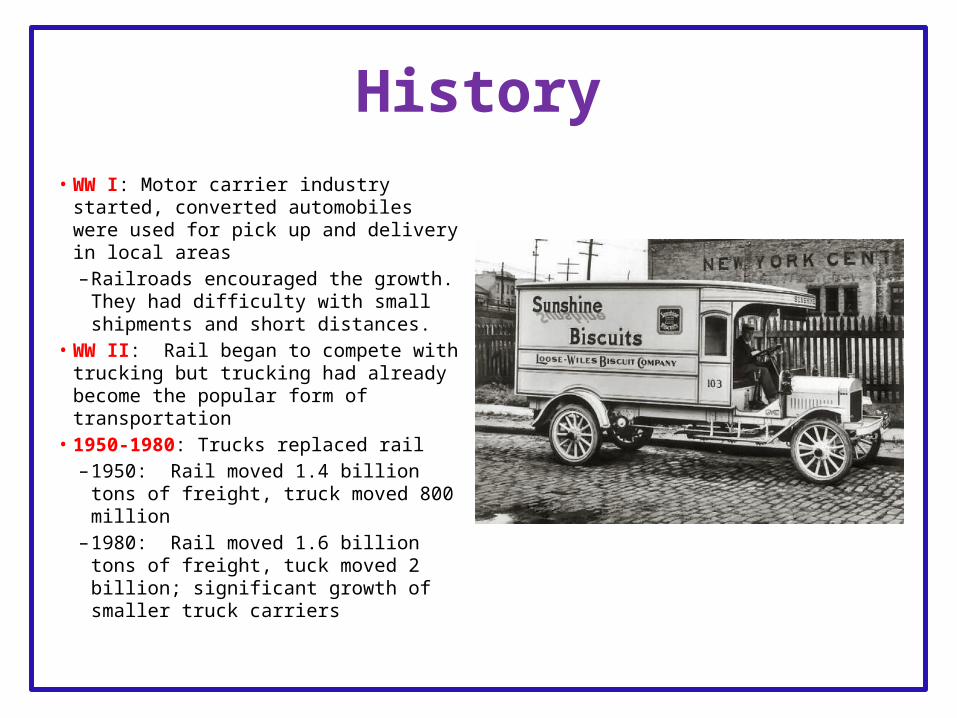
History• WW I: Motor carrier industry started,
converted automobiles were used for pick up and delivery in local areas– Railroads encouraged the growth.
They had difficulty with small shipments and short distances.
• WW II: Rail began to compete with trucking but trucking had already become the popular form of transportation
• 1950-1980: Trucks replaced rail– 1950: Rail moved 1.4 billion tons of
freight, truck moved 800 million– 1980: Rail moved 1.6 billion tons of
freight, tuck moved 2 billion; significant growth of smaller truck carriers
• 1956 - Eisenhower signed bill to establish National System of Interstate and Defense Highways (interstate system) to connect major cities– Federal-Aid Act (funding and catalyst for the project)
• Called for nationwide standards for design of the system• Increased the length of the system to 41,000• Set federal government’s share of project cost at 90%
– Highway Revenue Act • Highway Trust Fund consisting of revenue from federal gas
and other motor vehicle taxes• Used to pay federal share of interstate and other federal-aid
highway projects
• 1980s – Deregulation, significant growth
Motor Carrier Act 1935
• Interstate Commerce Commission (ICC) had control of trucking industry
• Required carriers to file rates (tariffs) with the ICC
• New truckers had to receive a certificate from ICC to enter the industry
• Regulated rates and competition within the trucking industry.
Motor Carrier Act 1980
• Partially deregulated the industry• Eased entry into the industry = increase in the
number of carriers• Eliminated many restrictions on commodities• Encouraged carriers to increase or decrease
rates to increase competition• Basically removed many ICC regulations

Advantages• Accessibility:
– Access to any location/destination – Link between other modes of transportation and the final destination of
goods• Fast/speed:
– Products can be delivered directly from the truck and without delay– Less delay from unloading/loading like other forms of transportation
experience (rail, air, water) • No highway constraints: trucks can travel on any designated highway unlike rail and water that have to pay fees/rates to cross over and use other company’s facilities.
•Typical max. weight 80,000 + 5% pounds
• Small capacity: consumer can have lower inventory levels, lower inventory costs, and more frequent services
• Minimum Shipping Weights by Mode:
Truck 25,000 - 30,000 poundsRail Car 40,000 - 60,000 poundsBarge hundreds of thousands of tons
• Smooth ride: less chance of damage to goods • Consumer market oriented: very responsive to
consumer needs

Two Types of Carriers A. For-Hire Carriers
• Provides a public service• Charges a fee• Several Types– Local– Intercity– Exempt– Truckload– Less-Than-Truckload
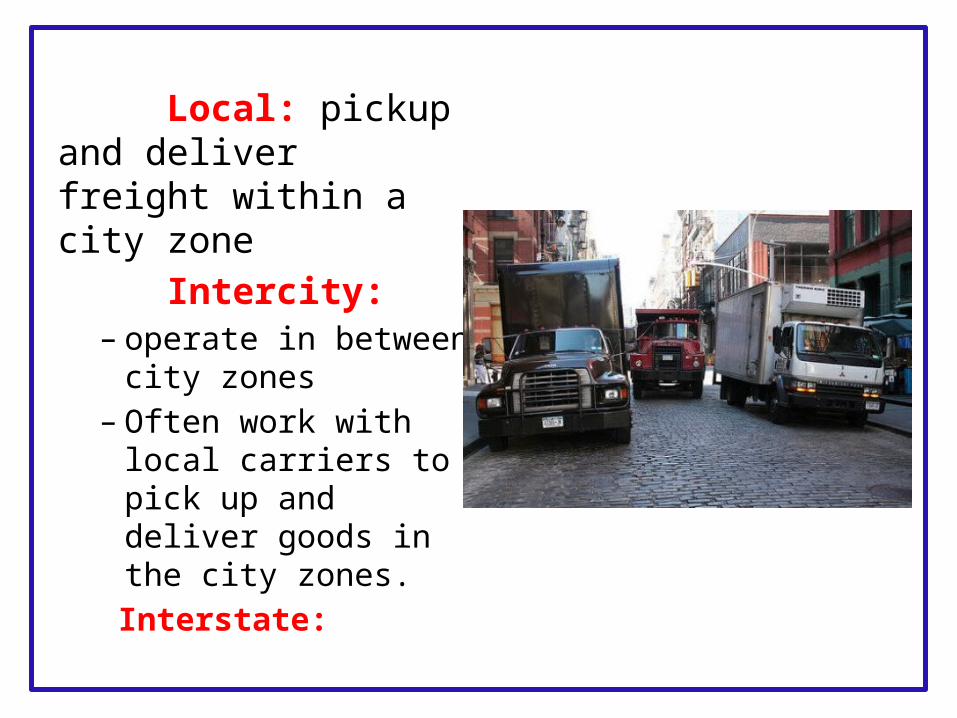
Local: pickup and deliver freight within a city zone Intercity: – operate in between
city zones– Often work with local
carriers to pick up and deliver goods in the city zones.
Interstate:

• Truckload: – Volume meets the minimum weight required for a
truckload shipment and truckload rate – Picks up and delivers the same truck load
• Less-than-truckload: – Volume lower than minimum – Consolidate smaller shipments into truckload
quantities for line haul/intercity movement and separate the loads back into smaller quantities for delivery

• Common: serve general public at a reasonable rate
• Contract: under contract to serve specific shippers
• Exempt: carriers that are exempt from economic regulations – Determined by type of commodity or nature of its
operation– Laws of marketplace determine rates, the service
provided, and the number of vehicles provided
Classification
• Carriers are classified based on their annual gross operating revenues.
Class I $10 million or greaterClass II $3-10 millionClass III Less than $3 million

B. Private (not for hire) Carriers
• Provides service to industry or company that owns or lease vehicles
• Does not charge a fee• Motor Carrier Act of 1980: – Eased entry requirements– Could transport as a for-hire depending on the
commodities carried. In this case, would be considered an exempt carrier.
Types of Vehicles
• Line-Haul -- 18 & 24 wheelers – Haul freight long distances between cities– Truck trailer combo of 3 or more axles
• City Trucks– Smaller than line-haul vehicles – Single units 20 to 25 ft long with cargo unit 15 to 20 ft long.
• Special Vehicles – vehicles specifically designed to meet shippers needs– These can be subject to special regulations – Ex: number of lights on the vehicles, brakes used, tire
specifications, allowable length and/or height)
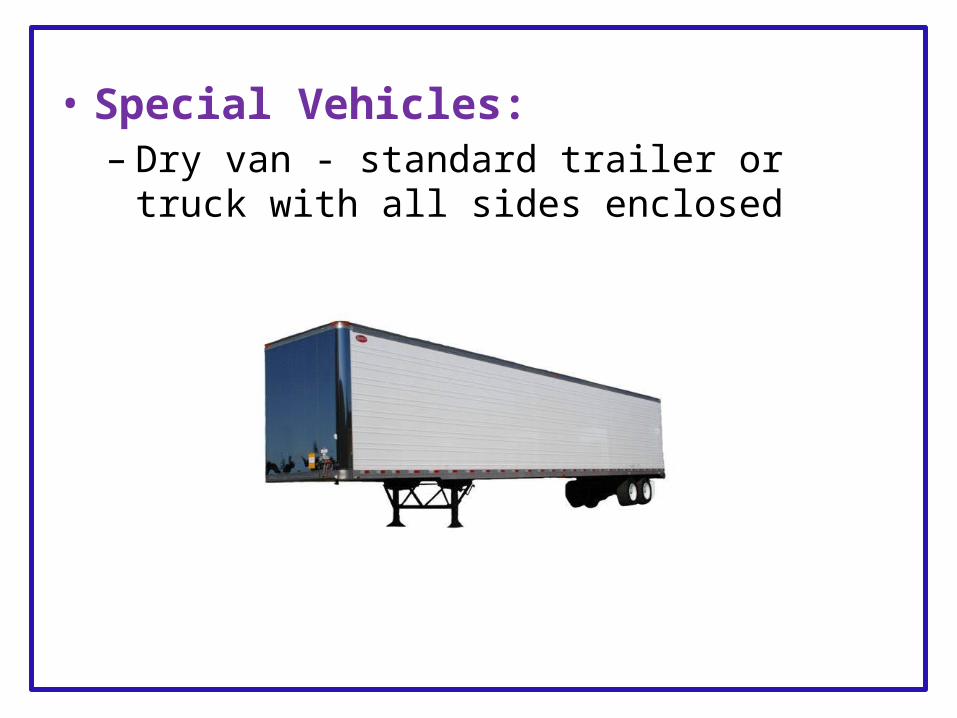
• Special Vehicles:– Dry van - standard trailer or truck with all sides
enclosed
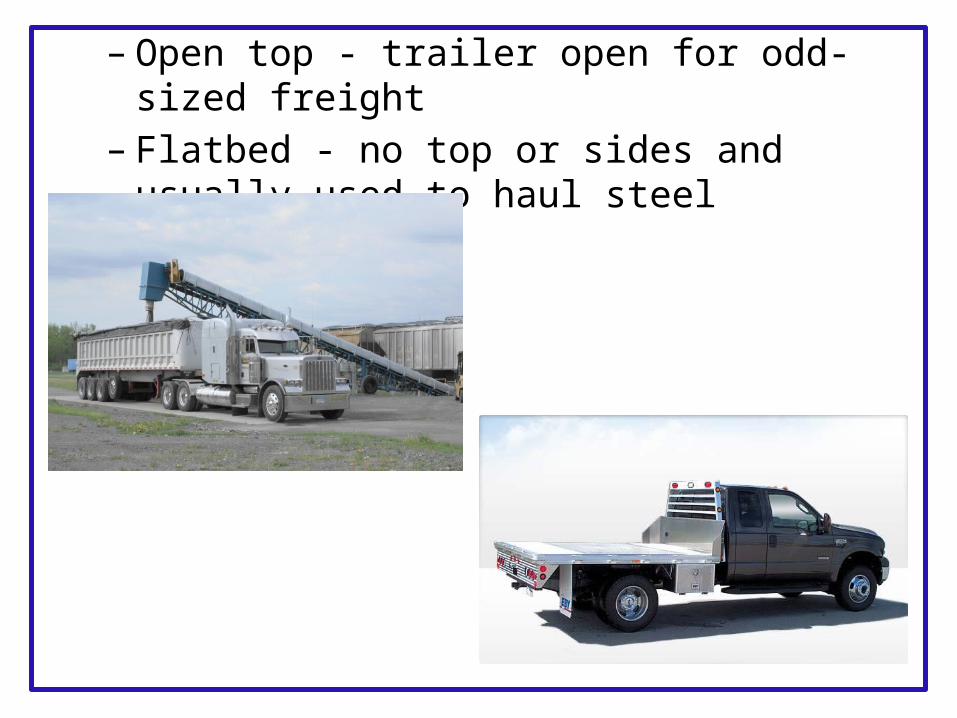
– Open top - trailer open for odd-sized freight– Flatbed - no top or sides and usually used to haul
steel

- Tank Trailer - liquids and petroleum products- Refrigerated vehicles - controlled temperature
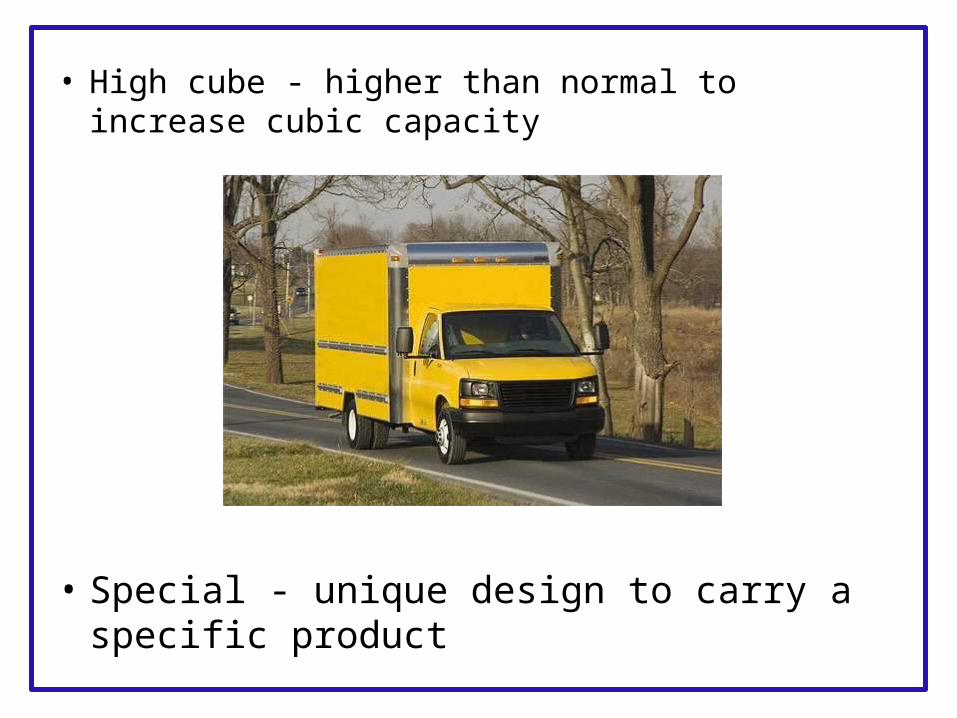
• High cube - higher than normal to increase cubic capacity
• Special - unique design to carry a specific product
Low Startup Fees
• $5,000 -10,000 to start • Many small carriers or Class III, main reason for
significant growth in the 1980s• Class I and II have more invested because their
companies are larger and require more trucks and terminals, entry into the industry is more limited than Class III
• Truckload vs Less-than-truckload: LTL require terminals to separate and consolidate shipments, therefore, their startup fee is higher and entry is more limited
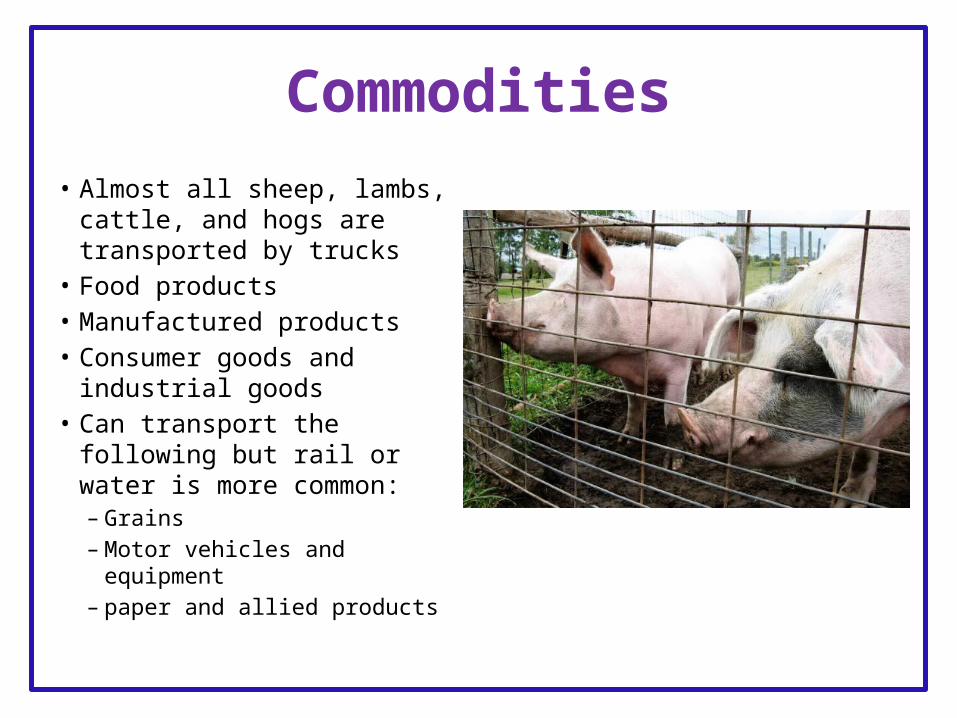
Commodities• Almost all sheep, lambs,
cattle, and hogs are transported by trucks
• Food products• Manufactured products• Consumer goods and
industrial goods• Can transport the following
but rail or water is more common:– Grains– Motor vehicles and equipment– paper and allied products
Competition• Rivalry between carriers (union vs. non-union)• Low entry fee, freedom to enter, and discounting of services have
made it easy for individual trucks to compete with larger carriers• Market oriented
– Carriers are forced to meet demand and consumers needs.– Smaller for-hire carriers are more capable of giving individual attention
to customers. Larger carriers are more limited in the attention they can give customers.
• Competition between modes:30,000 - 60,000 pounds hauled less than 300 miles truck90,000 pounds or more hauled more than 100 miles railIn between these ranges rail and truck compete
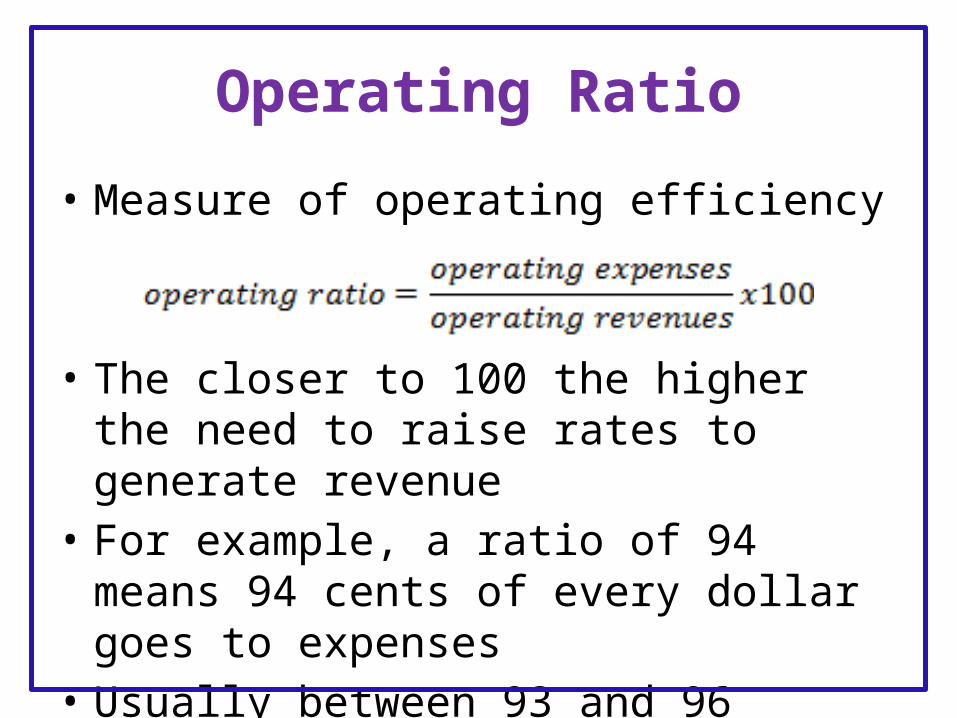
Operating Ratio
• Measure of operating efficiency
• The closer to 100 the higher the need to raise rates to generate revenue
• For example, a ratio of 94 means 94 cents of every dollar goes to expenses
• Usually between 93 and 96
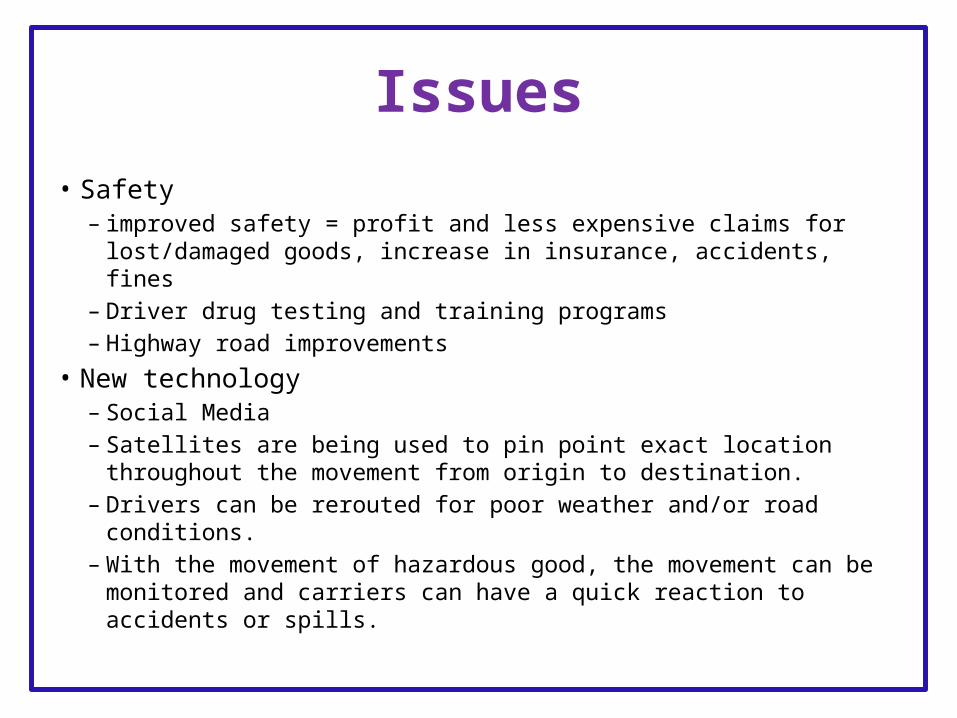
Issues
• Safety – improved safety = profit and less expensive claims for lost/damaged
goods, increase in insurance, accidents, fines– Driver drug testing and training programs– Highway road improvements
• New technology– Social Media– Satellites are being used to pin point exact location throughout the
movement from origin to destination. – Drivers can be rerouted for poor weather and/or road conditions. – With the movement of hazardous good, the movement can be
monitored and carriers can have a quick reaction to accidents or spills.
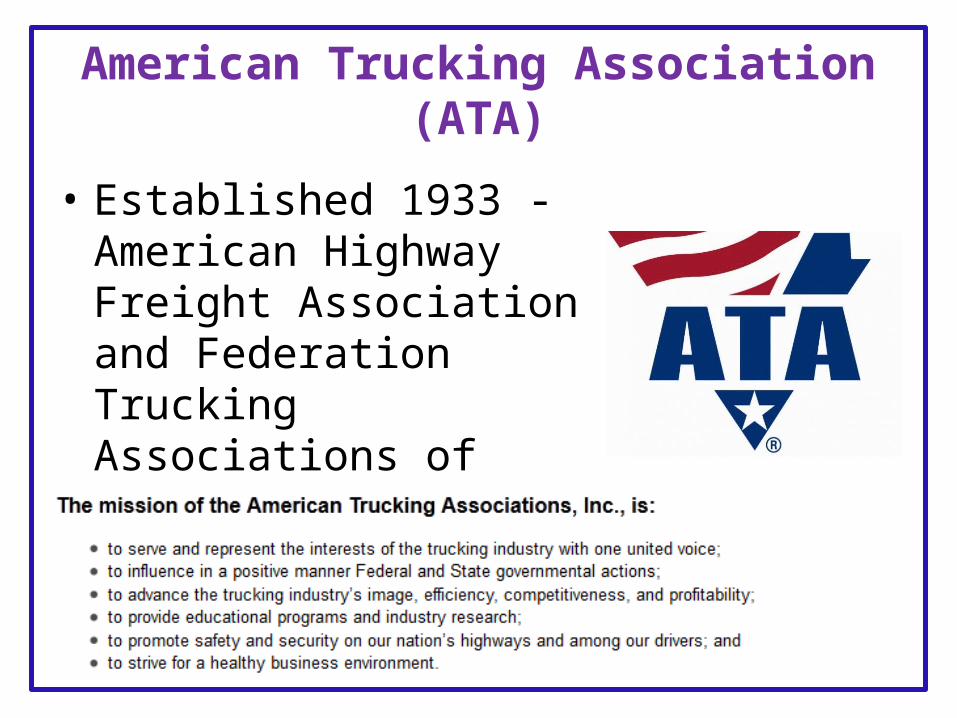
American Trucking Association (ATA)
• Established 1933 - American Highway Freight Association and Federation Trucking Associations of America came together to form ATA
Federal Motor Carrier Safety Administration (FMCSA)
• Mission: “Prevent commercial motor vehicle-related fatalities and injuries”
• Established January 1, 2000 under the Motor Carrier Safety Improvement Act of 1999
• Activities– Enforcement of safety regulations – Targeting high-risk carriers and commercial motor carriers– Improving safety information systems and technologies – Strengthening equipment and operating standards– Increasing safety awareness & enhance efficiency

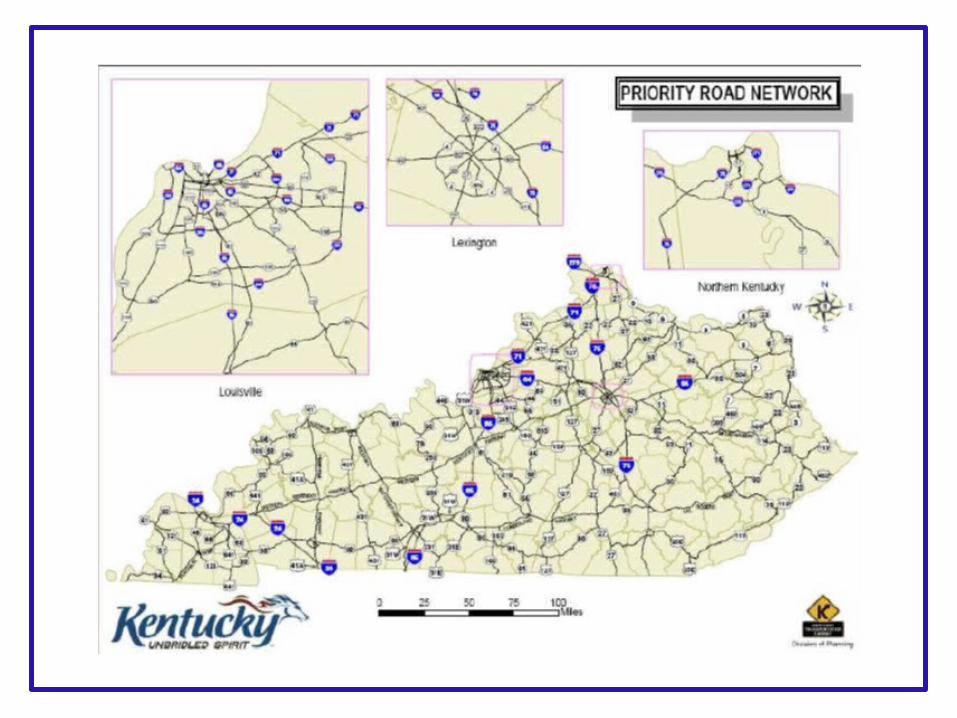
Kentucky’s Highways
• Freight tonnage– 43% inbound– 73% outbound
• 47.2 trillion vehicle miles of travel annually• 78, 913 miles of public roads and streets• 9 interstate Highways• 73% within state, 28% from state, 38% to state (by weight)
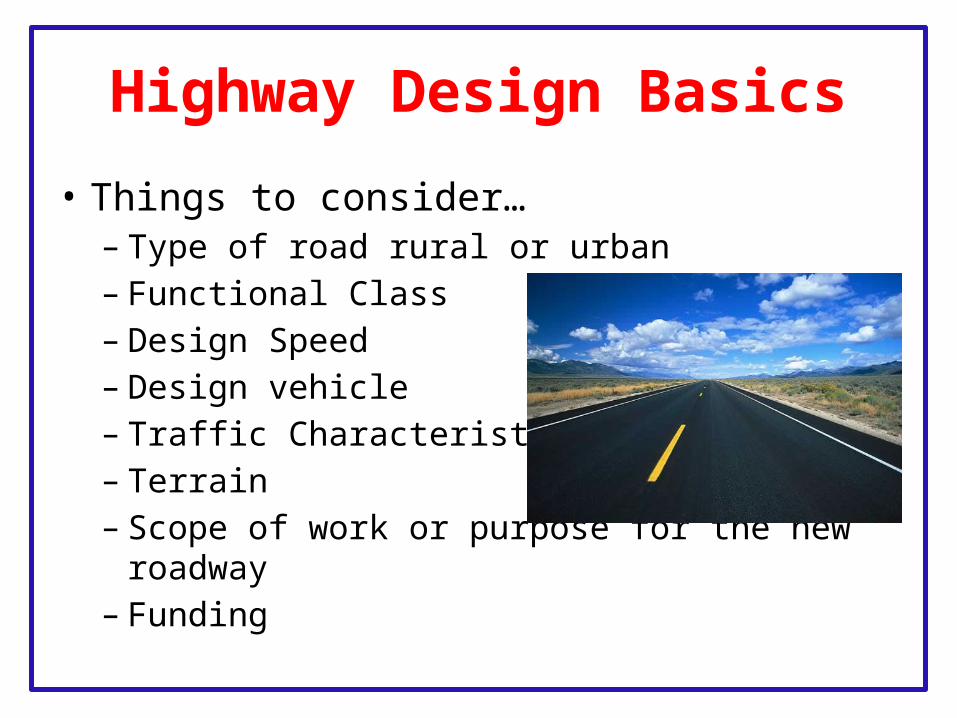
Highway Design Basics
• Things to consider…– Type of road rural or urban– Functional Class– Design Speed– Design vehicle– Traffic Characteristics– Terrain– Scope of work or purpose for the new roadway– Funding

Functional Class
• Arterial: main movement; high mobility and limited access
• Collectors: link between arterials and local roads; moderate mobility and access
• Locals: allows access to properties; low mobility and high access
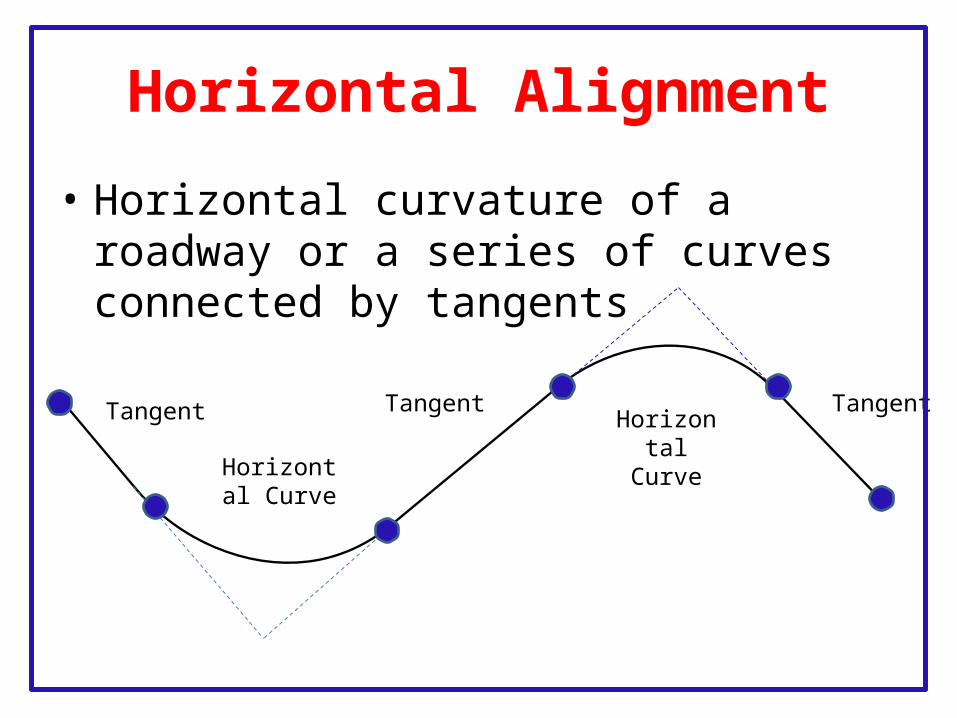
Horizontal Alignment
• Horizontal curvature of a roadway or a series of curves connected by tangents
Tangent
Horizontal Curve
Horizontal Curve
Tangent Tangent
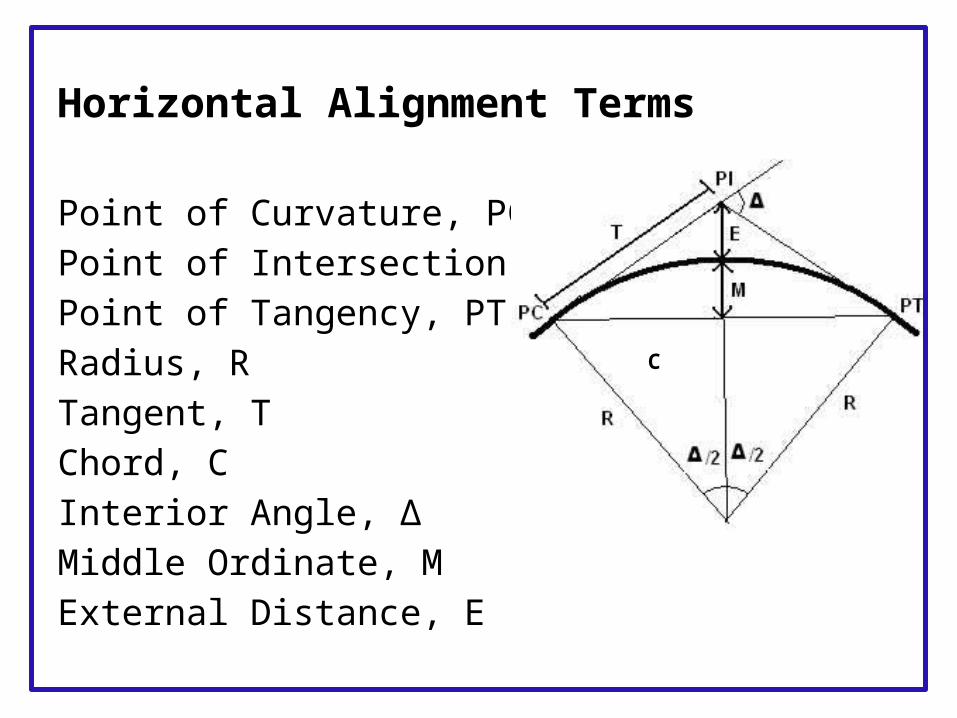
Horizontal Alignment Terms
Point of Curvature, PCPoint of Intersection, PIPoint of Tangency, PTRadius, RTangent, TChord, CInterior Angle, ΔMiddle Ordinate, MExternal Distance, E
C
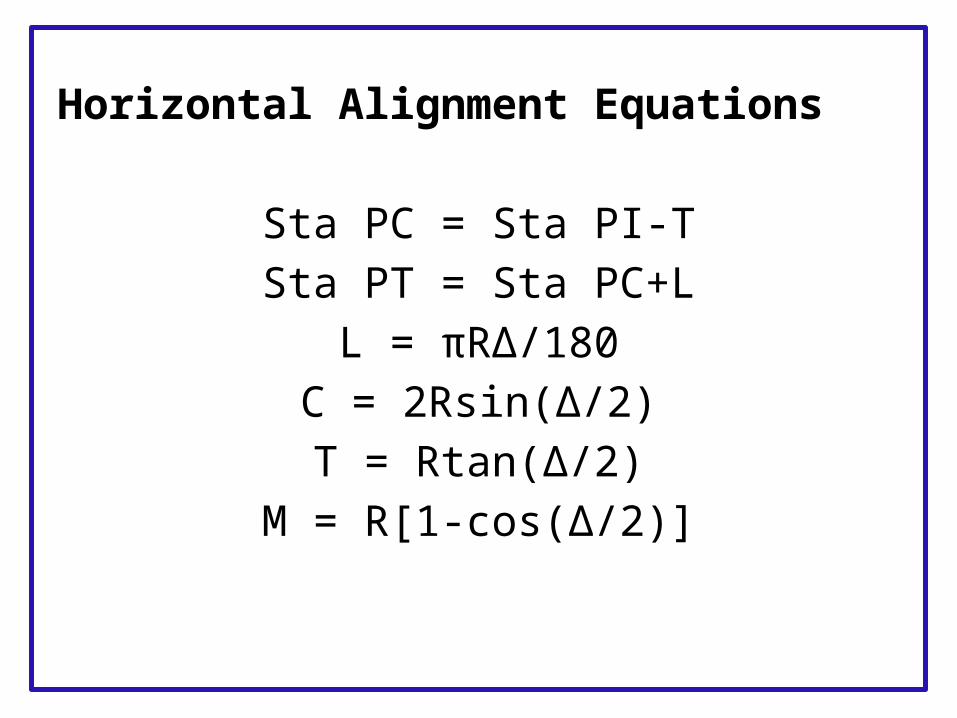
Horizontal Alignment Equations
Sta PC = Sta PI-TSta PT = Sta PC+L
L = πRΔ/180C = 2Rsin(Δ/2)T = Rtan(Δ/2)
M = R[1-cos(Δ/2)]
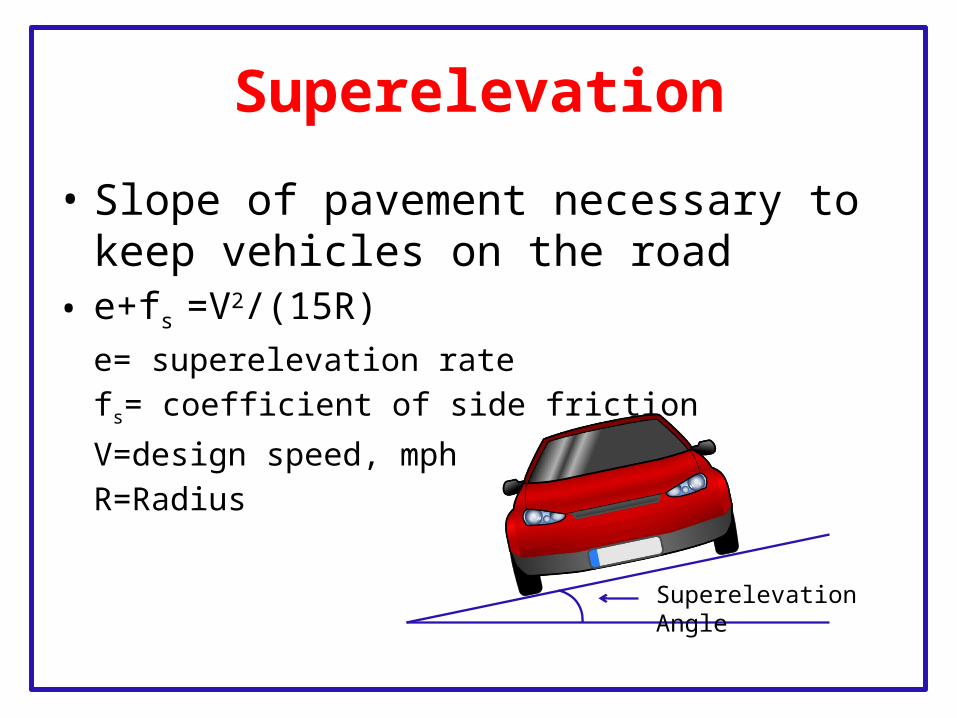
Superelevation
• Slope of pavement necessary to keep vehicles on the road
• e+fs =V2/(15R)e= superelevation ratefs= coefficient of side friction
V=design speed, mphR=Radius
Superelevation Angle
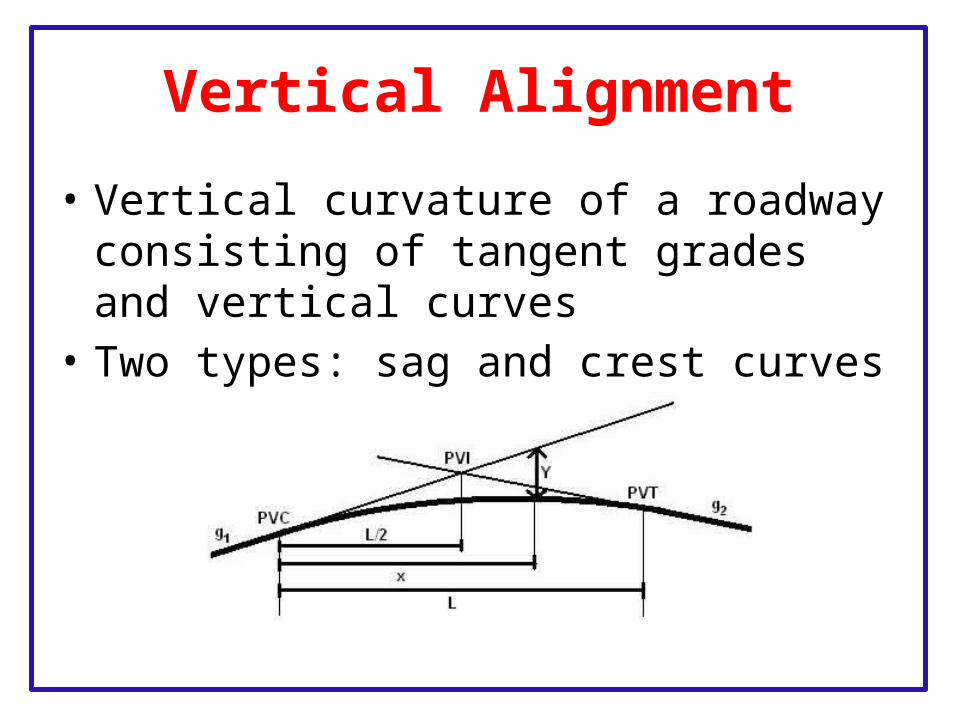
Vertical Alignment
• Vertical curvature of a roadway consisting of tangent grades and vertical curves
• Two types: sag and crest curves

Vertical Alignment Terms
Beginning of Curve, PVCVertex/Intersection, PVIEnd of Curve, PVTVertical Grade, gLength of Curve, L

Vertical Alignment Equations
Sta PVC = Sta PVI – L/2HPVC = HPVI – g1*L/2Sta PVT = Sta PVI + L/2HPVT = HPVI + g2*L/2
Minimum Curve Lengths
**A=|g2-g1|*100 (%)**SSD: Stopping Sight Distance
Crest Sag
SSD<L A*SSD2/2158 A*SSD2/(400+3.5SSD)
SSD>L 2SSD-(2158/A) 2SSD-(400+3.5SSD)/A
Sight Distance
• Sight Distance: length of roadway that is visible to the driver
• Stopping Sight Distance: Distance that is necessary for a vehicle traveling at design speed to come to a stop
• Passing Sight Distance: Distance required for a vehicle traveling at design speed to pass another vehicle
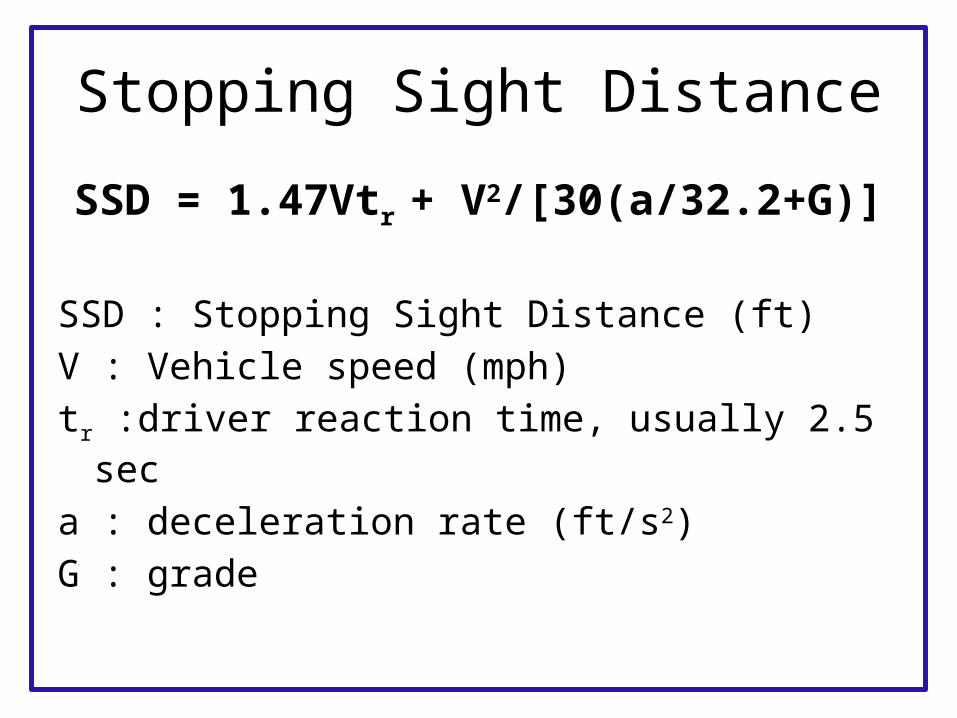
Stopping Sight Distance
SSD = 1.47Vtr + V2/[30(a/32.2+G)]
SSD : Stopping Sight Distance (ft)V : Vehicle speed (mph)tr :driver reaction time, usually 2.5 sec
a : deceleration rate (ft/s2)G : grade
Design Criteria
• All roadway design criteria is based on AASHTO’s green book or A policy on Geometric Design of Highways and Streets
• The green book is used as a guide by roadway designers