highway planning and operations for the dallas district ... · mghw ay planning and operations for...
TRANSCRIPT

1. Report No. 2. Government Accession No.
TX-98/1994-16S 4. Title and Subtitle
mGHW AY PLANNING AND OPERATIONS FOR THE DALLAS DISTRICT: FREEWAY SYSTEM PLAN :METHODOLOGY
7. Author(s)
John C. Brunk, Mark D. Middleton, and Carol H. Walters
9. Performing Organization Name and Address
Texas Transportation Institute The Texas A&M University System College Station, Texas 77843-3135 12. Sponsoring Agency Name and Address
Texas Department of Transportation Research and Technology Transfer Office P. O. Box 5080 Austin, Texas 78763-5080
15. Supplementary Notes
T ecbnical Report Documentation Page
3. Recipient's Catalog No.
S. Report Date
November 1997 6. Performing Organization Code
8. Performing Organization Report No.
Report 1994-16S
10. Work. Unit No. (TRAJS)
11. Contraa or Grant No.
Study No. 7-1994 13. Type of Report and Period Covered
Project Summary: September 1996 - August 1997 14. Sponsoring Agency Code
Research perfonned in cooperation with the Texas Department of Transportation. Research Study Title: Highway Planning and Operations for the Dallas District: Freeway System Plan Methodology 16. Abstract
The System Planning Methodology was developed jointly by the Texas Department of Transportation (TxDOT), North Central Texas Council of Governments (NCTCOG), Dallas Area Rapid Transit (DART), and Texas Transportation Institute (TTI) as a transportation corridor and system analysis tool that would bridge the gap between regional planning and detailed corridor design. It allows for the examination of peak hour person movement for different facility types within a corridor and estimates associated public costs (e.g., right-of-way, construction, operation, congestion, and environmental costs). The objective of the methodology is to find the lowest total public cost alternative. This project extends the methodology to include costs associated with traffic incidents (nonrecurrent congestion) and tests the results on five corridors in the Dallas area to determine if it alters the recommended alternative previously identified for each corridor. It also adds toll lanes and high occupancy/tollianes (HOT) as alternatives that can be evaluated against other combinations of general purpose lanes, high occupancy vehicle (HOV) lanes, and express lanes.
17. KeyWords
Transportation Planning, Corridor Planning, Alternatives Analysis, Multimodal Analysis, Toll Roads, HOV Lanes, HOT Lanes, Major Investment Studies, Nonrecurrent Congestion, Cost Estimation
18. Distribution Statement
No restrictions. This document is available to the public through NTIS: National Technical Infonnation Service 5285 Port Royal Road Springfield, Virginia 22161
19. Security Classif.(ofthis report)
Unclassified 20 Security Classif.(ofthis page)
Unclassified 21. No. of Pages
50 I 22. Price
Form DOT F 1700.7 (8-72) Reprodudit.n of eomp1eted page authorized


IMPLEMENTATION RECOMMENDATIONS
This project was intended to enhance the System Planning Methodology (SPM) that was developed by the Texas Department of Transportation (TxDOT), North Central Texas Council of Governments (NCTCOG), Dallas Area Rapid Transit (DART), and Texas Transportation Institute (TTl) as a transportation corridor and system analysis tool that would bridge the gap between regional planning and detailed corridor design. Limited funding for transportation improvements make it more important than ever that the facilities recommended for implementation move the most people for the lowest overall cost. The results of this project should be implemented in the following ways:
1. Nonrecurrent congestion resulting from incidents on the roadway do not affect the type of facility that should be constructed in any given corridor. However, the method employed to estimate nonrecurrent congestion in this study indicates that its effect on traffic flow may be even greater than previously thought. This indicates that continued emphasis should be placed on the deployment of effective incident management programs in congested areas. The revised System Planning Methodology can be used to help estimate these effects in support of these programs.
2. The best alternatives in high demand corridors will generally include general purpose lanes in combination with high occupancy vehicle (HOV) or high occupancy vehicle/toll (HOT) lanes. Feasibility studies for major corridors in Texas should include a comprehensive examination ofHOV and HOT lane alternatives.
3. The System Planning Methodology is an effective tool for examining many different corridor alternatives with limited data. It should be utilized in major investment studies and corridor studies to assist in the quick assessment of many different alternatives.
This report should be distributed to TxDOT districts and MPOs in urban areas to maximize its effectiveness.
v

DISCLAIMER
The contents of this report reflect the views of the authors who are responsible for the opinions, findings, and conclusions presented herein. The contents do not necessarily reflect the official views of the Texas Department of Transportation (TxDOT). This report does not constitute a standard, specification, or regulation, nor is it intended for construction, bidding, or pennit purposes. The engineer in charge was Carol H. Walters, P.E. #51154.
Vll
ACKNOWLEDGMENT
The System Plan Methodology is the result of several research projects and more than seven years of collaborative effort between the Texas Department of Transportation (TxDOT), North Central Texas Council of Governments (NCTCOG), Dallas Area Rapid Transit (DART), and the Texas Transportation Institute (TTl). The authors wish to acknowledge the contributions made by each of these agencies. In particular, the enhancements included in this project have been successfully completed with assistance from Jim Hunt and Stan Hall from the Dallas District of TxDOT, and Michael Morris, Dan Kessler, and Mike Copeland from NCTCOG.
VIII

TABLE OF CONTENTS
Page
LIST OF FIGURES .......................................................... x
LIST OF TABLES .......................................................... x
S~Y .............................................................. xi
I. INTRODUCTION ...................................................... 1 Description of the System Planning Methodology . . . . . . . . . . . . . . . . . . .. . . . . . . . . . . 1 Purpose of this Research ................................................ 2
n. REVIEW OF PREVIOUS WORK .......................................... 5 Original System Planning Methodology and Revisions .......... . . . . . . . . . . . . .... 5 Nonrecurrent Congestion ................................................ 6 Toll Lanes ....... . . . . . . . . . . . . . . . . . . . . . . . . . . . . . . . . . . . . . . . . . . . . . . . . . ... 8
m. IMPROVEMENTS TO THE METIIODOLOGY .............................. 11 Nonrecurrent Congestion Effects ......................................... 11 Toll Effects ......................................................... 14 Additional Factors .................................................... 15 Spreadsheet Functionality ............................................... 16
IV. TESTING THE REVISED METIIODOLOGY ............................... 17 Identification of Test Corridors .......................................... 17 Comparison with Original SPM Recommendations ............................ 17 Performance of Toll Lane Alternatives ..................................... 24 Comparison with Mobility 2020 Recommendations ........................... 26
V. RECOMMENDATIONS/CONCLUSIONS .................................. 33 Results of IncIuding Nonrecurrent Costs and Toll Lanes ........................ 33 Application in the Transportation Planning Process ........................... 34 Future Enhancement to the System Planning Methodology ...................... 35
REFERENCES ............................................................ 37
IX

Figure 1.
Table 1. Table 2. Table 3.
Table 4.
Table 5.
Table 6.
Table 7.
Table 8. Table 9. Table 10. Table 11.
Table 12.
Table 13.
Table 14.
Table 15.
LIST OF FIGURES
Page
Incident Frequency on Freeways ..................................... 8
LIST OF TABLES
Page
Percent Capacity Remaining During an Average Freeway Incident ........... 7 Test Corridors ................................................. 17 Testing the Effect of Nonrecurrent Congestion Interstate 30 from SH 360 to 1H35E ................................. 19 Testing the Effect of Nonrecurrent Congestion Interstate 30 from the Dallas CBD to Belt Line Road .................... 20 Testing the Effect of Nonrecurrent Congestion Interstate 635 from Royal Lane to US 75 ........... . . . . . . . . . . . ....... 21 Testing the Effect of Nonrecurrent Congestion Interstate 635 from US 75 to !H2O .................................. 22 Testing the Effect of Nonrecurrent Congestion State :Highway 161 from !H2O to IH635 . . . . . . . . . . . . . . . . . . . . . . . ....... 23 All Toll Lanes: Interstate 30 from SH 360 to 1H35E ..................... 24 General Purpose and Toll Lanes: Interstate 30 from SH 360 to 1H35E ....... 25 General Purpose and HOT Lanes: Interstate 30 from SH 360 to IH35E ...... 25 Application of Revised System Planning Methodology Interstate 30 from SH 360 to IH35E ................................. 27 Application of Revised System Planning Methodology Interstate 30 from the Dallas CBD to Belt Line Road .................... 28 Application of Revised System Planning Methodology Interstate 635 from Royal Lane to US 75 ............................. 29 Application of Revised System Planning Methodology Interstate 635 from US 75 to !H2O . . . . . . . . . . . . . . . . . . . . . . . . . . . . ...... 30 Application of Revised System Planning Methodology State :Highway 161 from !H2O to IH635 .............................. 31
x

SUMMARY
The System Planning Methodology was developed jointly by the Texas Department of Transportation (TxDOT), North Central Texas Council of Governments (NCTCOG), Dallas Area Rapid Transit (DARn, and Texas Transportation Institute (TTl) as a transportation corridor and system analysis tool that would bridge the gap between regional planning and detailed corridor design. It allows for the examination of peak: hour person movement for different facility types within a corridor and estimates associated public costs (e.g., right-of-way, construction, operation, congestion, and environmental costs). The objective of the methodology is to find the lowest total public cost alternative.
This project was intended to enhance the System Planning Methodology by addressing two primary objectives: (1) modifY the approach used to estimate costs associated with traffic incidents (nonrecurrent congestion) and test the results on five corridors in the Dallas area to determine if it alters the recommended alternative previously identified for each corridor; and, (2) add toll lanes and high occupancy/toll lanes (HOT) as alternatives that can be evaluated against other combinations of general purpose lanes, high occupancy vehicle (HOV) lanes, and express lanes.
The results of this project confirmed previous work that low and moderate demand facilities are best served by improving general purpose lanes in the corridor and, in some cases, adding express lanes.
It was thought that the introduction of nonrecurrent costs might cause the addition of general purpose lanes to become the preferred alternative for high demand corridors, but results from the test corridors showed that HOV lanes continue to be part of the best solution. Nonrecurrent congestion did not have a significant impact on the determination of the best alternative.
The evaluation of toll lanes in the test corridors showed that congested corridors with all toll lane or general purpose/toll lane combinations did not perform as well as alternatives that included a combination of general purpose and HOV lanes based on the lowest total public cost criteria. However, alternatives that combined general purpose lanes with HOT lanes tended to perform as well as and slightly better, in some cases, than HOV lanes.
In general, the System Planning Methodology suggests that any lanes added to an existing, high demand facility should be either HOT or HOV lanes. This recommendation must be tempered by the fact that HOT lanes represent a new approach to serving travel demand, and there are many public policy, implementation, and operations issues that need to be examined before HOT lanes can be given an unqualified endorsement.
The best application of the System Planning Methodology will be in major investment studies and corridor studies because it (1) allows sufficient time to develop input data to a greater level of detail and to test the sensitivity of the model to variations in the inputs, (2) matches the level of detail commonly found in these studies, and (3) can then be used as an input into the regional transportation planning process that must be updated every three years.
Xl


I. INTRODUCTION
DESCRIPTION OF THE SYSTEM PLANNING METHODOLOGY
The System Planning Methodology (SPM) was developed jointly by the Texas Department of Transportation (TxDOT), North Central Texas Council of Govemments (NCTCOG), Dallas Area Rapid Transit (DART), and Texas Transportation Institute (TTl) to provide a transportation analysis tool that would help bridge the gap between regional mobility planning and detailed corridor analysis (1). Since the transportation plans developed by different agencies tend to reflect the initial assumptions and priorities of those agencies, there was also a need to develop a tool that would help to provide system compatibility as the planned projects moved towards implementation. In other words, it was the intent of the SPM to ensure that the various elements of the transportation system worked together so that the capacity available in each segment could be utilized to its maximum.
In order to achieve these basic objectives, the SPM was developed as an iterative approach that evaluates alternatives for each corridor, then looks at how the best alternatives in each corridor fit together to form a system.
Corridor Analysis
The "corridor analysis" begins with the collection of required data input items, including travel data (existing and design year daily volumes for freeways, HOV lanes, bus systems, and transit systems; percent of daily traffic in the peak hour, peak hour directional splits, and peak hour truck percentages), roadway data (existing lanes, right-of-way limits, roadway structures, and buildings adjacent to the corridor), and information on planned projects in the region. These data are input into the SPM spreadsheets to evaluate a variety of cross section alternatives for a corridor. Cross sections can include a mix of facility types, such as general purpose lanes, high occupancy vehicle (HOY) lanes, and express lanes. Given a particular volume of peak hour person trips, the spreadsheets determine the critical lane volumes for each facility type based on known relationships and capacity constraints which recognize that people will change their travel behavior when given the opportunity to avoid congestion. Finally, a total net present cost is calculated to rank the performance of the various alternatives in the corridor. The original System Plan considered capital (rehabilitation, construction, and right-of-way), operating and maintenance, and congestion delay as costs. Subsequent refinements to the methodology have added other costs (e.g., environmental and congestion from incidents) into the evaluation. The alternative with the lowest total net present cost is considered to be the "best" alternative for that corridor and is used as the initial input into the system analysis.
System Analysis
The "system" analysis looks at the results of the corridor analysis to determine if the "best" alternatives for each corridor will operate efficiently as a transportation system. If there are lane
1

balance or continuity problems between adjoining or intersecting corridors, then lower ranking alternatives for a particular corridor may be considered to ensure system compatibility.
The original SPM was developed in conjunction with the NCTCOG Mobility 2010 Plan Update in 1992 and was used as one of the inputs in the decision making process for that study. Refinements to the methodology were subsequently undertaken as a part of two research studies (2,3). These studies modified the spreadsheets to include additional HOV data and extended the public cost model to include environmental costs (fuel consumption, air quality, noise, and visual impacts), congestion delay costs associated with incidents (nonrecurrent congestion), and costs associated with commercial vehicles.
PURPOSE OF THIS RESEARCH
Reexamination of Nonrecurrent Congestion Effects
One of the most important findings of the original System Planning study was that the best alternatives for congested corridors tended to include the addition ofHOV lanes and a limitation on the number of general purpose lanes so that they experience peak hour congestion. In other words, the lowest total public cost alternative involved a tradeoff of reducing capital costs and accepting increased congestion (delay) costs on the general purpose lanes in order to encourage increased HOV formation. However, the public cost model in the original SPM did not include "nonrecurrent" congestion costs, and since the number of incidents rises with the level of congestion and nonrecurrent delay from incidents accounts for at least as much delay as recurrent congestion, there was some concern that the inclusion of nonrecurrent delay costs might lead to different conclusions.
SPR Project 1451, completed in 1995, included the first effort to incorporate the cost effects of "nonrecurrent" congestion into the SPM. An application of the revised methodology to evaluate a section ofIB] Freeway (lli635) east of Central Expressway (US 75) as part of its Major Investment Study (MIS) revealed that the current approach would generate little or no nonrecurrent costs when analyzing a freeway with high congestion levels. Subsequent tests also showed that recurrent congestion costs were inflated for longer roadway sections.
This research will address these issues and test the revised model using data from the original System Plan to determine if the inclusion of nonrecurrent congestion costs significantly changes the recommended alternatives.
Incorporation of Toll Road Effects
Under the 1991 Intermodal Surface Transportation Efficiency Act (ISTEA), NCTCOG was charged with developing a capital-constrained, long- range transportation plan for the DallasIFt. Worth region based on the levels of funding expected to be available. In response to a substantial revenue shortfall for transportation projects, the local MPO adopted a requirement that toll roads be considered in
2

addition to tax-financed roads throughout the region. This could make a substantial difference in the conclusions regarding peak hour person movement.
In addition, the MIS for LBJ Freeway in Dallas was recently completed that recommended a portion of the reconstructed freeway include eight general purpose lanes and six high occupancy/toll (HOT) lanes. The combination of toll lanes and preferential treatment for high occupancy vehicles is a new option that was implemented on California's SR 91 in 1996 and is being considered for several other facilities around the country.
Previous work on the SPM did not allow for toll lanes to be explicitly evaluated as part of the methodology. It has been recommended that toll lanes be handled in a similar manner to rail transit, i.e., estimate the demand for the toll lanes outside of the SPM spreadsheet and remove it from the corridor demands being served by the freeway. Provided that the final plan derived from the system planning methodology is similar to the assumed system that generated the toll demand, the results should be considered valid.
This research responds to the renewed focus on toll lanes and their potential to be coupled with HOV lanes by extending the SPM spreadsheets to explicitly include toll lanes as an option when considering cross section alternatives in a corridor. The revised methodology will be applied in five corridors using data from the NCTCOG Mobility 2020 planning process to compare results with the recommendations that came out of the traditional planning process.
Spreadsheet Revisions to Improve Functionality and Updated User Manual
As the SPM is expanded to include alternative options and costs, there are opportunities to revise the structure of the spreadsheet to make it more efficient and user friendly. These changes will be documented in this report and an updated user manual provided in an appendix.
3


II. REVIEW OF PREVIOUS WORK
ORIGINAL SYSTEM PLANNING METHODOLOGY AND REVISIONS
The System Planning Methodology has been developed and enhanced as a part of three previous research projects conducted between 1989 and 1996. The original SPM was jointly developed by TxDOT, NCTCOG, DART, and TTl to help bridge the gap between the planning level work being done at a regional level and the detailed corridor designs being prepared by the Dallas District of TxDOT. It was initially applied in Dallas to assist the NCTCOG in preparation of their Mobility 2010 Update for the Dallas/Ft. Worth region. This effort established the basic framework for the methodology which has not changed significantly with subsequent enhancements. Some key elements of the SPM approach are summarized below (1):
• The SPM utilized peak hour person movement as the primary unit of analysis because different transportation modes are more or less efficient at moving people. The number of persons forecast to be traveling in a particular corridor was held constant; then, different facility alternatives for the corridor were analyzed to see how they performed.
• The :facility types that were explicitly evaluated in the SPM were general purpose, HOV, and express lanes.
• The HOV relationships used to predict the amount of carpool formation relative to the level of congestion in adjacent general purpose lanes were based on data from Houston HOV lanes.
• The "least total public cost" approach was adopted as the primary measure to determine the best alternative for each corridor. Initially, costs included right-of-way, construction, operation, and recurrent congestion delay.
• After analyzing corridors individually, the "best" alternatives were evaluated relative to other intersecting corridors to ensure that the pieces worked together as a system.
• The most significant finding was that in high demand corridors, the lowest cost alternative would generally be a combination of general purpose lanes, operating with some congestion, and HOV lanes providing a travel time advantage for persons willing to shift to carpools or transit to avoid congestion costs.
Incorporating Intermodalism into Freeway System Planning
This project was sponsored by the Southwest Region University Transportation Center (project #465030) and was intended to enhance the SPM by improving the estimation ofHOV ridership and delay associated with congestion, and by accounting for some additional costs in the "total public cost" calculation. The report's findings can be summarized as follows (3):
5

• This project sought to advance the HOV ridership relationship by analyzing data from HOV systems in operation across the country. However, it was determined that variations in data collected and differences in project/urban area characteristics were substantial enough that it would be best to utilize data from Texas projects to predict ridership.
• The method to estimate delay due to recurrent congestion from the original SPM was reviewed and changed to better reflect real freeway lane capacity and flow conditions. A linear relationship of volume to delay and speed was approximated to improve the congestion cost methodology. The relationship between freeway speed and alternate route speed in the original method was found to be sound after an evaluation of additional travel data and was not altered.
• Additional costs considered in this project included energy, emissions, and congestion costs for commercial vehicles. Fuel consumption rates were derived using the ARFCOM computer program, and emission rates were obtained from the MOBlLE5a model. The amount of fuel consumption or emissions was estimated using an average speed methodology that takes the daily travel in a given corridor and multiplies it by the applicable rate based on the average speed in that corridor. This approach resulted in good estimates for fuel consumption, but emission estimates were not included in the revised methodology because of inaccuracies in the MOBlL5a estimates that are the subject of other current research projects. The cost estimate per hour for trucks was obtained from the American Trucking Association and was used to estimate the annual cost of congestion for commercial vehicles.
Multimodal System Planning Technique - An Analytical Approach to Peak Period Operation
TxDOT sponsored the last project undertaken to expand on the SPM (project #1451), and it was designed to organize information about the methodology so that it could be used as an analysis tool by planners and engineers to examine transportation corridors anywhere in Texas (2). The most significant addition to the methodology in this project was the inclusion of "nonrecurrent congestion," or congestion caused by incidents in the estimation of total public cost. The next section describes the approach that was developed to estimate nonrecurrent congestion.
NONRECURRENT CONGESTION
Nonrecurrent congestion is generally understood to be a result of incidents that cause a reduction of roadway capacity. Because incidents have a wide variation in the impact on a freeway, it was necessary to determine the impact on the freeway of a "typical" incident. The percent reduction in freeway capacity from a typical incident was estimated using data found in the literature (4) as well as data obtained from Motorist Assistance Patrols in the Dallas area. The percent reduction in freeway capacity from a typical incident is shown in Table 1.
6

Table 1. Percent Capacity Remaining During an Average Freeway Incident
Number of Lanes Percent Remaining Capacity
in Each Direction
2 75%
3 82%
4 85%
5 87%
6 89%
The frequency of incidents was estimated using data observed in the Dallas area, which resulted in a rule-of-thumb value of about one incident per 40,000 vehicle kilometers (25,000 vehicle miles). However, the frequency of incidents appears significantly higher where recurrent congestion occurs. In Dallas, the available data suggested that in heavy congestion, the number of normal incidents is one per 24,000 vehicle kilometers (15,000 vehicle miles).
Figure 1 is a graphical depiction of the potential relationship between incident frequency and recurrent congestion. On freeways, any speed below 64 kph (40 mph) indicates the presence of congestion. If a linear relationship is positioned between speeds below 64 kph (40 mph) and an increasing frequency of incidents, up to a maximum value of one per 24,000 vehicle kilometers (15,000 vehicle miles) at speeds of 16 kph (10 mph), then the expected frequency of incidents for a given speed could be taken from this graph and used with the above estimates of capacity reductions for the average incident, based upon the number of freeway lanes.
Since the SPM refined in the 1451 project may, in some cases, create justification for increased congestion under the lowest-public-cost criteria, it was important to attempt some assessment of the full impacts of congestion, including an increased frequency of incidents. This study utilized the rough, but defensible, methodology described above to estimate the cost impacts of increasing incidents due to congestion. Costs were limited to increased delay. Although the costs of incidents themselves, to those involved and to the public agencies responsible for their clearance, could be significant, their inclusion would have required more extensive research on the types of incidents which increase in congestion situations and a more reliable basis for incident frequency estimates. This level of detail was considered beyond the scope of the SPM.
7

TOLL LANES
"" o
48
g 40 ~
I
I
I o o
I
/ /:
/.'"
I
I
l i
16 32 48 64 80 96 Speeds (kph)
Figure 1. Incident Frequency on Freeways
Researchers conducted a literature review to find methods of establishing a relationship between toll road usage and freeway congestion. A keyword search using WinSPIRS 2.0 was made of the Transport database. The Transport database is made up of entries from the Transportation Research Board as well as several other transportation libraries. Though the search did not identify a source of information that has established a relationship between freeway congestion and toll road usage, there is an increasing body ofliterature reporting on congestion pricing issues and the development of HOT lanes.
Many of the reports focused on the SR91 Express Lanes east of Los Angeles in Orange County, California, as well as some of the other demonstrations of congestion pricing or HOT lanes that are now underway or being developed (5). The SR91 Express Lanes are four dedicated lanes -- two in each direction -- in the median of the SR91 freeway. The free lanes and the dedicated lanes are separated by a buffer and pylons. The dedicated lanes are restricted to HOVs with three or more passengers traveling free or other passenger vehicles if they pay a toll ranging from $0.50 during the
8

off peak to $2.75 during the peak period. The only other HOT lane project that has been implemented to date is the llI15 congestion pricing project in San Diego, California. llI15 is an eight-lane freeway with a two-lane, reversible HOV lane operating during the morning and evening peak hours in its median. The HOV lanes are separated by barriers from the mainlanes, and access to the lanes is available only at the two endpoints of the facility. The first phase of this project has opened these lanes to SOVs, provided that they have purchased one of the limited number of monthly passes. The next phase of the project, scheduled for early 1998, will automate toll collection for the lanes (7).
The level of interest in HOT lanes as a fucility type that can be used to encourage higher occupancies and generate revenue to help pay for transportation improvements is growing. There are currently two projects in Texas that incorporate the HOT lane concept. The first is a project on the Katy HOV lane in Houston that currently operates as a three person HOV facility. This project will permit a limited number of two person carpools to pay a toll to access the HOV lane (7). The other HOT lane project is being undertaken by TxDOT as a part of their work to redesign LBJ Freeway (llI635) in North Dallas. The approved :MIS recommends the addition of six HOT lanes between Stemmons (llI35E) and Central Expressway (US 75), while maintaining eight general purpose lanes (8).
Discussions with representatives from the Texas Turnpike Authority (TT A) and NCTCOG indicated that much of the travel forecasting work that has been done for toll roads has been conducted by private consulting firms to establish financial feasibility, and that their analysis procedures are considered proprietary. The NCTCOG includes toll roads in their travel demand forecasting model by assigning an impedance in the roadway assignment model that reflects the cost of the toll (9). This was referred to as the "generalized cost equation" and was determined to be the best available approach for incorporating toll lanes into the SPM because it would provide a direct relationship between the congestion delay experienced on general purpose lanes and the cost of using a toll lane. The implementation of this approach will be discussed in greater detail later in this report.
9


III. IMPROVEMENTS TO THE METHODOLOGY
NONRECURRENT CONGESTION EFFECTS
Application of the methodology indicated that the system effects of nonrecurrent congestion were not being :fully included when a conidor was already congested as result of recurrent congestion. The primary problem of the initial method for estimating the additional delay due to nonrecurrent congestion is the assumption that.the lowest acceptable speed for traffic on freeways was 24 kph (IS mph). This was based on a delay of 1.9 minutes a km (3 minutes a mile) over a free flow speed of 97 kph (60 mph). For recurrent congestion, this assumption remains valid since it basically assumes that traffic will shift to a different start time or divert to alternative routes when delay reaches 1.9 minutes a km (3 minutes a mile). However, since incidents are unpredictable, it must be assumed that vehicles will not have the opportunity to shift or divert from congestion resulting from an incident. In other words, due to incidents, minimum speeds must be assumed to be lower than 24 kph (IS mph).
By using the assumed minimum speed of24 kph (IS mph), no additional nonrecurrent delay costs were estimated in sections where the estimated speed was already 24 kph (IS mph) due to recurrent congestion. The problem was only realized in sections with extreme congestion where demand greatly exceeds capacity (demand greater than 2400 vphpl). Since no sections with excessive demands were reviewed when nonrecurrent congestion was first added to the methodology, this problem was not recognized.
The System Plan method, as presented in the 1451 report, was used to analyze several alternatives for the Eastside ofLBI from US80 to US75 Central Expressway as part of the LBI MIS process. The alternatives analyzed ranged from a no action alternative to an alternative with 10 mainlanes and four HOV lanes. One of the primary premises of the SPM is that each alternative for a conidor moves the same number of person trips, which means alternatives with fewer lanes will have greater demands per lane. This premise is essential for comparing conidor alternatives. Basically, the results· of the initial method showed that alternatives with a high recurrent congestion cost, such as the no action alternative, had little or no nonrecurrent congestion cost, which appeared illogical when compared to other alternatives.
Listed below are the steps used to calculate the nonrecurrent congestion cost in the SPM as included in the 1451 report (2):
A. Using Figure 1 and calculated speeds per section, determine vehicle-distance per incident. B. Determine vehicle-distance per hour for sections under analysis. C. Divide B by A to determine number ofincidents per hour. D. Obtain percent of remaining freeway capacity from Table 1 based on number oflanes. E. Multiply D x 2200 vphpl to reach a per lane adjusted capacity value per incident. F. Utilize E to anive at adjusted speeds using the volume to speed relationship.
11

G. Check Figure 1 to detennine whether adjusted speed (G) alters the incident frequency, and iterate (repeat steps Band C ifneeded).
H. Calculate delay per incident. 1. Multiply the delay per incident (l) and the number of incidents per hour (C) to arrive at the delay
per hour.
An example of the initial method is worked out below. In the example, average incident delay per vehicle resulted in a change from 72 kph (45 mph) to 24 kph (15 mph) per vehicle for the 2.0 kilometer (1.2 mile) section. This is equivalent to a loss of 3.2 minutes per vehicle on a typical day in the peak hour.
Example: 3 lanes, 2.0 km (1.2 miles) long, demand of2200 vphpl in the critical section.
A. The volume to speed relationship gives a speed = 72 kph (45 mph) and, from Figure 1,40,000 veh-km (25,000 veh-miles) per incident.
B. 2200 vphpl x 3 lanes x 2.0 km (1.2 miles)= 13,200 veh-km (7,920 veh-miles) in the peak hour. C. 13,200 veh-km (7,920 veh-miles)/40,000 veh-km (25,000 veh-miles) per incident = 0.32 incidents
per peak hour. D. From Table 1, 82% capacity remaining per incident for a three-lane section. E. 82% x 2200 vphpl = 1804 vphpl adjusted capacity. F. 2200 vphpl demandl1804 vphpl capacity = 1.22 vIc, 1.22> 2400/2200 or 1.09 failure. Freeway
speeds will drop to 24 kph (15 mph). G. Checking Figure 1 gives an adjusted incident frequency of 26,900 veh-km (16,700 veh-miles) per
incident - iterate - repeat steps B and C. B. 1804 x 3 lanes x 2.0 km (1.2 miles) = 10,824 veh-km (6,494 veh-miles). C. 10,824/26,900 = OAO incidents per peak hour on the freeway at 24 kph (15 mph). H. 24 kph (15 mph) should be used to calculate the delay per incident. This will add an average of
352 vehicle hours of nonrecurrent delay per incident over the 2.0 kIn (1.2 mile) section. I. 352 vehicle hours per incident multiplied by OAO incidents per hour equals 141 vehicle hours of
delay per hour.
In step F of the initial method, for any alternative that has an adjusted volume to capacity ratio greater than 1.09, the speed will drop to 24 kph (15 mph). If the initial demand is 2400 vphpl, the volume to speed relationship gives an initial speed of24 kph (15 mph). The problem of not having any nonrecurrent congestion in this situation is readily apparent since there is no change in speed due to incidents - the speed remains at 24 kph (15 mph). The improved method simply establishes a linear relationship for speeds from 24 kph (15 mph) to 8 kph (5 mph), based on the demand to reduced capacity ratio. The lowest reduced capacity for "typical" incidents occurs for an incident in a two lane section at 1650 vphpl. The maximum demand is 2400 vphpl, so the theoretical maximum demand to capacity ratio where speed is 8 kph (5 mph) is 2400/1650 = lAS. The additional linear relationship included in step F significantly changes the end result for demand to capacity ratios greater than 1.09.
12

The example from above is shown below for the improved method:
A. The volume to speed relationship gives a speed = 72 kph (45 mph) and, from Figure 1,40,000 veh-km (25,000 veh-miles) per incident.
B. 2200 vphpl x 3 lanes x 2.0 km (1.2 miles)= 13,200 veh-km (7,920 veh-miles) in the peak hour. C. 13,200 veh-km (7,920 veh-miles)/40,OOO veh-km (25,000 veh-miles) per incident = 0.32 incidents
per peak hour. D. From Table 1, 82% capacity remaining per incident for a three lane section. E. 82% x 2200 vphpl = 1804 vphpl adjusted capacity. F. 2200 vphpl demand/1804 vphpl capacity = 1.22 vIc, 1.22> 2400/2200 or 1.09 failure. With the
improved relationship, the freeway speeds will now drop to 18.5 kph (11.5 mph). G. Checking Figure 1 gives an adjusted incident frequency of 24,900 veh-km (15,500 veh-miles) per
incident - iterate - repeat steps Band C. B. 1804 x 3 lanes x 2.0 km (1.2 miles) = 10,824 veh-km (6,494 veh-miles). C. 10,824/26,900 = OAO incidents per peak hour on the freeway at 24 kph (15 mph). H. 18.5 kph (11.5 mph) should be used to calculate the delay per incident. This will add an average
of 515 vehicle hours of nonrecurrent delay per incident over the 2.0 km ( 1.2 mile) section. 1 515 vehicle hours per incident multiplied by OAO incidents per hour equals 216 vehicle hours of
delay per hour.
The improved method results in an additional 75 veh-hours of congestion for the example shown.
Another problem identified with the initial method of estimating the nonrecurrent congestion costs was the assumption that the delay per incident occurred over the entire length of a section of the corridor. This had the result of creating higher delay in a long section over a short section, given the same conditions in both sections. For example, given a demand of 2200 vphpl for a three-lane section, the nonrecurrent delay for the 2.0 km (1.2 mile) section from the example above is 216 vehicle hours, and the nonrecurrent delay for a 8.0 km (5.0 mile) section would be 3749 vehicle hours. Given the same demand and lane conditions, the delay should be proportional to the length.
A better method of calculating the delay per incident was needed that did not have length as a factor. The queuing analysis equations from Traffic Flow Fundamentals by AdolfD. May (10) are ideal for estimating the delay due to incidents on freeways, given the level of data available with the SPM. To solve for the total delay per incident, only two additional variables are needed for the nonrecurrent congestion cost procedure: the average time of a 'typical' incident and a service flow rate for the duration of a 'typical' incident. A time of 30 minutes was used for the time of an incident. This assumes that an effective incident detection and response system is in place for all alternatives, and it is reflective of the fact that the majority of incidents are simple shoulder disablements (4). The service rate is not necessarily equivalent to the reduced capacity due to the speed volume relationship developed to estimate the recurrent congestion. If the initial volume demand to reduced capacity ratio is greater than 1.09, then the service rate is equivalent to the reduced capacity. If the vIc ratio is equal to or less than 0.84, then the service rate is equivalent to the initial demand, and there is no delay. However, for the vIc ratios between these two values, a service rate must be estimated. For
13

instance, the speed volume relationship of the methodology gives a speed of72 kph (45 mph) for a vIc ratio of one, and the service rate allows an equivalent delay to be estimated. The steps for the improved nonrecurrent congestion cost estimation procedure are listed below:
A. Determine vehicle-distance per hour for sections under analysis. B. Using Figure 1 and the estimated speeds per section, determine the vehicle-distance per incident. C. Divide B by A to determine number of incidents per hour. D. Obtain percent of remaining freeway capacity from Table 1, based on number oflanes. E. Multiply D x 2200 vphpl to reach a per lane reduced capacity value per incident. F. Utilize E to arrive at adjusted speeds using the volume to speed relationship. G. Check Figure 1 to determine whether adjusted speed (G) alters the incident frequency, and iterate
(repeat steps Band C if needed). H. Determine the service rate. I. Calculate the duration of queue. 1. Calculate the total delay per incident per lane. K. Multiply the total delay per incident (1) by the number of incidents per hour (C) and the number
oflanes to arrive at the delay per hour.
For the example, the improved delay equations result in a nonrecurrent congestion delay for the 2.0 km (1.2 mile) section of186 vehicle hours and a delay for the 8.0 km (5.0 mile) section of773 vehicle hours. The additional delay is directly proportional to the lengths of the two sections. The results of the improved procedure are more logical than previous results and should allow for a better comparison of alternatives.
TOLL EFFECTS
TTl worked with NCTCOG to utilize their travel forecast model to establish a relationship between travel demand and price. This relationship is key to developing algoritluns that define the effect that toll lanes have on mode of travel and various cost components. The eqUilibrium relationship for toll effects basically says that the dollar amount of toll collection is equivalent to the dollar amount of the recurrent congestion cost in the adjacent free lanes. In the revised SPM spreadsheet, there are three worksheets which adjust the corridor vehicle volumes for the different combinations of free lanes and toll lanes. The equilibrium equation is shown below:
v = volume of total vehicle demand V T = volume of tolled vehicles CT = cost of toll in $ per unit distance DT = delay of tolled vehicles in minutes per unit distance DF = delay of free vehicles in minutes per unit distance Tv = present value of time in $ per vehicle hour
14

The first worksheet estimates the toll volume for a corridor which is a fully dedicated tollway. The equilibrium relationship for a full tollway assumes that there are adjacent parallel arterial routes that have a constant delay of 1.86 minutes per km (3.0 minutes per mile). It is assumed that the delay on the adjacent parallel arterial routes is set by signals and does not vary due to volume or incidents.
The second worksheet estimates the tolled volume for a corridor which has a mix of toll lanes and free general purpose lanes. The tolled lanes are assumed to be physically separated from the free lanes and to have more limited access but no occupancy restrictions. These facilities are essentially the same as the express lane facilities from the SPM, the only difference being the toll.
The third worksheet estimates tolled volume for HOT lane corridors. The HOT lane corridors are essentially the same as the HOV corridors, with the exception that the excess capacity of the HOV lanes is "sold" to SOVs. This worksheet assumes a 2+ HOV occupancy. In essence, the model gives first priority to high occupancy vehicles by allowing them to use the HOT lane first, as ifit were an HOV-only lane. Single occupant vehicles are only allowed to use excess capacity available in the HOT lane. This approach may tend to overestimate HOV use for a HOT lane because it would not take into account drivers who may decide to pay a toll rather than form a carpool. This project did not develop an option for 3+ HOV s traveling free with all others paying a toll because of limited data from 3+ HOV facilities.
The potential annual revenue from toll lanes is calculated for all three options in the model. However, the effect of toll revenue does not affect the total public cost calculation because it is viewed as both a cost to the driver and a revenue that can be used to offset capital and/or operating costs. The net effect of toll revenue on total public cost was assumed to be zero.
ADDITIONAL FACTORS
The effects of transit, such as light rail transit, in a transportation corridor have not been included in the methodology due to the limited amount of available data. To properly calibrate the model, data from local transportation corridors are desired. The North Central Expressway (US 7S) corridor from Dallas to Plano will probably be the best corridor for studying the effects of a light rail transit line adjacent to a freeway, however, North Central Expressway is still under reconstruction, and the light rail line currently only extends through a fraction of the corridor from the CBD to Park Lane. Theoretically, the availability of rail transit adjacent to North Central should limit recurrent congestion on the freeway.
The effects of HOV lanes operating concurrently with mixed-flow lanes and on a circumferential facility are being studied under another task of this project. The amount of data available is too limited to draw any conclusions on the different relationships that may result between congested freeways and concurrent HOV lanes and between HOV lanes and congested circumferential freeways. The Stemmons Freeway (IH3SE) concurrent flow HOV lane opened in January of 1997, and the LBJ Freeway (ffi63S) concurrent flow HOV lanes opened in April of 1997.
IS

Previous research efforts examined costs associated with air quality impacts of different alternatives. The levels of emissions were estimated with emissions factors generated by the NCTCOG using the MOBII.E5a model. Many problems have been associated with the MOBILE5a model and this type of application of the emission factors, the primary problem being that the vehicle cycles used in the model are not necessarily similar to the type of driving associated with congested freeway conditions or high speed freeway conditions. Research projects from California and Georgia have been used to improve the MOBILE model. However, the MOBILE6 model is still in development, so the SPM spreadsheet has not been updated with respect to emission factors.
SPREADSHEET FUNCTIONALITY
The original SPM was contained within two Supercalc spreadsheets. The first spreadsheet was the DHV (Design Hour Volume) spreadsheet. With this sheet, each alternative for a corridor was run separately simply by changing the number of general purpose, express, and HOV lanes. The rest of the input data was the same for each alternative of a particular corridor and remained unchanged with the exception of3+ HOV alternatives. Occupancy rates and HOV volumes were changed for 3+ HOV alternatives, though the same congestion relationship was used to generate the 3+ HOV demands. The output for each alternative was then manually input into a single cost spreadsheet for each corridor. The cost spreadsheet estimated the construction cost, the right-of-way cost, the operation and maintenance cost, the peak hour congestion cost, and the total congestion cost to arrive at the total public cost.
Subsequent research projects modified the spreadsheets and switched them to a Quattro Pro format. The functionality of the spreadsheets remained largely the same. However, the addition of the environmental and nonrecurrent congestion costs to the cost spreadsheet did not allow all the alternatives for a particular corridor to run in a single spreadsheet. Depending on the number of sections in the corridor, only three or four alternatives could be run at a time. With the 1451 project, the name of the DHV spreadsheet was changed to the CLV (Critical Lane Volume) spreadsheet.
The large cost spreadsheets had become unwieldy and difficult to use, which was the primary incentive to combine the CL V spreadsheet with the cost spreadsheet. The combined result is a more concise and simpler spreadsheet, though each alternative is now run separately. The combined spreadsheet was prepared as an Excel spreadsheet. The new spreadsheet has several features to make it user-friendly and to allow for a more consistent comparison of various alternatives. All the input data and output data are contained on separate worksheets and can be printed on single sheets of paper. Each major function of the spreadsheet is contained on separate worksheets and, for most analyses, should not require any changes. Similar to the original DHV sheet, once all the input data is in place, the only changes needed for each alternative in a corridor is the number and combination oflanes. The new spreadsheet also calculates the costs for both directions of a corridor, as well as impacts beyond the shoulder hours. The details of the spreadsheet are discussed more completely in the user's manual contained in Appendix C.
16

IV. TESTING THE REVISED METHODOLOGY
IDENTIFICATION OF TEST CORRIDORS
Researchers identified five corridors to test the revised SPM. The corridors shown in Table 2 were chosen because they are all expected to be relatively high volume traffic corridors in the future, and they represent a mix of facility types (e.g., radial versus circumferential, existing versus new facility). This section will report on the effect of including nonrecurrent congestion costs in the methodology and whether the recommendations in the original SPM (using year 2015 volumes) might have been different if those costs had been considered. It will also compare results from the revised SPM with toll options against recommendations from the NCTCOG Mobility 2020 report (using year 2020 volumes).
Table 2. Test Corridors
Corridor Original SPM Mobility 2020
Recommendation Recommendation
1-30 (SH 360 to 1-35E) GPIHOV GPIHOV
1-30 (1-45 to Belt Line) GPIHOV GPIHOV
. 1-635 (SH 121 to US 75) GPIHOV GPIHOVrroll
1-635 (US 75 to 1-20) GPIHOV GPIHOV
SH 161 (IH 635 to 1-20) GPIHOV GPIHOVrroll
GP=General purpose freeway lanes I HOV=High occupancy vehicle lanes I ToIl=ToIllanes
COMPARISON WITH ORIGINAL SPM RECOMMENDATIONS
The tabulated results compare the lowest public cost from the original SPM from 1992 to the current expanded methodology for the five selected corridors. In addition to nonrecurrent congestion costs, the expanded methodology includes energy and environmental costs, full construction costs, costs for peak period, off-peak direction traffic, as well as improvements to the HOV ridership estimation procedure, right-of-way costs, and recurrent congestion costs. The shaded cells in Tables 3 through 7 show the preferred alternatives for the original and revised methodologies. The addition of nonrecurrent congestion costs was not responsible for changing the lowest cost alternative in any of the five corridors. Three of the corridors showed no change at all, while the other two had a change in the number of general purpose lanes because of other modifications to the SPM process since its original implementation.
17

In general, the alternatives that had the highest total public cost with the original SPM methodology remam the most expensive, with the addition of nonrecurrent congestion costs. As can be expected, the alternatives with higher capital costs will have low recurrent congestion cost, and the nonrecurrent congestion cost for these alternatives will also be low. With the addition of nonrecurrent congestion cost, there is less of a balance between capital and congestion costs for most alternatives, Le., the amount of congestion (sum of recurrent and nonrecurrent) becomes a more important factor in determining the alternative with the lowest public cost.
These results confinn the findings in the original SPM study that there is a significant cost benefit in high volume corridors for alternatives that allow some congestion on general purpose lanes and provide HOV lanes to encourage a mode shift to carpools or transit. The addition of nonrecurrent costs which increase with congestion are not sufficient to argue for a policy shift away from HOV lanes.
18
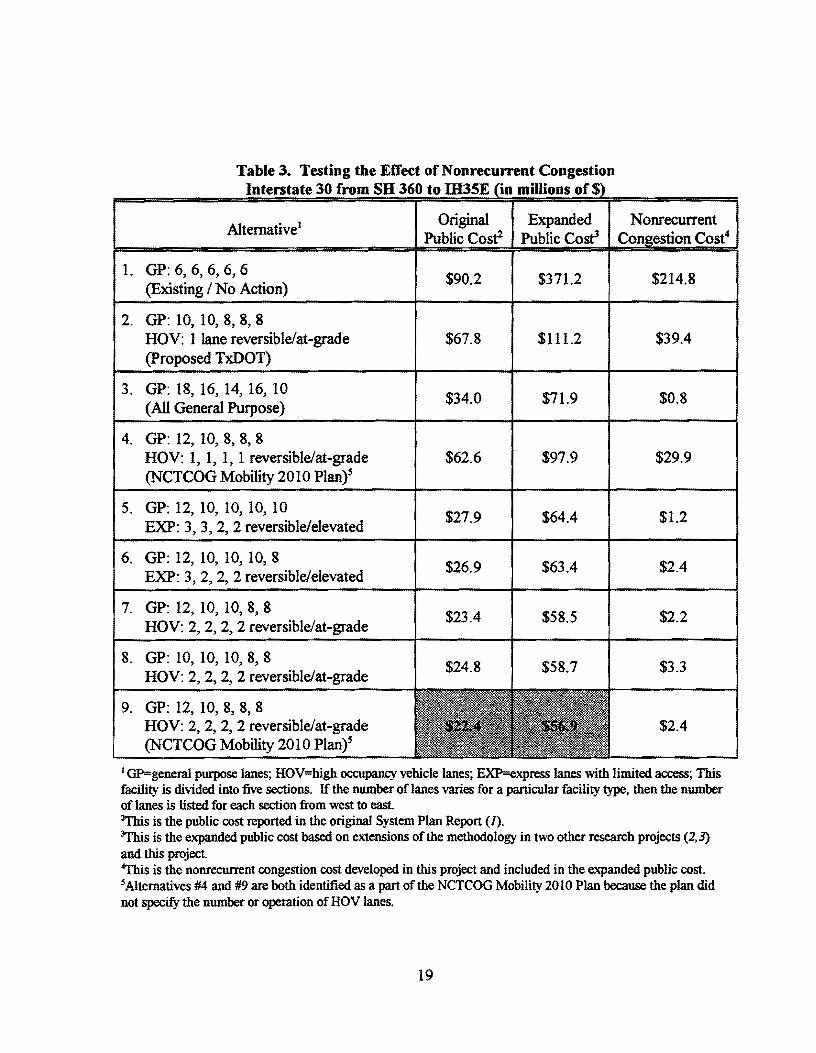
Table 3. Testing the Effect of Nonrecurrent Congestion Interstate 30 from SB 360 to m35E mUlions of
Original Expanded Public Cosf Public Cosf
Alternative l
1. GP: 6, 6, 6, 6, 6 (Existing I No Action)
$90.2 $371.2
2. GP: 10, 10,8,8,8 HOV: 1 lane reversible/at-grade $67.8 $111.2 (proposed TxDOT)
3. GP: 18, 16, 14, 16, 10 (All General Purpose)
$34.0 $71.9
4. GP: 12, 10, 8, 8, 8 HOV: 1, 1, 1, 1 reversible/at-grade $62.6 $97.9 (NCTCOG Mobility 2010 Plan)S
5. GP: 12, 10, 10, 10, 10 EXP: 3, 3, 2, 2 reversible/elevated
$27.9 $64.4
6. GP: 12, 10, 10, 10, 8 EXP: 3,2,2,2 reversible/elevated
$26.9 $63.4
7. GP: 12, 10, 10,8,8 HOV: 2, 2, 2, 2 reversible/at-grade
$23.4 $58.5
8. GP: 10, 10, 10, 8, 8 HOV: 2,2,2,2 reversible/at-grade
$24.8 $58.7
9. GP: 12, 10, 8, 8, 8 HOV: 2, 2, 2, 2 reversible/at-grade (NCTCOG Mobility 2010 Plan)S
Nonrecurrent Cost4
$214.8
$39.4
$0.8
$29.9
$1.2
$2.4
$2.2
$3.3
$2.4
1 GP=general purpose lanes; HOV=high occupancy vehicle lanes; EXP=express lanes with limited access; This facility is divided into five sections. If the number of lanes varies for a particular facility type, then the number of lanes is listed for each section from west to east. 2This is the public cost reported in the original System Plan Report (1). 3Jbis is the expanded public cost based on extensions of the methodology in two other research projects (2,3) and this project. .trbis is the nonrecurrent congestion cost developed in this project and included in the expanded public cost. s Alternatives #4 and #9 are both identified as a part of the NCTCOG Mobility 2010 Plan because the plan did not specify the number or operation ofHOV lanes.
19

Table 4. Testing the Effect of Nonrecurrent Congestion Interstate 30 from the Dallas CDD to Belt Line Road minions of
Alternativel Original Expanded Non-recurrent Public Cost Public Cost Cost
1. (JP: 10,8,8,8,6,8 $58.2 $200.9 $116.6
(Existing / No Action)
2. (JP: 10, 10, 10, 10,6,8 $53.1 $177.0 $99.6
(TSM)
3. (JP: 18, 18, 18, 14, 10, 10 $17.8 $58.4 $0.5
(All (Jeneral Purpose)
4. GP: 10, 10, 10, 10, 6, 8 EXP: 4, 4, 4, 4, 4 elevated
$23.1 $58.3 $1.0 HOV: 1, 1, 1, 1, 1 reversible/at-grade (NCTCOG Mobility 2010 Plan)
5. GP: 12, 12, 12, 10, 6, 8 $15.7 $47.1 $1.7
EXP: 2, 2, 2, 2, 2 reversible/at-grade
6. (JP: 10, 10, 10, 10, 6, 8 $14.8 $46.4 $1.9
EXP: 3, 3, 3, 2, 2 reversible/at-grade
7. (JP: 10,8,8,8,6,8 $8.5 $1.5
HOV: 2, 2, 2, 2, 1 reversible/at-grade
8. (JP: 10, 10, 8, 8, 6, 8 $8.9 $39.8 $1.5
HOV: 2,2,2,2, 1 reversible/at-grade
9. GP: 10, 10, 10, 8,6, 8 $40.6 $1.2
HOV: 2, 2, 2, 2, 1 reversible/at-grade
10. (JP: 10, 10, 10, 10,6, 8 $18.0 $42.7 $1.0
HOV: 2, 2, 2, 2, 1 reversible/at-grade
1 GP=general purpose lanes; HOV=higb occupancy vehicle lanes; EXP=express lanes with limited access; This facility is divided into six sections. If the number oflanes varies for a particular facility type, then the number of lanes is listed for each section from west to east.
20

Table 5. Testing the Effect of Nonrecurrent Congestion 635 from Lane to US 75 millions of
Alternativel Original Expanded Public Cost Public Cost
1. GP: 4, 6, 8, 8 $130.6 $492.9 $293.2 (Existing I No Action)
2. GP: 6, 10, 10, 10 EXP: 0,0,4,4 elevated
$47.9 $96.4 $8.1 HOV: 0, 1, 2, 2 at-grade (NCTCOG Mobility 2010 Plan)
3. GP: 4, 12, 18, 18 $42.3 $88.3 $2.1
(All General Purpose)
4. GP: 4, 10, 12, 14 $41.0 $86.2 $4.1
EXP: 0, 0, 4, 4 elevated
5. GP: 4, 10, 12, 12 $40.9 $86.2 $4.0
EXP: 0, 0, 4, 6 elevated
6. GP: 4, 10, 10, 10 $35.9 $85.1 $11.1
HOV: 0, 1,4, 4 elevated
7. GP: 4, 10, 10, 12 $8.3
HOV: 0, 1,4,4 elevated
8. GP: 4, 10, 10, 10 $32.6 $86.0 $10.0
HOV: 0, 1, 4, 6 elevated
1 GP=general purpose lanes; HOY=high occupancy vehicle lanes; EXP=express lanes with limited access; This facility is divided into four sections. If the number of lanes varies for a particular facility type, then the number of lanes is listed for each section from west to east
21

Table 6. Testing the Effect of Nonrecurrent Congestion Interstate 635 from US 75 to 1H20 millions of
Alternative1 Original Expanded Non-recurrent Public Cost Public Cost Cost
1. GP: 8, 8, 8, 8, 8 $48.7 $197.0 $96.3
(Existing I No Action)
2. GP: 10, 10, 10, 10, 10 HOV: 2, 2, 2 reversible/at-grade $17.8 $86.0 $2.2 (proposed TxDOT)
3. GP: 10, 10, 10, 10, 8 HOV: 1, 1, 1 reversible/at-grade $15.9 $83.4 $8.1 (NCTCOG Mobility 2010 Plan)
4. GP: 14, 12, 14, 10, 10 $22.5 $86.8 $0.8
(All General Purpose)
5. GP: 10, 8, 8, 10, 8 $11.2 $78.0 $5.4
EXP: 2, 2, 2 reversible/at-grade
6. GP: 10, 10, 10, 10, 8 $12.8 $80.5 $4.5
EXP: 2, 2, 2 reversible/at-grade
7. GP 8, 8, 8, 8, 8 $15.7 $80.4 $11.1
HOV: 2, 1, 1 reversible/at-grade
8. GP: 8, 8, 8, 8, 8 $13.6 $80.0 $10.5
HOV: 2, 2, 2 reversible/at-grade
9. GP: 10, 8, 8, 8, 8 $3.5
HOV: 2, 2, 2 reversible/at-grade
10. GP: 10, 10, 10, 10, 10 HOV: 2, 1, 1 reversible/at-grade $11.3 $76.6 $3.3 (NCTCOG Mobility 2010 Plan)
11. GP: 10, 10, 10, 10, 10 $12.2 $78.4 $2.9
HOV: 2, 2, 2 reversible/at-grade
12. GP 10, 10, 10, 10, 10 $15.8 $83.4 $8.1
HOV: 1, 1, 1 reversible/at-grade
1 GP=general purpose lanes~ HOV=high occupancy vehicle lanes; EXP=express lanes with limited access; This facility is divided into five sections. If the number of lanes varies for a particular facility type. then the number of lanes is listed for each section from west to east.
22

Table 7. Testing the Effect of Nonrecurrent Congestion 161 from IHlO to IH635 millions of
Alternative! Original Expanded Non-recurrent Public Cost Public Cost Cost
1. GP: 4,8,8,8 $75.7 $119.6 $43.4 (proposed TxDOT)
2. GP: 4, 8, 8, 10 HOY: 0,1,11 reversible/at-grade $48.9 $64.1 $1.9 (NCTCOG Mobility 2010 Plan)
3. GP:4,8,8,10 HOY: 0,2,2,2 reversible/at-grade $45.9 $65.2 $0.8 (NCTCOG Mobility 2010 Plan)
4. GP:4, 12, 14, 16 $50.5 $69.7 $0.3
(All General Purpose)
5. GP:4,6,8,10 $43.7 $2.0 EXP: 0, 2, 2, 2 reversible/at-grade
6. GP: 4, 6, 8, 10 $44.2 $61.8 $2.0 EXP: 0, 2, 2, 2 reversible/elevated
7. GP: 4,6,6,8 $42.0 $72.8 $11.8 HOY: 0, 2, 2, 2 reversible/at-grade
8. GP:4,6,6,8 $42.1 $72.9 $11.8 HOY: 0,2,2,2 reversible/elevated
9. GP:4,6,8,8 $40.4 $65.2 $5.5 HOY: 0,2,2,2 reversible/at-grade
10. GP: 4, 6, 8, 8 $65.4 $5.5 HOY: 0, 2, 2, 2 reversible/elevated
I GP=general purpose lanes; HOV=high occupancy vehicle lanes; EXP=express lanes with limited access; This facility is divided into four sections. If the number of lanes varies for a particular facility type, then the number oflanes is listed for each section from south to north.
23

PERFORMANCE OF TOLL LANE ALTERNATIVES
This section describes the perfonnance of toll lane alternatives for the 1H 30 corridor between SH 360 and 1lI35E, west of downtown Dallas. The first option considered is an "alI toll lane" alternative that would provide 10 to 12 lanes in this section. Table 8 compares this alternative with an alI general purpose alternative and a combination of general purpose and HOT lanes.
Table 8. AU ToU Lanes: Interstate 30 from SH 360 to IH35E
Alternative Total Peak Hour Congestion Total Lanes Occupancy Cost (mil$) Cost (mil$)
All Toll Lanes 10-12 1.24 $21.7 $75.2
All General Purpose Lanes 12-16 1.24 $0.6 $70.6
Combination General 8-10 1.45 $2.0 $54.1
Purpose and HOT Lanes
Table 8 illustrates the following key points about "alI toll lane" alternatives:
• "All toll lane" alternatives require fewer lanes than options with all free lanes because the tolls divert traffic to adjacent arterial routes. However, facilities with combinations of general purpose and HOTIHOV will generally require even fewer total lanes than one with alI toll lanes.
• The "all toll lane" does not provide any mode shift to carpools or transit and generally results in higher congestion costs and total costs than other alternatives.
• This toll alternative will generate the highest revenue, but this is not an advantage within the context of the SPM because tolls are not counted in the calculation of total public cost.
The next toll lane alternative combines general purpose lanes with toll lanes. Table 9 summarizes the results of this analysis including the following key points:
• Like the "all toll lane" alternative, this one provides no incentive for drivers to shift modes from single occupant vehicles to carpools or transit.
• Since the toll lanes operate below capacity (because of the price) and do not encourage higher occupancies, the general purpose lanes operate at higher levels of congestion. Consequently, this toll alternative will have higher congestion costs and total costs than alternatives with a combination of general purpose and HOVIHOT lanes.
• Toll revenue is only about 10 percent of the "all toll lane" alternative.
24

Table 9. General Purpose and Toll Lanes: Interstate 30 from SH 360 to m3SE
Alternative Peak Hour Congestion Total Occupancy Cost (milS) Cost (milS)
Combination General Purpose and 1.24 S7.8 S66.5
Toll Lanes
Combination General Purpose and 1.45 S2.1 S54.2
HOVLanes
Combination General Purpose and 1.45 S2.1 S54.1
HOT Lanes
The last toll alternative involves a combination of general purpose lanes and HOT lanes. Table 10 shows the results of this analysis.
Table 10. General Purpose and HOT Lanes: Interstate 30 from SH 360 to ffi3SE
General HOV/HOT Congestion Total
Alternative Purpose Lanes
Lanes Cost (milS) Cost (milS)
Combination General 8 1-2 S2.1 S54.2 Purpose and HOV Lanes
Combination General 8 1-2 S2.1 S54.1
Purpose and HOT Lanes
Combination General 6 2-4 S2.5 S52.5
Purpose / New Lanes HOT
This table illustrates the following key points about combined general purpose lanes and HOT lanes:
• The HOT lane combination is very competitive with HOV options in congested corridors. Depending on the level of excess capacity in an HOV -only lane that is available to "sell" in the form of a toll, an HOT lane option should perform better than a comparable HOV alternative because it draws additional drivers out of the general purpose lanes and, therefore, decreases their congestion level.
• Building all "new" lanes as HOT lanes (no new general purpose lanes) may be best, but this will add congestion to the existing general purpose lanes. Adding some of the HOT lanes as reversible lanes helps offset this penalty with lower capital costs.
• Revenues are only about one percent of the "all ton Jane" option.
25

COMPARISON WITH MOBll.ITY 2020 RECOMMENDATIONS
The regional transportation plan for the DallaslFt. Worth area was completed in late 1996 by the NCTCOG and is called the "Mobility 2020 Plan." The last step in this project was to use the revised System Planning Methodology to evaluate the :five test corridors using year 2020 traffic volumes and compare the results of this analysis with the recommendation contained in the Mobility 2020 Plan. Tables 11 through 15 summarize the results of this analysis for each of the :five corridors -- the lowest cost alternative and the Mobility 2020 recommendation are highlighted in each table.
The Mobility 2020 recommendations perfonned well in four out of five corridors; although none of its recommendations was the lowest total cost alternative. Only the SH 161 recommendation that included use of toll lanes in the northern segments was significantly higher, more than double, the lowest total cost alternative. The SPM generally preferred alternatives that included HOT lanes, with HOV combinations only slightly more costly. In some cases, the number of general purpose lanes needed was reduced under the SPM recommendation. The results of the SPM in these corridors would be helpful in refining plans for these corridors. Naturally, many other factors would corne into play that might make a higher cost alternative the ''best'' one in a particular case.
26

Table 11. Application of Revised System Planning Methodology Int,~njtatf" 30 from SH 360 m35E of
Alternative1
1. GP: 6, 6, 6, 6, 6 (Existing I No Action)
2. GP: 16, 14, 14, 14, 12 (All General Purpose)
4. GP: 10, 8, 8, 8, 6 EXP: 2, 2 reversible/at-grade 2,3,2
reversible/elevated (General Purpose & Express)
5. GP: 10, 8, 8, 8, 6 TOLL: 2, 2 reversible/at-grade 2,3,2
reversible/elevated (General Purpose & Toll)
6. GP: 8, 8, 8, 8, 8 HOV: 2,2,2,2, 1 reversible/at-grade (General Purpose & HOV)
Total Public Cost
$356.0
$70.6
$62.2
$66.5
$54.2
I GP=general purpose lanes; HOV=high occupancy vehicle lanes; EXP=express lanes with limited access; TOLL=tolllanes; HOT=high occupancy/toUlanes. This facility is divided into five sections. If the number of lanes varies for a particular facility type, then the number of lanes is listed for each section from west to east.
27

Table 12. Application of Revised System Planning Methodology Intentate 30 from Dallas CBD to Belt Line Road millions of
Altemative1
1. GP: 10, 8, 8, 8, 6, 8 (Existing I No Action)
2. GP: 18, 18, 18, 18, 14, 16 (All General PUrpose)
4. GP: 10, 10, 10, 10, 8, 8 EXP: 3, 3, 3, 3 reversible/elevated, 2, 2
reversible/at grade (General Purpose & Express)
5. GP: 10, 10, 10, 10,8, 8 TOLL: 3, 3, 3, 3 reversible/elevated, 2, 3
reversible/at grade (General Purpose & Toll)
Total Public Cost
$364.1
$83.1
$75.21
$78.75
1 GP=general purpose lanes; HOV=high occupancy vehicle lanes; EXP=express lanes with limited access; TOLL=tolllanes; HOT=high occupancy/tollianes. This facility is divided into six sections. If the number of lanes varies for a particular facility type, then the number of lanes is listed for each section from west to east.
28

Alternative1
1. GP: 4; 10,8, 8 (Existing / No Action)
2. GP:8, 14, 14, 16 (All General Purpose)
4. GP:6, 10, 10, 10 EXP: 2, 2 reversible/at-grade, 4, 4
bi-directional/elevated (General Purpose & Express)
5. GP:6, 10, 10, 10 TOLL: 2, 2 reversible/at-grade, 4, 4
bi-directionaVelevated (General Purpose & Toll)
7. GP: 6, 8, 8, 8 HOT: 1,2 reversible/at-grade, 4,6
bi-directionaVelevated (General Purpose & HOT)
Total Public Cost
$562.5
$98.9
$100.8
$106.9
$86.6
I GP=general purpose lanes~ HOV=high occupancy vehicle lanes; EXP=express lanes with limited access~ TOLL=tolllanes~ HOT=high occupancy/toIllanes. This facility is divided into four sections. If the number oflanes varies for a particular facility type. then the number of lanes is listed for each section from west to east
29
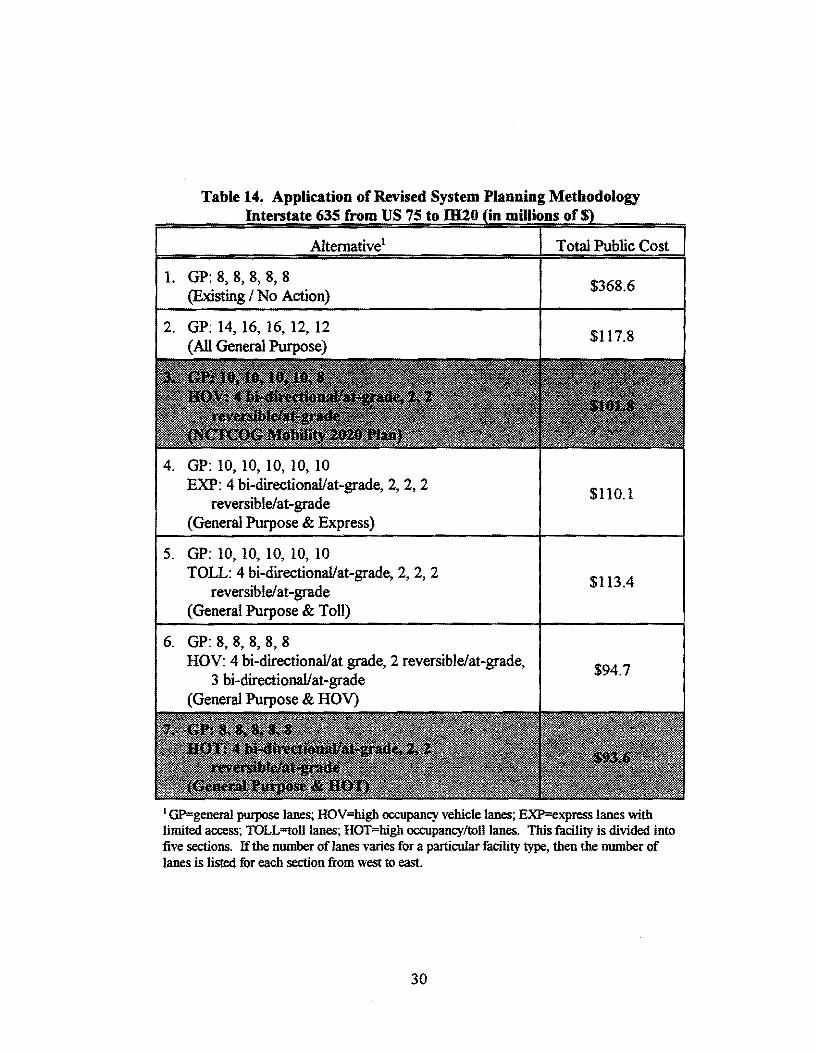
Table 14. Application of Revised System Planning Methodology Interstate 635 from US 75 to IH20 millions of
1. GP: 8, 8, 8, 8, 8 (Existing / No Action)
2. GP: 14, 16, 16, 12, 12 (All General Purpose)
4. GP: 10, 10, 10, 10, 10 EXP: 4 bi-directionallat-grade, 2, 2, 2
reversible/at-grade (General Purpose & Express)
5. GP: 10, 10, 10, 10, 10 TOLL: 4 bi-directionallat-grade, 2, 2, 2
reversible/at-grade (General Purpose & Toll)
6. GP: 8, 8, 8, 8, 8 HOV: 4 bi-directionallat grade, 2 reversible/at-grade,
3 bi-directionallat-grade (General Purpose & HOy)
Total Public Cost
$368.6
$117.8
$110.1
$113.4
$94.7
I GP=general pwpose lanes; HOV=high occupancy vehicle lanes; EXP=express lanes with limited access; TOLL=tolllanes; HOT=high occupancy/tollianes. This facility is divided into five sections. If the number of lanes varies for a particular facility type, then the number of lanes is listed for each section from west to east.
30

Table 15. Application of Revised System Planning Methodology State 161 from IH20 to m635 mUlions of
Altemative1
1. GP: 4, 8, 8, 8, 8 (proposed TxDOT)
2. GP: 8, 10, 10, 12, 14 (All General Purpose)
4. GP: 4, 6, 8, 8, 8 EXP: 2,2,2,2 reversible/at-grade, 4
bi-directionaIlat-grade (General Purpose & Express)
5. GP: 4, 6, 6, 8, 8 TOLL: 2, 2 reversible/at-grade 4, 4, 4
bi-directionaVat-grade (General Purpose & Toll)
6. GP: 4, 6, 6, 8, 8 HOV: 1, 1 reversible/at-grade, 2, 2, 2
bi-directionaVat-grade (General Purpose & HOy)
Total Public Cost
$144.2
$74.3
$69.1
$75.4
$64.0
J GP=general purpose lanes; HOV=high occupancy vehicle lanes; EXP=express lanes with limited access; TOLL=tolllanes; HOT=high occupancy/toIllanes. This facility is divided into four sections. If the number of lanes varies for a particular facility type, then the number of lanes is listed for each section from south to north.
31


V. RECOMMENDATIONS/CONCLUSIONS
RESULTS OF INCLUDING NONRECURRENT COSTS AND TOLL LANES
This research has extended the SPM by correcting some problems associated with the spreadsheet's handling of nonrecurrent congestion costs and adding the option of examining toll lanes in the mix of alternative cross sections for a corridor. Application of the SPM prior to this study had concluded that, in practice, the outcomes of corridor analysis depended largely on travel demand. For example (1):
1) Corridors with low demand can typically be served by the existing design or by the existing design with some capacity improvements to the general purpose lanes.
2) Corridors with moderate demand can typically be served by the existing design (sometimes with capacity improvements to the general purpose lanes) and additional express lanes to serve the long distance trips.
3) Corridors with high demand are best served by the existing design with some capacity improvements to the general purpose lanes and an HOV facility. If a travel time advantage over the general purpose lanes is created for HOVs, an HOV lane will reduce the total number of vehicle trips in the corridor because of the mode shift to high occupancy vehicles.
The results of this project do not alter the initial findings as described under (l) and (2) above for low and moderate demand facilities.
It was thought that the introduction of nonrecurrent costs might cause the addition of general purpose lanes to become the preferred alternative for high demand corridors, but results from the test corridors showed that HOV lanes continue to be part of the best solution. It is generally believed that more than half of total freeway congestion in urban areas is the result of nonrecurrent congestion (2). The estimation of nonrecurrent congestion costs, as implemented by this project is showing nonrecurrent congestion levels ranging from 1.5 to 5 times the level of recurrent congestion. While these levels may be somewhat high, corridors that have multiple, barrier-separated facilities may be subject to greater congestion impacts from incidents. The absolute value of recurrent congestion estimated by the model could be modified by altering some of the assumptions regarding time required to remove an incident or the capacity reduction assumed per incident. For the purposes of this project, it was assumed that higher levels of nonrecurrent congestion indicated a conservative approach since the additional costs did not alter recommendations in the test corridors. It should also be noted that the high estimated costs associated with nonrecurrent congestion may suggest that the effect of incidents on traffic flow could be greater than generally assumed. This would support continued efforts to provide effective incident detection and response programs in heavily congested areas.
33

The evaluation of toll lanes in the test corridors showed that congested corridors with all toll lane or general purpose/toll lane combinations did not perform as well as alternatives that included a combination of general purpose and HOV lanes based on the lowest total public cost criteria. However, alternatives that combined general purpose lanes with HOT lanes tended to perform as well as and slightly better, in some cases, than HOV lanes. This is understandable since the model simply allows excess capacity in the HOV lanes (not used by HOVs) to be absorbed by SOVs willing to pay a toll. Congestion costs in the general purpose lanes are reduced somewhat, depending on the amount of capacity available in the HOV lanes and the number of SOY s who are willing to pay the toll. In general, the SPM suggests that any lanes added to an existing, high demand facility should be either HOT or HOV lanes. This recommendation must be tempered by the fact that HOT lanes represent a new approach to serving travel demand, and there are many public policy, implementation, and operations issues that need to be examined before HOT lanes can be given an unqualified endorsement.
From a revenue producing standpoint, an all toll facility will generate the highest level of toll revenue, followed by general purposeltolliane combinations, and general purposeIHOT lane combinations, respectively. This study clearly shows that HOT lanes (permitting 2+ HOV to ride free) should not be viewed as a major source of revenue to help pay for the construction or reconstruction of a facility. Revenue estimates indicate that a HOT lane will produce less than one percent of the revenue that an all toll lane facility would produce, depending on the amount of excess capacity that is available for single occupant vehicles in the HOT lane.
APPUCATION IN TRANSPORTATION PLANNING PROCESS
The original application of the SPM was done in conjunction with the NCTCOG Mobility 2010 Update completed in 1992. The results from the System Plan were used as an input to the decision making process for that study. The System Plan was not updated for use with the recently completed NCTCOG Mobility 2020 Plan largely because of the tight schedule followed by the MPO in developing alternative networks and design year forecasts, and seeking approval of a recommended plan. Discussions with representatives of the NCTCOG and TxDOT Dallas District during the course of this project point toward the application of the SPM as a tool in analyzing projects during their feasibility studies, i.e., major investment studies and corridor studies. This has several advantages, including:
1) time to develop input data to a greater level of detail and test the sensitivity of the model to variations in the inputs;
2) MISs and corridor studies are part ofTxDOT's feasibility phase of project development and are requiring higher levels of public involvement -- they provide a link between macro-level regional transportation planning and micro-level schematic design; and
3) results from these studies can be used as an input into the regional transportation plan that must be updated every three years.
34

FUTURE ENHANCEMENT TO THE SYSTEM PLANNING METHODOLOGY
HOT lanes are receiving a lot of attention around the country as a facility option that can increase person movement through its high occupancy component and revenue through its toll component. The current project has not attempted to evaluate every way that HOT lanes could be implemented. In particular, options that involve 3+ carpools riding free and single occupant vehicles andlor 2+ carpools paying a toll has not been examined because there is limited information available about factors that affect the formation of 3+ carpools. The SR91 project in Los Angeles is the first operating HOT lane that allows 3+ carpools to drive free while all other vehicles pay a toll. Data from this project should be available in the coming months and may provide the basis for a new research project that would extend the SPM so that it can effectively evaluate additional HOT lane options.
35


REFERENCES
1. Walters, C.H., et aI., ''The Dallas FreewaylHOV System Planning Study: Year 2015," Report No. 1994-7. Texas Transportation Institute, Texas A&M University System, College Station, TX, June 1995.
2. Walters, C.H., et aI., "Multimodal System Planning Technique: An Analytical Approach to Peak Period Operation," Report No. 1451-1F. Texas Transportation Institute, Texas A&M University System, College Station, TX, November 1995.
3. Walters, C.H., T. Lomax, D. Skowronek, and M.D. Middleton, "Incorporating Intermodalism into Freeway System Planning," Draft Report No. 465030-1, Texas Transportation Institute, Southwest Region University Transportation Center, College Station, TX, May 1996.
4. Lindley, Jeffrey A., "A Methodology for QuantifYing Urban Freeway Congestion," Transportation Research Record 1132, FHW A, U.S. Department of Transportation, 1987.
5. Fuhs, Chuck, Joe EI Harake, and Bill Stockton, "Tolling HOV Lanes: A Nationwide Perspective on Prospects and Experience," Technical Paper for the ITE 6-rt'- Annual Meeting, Boston, MA, August 1997.
6. "I-IS Congestion Pricing Project," San Diego Association of Governments, San Diego, CA, September 1997.
7. Stockton, Bill, et aI., "Priority Lane Pricing on the Katy HOV Lane in Houston: Feasibility Assessment," TRB Paper No. 971361, Texas Transportation Institute, Texas A&M University System, College Station, TX, January 1997.
8. LBJ Executive Board, "Report to Recommend a Locally Preferred Alternative (LPA) for Improvements to the IH. 635 (LBJ) Corridor from Luna Road to U.S. 80," Texas Department of Transportation, Dallas District, Dallas, TX, September 1996.
9. ''Multimodal Transportation Analysis Process (MTAP): A Travel Demand Forecasting Model," North Central Texas Council of Governments, Transportation Department, Arlington, TX, January 1990.
10. May, Adolf D., Traffic Flow Fundamentals, Prentice-Hall Inc., Englewood Cliffs, New Jersey, 1990.
37