highway safety manual, 1st edition, 2014 supplement -...
TRANSCRIPT

HSM-1-E3-L
ERRATA
March 2016 Dear Customer: Recently, we were made aware of some technical revisions that need to be applied to the Highway Safety Manual Supplement. Changes are reflected by color-coded highlights on individual pages throughout errata file. 2016 changes are highlighted in green.
Please scroll down to see the full erratum.
In the event that you need to download this erratum file again, please download from: http://downloads.transportation.org/HSM-1S-Errata.pdf.
In order to see color-coding on a hard copy printout, please select “Document and Markups” in the Print dialog box when selecting your print options so that highlighting will be displayed properly. Then, please replace the existing pages with the corrected pages to ensure that your edition is both accurate and current. AASHTO staff sincerely apologizes for any inconvenience.

Errata to the Highway Safety Manual, 1st Edition and Supplement 2016 errata changes in green (bold)
HSM-1S-E1 1 March 2016
Page Existing Text Corrected Text
Supplement
18-42 In Eq. 18-35:
8, , , , , ,1
, ,1
1.0
exp [ 10]
exp [ 10]
m
fs ac sv z c i c ii
m
s c i c ii
s
CMF P f
a W P f
b W
Make the following change to the equation:
8, , , , ,1
,1
1.0
exp [ 10]
exp [ 10]
m
fs ac sv z c ii
m
s c ii
s
CMF P
a W P
b W
18-43 In Eq. 18-36:
9, , , , , ,
1
tan , ,1
1.0
1.0
m
fs ac sv fi c i c ii
m
c i c ii
CMF P f
f P f
Make the following change to the equation:
9, , , , ,
1
tan ,1
1.0
1.0
m
fs ac sv fi c ii
m
c ii
CMF P
f P
18-52 In the first paragraph, last sentence; and the third paragraph, last sentence: “…is less than 0.75 ft, then it should…”
Make the following text change: “…is less than 0.75 ft, then Wicb should…”
19-67 Following Table 19-42 Please add the following text: “The curve entry speeds need to be calculated for all curves from milepost 0.0 to the end of the analysis segment. This may include segments of an adjacent ramp that are not included in the current analysis segment. For each curve, record the entry speed, the total length of the curve, and the length of the current analysis segment. Once the procedure on the following pages is completed, return to Equation 19-33. In this equation, the summation term only includes entry speeds and radii that have a length in the current analysis segment. All other curves analyzed should be ignored if they are not part of the current analysis segment.”
HIGHWAY SAFETY MANUAL SUPPLEMENT18-42
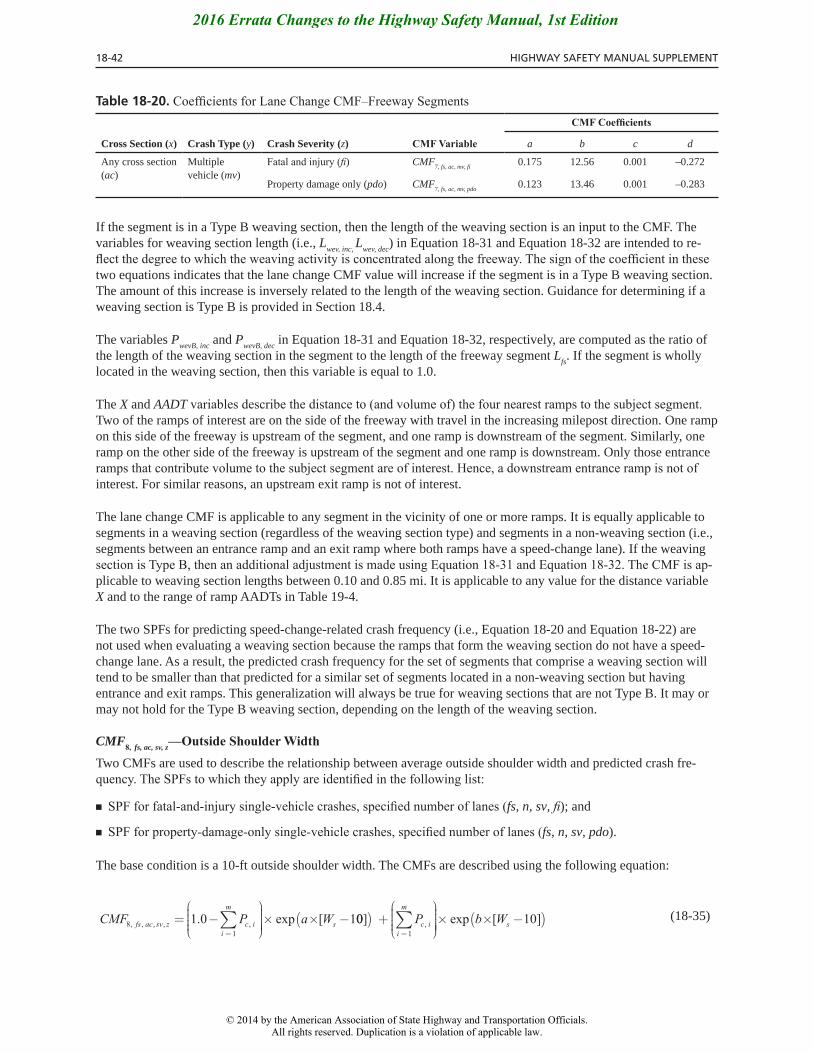
Table 18-20.
Cross Section (x) Crash Type (y) Crash Severity (z) a b c d
Any cross section (ac)
Multiple vehicle (mv)
) CMF7, fs, ac, mv, fi0.175 12.56 0.001 –0.272
Property damage only (pdo) CMF7, fs, ac, mv, pdo0.123 13.46 0.001 –0.283
If the segment is in a Type B weaving section, then the length of the weaving section is an input to the CMF. The variables for weaving section length (i.e., L
wev, inc, L
wev, dec) in Equation 18-31 and Equation 18-32 are intended to re-
two equations indicates that the lane change CMF value will increase if the segment is in a Type B weaving section. The amount of this increase is inversely related to the length of the weaving section. Guidance for determining if a weaving section is Type B is provided in Section 18.4.
The variables PwevB, inc
and PwevB, dec
in Equation 18-31 and Equation 18-32, respectively, are computed as the ratio of the length of the weaving section in the segment to the length of the freeway segment L
fs. If the segment is wholly
located in the weaving section, then this variable is equal to 1.0.
The X and AADTTwo of the ramps of interest are on the side of the freeway with travel in the increasing milepost direction. One ramp on this side of the freeway is upstream of the segment, and one ramp is downstream of the segment. Similarly, one ramp on the other side of the freeway is upstream of the segment and one ramp is downstream. Only those entrance
interest. For similar reasons, an upstream exit ramp is not of interest.
The lane change CMF is applicable to any segment in the vicinity of one or more ramps. It is equally applicable to segments in a weaving section (regardless of the weaving section type) and segments in a non-weaving section (i.e., segments between an entrance ramp and an exit ramp where both ramps have a speed-change lane). If the weaving
-plicable to weaving section lengths between 0.10 and 0.85 mi. It is applicable to any value for the distance variable X and to the range of ramp AADTs in Table 19-4.
The two SPFs for predicting speed-change-related crash frequency (i.e., Equation 18-20 and Equation 18-22) are not used when evaluating a weaving section because the ramps that form the weaving section do not have a speed-change lane. As a result, the predicted crash frequency for the set of segments that comprise a weaving section will tend to be smaller than that predicted for a similar set of segments located in a non-weaving section but having entrance and exit ramps. This generalization will always be true for weaving sections that are not Type B. It may or may not hold for the Type B weaving section, depending on the length of the weaving section.
CMF fs, ac, sv, z
Two CMFs are used to describe the relationship between average outside shoulder width and predicted crash fre-
■ fs, n, sv, ); and
■ fs, n, sv, pdo).
The base condition is a 10-ft outside shoulder width. The CMFs are described using the following equation:
(18-35)
2016 Errata Changes to the Highway Safety Manual, 1st Edition
© 2014 by the American Association of State Highway and Transportation Officials.All rights reserved. Duplication is a violation of applicable law.
CHAPTERS 18—Predictive Method for Freeways 18-43
Where:
CMF8, fs, ac, sv, z
ac, single-vehicle crashes sv, and severity z; and
Ws = paved outside shoulder width (ft).
Pc,i
is computed as the ratio of the length of curve i in the segment to the effective length of the freeway segment L*. The CMF is applicable to shoulder
ilength of curve i between the segment’s begin and end mileposts for roadbed 1 and that for roadbed 2, where each value excludes the length of any coincident speed-change lane that may be present and where the value for a given roadbed is zero if that roadbed is not curved.
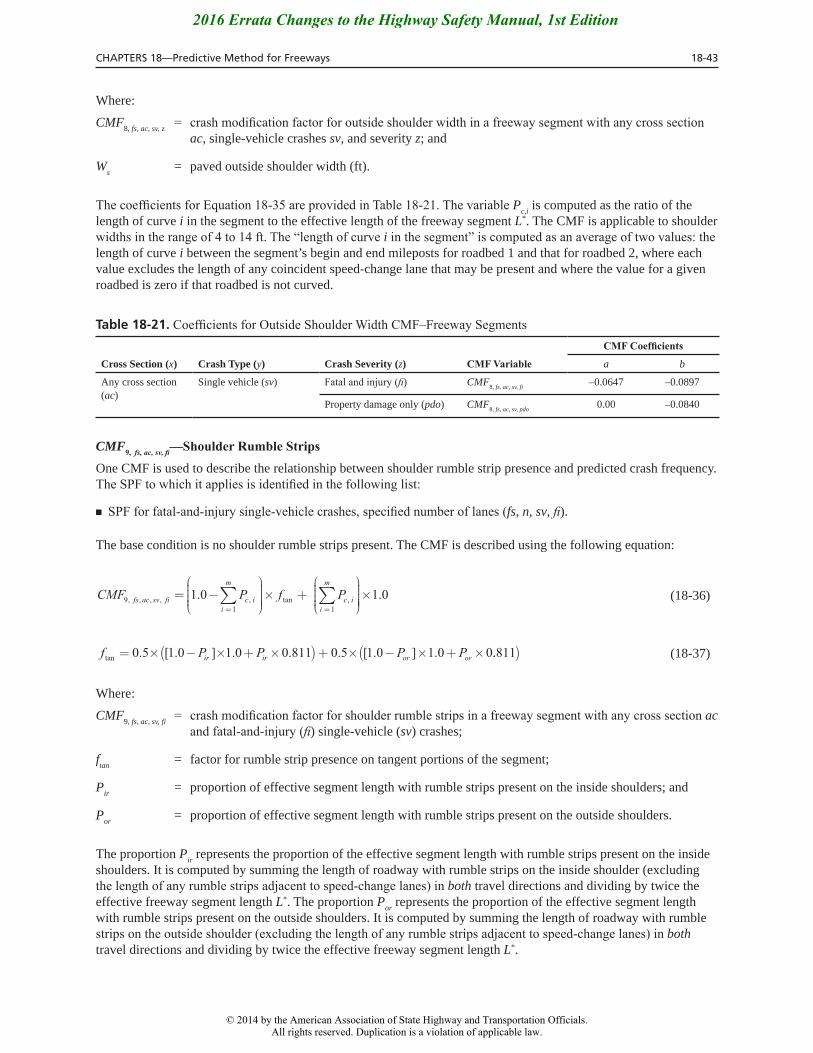
Table 18-21.
Cross Section (x) Crash Type (y) Crash Severity (z) a b
Any cross section (ac)
Single vehicle (sv) ) CMF8, fs, ac, sv, fi–0.0647 –0.0897
Property damage only (pdo) CMF8, fs, ac, sv, pdo0.00 –0.0840
CMF
One CMF is used to describe the relationship between shoulder rumble strip presence and predicted crash frequency.
■ fs, n, sv, ).
The base condition is no shoulder rumble strips present. The CMF is described using the following equation:
(18-36)
(18-37)f P P P Pir ir or ortan = × − × + ×( )+ × − × + ×0 5 1 0 1 0 0 811 0 5 1 0 1 0 0. [ . ] . . . [ . ] . ..811( )
Where:
CMF9, fs, ac, sv, fiac
) single-vehicle (sv) crashes;
ftan
= factor for rumble strip presence on tangent portions of the segment;
Pir = proportion of effective segment length with rumble strips present on the inside shoulders; and
Por
= proportion of effective segment length with rumble strips present on the outside shoulders.
The proportion Pir represents the proportion of the effective segment length with rumble strips present on the inside
shoulders. It is computed by summing the length of roadway with rumble strips on the inside shoulder (excluding both travel directions and dividing by twice the
effective freeway segment length L*. The proportion Por
represents the proportion of the effective segment length with rumble strips present on the outside shoulders. It is computed by summing the length of roadway with rumble
both travel directions and dividing by twice the effective freeway segment length L*.
2016 Errata Changes to the Highway Safety Manual, 1st Edition
© 2014 by the American Association of State Highway and Transportation Officials.All rights reserved. Duplication is a violation of applicable law.

HIGHWAY SAFETY MANUAL SUPPLEMENT18-52
the ratio of barrier length Lib, i
to clearance distance (= Woff, in, i
– Wis) should be computed for each individual length
of barrier that is found in the median along the segment (e.g., a barrier protecting a sign support). The continuous median barrier is not considered in this summation. Any clearance distance that is less than 0.75 ft should be set to
Wm
Wis – W
ibW
icb should be set to 0.75 ft.
-rier), the following equations should be used to estimate W
icb and P
ib.
(18-50)W L
LW W
LW W
L LW W W
icb
near is
ib i
off in i is
ib i
m is ib
=×
−+
−+
−
− × −∑
2
2,
, ,
,
−−∑ Wnear
(18-51)P
V
CV V V
fs sc ac at KK
sdf fs scK A B
+
+
=( )
+ ( )+ ( )+ (, , ,
,
exp. exp exp exp1 0 ))
Where:
Wnear
for both travel directions and use the smaller distance) (ft).
in the median. The ratio of barrier length Lib to the clearance distance (= W
off, in, i – W
is) should be computed for each
individual length of barrier that is found in the median along the segment. The continuous median barrier is not con-sidered in this summation. Any clearance distance that is less than 0.75 ft should be set to 0.75 ft. Similarly, if the
Wnear
– Wis
Wm
Wis – W
ib – W
nearW
icb should be set to 0.75 ft.
For segments or speed-change lanes with a depressed median and some short sections of barrier in the median (e.g., bridge rail), the following equations should be used to estimate W
icb and P
ib:
(18-52)WLL
W W
icbib i
ib i
off in i is
=
−
∑∑
,
,
, ,
(18-53)PLLibib i=×∑ ,
2
Any clearance distance (= Woff, in, i
– Wis) that is less than 0.75 ft should be set to 0.75 ft. When a freeway segment
is being evaluated, the proportion Pib represents the proportion of the effective segment length with barrier present
in the median. It is computed by summing the length of roadway with median barrier (excluding the length of any both travel directions and dividing by twice the effective freeway
segment length L*.
For segments or speed-change lanes with depressed medians without a continuous barrier or short sections of barrier in the median, the following equation should be used to estimate P
ib:
(18-54)Pib = 0 0.
2016 Errata Changes to the Highway Safety Manual, 1st Edition
© 2014 by the American Association of State Highway and Transportation Officials.All rights reserved. Duplication is a violation of applicable law.

Chapter 19—PREDICTIVE METHODS FOR RAMPS 19-67
The input data needed for this procedure are identified in Table 19-42. The first three variables listed represent re-quired input data. Default values are provided for the remaining variables.
Table 19-42. Input Data for Ramp Curve Speed PredictionVariable Description Default Value Applicable Site Type
Xi Ramp-mile of the point of change from tangent to curve (PC) for curve i (mi) a
None All
Ri Radius of curve i (ft) b None All
Lc, i Length of horizontal curve i (mi) None All
Vfrwy Average traffic speed on the freeway during off-peak periods of the typical day (mi/h)
Estimate as equal to the speed limit
All
Vxroad Average speed at the point where the ramp connects to the crossroad (mi/h)
15 – ramps with stop-, yield-, or signal-controlled crossroad ramp terminals
30 – all other ramps at service interchanges
Entrance ramp, exit ramp, connector ramp at service interchange
Vcdroad Average speed on C-D road or connector ramp (measured at the mid-point of the C-D road or ramp) (mi/h)
40 C-D road, connector ramp atsystem interchange
a If the curve is preceded by a spiral transition, then Xi is computed as equal to the average of the TS and SC ramp-mile locations, where TS is the point of change from tangent to spiral and SC is the point of change from spiral to curve.
b If the curve has spiral transitions, then Ri is equal to the radius of the central circular portion of the curve.
The curve entry speeds need to be calculated for all curves from milepost 0.0 to the end of the analysis segment. This may include segments of an adjacent ramp that are not included in the current analysis segment. For each curve, record the entry speed, the total length of the curve, and the length of the current analysis segment. Once the procedure on the following pages is completed, return to Equation 19-33. In this equation, the summation term only includes entry speeds and radii that have a length in the current analysis segment. All other curves analyzed should be ignored if they are not part of the current analysis segment.
Entrance Ramp ProcedureThis procedure is applicable to entrance ramps and connector ramps at service interchanges that serve motorists traveling from the crossroad to the freeway.
Step 1—Gather Input Data.The input data needed for this procedure are identified in Table 19-42.
Step 2—Compute Limiting Curve Speed.The limiting curve speed is computed for each curve on the ramp using the following equation:
(19-59)v Ri imax,.. .= × ×( )3 24 32 2 0 30
where vmax, i is the limiting speed for curve i (ft/s).
The analysis proceeds in the direction of travel. The first curve encountered is curve 1 (i =1). The value of vmax is computed for all curves prior to, and including, the curve of interest. The value obtained from Equation 19-59 repre-
2016 Errata Changes to the Highway Safety Manual, 1st Edition
© 2014 by the American Association of State Highway and Transportation Officials.All rights reserved. Duplication is a violation of applicable law.