hillsborough county port district, florida · hillsborough county port district, florida...
TRANSCRIPT


Hillsborough County Port District, Florida
Comprehensive Annual Financial Report
For Fiscal Year Ended September 30, 2009
Prepared by: Finance Department
Michael J. Macaluso, Chief Financial Officer


TAMPA PORT AUTHORITY Comprehensive Annual Financial Report
For the Fiscal Year Ended September 30, 2009
TABLE OF CONTENTS
PAGE
INTRODUCTORY SECTION Letter of Transmittal .............................................................................................................................. i‐viii Certificate of Achievement for Excellence
In Financial Reporting .......................................................................................................................... ix Organizational Chart ................................................................................................................................... x List of Officials ............................................................................................................................................ xi
FINANCIAL SECTION Independent Auditors’ Report................................................................................................................ 1‐2 Managementʹs Discussion and Analysis ............................................................................................... 3‐8 Basic Financial Statements:
Proprietary Fund – Enterprise Fund: Tampa Port Authority and Discretely Presented Component Unit ‐ Combined Statement of Net Assets ............................................................................................. .9‐10 Combined Statement of Revenues, Expenses,
and Changes in Fund Net Assets .................................................................................................. 11 Combined Statement of Cash Flows ............................................................................................ 12‐13 Notes to Combined Financial Statements .................................................................................... 14‐41
Statement of Cash Flows Discretely Presented Component Unit ....................................................... 42
STATISTICAL SECTION (Unaudited) Statistical Section Summary ................................................................................................................ 43‐44 Table Number Financial Trends Information 1. Net Assets by Component .................................................................................................................. 45 2. Changes in Fund Net Assets .............................................................................................................. 46 Revenue Capacity Information 3. Revenue by Type and Related Averages ......................................................................................... 47 4. Principal Revenue Sources and Revenue by Categories .......................................................... 48‐49 5. Wharfage and Dockage Revenue – Ten Largest Customers ......................................................... 50 6. Revenue Rates ................................................................................................................................ 51‐53 7. Top Ten Customers ............................................................................................................................. 54

TAMPA PORT AUTHORITY Comprehensive Annual Financial Report
For the Fiscal Year Ended September 30, 2009
STATISTICAL SECTION (Continued) Table Number Debt Capacity Information 8. Ratios of Outstanding Debt by Type ................................................................................................ 55 9. Revenue Bond Coverage .................................................................................................................... 56 10. Summary of Surplus Port Revenues after Debt and Operating Costs ......................................... 57
Demographics and Economics Information 11. Hillsborough County, FL Demographics and Economic Statistics .............................................. 58 12. Hillsborough County, FL Principal Employers ............................................................................... 59 13. Hillsborough County, FL Property Tax Millage Rates ................................................................... 60 14. Hillsborough County, FL Principal Taxpayers ............................................................................... 61 Operating Information 15. Schedule of Revenue by Activity ................................................................................................ 62‐63 16. Annual Cargo Tonnages and Passenger Count .............................................................................. 64 17. Capital Assets ....................................................................................................................................... 65 18. Staffing by Division/Department ...................................................................................................... 66 Other Port Financial Information 19. Cruise Statistics .................................................................................................................................... 67 20. Insurance Coverage ............................................................................................................................. 68 21. Financial Highlights ............................................................................................................................ 69
COMPLIANCE SECTION SEC Rule 15c2‐12 Reporting 22. Port of Tampa Tonnage Distribution–Last Ten Years .................................................................... 70 23. Port Usage Fees – Last Ten Years ...................................................................................................... 71 24. Summary of Leases of Principal Tenants ................................................................................... 72‐73 Independent Auditors’ Report on Internal Control Over Financial Reporting and on Compliance and Other Matters Based on an Audit of Basic Financial Statements Performed in Accordance with Government Auditing Standards ............................................................................................ 74‐75
Independent Auditors’ Report on Compliance with Requirements Applicable to each Major Federal Program and State Financial Assistance Project and on Internal Control Over Compliance ................................................ 76‐77
25. Schedule of Expenditures of Federal Awards and State Financial Assistance .......................................................... ………………………………………78‐79
26. Schedule of Findings and Questioned Costs ............................................................................. 80‐81 Management Letter based on Rule 10.554(1)(h) of the Auditor General of the State of Florida ........................................................ ………………………………………82‐83

INTR
OD
UC
TOR
Y SE
CTIO
N


i
March 30, 2010
Board of Commissioners Tampa Port Authority 1101 Channelside Drive Tampa, Florida 33602
Dear Commissioners:
The Comprehensive Annual Financial Report (CAFR) of the Tampa Port Authority (Port Authority) for the fiscal year ended September 30, 2009 is hereby submitted for your review. Responsibility for both the accuracy of the data and the completeness, reliability and fairness of presentation, including all disclosures, rests with the Tampa Port Authority. To the best of our knowledge and belief, the enclosed data is accurate in all material respects and is reported in a manner designed to present fairly the financial position and results of operations of the Port Authority. All disclosures necessary to enable the reader to gain an understanding of the Port Authority’s financial activities and operations have been included.
The management of the Port Authority is responsible for establishing and maintaining an effective internal control structure to safeguard its assets, assure the reliability of its accounting records, and promote operational efficiencies. Based upon a comprehensive internal control framework that it has established for this purpose and recognizing that the cost of such controls should not outweigh their benefits, the Port Authority’s internal controls have been designed to provide reasonable rather than absolute assurance that the financial statements will be free of any material misstatements.
The enclosed CAFR has been prepared in accordance with guidelines recommended by the Governmental Accounting Standards Board (GASB) and the Government Finance Officers Association (GFOA).
Certain demographic information and required GASB 44 statistical reporting included in the CAFR were not obtained from the financial records of the Authority but are presented for the CAFR user’s information and understanding of the Port Authority and the environment in which the Port Authority operates. Additionally, the Compliance Section of the CAFR, meets the continuing disclosure requirements of SEC Rule 15c2-12.
Governmental accounting and auditing principles require that management provide an introduction, overview and analysis in narrative form to accompany the basic financial statements. This narrative, entitled Management’s Discussion and Analysis (MD&A), can be

ii
found immediately following the independent auditor’s report in the Financial Section of the CAFR. This letter of transmittal is designed to complement the MD&A and should be read in conjunction with it.
Profile of the Port
The Tampa Port Authority was created by action of the Florida Legislature through Chapter 95-488, Laws of Florida (also known as the “Enabling Act"). Among other provisions more fully described in the MD&A, the Enabling Act gives the Port Authority the right to acquire property through the power of eminent domain, purchase, gift, grant, franchise, lease or contract. The Port Authority is also empowered to fix uniform rates and charges for wharfage, dockage and handling to and from vessels, where such facilities are owned by the Port Authority or otherwise insofar as it may be permissible under the Constitution of Florida and the Constitution and Laws of the United States of America.
The Enabling Act provides that the Port Authority shall have the specific responsibility for planning and carrying out plans for the long range development of the facilities and traffic through the Port District. Prior to purchase, ownership, control or operation of any facility, the Port Authority must hold a public hearing at which the public view is heard. The Port Authority has broad powers to acquire construct, operate and lease facilities. Please refer further to the MD&A for more specific information regarding the Port Authority’s Enabling Act and its impact on how the Port Authority operates.
Pursuant to Section 11.45 of the Florida Statutes and Section 11 of the Port Authority’s Enabling Act, an audit of the financial statements has been completed by the Port Authority’s independent certified public accountants, Rivero, Gordimer & Company, P.A. Their opinion is included in the Financial Section of this CAFR.
Relevant Financial Policies
The Port Authority’s Enabling Act prescribes that it maintain budgeting and accounting systems and prepare an annual budget in accordance with Florida law. Cash and other assets, related liabilities, and residual equity are segregated into individual self-balancing account groupings. Special accounts are maintained in accordance with revenue bond debt covenants. A full discussion of the Port Authority’s accounting practices are included in the Notes to the Financial Statements.
The Enabling Act authorizes the Hillsborough County Board of County Commissioners to appropriate a sum not to exceed ½ mil (50 cents per $ 1,000 in taxable valuation) annually in ad valorem taxes on all taxable property in the Port District to pay for any lawful purpose including operating expenses of the Port Authority. The Port Authority annually prepares and submits to the Board of County Commissioners a detailed estimate of the Port Authority’s financial requirements, including its administrative and operating expenses for the upcoming fiscal year. The Board of County Commissioners has the right, before the Port Authority’s Board approves its budget for administrative expenses, to revise or amend, raise, lower, or alter the Port Authority’s estimate of such administrative expenses.
At the end of FY2008, the Port Authority’s Board of Commissioners adopted the budget for FY2009 that reduced property taxes to the rollback rate as defined in the Florida Statutes. As a result of the reduced millage rate and decreased countywide property values, the Port Authority

iii
collected less in property tax revenues during FY2009 than FY2008. All of the ad valorem taxes distributed to the Port Authority are allocated to the Capital Program to build infrastructure, generate economic benefits and create jobs.
The Port Authority closely monitors its daily cash needs and invests its portfolio, maximizing investment returns in accordance with its written investment policy. Additionally, it utilizes and relies on the advice of independent financial advisors and bond counsel when making decisions regarding treasury management.
Local Economy and Outlook
The Port of Tampa is geographically located within the boundaries of Hillsborough County, Florida. Hillsborough County has experienced a population growth of 30% over the last 10 years. Most of its population lives in urban areas and is relatively young with a median age of 36 compared to the median age for all Florida residents of 38.7. Education is important to Hillsborough County residents as reflected by the fact that the percentage of residents 25 and older with a high school degree or higher is over 80%. Hillsborough County had 239 public schools, including elementary, middle, and high schools as well as charter schools and adult and career learning centers, at September 30, 2009.
Principal employers in Hillsborough County and accounting for almost 11% of the county’s total employment are: Hillsborough County School Board, Hillsborough County Government, the University of South Florida, Verizon Communication, and Tampa International Airport.
Principal taxpayers in Hillsborough County, Florida comprise a broad range of business types including those involved in utilities, telecommunications, airport, phosphate mining operations, real estate development and management, and retail. The Tampa Port Authority is tenth-ranked among the principal taxpayers in the county. Table 14 in the CAFR contains a complete listing of the principal taxpayers in the County.
Workers in Hillsborough County, Florida fall into the following major classifications: finance and insurance (13%); arts, entertainment, and recreation (8%); management of companies and enterprises (8%); educational services (7%); and real estate and rental and leasing (6%). The workforce is further categorized as: those earning private wages or salaries (82%); government workers (13%); and those self-employed and/or workers in unincorporated areas of the county (5%).
Strategically located along the western coast line of Central Florida, the Port of Tampa is the gateway for the local and regional economy, and is responsible, directly or indirectly, for the creation of nearly 100,000 port-related jobs and approximately $8 billion of economic impact.
Tourism continues to be a major component of the local economy. The number of tourists visiting Florida is expected to continue to grow and Hillsborough County is expected to be on the leading edge of that growth. Busch Gardens of Tampa is one of the leading tourist attractions in the nation. There are numerous other tourist attractions in Hillsborough County including the Florida Aquarium, Adventure Island, the Museum of Science and Industry, the Lowry Park Zoo, Centro Ybor, the Channelside Shops, Tampa Bay Performing Arts Center, the new Patel Music Conservatory, and, of course, the beautiful gulf beaches, resorts, parks, and golf courses. Hillsborough County has numerous athletic facilities that play host to a number of professional sports teams, including the Tampa Bay Buccaneers (NFL), and the Tampa Bay

iv
Lightning (NHL). The Tampa Bay Rays (MLB) play at nearby Tropicana Field in St. Petersburg, Florida.
Hillsborough County, as is the case in other parts of the country, experienced a continued decline in economic growth due to the downturn in the economy. The Economic Development Department of Hillsborough County, along with other agencies, is working hard to attract major corporations that will bring more jobs to the County and further strengthen the local economy.
The Tampa Port Authority is a major player in the local economy’s growth. The Port of Tampa ranks number one in the State of Florida and fourteenth among all U.S. ports in terms of cargo tonnage. The Port is the most diversified in the state and one of the nation’s largest in land area. The Port of Tampa is also currently the seventh largest cruise port in the nation with three modern cruise terminals.
Summary of Tampa Port Authority’s FY2009 Financial Performance
Economically speaking, FY2009 was a challenging year in many respects for the Tampa Port Authority. However, due to the Port Authority’s highly diversified revenue stream coupled with prudent expense management and control, the Port Authority was able to achieve near record levels of operating revenue and a record net income level.
Out of approximately 38 million tons of cargo handled through the entire Port of Tampa, 13.2 million tons were handled at Port Authority facilities during FY2009, 12.1 million tons bulk cargo and 1.1 million tons general cargo and containerized. The remaining tonnage was handled through privately-owned facilities located within the Hillsborough County Port District. Over 800,000 cruise passengers came through the Port of Tampa in fiscal year 2009, this despite a general tourism decline in Florida.
FY2009 operating revenues were near record levels, despite the declining regional economy. To counteract this economic downturn, the Port Authority implemented cost-saving measures including controlling expenses to below-budget levels. Additionally, because it realizes the impact of the economic downturn on its primary stakeholders, the Port Authority is partnering with those companies to keep rates competitive to ensure the companies’ ongoing viability while at the same time ensuring that revenue streams remain consistent. The Port Authority’s FY2009 financial performance is further addressed in the MD&A.
Long Term Financial Planning
The Port Authority is always looking for ways to diversify its economic base. It categorizes the cargo that comes through the port as either bulk or general. These categories are further broken out by major categories such as petroleum, containerized cargo, other general cargo, and miscellaneous dry and liquid bulk products.
In addition to revenue generated by cargo passing through port facilities, cruise, ship repair activities, and land leasing are other major components of the Port Authority’s operating revenue.
The Port Authority has both an Executive Steering Committee and a Capital Projects Committee that meets regularly to determine how best to allocate its limited resources, taking into consideration the economic feasibility of a project, the overall cost, how the project will be

v
funded, how it falls within the Port Authority’s Master Plan, and its overall revenue-producing potential.
To fund the Port Authority’s Capital Program, the Port Authority uses its own surplus cash, after debt service and operating costs, its ad valorem tax receipts, seaport transportation and other grants, and issues bonds as needed. Additionally, it enters into cost-sharing agreements and incentives with new customers desirous of doing business at Port Authority facilities thereby creating a win-win solution for both parties.
Major Initiatives
The Port Authority each year focuses on several initiatives, a general description of each provided below. These initiatives provide the Port Authority with a guideline for maximizing its financial, operational, legislative and environmental goals. Specific accomplishments in each of these initiatives are discussed in the MD&A contained in the Financial Section of this report.
Security - Tampa is a safe port, compliant with federal and state laws. Implementation of a new security card system, the Transportation Workers’ Identification Card (TWIC), was completed in FY2009. Because security costs remain a large portion of the Port’s operating expense, efforts are constantly being made to manage and control its related costs and fees.
The Port Authority remains committed to identifying and implementing safeguards designed to increase security and promote public safety. As a vital economic engine for the region, the Port Authority must carefully balance the impact of the added security measures against the continued flow of commerce into and out of the Port of Tampa.
Legislative – The Port Authority is very proactive at the state and federal level in its pursuit of funding for initiatives which will benefit the entire Port of Tampa and the surrounding community. These initiatives include seeking funding for dredging projects which are vital to support growing container and aggregate business, industries crucial to the future expansion of the Port.
Other legislative action that the Port Authority supports is seeking additional Florida Seaports Transportation and Economic Development (FSTED) and Florida Department of Transportation (FDOT) funding. This funding is specifically dedicated to infrastructure enhancement for Florida's seaports.
Real Estate - One of the Tampa Port Authority’s major attributes is the availability of land for future development. The Port Authority owns nearly 2,600 acres: approximately 1,300 of the acres are leased, 977 are spoil islands, with the remaining acreage available for future development and/or leasing. These properties are leased to various port terminal operators and related businesses for periods of up to 40 years, and in some cases, with up to an additional 40-year option. Specific and ongoing real estate activities are as follows:
During 2009 the Port Authority continued to market and/or develop prime waterfront real estate it owns near downtown Tampa called Channelside. The Channelside District is anchored by the Florida Aquarium, three cruise terminals, and an urban entertainment and dining district. All of the cruise ships calling at the Port of Tampa dock in this area. To better accommodate cruise passengers and increased traffic to the Channel District, the Port Authority contracted to expand the current Channelside parking garage by 722 spaces bringing the capacity to just over 2,700.

vi
The Tampa Port Authority International Headquarters is also located in the Channelside District. In addition to housing the administrative staff of the Port Authority, the facility is also occupied by the University of South Florida, Halcrow, HCP & Associates, and a number of other small businesses. Efforts continue to attract tenants for unleased portions.
The Port Authority has entered into long term leases with a number of tenants during the last several years that guarantee consistent revenue streams, development of port facilities, and that are consistent with the Port Authority’s diversification needs. Many of these leases are in various stages of design, development, and construction and are expected to begin adding to the operating revenue base within the year.
Capital improvement plan - Over the next five years, the Port Authority's capital improvement plan includes capital projects totaling over $330 million. Funding for these projects will be provided from a number of sources, primarily, bond issuances, ad valorem tax receipts, grant funding, and the Port Authority's own revenues.
Environmental - Once again in fiscal year 2009, the Port Authority demonstrated its commitment to the environment of Tampa Bay and Hillsborough County through funding of the sovereign lands management program. Projects under this program include environment restoration, protection of native species, public education, and enhanced awareness efforts.
An Interlocal Agreement between the Port Authority and the Department of Environmental Protection has served to streamline residential and minor work permitting. The Port Authority is sensitive to its unique and diverse environment and continues to balance environmental stewardship with industrial development.
Cargo growth and diversification – The Port Authority remains absolutely committed to diversification of its revenue base. The moneys it collects from both the vessels using the berths and the cargo passing over the berths each year, along with fees collected from tenants leasing port properties, finance a significant of the Port Authority's operations, debt, and capital program. To that end, the Port Authority is constantly looking for ways to improve its operations and increase vessel traffic and cargo volumes through the port.
Last year over 3,100 vessels passed through the port carrying approximately 40 million tons of cargo. Products are diverse with imported products including: petroleum and related products, coal, liquid sulfur, steel, anhydrous ammonia, citrus concentrate, containerized cargo, aggregates (limestone and granite), and cement. The port exports products such as phosphates, scrap metal, citrus pellets, vehicles, and containerized cargo. The Port Authority has a very active Marketing Division that nurtures these product lines and travels extensively in pursuit of other entities which might be interested in doing business in the Port of Tampa.
Port Authority representatives actively participate in numerous trade initiatives internationally. Two of the priority areas in which Port Authority staff is devoting their efforts are in Latin America and Asia, with the intent of increasing trade with these parts of the world. The Port Authority is also cognizant of the revenue potential should trade with Cuba resume.

vii
Listed below are specific initiatives currently or soon to be underway that support the Port Authority’s diversification strategy. These initiatives are separated below by lines of business:
Bulk Cargo:
Cutrale, a Brazilian company involved in the distribution of orange juice concentrate, is poised to invest over $30 million to construct eight, 1 million gallon storage tanks and to generate over 200,000 tons of orange juice concentrate per year through the Port.
Separation Technologies, a world leader in producing and marketing fly ash, has plans to export over 170,000 tons of fly ash per year to Panama to support the building of a hydroelectric power dam on the Changuinola River in western Panama.
By the end of FY2009, the Port Authority had completed construction of Berths 300 and 301 at Port Redwing providing a significant increase to bulk handling capacity.
The Port Authority is in the process of extensive improvements and enhancements to its Richard E. Knight Oil Pier at an estimated cost of over $30 million.
General & Containerized Cargo:
The Port Authority and its terminal operator, Ports America, Inc., have forged a partnership whereby the two entities contribute equally to future container terminal development. Container trade routes are constantly being pursued in support of this effort. Additionally, the Port Authority is focusing on its efforts to attract major distribution centers to the West Central Florida area as part of its container outreach program.
The Port Authority has invested millions of dollars in its ongoing efforts at diversification and building up its container business. The number of container twenty-foot equivalent units (TEUs) shipped through the Port of Tampa has almost doubled in the five years from 2005 to 2009 as a result of these efforts.
The Port Authority will continue to focus its efforts to develop a state-of-the-art container terminal and yard to attract and build the container operations through the Port of Tampa. The container facility has already been expanded from 25 acres to 40 acres with future plans to develop up to 160 acres over the next few years.
Cruise:
Royal Caribbean Cruise Lines’ “Grandeur of the Seas” originates sailings out of Tampa to ports including Belize and Cozumel on a 5-5-4 day sailing rotation. Royal Caribbean recently announced the deployment of a larger ship, Radiance of the Seas, for the FY2010 cruise season and plans to increase the number of sailings from twenty-eight (28) to forty-four (44) per year.
Carnival Cruise Lines remains committed to its decision to homeport two (2) of its ships at the port to provide year-round cruise opportunities out of Tampa. The “Inspiration” offers a 5-5-4 day sailing rotation and the “Legend” offers a 7-day sailing rotation.

viii
Holland America’s "Veendam" also homeports in Tampa. The vessel takes passengers on seven day cruises to the Western and Southern Caribbean.
Discussions continue with other cruise lines to expand this lucrative revenue base and ensure that the Port remains diversified between its cargo, cruise, and real estate leasing operations.
Ship Building, Repair, and Maintenance:
In addition to cargo, cruise, and land leasing operations, the Port is well-equipped to provide ship building, repair, and maintenance services as needed. Millions of dollars have been invested in Port infrastructure to provide these services and the additional jobs they create.
Awards and Acknowledgements
The Government Finance Officers Association (GFOA) awarded a Certificate of Achievement for Excellence in Financial Reporting to the Tampa Port Authority for its Comprehensive Annual Financial Report (CAFR) for the fiscal year ended September 30, 2008. This was the ninth consecutive year that the Port Authority has received this prestigious award. In order to be awarded a Certificate of Achievement, the Port Authority had to publish an easily readable and efficiently organized CAFR that satisfied both generally accepted accounting principles and applicable legal requirements. As was the case for the prior eight years, the accomplishment of the Certificate of Achievement for the ninth consecutive fiscal year was primarily due to the tireless efforts of the Port Authority’s Finance Department staff.
A Certificate of Achievement is valid for a period of one year only. We believe that our current CAFR continues to meet the Certificate of Achievement Program’s requirements and we are submitting it to the GFOA to determine its eligibility for another certificate.
The preparation of this report, as always, represents the combined effort of the entire staff of the Finance Department of the Tampa Port Authority, other Port Authority departments who provided key information to this report and the accounting firm of Rivero, Gordimer & Company, P.A.
Finally, we express our deepest appreciation to the members of the Tampa Port Authority Board of Commissioners for their continued guidance and leadership towards ensuring the fiscal integrity of the Tampa Port Authority.
Respectfully Submitted,
Richard A. Wainio Michael J. Macaluso Port Director and CEO Chief Financial Officer


Por
t Dire
ctor
& C
EO
Ric
hard
Wai
nio
Sr.
Dire
ctor
Pla
nnin
gR
am K
anch
arla
Sr.
Dire
ctor
Com
mun
icat
ion
& B
oard
C
oord
inat
ion
John
Tho
ringt
on
Chi
ef F
inan
cial
Offi
cer
Mik
e M
acal
uso
Dire
ctor
Fina
nce
VAC
AN
T
Dire
ctor
Hum
an R
esou
rces
Vick
i Rus
so
Dire
ctor
Publ
ic R
elat
ions
Andy
Fob
es
Dep
uty
Por
t Dire
ctor
Adm
inis
tratio
n/P
ort C
ouns
elC
harle
s Kl
ug
Dep
uty
Por
t Dire
ctor
Ope
ratio
ns/E
ngin
eerin
gZe
lko
Kiri
ncic
h
Sr. D
irect
orM
arke
ting
Wad
e E
lliot
t
Sr.
Dire
ctor
Rea
l Est
ate
Jim
Ren
ner
Asst
. Por
t Cou
nsel
Kat
hy D
avey
Dire
ctor
Mar
ketin
gG
reg
Love
lace
Dire
ctor
Trad
e D
ev.
Jim
Pyb
urn
Dire
ctor
Envi
ronm
enta
lPh
il S
tead
ham
Sr.
Dire
ctor
Ope
ratio
nsS
teve
Fid
ler
Por
t Eng
inee
rB
ruce
Lau
rion
Dire
ctor
Faci
litie
s M
gmt
Cha
rles
Dow
less
Dire
ctor
Mar
ine
Ope
ratio
nsB
ob C
alla
han
Dire
ctor
Secu
rity
Mar
k D
ubin
a
Chi
ef In
form
atio
n O
ffice
rK
en W
ashi
ngto
n
x

Lawrence R. Shipp, Jr. Chairman of the Board
Brian Dolan Vice Chairman
Carl Lindell, Jr. Secretary/Treasurer
Stephen Swindal Commissioner
Honorable Rose Ferlita Commissioner Hillsborough County Commission
William A. ʺHoeʺ Brown Commissioner
Honorable Pam Iorio Commissioner Mayor, City of Tampa
Richard A. Wainio Port Director & Chief Executive Officer
Zelko N. Kirincich Deputy Port Director ‐ Operations & Enginerring
Charles E. Klug, Esquire Deputy Port Director ‐ Administration & Port Counsel
Michael J. Macaluso Chief Financial Officer
Tampa Port AuthorityList of Officials
Board of Commissioners
Senior Executive Staff


FINA
NC
IAL S
EC
TION


RIVERO, GORDIMER & COMPANY, P.A.CERTIFIED PUBLIC ACCOUNTANTS
INDEPENDENT AUDITORS' REPORT
To the Board of Commissioners Tampa Port Authority
We have audited the accompanying combined statement of net assets of the Tampa Port Authority (the "Port Authority") as of September 30, 2009, and the related combined statements of revenues, expenses and changes in fund net assets, and cash flows for the year then ended, listed as basic financial statements in the table of contents. These combined financial statements are the responsibility of the Port Authority's management. Our responsibility is to express an opinion on these combined financial statements based on our audit.
We conducted our audit in accordance with auditing standards generally accepted in the United States of America and the standards applicable to financial audits contained in Government Auditing Standards, issued by the Comptroller General of the United States of America. Those standards require that we plan and perform the audit to obtain reasonable assurance about whether the financial statements are free of material misstatement. An audit includes examining on a test basis, evidence supporting the amounts and disclosures in the financial statements. An audit also includes assessing the accounting principles used and significant estimates made by management, as well as evaluating the overall financial statement presentation. We believe that our audit provides a reasonable basis for our opinion.
In our opinion, the financial statements referred to above present fairly, in all material respects, the financial position of the Port Authority as of September 30, 2009 and the results of its operations, its expenses and changes in fund net assets, and its cash flows for the year then ended in conformity with accounting principles generally accepted in the United States of America.
In accordance with Government Auditing Standards, we have also issued our report dated January 19, 2010 on our consideration of the Port Authority's internal control over financial reporting and our tests of its compliance with certain provisions of laws, regulations, contracts and grant agreements and other matters. The purpose of that report is to describe the scope of our testing of internal control over financial reporting and compliance and the results of that testing, and not to provide an opinion on the internal control over financial reporting or on compliance. That report is an integral part of an audit performed in accordance with Government Auditing Standards and should be considered in assessing the results of our audit.
The Management's Discussion and Analysis information is not a required part of the basic financial statements but is supplementary information required by the Governmental Accounting Standards Board. We have applied certain limited procedures, which consist principally of inquiries of management regarding the methods of measurement and presentation of the required supplementary information. However, we did not audit the information and we express no opinion on it.
ONE TAMPA CITY CENTER • SUITE 2600 • 201 N. FRANKLIN STEET • P. O. BOX 172359 • TAMPA, FLORIDA 33672 • 813- 875-7774 FAX 813-874-6785
Member American Institute of Certified Public Accountants Florida Institute of Certified Public Accountants
Cesar J. Rivero Sam A. Lazzara Richard Gordimer Stephen G. Douglas Herman V. Lazzara Michael E. Helton Marc D. Sasser
1

The information presented in the introductory section and the statistical section is presented for purposes of additional analysis and is not a required part of the basic financial statements. Such information has not been subjected to the auditing procedures applied in the audit of the basic financial statements, and accordingly, we express no opinion on it.
Our audit was made for the purpose of forming an opinion on the financial statements of the Port Authority taken as a whole. The accompanying Schedule of State financial Assistance is presented for the purpose of additional analysis as required by Chapter 10.550, Rules of the Auditor General of the State of Florida. This supplementary information and schedules are the responsibility of the Port Authority’s management. Such schedules have been subjected to auditing procedures applied in our audit of the basic financial statements and, in our opinion, are fairly stated, in all material respects, when considered in relation to the basic financial statements taken as a whole.
Tampa, Florida January 19, 2010
2

Tampa Port Authority
MANAGEMENT’S DISCUSSION AND ANALYSIS
September 30, 2009
The following management’s discussion and analysis (“MD&A”) of the financial performance and activity of the Tampa Port Authority (“Port Authority”) is to provide an introduction to and understanding of the financial statements of the Port Authority for the fiscal year ended September 30, 2009, with selected comparisons to the prior fiscal year ended September 30, 2008. The information represented should be read in conjunction with the financial statements, notes and supplemental schedules found in this report.
Introduction
The Port Authority is a body politic and corporate pursuant to the provisions of Chapter 95-488, Laws of Florida, Acts of 1945 ("Enabling Act"). The Enabling Act provides that the Port Authority will have exclusive jurisdiction, control, supervision and management over all publicly-owned docks and wharves in Hillsborough County, Florida. The Port Authority is governed by seven board members, five of whom are residents of Hillsborough County, which are appointed by the Governor of the State of Florida to either two-year or four-year terms. In addition, the Mayor of the City of Tampa, ex-officio; and a Commissioner of the Board of County Commissioners of Hillsborough County, ex-officio, serve on the Port Authority’s Board. Of the Board members appointed by the Governor, two members must have maritime industry background in accordance with a modification made to the Enabling Act by the State of Florida legislature in June 2005.
The Port Authority consists of approximately 2,600 acres and is primarily a landlord port serving the greater Tampa Bay area. The Port Authority is a self-supporting organization and generates revenues from port users to fund all operating expenses and debt service requirements. Capital projects are funded by issuing bonds and short-term financings, awards of federal and state grants, ad valorem tax revenue, and surplus operating funds above those needed to cover operating expenses and debt service. While the Port Authority has the ability to levy up to .50 mills in ad valorem taxes each year, the Port Authority’s FY2009 millage rate was .1950 mills.
The Port Authority publishes a uniform tariff which contains standardized rates for various port usage fees. In addition to these published rates, the Port Authority leases its properties to various maritime and other businesses for which it collects rents and negotiated commodity rates, and in certain instances also receives certain guaranteed revenue streams.
The following MD&A of Port Authority activities and financial performance provides an introduction to the financial statements of the Port Authority for the fiscal year ended September 30, 2009, with selected comparative information to the fiscal year ended September 30, 2008. The information contained in this MD&A has been prepared by management and should be considered in conjunction with the financial statements and the notes thereto, which follow this section.
3

Tampa Port Authority
MANAGEMENT’S DISCUSSION AND ANALYSIS - CONTINUED
September 30, 2009
The notes to the financial statements are essential to a full understanding of the data contained in the financial statements. This report also presents certain required supplementary information regarding capital assets and long-term debt activity during the year, including commitments made for capital expenditures.
Overview of the Financial Statements
Governmental accounting policy, practice and procedures fall under the auspices of the Government Accounting Standards Board (“GASB”). The Port Authority’s financial transactions and subsequent statements are prepared according to the GASB Statement 34 reporting model, as mandated by the GASB. The purpose of the GASB 34 reporting model is to consolidate two basic forms of governmental accounting, governmental (such as municipalities) and proprietary (those entities which generate their own revenues and therefore are similar to a private business such as the Port Authority) operations, into statements that give the reader a clearer picture of the financial position of the government as a whole. The Port Authority is considered a proprietary form of government and its financial transactions are recorded in a single Enterprise Fund.
As stated above, the Port Authority operates as a single Enterprise Fund with one component unit, Tampa Bay International Terminals, Inc. (“TBIT”). The financial statements are prepared on the accrual basis of accounting, therefore revenues are recognized when earned and expenses are recognized when incurred. Capital assets, except land, are capitalized and depreciated over their useful life. Please refer to note B in the accompanying financial statements for a summary of the Port Authority’s significant accounting policies. Following this MD&A are the basic financial statements and supplemental schedules of the Port Authority. These statements and schedules, along with the MD&A are designed to provide readers with a complete understanding of the Port Authority’s finances.
The financial section of this annual report consists of three parts: MD&A, the basic financial statements, and the notes to the financial statements. The report includes the following three basic financial statements: the statement of net assets, the statement of revenues, expenses, and changes in net assets, and the statement of cash flows. It should be noted that the summary financial statements for FY 2009 with comparisons to FY 2008 in the MD&A do not include financial information for TBIT. Financial information for TBIT is included in the financial statements which follow the MD&A.
Financial Position Summary
The Statement of Net Assets presents the financial position of the Port Authority at the end of the fiscal year. The statements include all assets and liabilities of the Port Authority. Net assets, the difference between total assets and total liabilities, are an indicator of the current fiscal health of the organization and the Port Authority’s financial position over time. A summarized comparison of the Port Authority’s assets, liabilities, and net assets at September 30, 2009 and 2008 is as follows:
4

Tampa Port Authority
MANAGEMENT’S DISCUSSION AND ANALYSIS - CONTINUED
September 30, 2009
STATEMENTS OF NET ASSETS
FY2009 FY2008
(in thousands)
ASSETSCurrent assets 109,908$ 108,111$Noncurrent assetsCapital related, net 468,858 442,085Noncapital 14,202 12,220
Total assets 592,968$ 562,416$
LIABILITIESCurrent liabilities 16,929$ 12,411$Noncurrent liabilities 145,928 150,120
Total liabilities 162,857 162,531
NET ASSETSInvested in capital assets, net of related debt 353,335 324,479Restricted assets 31,787 36,655Unrestricted net assets 44,989 38,751
Total net assets 430,111 399,885
Total liabilities and net assets 592,968$ 562,416$
At September 30, 2009, the Port Authority’s assets exceeded liabilities by $430 million, a $30.2 million increase over September 30, 2008. For the fiscal year ended September 30, 2009, the largest portion of the Port Authority’s net assets represents its investment in capital assets, less the related debt outstanding used to acquire those capital assets. The Port Authority uses these capital assets to provide services to the passengers, visitors, customers, and tenants of the Port of Tampa. The resources required to repay the Port Authority’s debt must be provided annually from Port Authority operations.
The Statement of Revenues, Expenses and Change in Fund Net Assets is an indicator of whether the overall fiscal condition of the Port Authority has improved or worsened during the year. Following is a summary of the Statements of Revenues, Expenses, and Changes in Fund Net Assets:
5

Tampa Port Authority
MANAGEMENT’S DISCUSSION AND ANALYSIS - CONTINUED
September 30, 2009
STATEMENTS OF REVENUES, EXPENSES AND CHANGES IN FUND NET ASSETS
FY 2009 FY 2008
(in thousands)
Operating revenuesPort usage fees 28,947$ 28,334$ Land and building leases 9,662 9,442 Other operating revenue 1,238 1,471
Total operating revenue 39,847 39,247
Operating expenses 22,868 22,543
Operating income before depreciation 16,979 16,704 Depreciation and amortization expense 17,714 16,536
Operating (loss) income after depreciation (735) 168
Non-operating revenues (expenses)Ad valorem taxes 15,699 16,807 Interest income 1,730 3,281 Other non-operating revenues 3,305 1,529 Interest expense (7,457) (7,891) Amortization of bond issue costs (215) (218) Amortization of bond premiums 253 244 Other non-operating expenses (2,416) (2,559) Loss on swap termination - (1,705)
10,899 9,488
Income before capital contributions 10,164 9,656 Capital grants 20,062 3,604
Increase in net assets 30,226 13,260
Net assets at beginning of year 399,885 386,625
Net assets at end of year 430,111$ 399,885$
6

Tampa Port Authority
MANAGEMENT’S DISCUSSION AND ANALYSIS - CONTINUED
September 30, 2009
Financial Operations Highlights
Listed below are the highlights of changes in the fiscal years ended September 30, 2009 and 2008, as shown in the Statements of Revenues, Expenses and Changes in Fund Net Assets above:
Operating revenues increased by 1.5% from $39.2 million to $39.8 million due to an increase in lease revenue as a result of new leases and the renegotiation of existing leases and an increase in parking revenues resulting from increased parking rates and usage of the Port Authority’s parking facilities.
Operating expenses increased by only 1.7% from $22.5 million in FY2008 to $22.9 million in FY2009. While the Port Authority realized increased health insurance and security-related costs in FY2009, these increases were offset by decreases in personnel costs due the deferral in filling several positions, decreased administrative expenses insurance resulting from insuring Port Authority at more realistic replacement cost values which lowered insurance premiums and reduced promotional expenses.
Depreciation and amortization increased $1.2 million from $16.5 million to $17.7 million. The increase is related to the additional capital assets associated with the Port Authority’s new parking garage and increased dredging amortization expenses.
Non-operating revenues, net of non-operating expenses, increased by $1.4 million, or 14.9%. The Port Authority realized an increase in dredge and fill revenue associated with maintenance dredging performed at private berths and the recognition of $667,000 in settlement payments associated with a lease option termination on Port Authority property and decreased interest expense due to the decreasing outstanding bond balance. Offsetting this increase is a decrease in interest income due to a significant decline in interest rates and the depletion of bonds proceeds. Other non-operating expenses decreased by approximately $143,000.
Capital grants increased from $3.6 million in FY2008 to $20.1 million in FY2009, or a $16.5 million increase primarily due to the recognition of grant revenue associated with Florida Department of Transportation grants. These grants were used to design, construct and manage intermodal improvements/enhancement projects.
Capital Assets
The Port Authority’s non-current assets as of September 30, 2009 amounted to $483.1 million, of which capital assets were $468.9 million (net of accumulated depreciation). This investment in capital assets includes land, buildings, facility and infrastructure improvements and enhancements, equipment, furniture and fixtures, and construction work in progress. Capital asset acquisitions are capitalized at cost and depreciated over estimated useful lives using the straight-line method. (Refer to note B6 Capital Assets for a more complete description.) The total increase in the Port Authority’s investment in capital assets after accumulated depreciation for 2009 was 6.1%, or $26.8 million due to the reasons stated below.
7

Tampa Port Authority
MANAGEMENT’S DISCUSSION AND ANALYSIS - CONTINUED
September 30, 2009
During 2009, completed major projects totaling $12.6 million were closed from construction-in-progress to their respective capital accounts. Major completed capital projects included:
Small craft intrusion barriers for security Land purchase for Eastport development Mobile harbor crane purchase Parking garage revenue control system Berth 26 extension
Construction-in-progress projects total of $48.4 million as of September 30, 2009 includes the following projects:
Berth 213 backlands development Harbor deepening/dredging Container yard expansion Roads, railroads, and general infrastructure improvements and enhancements Parking Garage expansion Port redwing berth 300, 301, 302 construction Eastport berth 150 construction
The Port Authority’s capital program is funded through a combination of ad valorem taxes, port usage fees including passenger facility charges, federal and state grants, net revenues, and revenue bond issues. Additional information on the Port Authority’s capital assets can be found in Note H in the accompanying notes to the financial statements.
Debt Administration
The Port Authority had outstanding revenue bonds and notes of $145.3 million as of September 30, 2009. Of this amount, $6.9 million is current and will mature by June 1, 2010.
No new bonds were issued during the year ended September 30, 2009. Details regarding the current outstanding long-term debt transactions can be found in Note K of the accompanying notes to the financial statements.
The Port Authority’s bonds remained at the following ratings, as provided by the major rating agencies: "A" by Fitch, "A2" by Moody's, and "A" by Standard & Poor's, all with stable outlooks.
The Port Authority’s bond covenants require that revenues available to pay debt service, as defined in the bond resolutions, exceed 120% of the annual debt service amount. The debt service coverage test for fiscal years 2009 and 2008 was met and exceeded for both years.
Request for Information
This financial report is designed to provide a general overview of the Port Authority finances and to demonstrate the Port Authority’s accountability for the funds it receives and expends. Questions concerning this report or requests for additional information should be addressed to Lisa Bristol, Senior Accounting Manager, Tampa Port Authority, 1101 Channelside Drive, Tampa, FL 33602. Information may also be obtained on the Port Authority’s website at www.tampaport.com.
8


See notes to the Financial Statement.
Tampa Port Authority
COMBINED STATEMENT OF NET ASSETS
September 30, 2009 (With comparative total for 2008)
PrimaryGovernment Component Unit
Tampa BayTampa Port International Total Total
Authority Terminals, Inc. 2008 2008
ASSETS
CURRENT ASSETSCash and cash equivalents (note C) 97,194,297$ 35,077$ 97,229,374$ 94,828,665$ Investments (note C) 2,630,690 938,500 3,569,190 4,348,479 Accounts receivable, net of allowance for
doubtful accounts 4,094,832 - 4,094,832 4,189,885 Due from other governments 2,960,208 - 2,960,208 3,632,689 Notes receivable (note D) 471,885 - 471,885 441,167 Note receivable from component unit (note D) 868,333 - 868,333 831,667 Net investment in lease (note E) 655,510 - 655,510 - Interest receivable 492,921 - 492,921 32,224 Prepaid expenses and other current assets 538,848 840,766 1,379,614 1,779,377
Total current assets 109,907,524 1,814,343 111,721,867 110,084,153
NONCURRENT ASSETSCapital assets, net of depreciation (note H) 468,857,709 - 468,857,709 442,084,949 Notes receivable (note D) 5,382,878 - 5,382,878 5,854,763 Note receivable from component unit (note D) 596,667 - 596,667 1,464,999 Net investment in lease (note E) 4,096,938 - 4,096,938 - Lease acquisition costs, net of amortization
(note F) 1,432,669 - 1,432,669 1,780,635 Bond issuance costs, net of amortization 2,143,098 - 2,143,098 2,358,447 Leasehold rights, net of amortization 413,070 - 413,070 485,217 Other intangible assets (note G) 137,569 724,880 862,449 1,000,849
Total noncurrent assets 483,060,598 724,880 483,785,478 455,029,859
TOTAL ASSETS 592,968,122$ 2,539,223$ 595,507,345$ 565,114,012$
9

See notes to the Financial Statement.
Tampa Port Authority
COMBINED STATEMENT OF NET ASSETS
September 30, 2009 (With comparative total for 2008)
PrimaryGovernment Component Unit
Tampa BayTampa Port International Total Total
Authority Terminals, Inc. 2009 2008
LIABILITIES AND NET ASSETS
CURRENT LIABILITIESAccounts payable 2,381,123$ 3,449$ 2,384,572$ 1,413,575$Construction contracts and retainages payable 4,363,829 - 4,363,829 1,111,636Accrued liabilities 1,050,751 - 1,050,751 984,882 Accrued bond interest 1,836,096 - 1,836,096 1,888,818Long-term debt due within one year (note K) 6,855,000 - 6,855,000 6,725,000Note payable to primary government (note K) - 868,333 868,333 831,667 Deferred revenue 442,179 - 442,179 295,182
Total current liabilities 16,928,978 871,782 17,800,760 13,250,760
NONCURRENT LIABILITIESBonds, notes and loans payable, net (note K) 137,881,629 - 137,881,629 144,153,448Note payable to primary government (note K) - 596,667 596,667 1,464,999Deferred revenue (note E) 2,617,208 - 2,617,208 2,423,884Investment held for component unit 938,500 - 938,500 938,500 Deposits 3,323,745 - 3,323,745 1,436,214Other obligation (note L) 1,167,885 - 1,167,885 1,167,885
Total noncurrent liabilities 145,928,967 596,667 146,525,634 151,584,930
Total liabilities 162,857,945 1,468,449 164,326,394 164,835,690
NET ASSETS (DEFICIT)Invested in capital assets, net of related debt 353,334,563 724,880 354,059,443 325,203,480Restricted
Bond debt service 7,721,307 938,500 8,659,807 10,153,052Capital projects 24,065,675 - 24,065,675 27,440,222
Unrestricted 44,988,632 (592,606) 44,396,026 37,481,568
Total net assets 430,110,177 1,070,774 431,180,951 400,278,322
TOTAL LIABILITIES AND NET ASSETS 592,968,122$ 2,539,223$ 595,507,345$ 565,114,012$
10

See notes to the Financial Statement.
Tampa Port Authority
COMBINED STATEMENT OF REVENUES, EXPENSES AND CHANGES IN FUND NET ASSETS
For the year ended September 30, 2009 (With comparative total for 2008)
PrimaryGovernment Component Unit
Tampa BayTampa Port International Total Total
Authority Terminals, Inc. 2009 2008
Operating revenuesPort usage fees 28,946,918$ -$ 28,946,918$ 28,334,102$Land and building leases 9,661,593 - 9,661,593 9,442,093Other operating revenues 1,238,301 984,582 2,222,883 2,470,545
Total operating revenues 39,846,812 984,582 40,831,394 40,246,740
Operating expensesPersonnel 10,089,286 - 10,089,286 9,417,513
Promotional 218,410 5,801 224,211 289,616 Administrative 12,560,476 67,839 12,628,315 12,932,320
Depreciation and amortization 17,714,319 - 17,714,319 16,536,022Total operating expenses 40,582,491 73,640 40,656,131 39,175,471
Total operating income (735,679) 910,942 175,263 1,071,269
Non-operating revenues (expenses)Ad valorem taxes 15,699,654 - 15,699,654 16,806,833Interest income 1,730,026 53,914 1,783,940 3,335,331Other non-operating revenues 3,304,902 - 3,304,902 1,529,087Interest expense (7,456,896) (114,833) (7,571,729) (8,044,154)Amortization of bond issue costs (215,349) - (215,349) (218,234)Amortization of bond premiums 253,054 - 253,054 244,469Other non-operating expenses (2,416,512) (172,883) (2,589,395) (2,733,183)Loss on swap termination - - - (1,704,878)
Total non-operating revenues (expenses) 10,898,879 (233,802) 10,665,077 9,215,271
Income before capital contributions 10,163,200 677,140 10,840,340 10,286,540
Capital grants and contributions 20,062,289 - 20,062,289 3,602,214
Increase in net assets 30,225,489 677,140 30,902,629 13,888,754
Net assets at beginning of year 399,884,688 393,634 400,278,322 386,389,568
Net assets at end of year 430,110,177$ 1,070,774$ 431,180,951$ 400,278,322$
11


See notes to the Financial Statement.
Tampa Port Authority
STATEMENT OF CASH FLOWS
For the year ended September 30, 2009 (With comparative total for 2008)
Primary PrimaryGovernment GovernmentTampa Port Tampa Port
Authority - 2009 Authority - 2008
Cash flows from operating activitiesReceived from customers 39,941,865$ 39,922,143$ Payments to suppliers for goods and services (11,576,409) (14,952,756)Payments to employees for services (10,023,417) (9,331,718) Related to non-operating revenues 5,192,433 2,404,106 Related to non-operating expenses (656,117) (805,836)
Net cash provided by operating activities 22,878,355 17,235,939
Cash flows from non-capital financing activities Payment of ad valorem taxes (568,009) (640,442)
Net cash used by non-capital financing activities (568,009) (640,442)
Cash flows from capital and related financing activitiesCapital grants and contributions received 20,734,770 1,282,430 Ad valorem taxes received, net of fees paid 14,836,646 16,006,434 Acquisition and construction of capital assets (45,255,214) (19,744,866)Proceeds from sale of capital assets - 158,524 Principal payments on debt (6,725,000) (31,375,000)Interest payments on debt (7,329,166) (8,197,148) Proceeds from note payable - 27,000,000 Note payable issue costs - (136,933) Swap termination payment - (3,110,000)
Net cash used by capital and related financing activities (23,737,964) (18,116,559)
Cash flows provided by investing activitiesPurchase of investments (2,630,690) (3,409,979) Proceeds from the sale of investments 3,409,979 3,264,188 Proceeds from repayment of notes receivable 1,272,833 1,500,738 Proceeds from repayment of capital lease receivable 493,119 - Interest and dividends received 1,269,329 4,785,976
Net cash provided by investing activities 3,814,570 6,140,923
Net increase in cash and cash equivalents 2,386,952 4,619,861
Cash and cash equivalents at beginning of year 94,807,345 90,187,484
Cash and cash equivalents at end of year 97,194,297$ 94,807,345$
12

See notes to the Financial Statement.
Tampa Port Authority
STATEMENT OF CASH FLOWS - CONTINUED
For the year ended September 30, 2009 (With comparative total for 2008)
Primary PrimaryGovernment GovernmentTampa Port Tampa Port
Authority - 2009 Authority - 2008
Reconciliation of operating income to net cash providedby operating activities
Operating (loss) income (735,679)$ 168,589$ Adjustments to reconcile operating income to net cash
provided by operating activitiesDepreciation and amortization 17,715,319 16,536,022 Gain on sale of assets (19,158) - (Increase) decrease in
Accounts receivable 95,053 675,003 Prepaid expenses and deposits 226,881 23,902
Increase (decrease) inAccounts payable 975,596 (1,841,153) Accrued liabilities 65,869 75,306 Deferred revenue (307,246) (137,951) Deposits 1,887,531 1,108,283
Total adjustments 20,639,845 16,439,412
Non-operating revenues 2,975,189 627,938
Net cash provided by operating activities 22,879,355$ 17,235,939$
Supplemental disclosure of non-cash investing activitiesThe Port Authority sold a crane during the year ended September 30, 2009
under a direct financing lease for $4,598,000
This space intentionally left blank
13

Tampa Port Authority
NOTES TO COMBINED FINANCIAL STATEMENTS
September 30, 2009
.
NOTE A - ORGANIZATION AND REPORTING ENTITY
1. Financial Reporting Entity, Organization and Operations
The Tampa Port Authority (the "Port Authority") and the Hillsborough Port District exist pursuant to the provisions of Chapter 95-488, Laws of Florida (the "Special Act"). The Port Authority is the governing body of the Port District and consists of seven members, five members appointed by the Governor of the State of Florida, the Mayor of the City of Tampa and a member of the Hillsborough County Board of County Commissioners. The Port District encompasses all of Hillsborough County, including the City of Tampa and portions of Tampa Bay within Hillsborough County.
Among other provisions, the Special Act gives the Port Authority the right to acquire property through the power of eminent domain, purchase, gift, grant, franchise, lease or contract. The Port Authority is also empowered to fix uniform rates and charges for wharfage, dockage and handling to and from vessels, where such facilities are owned by the Port Authority or otherwise, insofar as it may be permissible under the Constitution of Florida and the Constitution and Laws of the United States of America. All general cargo terminals within the Port District operate subject to the uniform tariff governing use of the facilities and services and established rates, charges, rules and regulations as published by the Port Authority.
The Special Act provides that the Port Authority has the specific responsibility for planning and carrying out plans for the long range development of the facilities of and traffic through the Port District. Prior to ownership, control or operation of any facility, the Port Authority must hold a public hearing. The Port Authority has broad powers to acquire, construct, operate and lease facilities.
2. Discretely Presented Component Unit
As required by accounting principles generally accepted in the United States of America (“GAAP”), these financial statements cover the Port Authority as primary government, as well as its component unit, Tampa Bay International Terminals, Inc. (“TBIT”). According to the Governmental Accounting Standards Board of the Financial Accounting Foundation (“GASB”) Statement No. 14, The Financial Reporting Entity, a component unit is a legally separate entity for which the primary government is financially accountable. A legally separate entity should be included as a component unit if one of the following criteria are met: the primary government appoints a voting majority of the organization’s governing body and is either able to impose its will on the organization or there is the potential financial benefit or burden to the primary government; or the nature and significance of the relationship between the primary government and the organization is such that exclusions would cause the reporting entity’s financial statements to be misleading or incomplete.
TBIT is included as a component unit, in accordance with GASB Statement No. 14, due to the following: the Port Authority can appoint the voting majority of the organization’s governing body and impose its will on TBIT, and TBIT is fiscally dependent on the Port Authority for its operations and capital funding.
14

Tampa Port Authority
NOTES TO COMBINED FINANCIAL STATEMENTS
September 30, 2009
.
NOTE A - ORGANIZATION AND REPORTING ENTITY - Continued
A component unit may be classified as either a blended component unit or a discretely presented component unit, depending on the nature of the entity’s relationship with the primary government. Component units that meet the criteria for discrete presentation in accordance with GASB Statement No. 14 are presented in a separate component unit column in the combined financial statements in order to clearly distinguish the balances and transactions of the component unit from those of the primary government. TBIT is the Port Authority’s only component unit and it is presented discretely and is identified as a component unit throughout this report. Complete financial statements for TBIT may be obtained at the component unit’s administrative offices, located at 1101 Channelside Drive, Tampa, Florida 33602. Also see notes C, D, G, J, K2, O, and S.
NOTE B - SUMMARY OF SIGNIFICANT ACCOUNTING POLICIES
A summary of the Port Authority's significant accounting policies consistently applied in the preparation of the accompanying financial statements follows:
1. Basis of Accounting
The Port Authority prepares its financial statements in conformity with GAAP as applied to governmental units. GASB is the accepted standard-setting body for establishing governmental accounting and financial reporting principles followed in the United States of America. Pursuant to GASB Statement No. 20, Accounting and Financial Reporting for Proprietary Funds and Other Governmental Entities that Use Proprietary Fund Accounting,the Port Authority applies all applicable GASB pronouncements as well as Statements and Interpretations to the Financial Accounting Standards Board (“FASB”), and earlier pronouncements from the Accounting Principles Board, (“APB Opinions”), and the Accounting Research Bulletins (“ARB”) issued on or before November 30, 1989, unless those pronouncements conflict with or contradict GASB pronouncements. In accordance with GASB Statement No. 20, Paragraph 7, the Port Authority has elected to not apply FASB statements and interpretations issued after November 30, 1989.
The Port Authority is considered to be a self-supporting enterprise similar to a commercial entity organized for profit. Accordingly, these financial statements are prepared on the accrual basis of accounting similar to that prescribed for proprietary operations of state and local governments. Under the accrual basis of accounting, revenues are recognized in the period in which they are earned and measurable, and expenses are recognized in the period in which the related liability is incurred.
2. Fund Accounting and Basis of Accounting
The operations of the Port Authority are recorded in a proprietary fund. Proprietary funds are used to account for activities that are similar to those often found in the private sector. The measurement focus is on the determination of net income and capital maintenance. All Port Authority financial transactions are grouped in one major fund type, the Enterprise Fund. Enterprise funds are used to account for operations that are financed primarily through user charges, or where the governing body has concluded that the determination of net income is appropriate.
15

Tampa Port Authority
NOTES TO COMBINED FINANCIAL STATEMENTS
September 30, 2009
.
NOTE B - SUMMARY OF SIGNIFICANT ACCOUNTING POLICIES - Continued
Proprietary funds are accounted for using the flow of economic resources measurement focus and the accrual basis of accounting. With this measurement focus, all assets and liabilities associated with the operation of the fund are included on the statement of net assets. Fund equity is segregated into its net assets components. Revenues are recorded when earned and expenses are recorded at the time liabilities are incurred.
3. Cash and Cash Equivalents
Cash consists of checking accounts, collectively designated as demand deposits.
The Port Authority deposits cash in qualified public depositories. The deposits are fully insured by the Federal Deposit Insurance Corporation (“FDIC”) and/or secured by the multiple financial institutions collateral pool established under Chapter 280, Florida Statutes. In accordance with these statutes, qualified public depositories are required to pledge eligible collateral in varying percentages. Any losses to public depositors are covered by applicable deposit insurance by the sale of pledged securities and, if necessary, by assessments against other qualified public depositories.
The Port Authority considers all highly liquid debt instruments (including restricted assets) with original maturities of three months or less to be cash equivalents for purposes of the statement of cash flows. Cash equivalents are recorded at amortized cost, which approximates market value.
4. Investments
The Port Authority invests in short to medium term repurchase agreements and guaranteed investment contracts. The Port Authority follows the guidelines of GASB Statement No. 31, Accounting and Financial Reporting for Certain Investments and for External Investment Pools. Investments that mature within one year of acquisition are stated at cost or amortized cost. Investments with the remaining maturity of more than one year at the time of purchase are carried at fair value. The fair value of investments has been determined through the depositories’ pricing service as established by general industry practices. Any realized gains and losses in fair value are reported in the operations of the current period.
5. Accounts Receivable
The Port Authority records accounts receivable at estimated net realizable value. Accordingly, accounts receivable at September 30, 2009 are shown net of allowances for doubtful accounts. The primary government has set their allowance for doubtful accounts at approximately $113,000. The component unit had no accounts receivable as of September 30, 2009 and therefore the allowance for doubtful accounts has been set to zero.
16

Tampa Port Authority
NOTES TO COMBINED FINANCIAL STATEMENTS
September 30, 2009
.
NOTE B - SUMMARY OF SIGNIFICANT ACCOUNTING POLICIES - Continued
6. Capital Assets
Capital assets include land, buildings, furniture, equipment, infrastructure (e.g., roads, sidewalks and similar items), and construction work in progress.
Capital assets used by the Port Authority are recorded at cost or estimated historical cost. Contributed capital assets are recorded at estimated fair market value at the time received. Net interest costs are capitalized on projects during the construction period. Depreciation is calculated using the straight-line method over estimated useful lives ranging from 5 to 40 years for buildings, 10 to 50 years for infrastructure depreciation, 3 to 15 years for dredging, and 3 to 25 years for equipment and furniture.
While the Port Authority’s capitalization threshold is $5,000, tangible personal property items with a cost below $5,000 are recorded and inventoried in accordance with Section 274.002, Florida Statutes, and Rule 10.400 of the Auditor General of the State of Florida, LocalGovernment-Owned Tangible Personal Property.
No valuation has been placed on the Port Authority’s title to or rights in submerged lands, bay lands and oyster shell, which lie within the boundaries of the Port District.
7. Lease Acquisition Costs
Lease acquisition costs represent funds expended by the Port Authority to perpetuate the opportunity to continually lease certain facilities within the Port District. These costs are capitalized by the Port Authority and amortized over the initial term of the lease agreement.
8. Intangible Assets
Intangible assets consist of costs in excess of net assets acquired and financing costs, which are stated at cost. Amortization is determined using the straight-line method over the period of estimated future benefit of the assets. Financing costs are amortized over the term of the related indebtedness. Costs in excess of net assets (known as “goodwill”) acquired is not amortized, but should be tested for impairment at least annually. Accordingly, the Port Authority is no longer amortizing its goodwill (see note G).
9. Amortization
Bond issue costs, bond discounts, leasehold rights, dredging and lease acquisition costs are generally being amortized on a straight-line basis over the term of the related debt or period of benefit in the case of leasehold rights, dredging and lease acquisition costs.
10. Reserves for Restricted Assets
The amounts reserved for debt service and capital projects are legally restricted by bond indentures.
17

Tampa Port Authority
NOTES TO COMBINED FINANCIAL STATEMENTS
September 30, 2009
.
NOTE B - SUMMARY OF SIGNIFICANT ACCOUNTING POLICIES - Continued
11. Ad Valorem Taxes
In accordance with Florida Statutes, the Port Authority has the right to levy up to a millage rate of one-half mill ($0.50 per $1,000 value) ad valorem property tax. The Port Authority levied a millage rate of .1950 mill ($.1950 per $1,000 value) ad valorem property tax during fiscal year 2009.
Ad valorem taxes are based on assessed values at January 1 and are levied on November 1 of each year. A four percent discount is allowed if the taxes are paid in November, with the discount declining by one percent each month thereafter. Taxes become delinquent on April 1 of each year and tax certificates for the full amount of any unpaid taxes and assessments must be sold no later than June 1 of each year. Ad valorem tax revenue is recorded when it becomes available.
Revenue is available when it is due and collectible within the current period or soon enough thereafter to pay the liabilities of the current period. No accrual for the ad valorem tax levy becoming due in November 2009 is included in the accompanying financial statements since such taxes are collected to finance expenditures of the subsequent period.
12. Compensated Absences
In accordance with GASB Statement No. 16, Accounting for Compensated Absences, the Port Authority accrues a liability for compensated absences, as well as certain other salary-related costs associated with the payment of compensated absences. Vacation and sick leave are accrued as a liability as the employees earn the benefits.
13. Use of Estimates
The preparation of financial statements in conformity with GAAP requires management to make estimates and assumptions that affect the reported amounts of assets and liabilities and disclosure of contingent assets and liabilities at the date of financial statements and the reported amounts of contributions and expenses during the reporting period. Actual results could differ from those estimated.
14. Pension Disclosure
The Port Authority utilizes GASB Statement No. 27, Accounting for Pensions by State and Local Governmental Employers, for the measurement, recognition, and display of pension expenses.
15. Interest Rate Risk Management
In certain instances and after careful analysis, the Port Authority uses interest rate derivatives contracts to reduce its debt service costs. After a thorough review of the Port Authority’s debt portfolio, the Port Authority elected to enter into a knock-in swap option agreement (“swaption”) to reduce interest costs. Under this agreement, the Port Authority will pay a variable interest rate only if certain events occur.
18

Tampa Port Authority
NOTES TO COMBINED FINANCIAL STATEMENTS
September 30, 2009
.
NOTE B - SUMMARY OF SIGNIFICANT ACCOUNTING POLICIES - Continued
The knock-in swaption, if exercised, would include a notional amount of approximately 19% of the Port Authority’s outstanding revenue bond portfolio, with the term of the transaction matching the maturity of the Port Authority’s bond portfolio. The option payments and premiums received from entering into the interest rate derivative instrument are amortized over the life of the exercise period as a net to interest expense. Additionally, the Port Authority has entered into a interest rate swap agreement. See note K for further discussion.
16. Deferred Losses on Refunding of Debt
In accordance with GAAP, losses incurred on proprietary fund debt refunding are deferred and amortized. The amount deferred is reported as a component of the debt liability and is deducted from long-term bonds payable. The amount amortized, using the effective interest method, is reported as a component of interest expense. The amortization period of deferred refunding losses, is the remaining life of the old debt or the life of the new debt, whichever is shorter.
17. Accounting Pronouncements
Governmental Accounting Standards Board (GASB) Statement 45, “Accounting and Financial Reporting by Employers for Post-employment Benefits Other Than Pensions” became effective for the Port Authority for the year ending September 30, 2009. This new guideline is required for all governmental employers who provide Other Post Employment Benefits for which the employer pays all or a part of the cost of the benefits. Statement 45 will improve financial reporting and disclosure by matching the cost of post employment health benefits with the periods when the related services are received by the employer, by providing information about accrued actuarial liabilities for promised benefits related to past services and the extent that those liabilities have been funded and by providing valuable information about demands on future employer cash flows.
In June 2007, the GASB issued Statement 51 – Accounting and Financial Reporting for Intangible Assets. This statement establishes accounting and financial reporting requirements for intangible assets including easements, water rights, timber rights, patents, trademarks, and computer software. An absence of sufficiently specific authoritative guidance has resulted in inconsistencies in the accounting and financial reporting of intangible assets along state and local governments, particularly in the areas of recognition, initial measurement, and amortization.
The objective of this Statement is to establish accounting and financial reporting requirements for intangible assets to reduce these inconsistencies, thereby enhancing the comparability of the accounting and financial reporting of such assets among state and local governments. The requirements of this Statement are effective for financial statements for periods beginning after June 15, 2009. The Port Authority expects to comply with the provision of this statement at the appropriate time.
19

Tampa Port Authority
NOTES TO COMBINED FINANCIAL STATEMENTS
September 30, 2009
.
NOTE B - SUMMARY OF SIGNIFICANT ACCOUNTING POLICIES – Continued
In June 2008, the GASB issued Statement 53 – Accounting and Financial Reporting for Derivative Instruments. This Statement addresses the recognition, measurement, and disclosure of information regarding derivative instruments entered into by state and local governments. Derivative instruments are often complex financial arrangements used by governments to manage specific risks or to make investments. By entering into these arrangements, governments receive and make payments based on market prices without actually entering into the related financial or commodity transactions. Derivative instruments associated with changing financial and commodity prices result in changing cash flows and fair values that can be used as effective risk management or investment tools. Derivative instruments, however, also can expose governments to significant risks and liabilities. Common types of derivative instruments used by governments include interest rate and commodity swaps, interest rate locks, options (caps, floors, and collars), swap options, forward contracts, and futures contracts. The requirements of the new statement become effective for fiscal periods beginning after June 15, 2009. The Port Authority expects to comply with the provisions of this statement at the appropriate time.
18. Operating Revenues and Economic Dependency
Total operating revenues of the Port Authority for the year ended September 30, 2009 amounted to approximately $40 million, comprised of port usage fees of approximately $29 million (of which dockage, wharfage, and terminal operations are approximately $22.7 million) and rental income of approximately $9.7 million. Port usage fees and rental income totaled approximately $38.8 million and made up approximately 96.9% of the primary government’s operating revenues in 2009.
19. Determination of Operating vs. Non-Operating Revenues and Expenses
The Port Authority derives the largest portion of its operating revenues from vessel traffic and cargo moving through the port and across its docks. Additionally, the Port Authority is considered a landlord port in that it leases out its properties to various cargo operations and commercial property for varying terms of up to 40 years (with additional options) in return for rental payments and financial guarantees from those operators.
The expense associated with operating revenue generation is recorded in three major categories: personnel, promotional, and administrative expenses. Personnel expenses include all payments made by the Port Authority directly to the employee or on the employee’s behalf. Promotional expenses are those incurred in the business of promoting and marketing the Port of Tampa in order to attract new businesses. Administrative expenses include all other expenses necessary to effectively operate the Port Authority on a day-to-day basis.
The Port Authority receives certain other revenue such as ad valorem tax receipts, interest income, and grant revenue that it categorizes as non-operating revenues. These types of revenue are not a direct result of vessel traffic or cargo movement.
20

Tampa Port Authority
NOTES TO COMBINED FINANCIAL STATEMENTS
September 30, 2009
.
NOTE B - SUMMARY OF SIGNIFICANT ACCOUNTING POLICIES – Continued
Additionally, non-operating expenses include, among others, the interest portion of debt service payments, amortization of bond issue costs and bond discounts, ad valorem tax payments and associated fees related to the collection of ad valorem tax receipts.
20. Capitalized Interest
Interest costs on funds borrowed to finance the construction of property and equipment during the period of construction, net of interest income, are capitalized. Interest costs of $48,399 were capitalized for the year ended September 30, 2009.
21. Reclassifications
Certain accounts in the 2008 financial statements have been reclassified for comparative purposes to conform to the presentation in the 2009 financial statements.
NOTE C - CASH AND INVESTMENTS
1. Deposits
The bank balance of the Port Authority’s (primary government) deposits (unrestricted and restricted) was $46,439,874 at September 30, 2009 and the book balance was $45,978,875. For the component unit, the bank balance of deposits and the book balances were $35,397 and $35,077, respectively. The difference between the book and bank amounts is due to outstanding checks and transfers, and deposits in transit in its demand accounts.
Of the September 30, 2009 Port Authority’s bank balance, $250,000 was covered by Federal Depository Insurance Corporation (FDIC) and $46,189,874 was collateralized by the State of Florida collateral pool. The State of Florida collateral pool is a multiple financial institution pool with the ability to assess its members for collateral shortfalls if any of its member institutions fail. Required collateral is defined under Chapter 280, Florida Statutes, Securityfor Public Deposits.
2. Cash on Hand
For the component unit, deposits are maintained with a commercial bank, which is organized under the laws of the United States, and is insured by the FDIC up to $250,000 for all accounts at each financial institution.
The Port Authority had cash on hand in its petty cash funds totaling $13,000. The component unit had no cash on hand at the end of the fiscal year.
21

Tampa Port Authority
NOTES TO COMBINED FINANCIAL STATEMENTS
September 30, 2009
.
NOTE C - CASH AND INVESTMENTS – Continued
3. Investments
Section 218.415, Florida Statutes, and the Port Authority’s investment policy authorize the Port Authority to invest surplus funds in the following:
a. The Local Government Surplus Funds Trust Fund, an investment pool, under the sponsorship of the Florida State Board of Administration.
b. Negotiable direct obligations of, or obligations of which the principal and interest are unconditionally guaranteed by the United States (“U.S.”) Government.
c. Interest bearing time deposits or savings accounts in qualified public depositories, as defined in Florida Statute 280.02.
d. Obligations of the Federal Farm Credit Banks, Federal Home Loan Mortgage Corporation, or Federal Home Loan Bank or its district banks, including Federal Home Loan Mortgage Corporation participation certificates, or obligations guaranteed by the Government National Mortgage Association.
e. Securities of, or other interest in open-end or closed-end management type investment company or investment trust registered under the U.S. Investment Company Act of 1940, 15 U.S. C. ss.80a-1 et seq, as amended from time to time, provided the portfolio of such investment company or trust fund is limited to obligations of the U.S. Government or any agency or instrumentality thereof and to repurchase agreements fully collateralized by such U.S. Government obligations, and provided such an entity takes delivery of such collateral either directly or through an authorized custodian.
f. Prime commercial paper with the highest credit quality rating from a nationally recognized agency.
g. Tax exempt obligations rated “AA” or higher and issued by state and local governments.
h. Investment Agreements as defined herein, subject to collateralization requirements of Chapter 280, Florida Statutes and funds pledge to bonds, such other criteria acceptable to the bond insurer(s).
There were no violations to this policy during the current fiscal year. The Port Authority’s investments at September 30, 2009, consisted of the following:
The Port Authority invests funds throughout the year with the Florida Prime Fund Investment Pool and the Fund B Surplus Funds Trust Fund (the ”Fund B”) which are investment pools administered by the Florida State Board of Administration (“FSBA”), under the regulatory oversight of the State of Florida.
22

Tampa Port Authority
NOTES TO COMBINED FINANCIAL STATEMENTS
September 30, 2009
.
NOTE C - CASH AND INVESTMENTS – Continued
There is a risk of loss of interest on the investments if there are changes in the underlying indexed base. The FSBA met the criteria to be a “2a-7Like” pool, as defined in GASB No. 31 at September 30, 2009. Therefore, the investment was valued at share value, which approximates value. The total invested at September 30, 2009 through the Florida Prime Fund and Fund B was $110,600 and $61,305, respectively, and is included in cash and cash equivalents. The Florida Prime Fund is rated by Standards and Poors which is AAA. Fund B is not rated by any nationally recognized statistical rating agency. The weighted day to maturity of the Florida Prime Fund at September 30, 2009 was 33 days and the weighted average life of Fund B at September 30, 2009 was 6.69 years.
Investments in securities made by the Port Authority and its component unit (unrestricted and restricted) are summarized below. The investments are classified by category of investment and show the fair value, the weighted average maturity in years, and the credit rating. Since U.S. Treasury securities are considered to have no credit risk, they have, by definition, the highest possible credit rating. The Port Authority’s investment policy does not address the means of managing its exposure to changing interest rates and the effect on the fair value of its investments.
All investment income, including changes in the fair value of investments, is reported as a part of interest income in the financial statements.
Investments
Primary Component Weighted Avg.Government Units Maturity (yrs) Credit Rating
U.S. Treasury securities 314,016$ 938,500$ 0.16highest possible
Commercial paper 2,316,674 - 0.17 A1
2,630,690$ 938,500$
Fair Value
The weighted average maturity method expresses investment time horizons, the time when investments become due and payable, in years or months weighted to reflect the dollar size of individual investments within an investment type. In this illustration, the weighted average maturity is computed for each investment type. The weighted average maturity for the primary government as a whole, at year end, was 0.17 years.
23
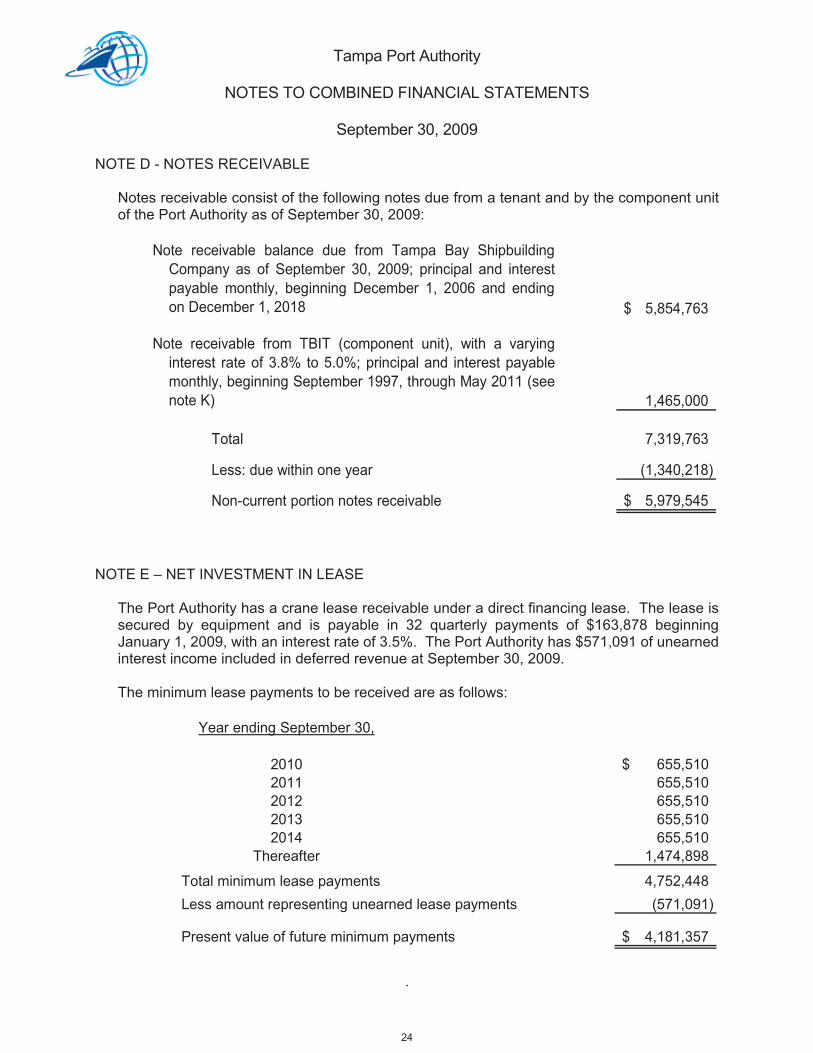
Tampa Port Authority
NOTES TO COMBINED FINANCIAL STATEMENTS
September 30, 2009
.
NOTE D - NOTES RECEIVABLE
Notes receivable consist of the following notes due from a tenant and by the component unit of the Port Authority as of September 30, 2009:
Company as of September 30, 2009; principal and interestpayable monthly, beginning December 1, 2006 and endingon December 1, 2018 5,854,763$
interest rate of 3.8% to 5.0%; principal and interest payablemonthly, beginning September 1997, through May 2011 (seenote K) 1,465,000
Total 7,319,763
Less: due within one year (1,340,218)
Non-current portion notes receivable 5,979,545$
Note receivable balance due from Tampa Bay Shipbuilding
Note receivable from TBIT (component unit), with a varying
NOTE E – NET INVESTMENT IN LEASE
The Port Authority has a crane lease receivable under a direct financing lease. The lease is secured by equipment and is payable in 32 quarterly payments of $163,878 beginning January 1, 2009, with an interest rate of 3.5%. The Port Authority has $571,091 of unearned interest income included in deferred revenue at September 30, 2009.
The minimum lease payments to be received are as follows:
655,510$ 655,510 655,510 655,510 655,510
1,474,898
4,752,448(571,091)
4,181,357$
Less amount representing unearned lease payments
Present value of future minimum payments
Year ending September 30,
20122013
Total minimum lease payments
20102011
2014Thereafter
24

Tampa Port Authority
NOTES TO COMBINED FINANCIAL STATEMENTS
September 30, 2009
.
NOTE F - LEASE ACQUISITION COSTS
Lease acquisition costs represent funds expended by the Port Authority to perpetuate the opportunity to lease facilities within the Port District and consist of the following changes during fiscal year 2009:
Cost of lease acquisitions 4,333,257$
Accumulated amortization, fiscal year 2009 (2,900,588)
Balance, September 30, 2009 1,432,669$
NOTE G - INTANGIBLE ASSETS
Primary Government - Intangible assets of the primary government consist of the following at September 30, 2009:
Cost of TBIT loan forgiveness 2,075,108$Accumulated amortization, fiscal year 2009 (1,937,539)
Balance, September 30, 2009 137,569$
Component Unit - Intangible assets of the component unit consist of the following at September 30, 2009:
Cost in excess of net assets acquired (goodwill) 2,000,000$Accumulated amortization, fiscal year 2009 (1,275,120)
Balance, September 30, 2009 724,880$
The cost in excess of net assets acquired (known as “goodwill”) is related to the acquisition of three terminal operating companies that were purchased by TBIT between July, 1989 and October, 1990. Long-lived assets to be held (such as goodwill) and used by TBIT are to be reviewed for impairment whenever changes in circumstances indicate that the carrying amount of the assets may not be recoverable. In performing the review for recoverability, TBIT would estimate the future cash flows expected to result from the use of the asset and its eventual disposition. If the sum of the expected future net cash flows is less than the carrying amount of the asset, an impairment loss would be measured and recognized. Otherwise, an impairment loss would not be recognized. Goodwill is not impaired as of September 30, 2009.
25

Tampa Port Authority
NOTES TO COMBINED FINANCIAL STATEMENTS
September 30, 2009
.
NOTE H - CAPITAL ASSETS
A summary of changes in capital assets is as follows:
September 30, September 30,2008 Additions Transfers Deletions 2009
Owned assetsCapital assets not being depreciated
Land 113,891,043$ -$ 610,000$ -$ 114,501,043$ Construction in progress 12,541,870 48,507,407 (12,628,470) - 48,420,807
Total capital assets notdepreciated 126,432,913 48,507,407 (12,018,470) - 162,921,850
Capital assets being depreciatedBuildings 145,990,436 - 877,246 - 146,867,682 Infrastructure 229,856,054 - 1,880,581 - 231,736,635 Dredging 58,683,770 - 2,507,782 - 61,191,552 Equipment and furnishing 5,973,167 - 6,752,861 (4,598,000) 8,128,028
Total capital assets depreciated 440,503,427 - 12,018,470 (4,598,000) 447,923,897
Less accumulated depreciationBuildings 30,828,290 3,803,475 - - 34,631,765 Infrastructure 65,994,878 7,037,770 - - 73,032,648 Dredging 23,547,289 5,773,465 - - 29,320,754 Equipment and furnishing 4,480,934 541,095 - (19,158) 5,002,871
Total accumulated depreciation 124,851,391 17,155,805 - (19,158) 141,988,038
Total depreciable capital assets, net 315,652,036 (17,155,805) 12,018,470 (4,578,842) 305,935,859
Owned capital assets, net 442,084,949$ 31,351,602$ -$ (4,578,842)$ 468,857,709$
Primary Government
Depreciation expense for the Tampa Port Authority (primary government) for the year ended September 30, 2009 was $17,155,805 for owned assets. The Port Authority’s construction in progress of $48,420,407 at September 30, 2009 primarily relates to capital improvements, development and new construction of berths and warehouse facilities, and interest costs capitalized on debt issued to finance long-term construction projects throughout the Port District. Information related to the Port Authority’s intangible assets are included in note G.
NOTE I - CURRENT LEASE AGREEMENTS WITH TENANTS
Substantially all of the Port Authority’s property and equipment are leased to various port operations for periods of up to 40 years. These leases are classified as operating. Future minimum rentals, including renewal options, to be received under non-cancelable operating leases are as follows:
26
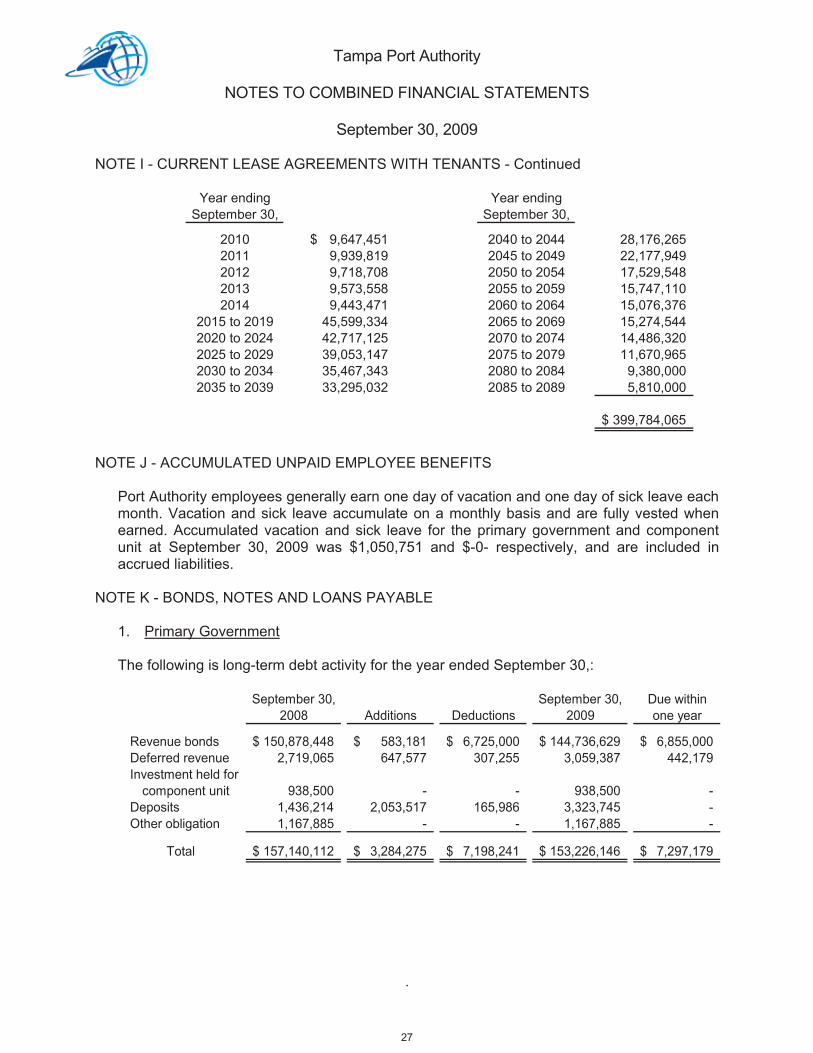
Tampa Port Authority
NOTES TO COMBINED FINANCIAL STATEMENTS
September 30, 2009
.
NOTE I - CURRENT LEASE AGREEMENTS WITH TENANTS - Continued
Year ending Year endingSeptember 30, September 30,
2010 9,647,451$ 2040 to 2044 28,176,265 2011 9,939,819 2045 to 2049 22,177,949 2012 9,718,708 2050 to 2054 17,529,548 2013 9,573,558 2055 to 2059 15,747,110 2014 9,443,471 2060 to 2064 15,076,376
2015 to 2019 45,599,334 2065 to 2069 15,274,544 2020 to 2024 42,717,125 2070 to 2074 14,486,320 2025 to 2029 39,053,147 2075 to 2079 11,670,965 2030 to 2034 35,467,343 2080 to 2084 9,380,000 2035 to 2039 33,295,032 2085 to 2089 5,810,000
399,784,065$
NOTE J - ACCUMULATED UNPAID EMPLOYEE BENEFITS
Port Authority employees generally earn one day of vacation and one day of sick leave each month. Vacation and sick leave accumulate on a monthly basis and are fully vested when earned. Accumulated vacation and sick leave for the primary government and component unit at September 30, 2009 was $1,050,751 and $-0- respectively, and are included in accrued liabilities.
NOTE K - BONDS, NOTES AND LOANS PAYABLE
1. Primary Government
The following is long-term debt activity for the year ended September 30,:
September 30, September 30, Due within2008 Additions Deductions 2009 one year
Revenue bonds 150,878,448$ 583,181$ 6,725,000$ 144,736,629$ 6,855,000$Deferred revenue 2,719,065 647,577 307,255 3,059,387 442,179 Investment held for
component unit 938,500 - - 938,500 - Deposits 1,436,214 2,053,517 165,986 3,323,745 - Other obligation 1,167,885 - - 1,167,885 -
Total 157,140,112$ 3,284,275$ 7,198,241$ 153,226,146$ 7,297,179$
27

Tampa Port Authority
NOTES TO COMBINED FINANCIAL STATEMENTS
September 30, 2009
.
NOTE K - BONDS, NOTES AND LOANS PAYABLE - Continued
Revenue Bonds/Revenue note
maturing through 2011 1,750,000$
12,680,000 6,340,000 3,745,000
1,305,000 1,640,000 2,680,000 3,580,000
2003 revenue refunding bonds, collateralized by a pledge and lien on gross
12,071,534
55,135,000
2,335,000 4,380,000 4,745,000 6,015,000
26,900,000
Total outstanding balance 145,301,534 Unamortized (discount)/premium - net 2,010,043 Less unamortized losses on defeasance (2,574,948) Carrying amount 144,736,629 Less current maturities (6,855,000)
Bonds, notes and loans payable - noncurrent 137,881,629$
the Port Authority 65% of LIBOR rate plus 87 basis points, maturing 20232008 revenue note, collaterized by a pledge and lien on gross revenues of
2005A revenue refunding bonds, collateralized by a pledge and lien on gross
of the Port Authority4% to 4.125% serial bonds, maturing through 20135% term bonds, maturing 2026
lien on gross revenues of the Port Authority 3.8% to 5%, serial bonds,
of the Port Authority
4.75% term bonds maturing 20315% term bonds, maturing 2036
2002A revenue bonds, collateralized by a pledge and lien on gross revenues
2006 revenue bonds, collateralized by a pledge and lien on gross revenues
of the Port Authority6.25% to 6.75% serial bonds, maturing 20136.5% term bonds, maturing 20176.875% term bonds, maturing 20226.875% term bonds, maturing 2027
revenues of the Port Authority
2002B revenue bonds, collateralized by a pledge and lien on gross revenues
4.125% to 5.75% serial bonds, maturing 20215.25% term bonds, maturing 20255.375% term bonds, maturing 2027
3.91% to 5.22% serial bonds, maturing in 2013
revenues of the Port Authority3% to 5% serial bonds, maturing through 2020
1997 refunding revenue bonds (TBIT Project), collateralized by a pledge and
28

Tampa Port Authority
NOTES TO COMBINED FINANCIAL STATEMENTS
September 30, 2009
.
NOTE K - BONDS, NOTES AND LOANS PAYABLE - Continued
Debt maturities and related interest payments at September 30, 2009 consist of the following:
Year endingSeptember 30, Principal Interest Total
2010 6,855,000$ 6,559,739$ 13,414,739$2011 7,040,000 6,373,156 13,413,1562012 7,235,000 6,179,318 13,414,3182013 8,840,000 5,950,490 14,790,4902014 8,266,534 5,675,211 13,941,745
2015 - 2019 54,480,000 21,339,327 75,819,3272020 - 2024 32,485,000 8,989,225 41,474,2252025 - 2029 12,055,000 3,541,101 15,596,1012030 - 2034 5,460,000 1,483,575 6,943,5752035 - 2038 2,585,000 195,500 2,780,500
Total 145,301,534$ 66,286,642$ 211,588,176$
The Port Authority entered into a revenue note with a bank in June 2008 for $27,000,000 at an interest rate of 65% of the 1 month LIBOR, plus 87 basis points. The revenue note was used to retire the 1998 bonds and to terminate the existing synthetic forward refunding.
As a result of this debt, a deferred refunding loss of $669,353 was recorded as a component of the debt liability and is deducted from long-term bonds payable. This deferred loss is being amortized through 2023. The unamortized loss balance at September 30, 2009 was $609,855. In conjunction with the 2008 revenue note, the Port Authority entered into an agreement whereby the Port Authority swaps the interest on the variable rate debt for a fixed interest rate of 3.86% (see further discussion of the interest rate swap agreement on page 36). The estimated net present value of this transaction was $545,350.
In May 2006, the Port Authority issued $26,825,000 in revenue bonds Series 2006, with interest rates ranging from 4% to 5%, and with final maturities ending through 2036. The Series 2006 bonds will be used to finance all or a portion of the costs of acquiring, constructing and improving facilities of the Port.
In March 2005, the Port Authority issued $56,475,000 in revenue refunding bonds Series 2005A, with interest rates ranging from 3% to 5%, and with final maturities ending through 2020. The Series 2005A bonds were issued to currently refund Series 1995 Special Revenue bonds. As a result of this debt, a deferred refunding loss of $2,801,793 was recorded as a component of the debt liability and is deducted from long-term bonds payable.
29

Tampa Port Authority
NOTES TO COMBINED FINANCIAL STATEMENTS
September 30, 2009
.
NOTE K - BONDS, NOTES AND LOANS PAYABLE - Continued
This deferred loss is being amortized through 2020. The unamortized loss balance at September 30, 2009 was $1,965,093.The net present value of the interest savings over the term of the bond results in an economic gain of approximately $1,493,000. Additionally, the debt service savings approximated $4,024,000.
In November 2003, the Port Authority issued $11,520,790 of Revenue Refunding Bonds (Tampa Port Authority Project), Series 2003, with interest ranging from 3.91% to 5.22%, and with final maturities ending through December 1, 2013. Bond proceeds were used to fund the payment of the Hillsborough County Port District Second Lien Revenue Bonds (Tampa Port Authority Project) Series 1994 bonds on December 1, 2003 which were called to purchase a debt service reserve fund surety bond, and to pay bond issuance costs of the 2003 bonds. The principal balance of the Revenue Refunding Bonds at September 30, 2009 includes accreted interest of $2,960,321. The net present value of the interest savings over the term of the bond results in an economic gain of approximately $617,000. Additionally, the debt service savings approximated $890,000.
In April 2002, the Port Authority issued $25,000,000 of revenue bonds, (Tampa Port Authority Project), Series 2002A, with interest ranging from 4.125% to 5.75%, with principal payments beginning 2007, and with final maturities ending through 2027. Also, in April 2002, the Port Authority issued $10,000,000 of revenue bonds, (Tampa Port Authority Project), Series 2002B (taxable), with interest ranging from 6.25% to 6.875%, with principal payments beginning in 2007, and with final maturities ending through 2027. Bond proceeds are being expended and are being used to finance the cost of acquiring, constructing and improving the facilities of the Port Authority.
In August 1997, the Port Authority issued $9,385,000 of refunding revenue bonds, Series 1997, with interest ranging from 3.8% to 5%, and with final maturities ending through 2011. Bond proceeds of approximately $340,000 were used to pay bond discounts and costs associated with the issuance of the bonds. After making certain accrued interest payments and payments to reserve accounts, the remaining bond proceeds were used to advance refund the 1990 Special Purpose Revenue Bonds, (Tampa Bay International Terminals, Inc.) to take advantage of lower interest rates. The 1997 bonds are on parity with the other Port Authority bond issues. In conjunction with the issuance of these bonds, the Port Authority and TBIT entered into a Loan Agreement dated August 1, 1997 whereby TBIT pays the Port Authority an amount equal to the principal and interest due on the 1997 Bonds in accordance with an installment schedule attached to the above referenced loan agreement.
Legal Debt Limit - The Port Authority has no legal debt limit as set forth in the Constitution of the State of Florida and the Florida Statutes. However, the Master Bond resolution dated April 6, 1995 establishes certain maximum debt service requirements, which are more restrictive and are based on net revenue generated by the Port Authority.
30

Tampa Port Authority
NOTES TO COMBINED FINANCIAL STATEMENTS
September 30, 2009
.
NOTE K - BONDS, NOTES AND LOANS PAYABLE - Continued
Restrictive Bond Covenants - The various bond indentures contain significant limitations and restrictions on annual debt service requirements, maintenance of and flow of funds through various restricted accounts, minimum amounts to be maintained in various sinking funds, and minimum bond coverage. The Port Authority has complied with all significant covenants.
Knock-in Swaption - In July 2002, the Port Authority entered into a knock-in swap option agreement (“swaption”) for a notional amount that would not exceed $32,420,000, fair value as of September 30, 2009, of its fixed rate debt portfolio. Under the agreement, the Port Authority has received an upfront option premium of $1,002,000 for entering into the knock-in swaption.
The Port Authority will continue to pay interest on its outstanding debt at the fixed interest rate provided by the bonds. However, the Port Authority will effectively pay a variable rate on the debt, if the Port Authority is knocked into the swap agreement. The debt service requirements to maturity of the bonds are based on the fixed rate. Only if and when the Bond Market Association (“BMA”) Municipal Swap Index exceeds 6% for a period of 180 consecutive days after December 1, 2004, will the swaption provider have the option to require the Port Authority to pay interest at a variable rate. If the option is exercised, the swaption provider will pay the Port Authority a fixed rate of 5.0532%, and the Port Authority will pay the swaption provider a variable rate of BMA Municipal Swap Index plus 25 basis points. The notional amount under the agreement matches the final maturity of a portion of the Port Authority’s outstanding long-term debt and will amortize with the amortization of these bonds.
The notional amount of the contract diminishes with the maturity of the Port Authority’s bonds as follows:
Start Date Maturity Date Notional Amount
June 1, 2004 June 1, 2009 32,420,000$ June 1, 2009 June 1, 2010 30,295,000 June 1, 2010 June 1, 2011 28,625,000 June 1, 2011 June 1, 2012 26,870,000 June 1, 2012 June 1, 2013 25,960,000 June 1, 2013 June 1, 2014 25,000,000 June 1, 2014 June 1, 2015 25,000,000 June 1, 2015 June 1, 2016 24,050,000 June 1, 2016 June 1, 2017 23,180,000 June 1, 2017 June 1, 2018 22,415,000 June 1, 2018 June 1, 2019 21,765,000 June 1, 2019 June 1, 2020 21,245,000 June 1, 2020 June 1, 2021 20,865,000 June 1, 2021 June 1, 2022 14,245,000 June 1, 2022 June 1, 2023 7,295,000
31

Tampa Port Authority
NOTES TO COMBINED FINANCIAL STATEMENTS
September 30, 2009
.
NOTE K - BONDS, NOTES AND LOANS PAYABLE - Continued
The Port Authority has an optional right of termination at any time, with a termination payment payable by or to the Port Authority based on the current market conditions at the time of termination. If the swaption provider defaults under the agreement, the Port Authority would not be exposed to interest rate changes and would have no obligation to make a termination payment. Had the Port Authority elected to terminate the swaption on September 30, 2009, a termination fee of $773,000 would have been payable by the Port, based on the current market conditions at that time.
Synthetic Forward Refunding
On October 21, 1998, the Port Authority issued $25 million of revenue bonds (the “1998 bonds). On April 4, 2002, the Port Authority issued $25 million of revenue bonds (the “2002A bonds”) (collectively, the “Bonds”). During the year ended September 30, 2007 the long-term interest rate environment would economically benefit the Port Authority if the Bonds could be refunded and reissued at lower rates. However, the 1998 bonds cannot be redeemed or called until June 1, 2008 and the 2002A bonds cannot be redeemed or called until June 1, 2012. Additionally, the bonds are subject to the Alternative Minimum Tax provision of current tax law and therefore could not be advance refunded.
During the year ended September 30, 2007, the Port Authority’s Board of Commissioners authorized a synthetic forward refunding on the 1998 and 2002A bonds which closed December 19, 2006. The transaction allowed the Port Authority the option of taking the expected savings upfront at the time transaction is executed, or to spread the savings over the life of the bonds. The Port Authority elected to take the upfront cash proceeds of $2,311,135. Between December 19, 2006 and June 1, 2012 (for the 2002A bonds) the Port Authority will make a decision to terminate the agreement or to let the counterparty exercise their option to require the Port Authority to issue variable rate debt which would then be swapped for fixed rate payments.
During the year ended September 30, 2008 the Port authority terminated the synthetic forward refunding on the 1998 bonds. Terminating this agreement involves making a net termination payment of $1.7 million which involves a termination payment of $3.1 million less $1.4 million received upfront in December 2006.
The Port Authority has an optional right of termination at any time, with a termination payment payable by or to the Port Authority based on the current market conditions at the time of termination. If the provider defaults, the Port Authority would not be exposed to interest rate changes and would have no obligation to make a termination payment. Had the Port Authority elected to terminate the agreement on September 30, 2009, a termination fee of $2,401,223 would have been payable by the Port, based on the current market conditions at that time.
32

Tampa Port Authority
NOTES TO COMBINED FINANCIAL STATEMENTS
September 30, 2009
.
NOTE K - BONDS, NOTES AND LOANS PAYABLE - Continued
Interest Rate Swap
During the year ended September 30, 2008 entered into a revenue note payable of $27,000,000 which bears interest equal to 65% of one month LIBOR plus 87 basis points, and matures in 2023. At the closing of the loan, the Port Authority entered into an interest rate swap agreement whereby the Port Authority swaps their variable rate debt for a fixed interest rate of 3.86%. The swap will cover the entire principal amount of the 2008 revenue note and the term of the swap is equal to the term of the 2008 revenue note. Had the Port Authority elected to terminate the swap agreement on September 30, 2009, a termination fee of $1,880,899 would have been payable by the Port based on the current market conditions at that time.
Defeased Debt - Pursuant to the GASB Statement No. 7, Advance Refunding Resulting in Defeasance of Debt, the Tampa Port Authority does not report defeased/refunded bond funds on its statement of net assets.
The principal balance due on bond issues defeased is as follows as of September 30, 2009:
Revenue Bonds, Series 1973A Term Bonds 3,165,000$ Special Refunding Revenue Bonds, Series 1976A Term Bonds 275,000 Refunding Revenue Bonds, Series 1977 Term Bonds 16,200,000 Refunding Revenue Bonds, Series 1995B 3,545,000 Revenue Bonds, Series 1998 Term Bonds 25,000,000
48,185,000$
2. Component Unit
Notes payable of the component unit consists of the following at September 30, 2009:
Note payable to the Port Authority with a varying interest rate of3.8% to 5.0%; principal and interest payable monthly, beginning September 1997 through May 2011; collateralized by a pledgeof TBIT's gross revenues 1,465,000$
Less current portion (868,333)
Long-term portion 596,667$
33

Tampa Port Authority
NOTES TO COMBINED FINANCIAL STATEMENTS
September 30, 2009
.
NOTE K - BONDS, NOTES AND LOANS PAYABLE - Continued
Debt maturities consisted of the following at September 30,:
868,333$ 596,667
1,465,000$
Year ending September 30,
20102011
On August 1, 1997, the Port Authority executed a loan agreement with TBIT (the component unit) whereby a loan payable was recorded to the Port Authority equal to the 1997 bond issuance maturity value of $9,385,000. Additionally, the Port Authority is to maintain a debt service reserve of $938,500, which will apply to the loan’s final principal payments. TBIT receives interest earnings on the debt service reserve. Interest earned by TBIT on debt service and bond reserve funds was $53,917 for the year ended September 30, 2009. TBIT’s interest expense on the above notes was $114,833 for the year ended September 30, 2009.
NOTE L - OTHER OBLIGATION
The Port Authority entered into a Project Cooperation Agreement with the Department of the Army - Corps of Engineers to dredge a portion of the main ship channel in the Hillsborough County Port District in April 2000. The Project is referred to as the Ybor Channel Turning Basin Project and is complete.
The Project Cooperation Agreement committed Federal Government funding of 75% towards project costs and required the Port Authority, a non-Federal Sponsor, to fund 25% of the project costs, which were paid by the Port Authority as of September 30, 2009. In addition to the 25% matching funding by the Port Authority, the agreement also required that the Port Authority be responsible for an additional 10% of total project costs. Repayment of this amount ($1,167,885) to the Corps of Engineers may be spread over a period of up to thirty years. The repayment terms of this agreement have not been settled as of September 30, 2009.
NOTE M - EMPLOYEE RETIREMENT PLANS
1. Defined Benefit Plan
Substantially all full-time employees of the Port Authority are participants in the Florida Retirement System (the “System”), a multiple-employer, cost-sharing public retirement system. The System, which is controlled by the State Legislature and administered by the State of Florida, Department of Administration, Division of Retirement, covers approximately 646,000 full-time employees of the State of Florida and various governmental units within the state.
34

Tampa Port Authority
NOTES TO COMBINED FINANCIAL STATEMENTS
September 30, 2009
.
NOTE M - EMPLOYEE RETIREMENT PLANS - Continued
The System provides for vesting of benefits after six years of creditable service. Normal retirement benefits are available to employees who retire at or after age 62 with six or more years of service. Early retirement is available after six years of service with a 5% reduction of benefits for each year prior to the normal retirement age.
Retirement benefits are based upon age, average compensation and years-of-service credit where average compensation is computed as the average of an individual’s five highest years of earnings. Employees are not required to contribute to this retirement system.
The Port Authority has no responsibility to the System other than to make the periodic payments required by State Statutes. The Florida Division of Retirement issues a publicly available financial report that includes financial statements and required supplementary information for the System. The report may be obtained by writing to Florida Division of Retirement, 2639 Monroe Street, Building C, Tallahassee, Florida 32399-1560.
Effective July 1, 1998, the Florida Legislature established a Deferred Retirement Option Program (“DROP”). This program allows eligible employees to defer receipt of monthly retirement benefit payments while continuing employment with a System employer for a period not to exceed 60 months after electing to participate. Deferred monthly benefits are held in the Florida Retirement System Trust Fund and accrue interest.
2. Defined Contribution Plan
Beginning December 1, 2002, the System offered a second retirement plan option, the FRS Investment Plan. Under this plan, the employer pays all contributions which are a percentage of salary based on the System’s Membership Class. The employer contributes to an account in the employee’s name. The employee makes investment elections with the investment funds chosen by the Florida State Board of Administration. The retirement benefit is based on the account balance, and the benefit is vested after one year of service. If an employee leaves the job, he or she can keep the benefit in the System, or transfer his or her account to another retirement plan.
The employee can also elect to cash out the benefit when leaving but is subject to tax penalties for taking early withdrawal. An employee in this plan is not eligible for DROP. All employees in the System’s defined benefit pension plan were given a choice of switching to the FRS Investment Plan within a designated time period.
3. Contributions to Florida Retirement System
For the System’s fiscal year commencing July 1, 2008, the participating employer contributions are based upon statewide rates established by the State of Florida. The contributions by participating employers are the same for the defined benefit plan and the defined contribution plan. These rates are applied to employee salaries as follows: for regular employees at 9.85%, senior management at 13.12%, and Deferred Retirement Option Program (DROP) at 10.91%. The Port Authority’s contributions made during the years ended September 30, 2009, 2008 and 2007 were $733,753, $705,980, and $697,799, respectively, equal to the actuarially determined contribution requirements for each year.
35

Tampa Port Authority
NOTES TO COMBINED FINANCIAL STATEMENTS
September 30, 2009
.
NOTE N – OTHER POSTEMPLOYMENT BENEFITS (OPEB)
The Port Authority participates in the post-employment benefit plan administered by Hillsborough County, Florida (the “County”). Information related to the County OPEB plan follows.
In accordance with GASB Statement No. 45, Accounting and Financial Reporting by Employers for Postemployment Benefits Other Than Pension, the County expenses the cost of post-employment benefits over the active service lives of their employees rather than using a “pay-as-you-go” basis. Expensing the cost of a future benefit over the active work-lives of employees is a fiscally sound approach because employees actually earn the future benefits over their working careers.
OPEB Plan Description. The County provides the following health-related benefits to retirees and certain other employees: (a) The County is required by Florida Statute 112.0801 to allow retirees and certain other former employees to buy healthcare coverage at the same “group insurance rates” that current employees are charged. Although retirees pay for healthcare at group rates, they are receiving a valuable benefit because they can buy insurance at costs that are lower than the costs associated with the experience rating for their age bracket. The availability of this lower cost health insurance represents an “implicit subsidy” for retirees. (b) The County offers a monthly stipend of $5 for each year of service up to a maximum benefit of $150 per month. The stipend is payable to regular retired employees from ages 62 to 65 and to special risk retired employees from ages 55 to 65. The stipend is to be used to offset the cost of health insurance. Although the implicit subsidy is required by state law when healthcare is offered as an employee benefit, the stipend may be cancelled at any time. The OPEB plan does not issue a stand-alone financial report; its financial activity is included in the financial activity of the County.
Annual OPEB cost and net OPEB Obligation. The actuary’s estimate of the County's accrued OPEB liability, also known as the actuarial accrued liability, which approximates the present value of all future expected postemployment medical premiums, associated administrative costs and stipend payments (which are attributable to the past service of active and retired employees) was $60.978 million at September 30, 2009. The County’s annual OPEB cost, which is defined as the OPEB expenses on an accrual basis, was $6.086 million at September 30, 2009. The annual OPEB cost is calculated based on the annual required contribution (ARC), an amount actuarially determined in accordance with GASB Statement No. 45. The ARC represents a level of funding that, if paid on an ongoing basis, is projected to cover normal cost (current and future benefits earned) each year and to amortize any unfunded actuarial liabilities over a period of time not to exceed thirty years. The County's estimated ARC for fiscal year 2009 was $5.171 million. The net OPEB obligation is the net amount for which the County would be obligated and is equivalent to the net OPEB obligation at the start of the fiscal year plus the annual OPEB cost for the current fiscal year less estimated contributions such as through retiree claims and stipends paid by the County.
Annual Percentage of Annual Net OPEBOPEB Cost OPEB Cost Contributed Obligation
8,985,000$ 44% 4,993,000$5,204,000$ 76% 6,085,000$
FiscalYear20082009
36

Tampa Port Authority
NOTES TO COMBINED FINANCIAL STATEMENTS
September 30, 2009
.
NOTE N – OTHER POSTEMPLOYMENT BENEFITS (OPEB) - Continued
Funding Policy, Status and Progress. Because “funding” the OPEB obligations, as defined by GASB statement No. 45 require using an irrevocable trust fund, which is considered very restrictive, the County did not “fund” the net OPEB obligation, but instead chose to appropriate and set aside an equivalent amount to the Self-Insurance Internal Services Fund. Each fund was assessed its share of OPEB costs based on the number of employees in the fund, divided by the total number of County employees. Assessments were then placed to the Self-Insurance Internal Service Fund. Even though money was set aside to more than completely offset the net OPEB obligation, the County is not considered to have funded the obligation since an irrevocable trust fund was not used. It is the County’s intent for future years to continue setting aside an amount equivalent to the annual OPEB cost, however, the County has no legal or contractual obligation to do so. The annual OPEB cost is the ARC plus one year’s interest on the net OPEB obligation. The funded status of the plan as of September 30, 2009 follows:
Funded* Set Aside*
Actuarial valuations date September 30, 2009 September 30, 2009Actuarial value of plan assets* -$ 11,242$ Actuarial accrued liability (AAL) 60,978 60,978 Unfunded actuarial accrued liability (UAAL) 60,978 49,736 Actuarial value of plan assets*/AAL (funded ratio) 0% 18.4%Covered payroll (active plan members) 541,684 541,684 UAAL as a percentage of covered payroll* 11.3% 9.2%
.
Amounts in Thousands
*Although $11.242 million were set aside in an internal service fund to more than completely offset the net OPEB obligation for September 30, 2009, the amount considered to be funded was zero since an irrevocable trust fund was not used.
The calculation of these actuarial estimates is based on a number of estimates and assumptions, including interest rates on investments, the healthcare cost trend, future employment and average retirement age, life expectancy, and healthcare costs per employee, many of which factors are subject to future economic and demographic variations. Amounts determined regarding the funded status of the plan and the annual required contributions of the employer are subject to continual revision as actual results are compared with past expectations and new estimates are made about the future.
Actuarial Methods and Assumptions. Projections of benefits for financial reporting purposes are based on the substantive plan (the plan as understood by the employer and plan members) and include the types of benefits provided at the time of each valuation and the historical pattern of sharing of benefit costs between the employer and plan members to that point. The actuarial methods and assumptions used include techniques that are designed to reduce short-term volatility in actuarial accrued liabilities and the actuarial value of assets, consistent with the long-term perspective of the calculations.
37

Tampa Port Authority
NOTES TO COMBINED FINANCIAL STATEMENTS
September 30, 2009
.
NOTE N – OTHER POSTEMPLOYMENT BENEFITS (OPEB) – Continued
The entry age actuarial cost method was used in the September 30, 2009 actuarial valuation. Other actuarial assumptions included a 3.5% investment rate of return and an annual healthcare cost trend rate of 10.5% initially, reduced by 1% per year, to an ultimate rate of 5.5% for fiscal year 2014. The approximate average age of employees is 46, with 12 years of service completed and 12 years of additional service estimated. The actuarial value of the County’s assets was determined using the fair value of cash and investments at September 30, 2009. The County’s unfunded actuarial accrued liability is being amortized as a level percentage of projected payroll on a closed basis. The amortization period used by the County at September 30, 2009, was 30 years.
The Port Authority’s share of the other post employment benefits liability for the year ended September 30, 2009 is $0.
NOTE O - RELATIONSHIP BETWEEN PRIMARY GOVERNMENT AND COMPONENT UNIT
The Port Authority entered in an Operating Agreement with its component unit, TBIT, dated January 9, 1990 and amended effective October 1, 1995 with an expiration date of December 31, 2009. The terms of the Amended Operating Agreement provided for TBIT to collect on behalf of and remit to the Port Authority certain wharfage fees derived by the Port Authority on an annual basis.
Effective May 30, 2006, the Port Authority entered into an agreement with Ports America, Inc. (“PAI”) (the Concession Agreement) to provide terminal operations on its behalf and in the place of TBIT. The role of TBIT changed from that of terminal operator to PAI contract administrator for the Port Authority. Its legal status did not change, and it remains a component unit of the Port Authority. See further discussion at note S.
In addition to the above agreement, the Port Director of the Port Authority, one individual appointed by the Port Authority’s Board of Commissioners, and a member of the Port Authority’s Board of Commissioners are members of the Board of Directors of TBIT.
The contract entered into between the Port Authority and TBIT, effective May 30, 2006, suspends the original agreements shown above.
NOTE P - FLORIDA PORTS FINANCING COMMISSION
The Port Authority is a participant in a program of the Florida Ports Financing Commission (the “Ports Commission”) whereby the Ports Commission lends certain bonds proceeds to finance, refinance or reimburse the cost of acquiring and constructing capital projects for certain participating ports within the State of Florida. The Ports Commission has received and provided funding to various Florida ports through two different bond issuances: The $222,320,000 Revenue Bonds (State Transportation Trust Fund), Series 1996, and $153,115,000 Revenue Bonds, (State Transportation Trust Fund - Intermodal Program), Series 1999.
38

Tampa Port Authority
NOTES TO COMBINED FINANCIAL STATEMENTS
September 30, 2009
.
NOTE P - FLORIDA PORTS FINANCING COMMISSION – Continued
Subsequently, the Port Authority entered into a loan agreement with the Ports Commission to make semi-annual payments of principal and interest on bond proceeds borrowed by the Port Authority (the “Basic Payments”). Pursuant to its loan agreement, the Port Authority has assigned all of its rights, title and interest in moneys due to the Port Authority from the State Transportation Trust Fund pursuant to Sections 320.20(3) and 320.20(4), Florida Statutes, to repay its loan.
In effect, the Basic Payments required to be paid by the Port Authority pursuant to its loan agreement with the Ports Commission are payable solely from moneys due to the Port Authority from the State Transportation Trust Fund pursuant to Sections 320.20(3) and 320.20(4), Florida Statutes, which provides that $15,000,000 and $10,000,000, respectively, in certain revenues derived from the registration of motor vehicles in Florida be deposited annually in the State Transportation Trust Fund for funding certain Port projects.
The Port Authority has been allocated approximately $61.7 million from Ports Commission bond proceeds, which amounts were deposited into interest earning escrow accounts for certain projects, specifically, cargo and cruise berth and terminal improvements; intermodal road, rail and other infrastructure improvements; cargo-handling equipment; and dredge material disposal site development. The Port Authority, like all participants in the program, has agreed to provide moneys (from sources other than proceeds borrowed under the loan agreement with the Ports Commission) to fund a portion of the cost of such projects. These moneys will be utilized by the Port Authority to pay the costs of such projects on a matching basis with moneys received by the Port Authority pursuant to its loan agreement with the Ports Commission. The Port Authority has drawn down approximately $61.7 million from its escrow account to fund such projects at September 30, 2009.
NOTE Q - RISK MANAGEMENT
The Port Authority is exposed to various risks of loss related to torts; theft of, damage to, and destruction of assets; errors and omissions; injuries to employees; and natural disasters. The Port Authority manages the exposure to these risks through the purchase of commercial insurance with high limits of coverage. Specific details regarding deductibles and coverage can be found in the supplemental schedules of the Comprehensive Annual Financial Report of the Port Authority. The Port Authority has not significantly reduced insurance coverage from the prior year nor did the amount of settlement exceed the insurance coverage for each of the past three fiscal years.
NOTE R - COMMITMENTS AND CONTINGENCIES
1. Litigation
There are several matters pending claims and lawsuits in which the Port Authority is involved. In the opinion of the Port Authority’s management, the ultimate resolution of these claims would not be material to the financial position of the Port Authority.
39

Tampa Port Authority
NOTES TO COMBINED FINANCIAL STATEMENTS
September 30, 2009
.
NOTE R - COMMITMENTS AND CONTINGENCIES - Continued
2. Special Purpose Revenue Bonds
From time to time, the Port Authority participates with its tenants in the issuance of special purpose revenue bonds, which provide funds to finance construction of capital improvements within the Port District. The Port Authority receives a security interest in the specific, project revenues to secure payment of rents and the performance of tenant obligations. The Port Authority has determined that, in general, these bonds do not represent obligations of the Port Authority, although the Port Authority does retain a lessor’s interest in said capital improvements.
Upon termination or expiration of the leases, the Port Authority retains its ownership interest in said property and the right to possession reverts to the Port Authority. There are no remaining special purpose revenue bonds as of September 30, 2009.
3. Knock-in Swaption
See note K.
4. Commitments
The Tampa Port Authority had contractual commitments for various projects that amounted to approximately $63 million as of September 30, 2009.
5. Component Unit
See note S below.
6. Synthetic Forward Refunding
See note K.
NOTE S - RELATIONSHIP AMONG THE PORT AUTHORITY, TBIT AND PAI
The Port Authority is the owner of certain public berths, wharves, yards and other improvements, which are currently used as terminal facilities for the handling of general cargo in the Port of Tampa. On January 9, 1990, the Port Authority granted use of these facilities to TBIT under an Operating Agreement of that date and amended on October 1, 1995 to perform terminal operations.
During fiscal year 2003 in order to continue its business diversification strategy and to address changing logistics, procurement patterns, and shipping trends, the Port Authority sought and received proposals from interested parties to grow the Port Authority’s general cargo business and to develop the Port Authority’s container operations. On January 31, 2004, the Port Authority reached an agreement with Stevedoring Services of America (“SSA”) to provide said services.
40

Tampa Port Authority
NOTES TO COMBINED FINANCIAL STATEMENTS
September 30, 2009
.
NOTE S - RELATIONSHIP AMONG THE PORT AUTHORITY, TBIT AND PAI - Continued
On May 31, 2006, SSA left the Port Authority’s premises, and a final agreement to terminate the relationship between the Port Authority and SSA was reached on September 8, 2006.
On May 30, 2006, the Port Authority and PAI entered into a new agreement to provide terminal services at the Port of Tampa. The agreement shall continue for 10 years, ending May 29, 2016. PAI has the option of extending the terms of the agreement for an additional 10 years.
Under the agreement and in exchange for the use of the Port Authority facilities, PAI pays the Port Authority 20% of gross revenues as defined, generated each contract year by PAI from the terminal operations conducted by PAI for revenues up to $7,000,000. For annual gross revenues which exceed $7,000,000, PAI agrees to pay 10% to the Port Authority. PAI guarantees that the minimum annual payment will be no less than $1,425,000. In addition, PAI provides all terminal operations’ equipment necessary to handle the Port Authority’s terminal operations for general cargo and container cargo and is responsible for the maintenance of said equipment at its own expense.
Generally, TBIT shall account for and pay over to the Port Authority all payments required by Article III of the Amended Operating Agreement. In addition, the Port Authority and TBIT agree that the reasonable net cash flow from TBIT’s current book of business generated from its existing terminal operations is $900,000 per year, with minor adjustments from year to year. The Port Authority and TBIT estimate that based on the historical performance of terminal operations by TBIT, the reasonable life of this current book of business is eight years. The Port Authority is delivering TBIT’s current book of business to PAI for performance of all future terminal operation services. The Port Authority agreed to pay TBIT annually for the next eight years the reasonable cash flow of TBIT’s book of business in the amount of $900,000 per year.
TBIT shall continue to make all payments to the Port Authority under the loan agreement regarding retirement of the 1997 Special Purpose Revenue Bonds, as referenced in note K2 of these financial statements. The outstanding principal balance due on the bonds and loan agreement is $1,465,000 as of September 30, 2009.
41

Tampa Port Authority
STATEMENT OF CASH FLOWS - DISCRETELY PRESENTED COMPONENT UNIT
For the year ended September 30, 2009
Component UnitTampa BayInternational
Terminals, Inc.
Cash flows from operating activitiesReceived from customers 984,582$ Payments to suppliers for goods and services (78,240)
Net cash provided by operating activities 906,342
Cash flows from capital and related financing activitiesPrincipal payments on debt (831,666) Interest payments on debt (114,833)
Net cash used by capital and related financing activities (946,499)
Cash flows provided by investing activitiesInterest and other income received 53,914
Net cash provided by investing activities 53,914
Net increase in cash and cash equivalents 13,757
Cash and cash equivalents at beginning of year 21,320
Cash and cash equivalents at end of year 35,077$
Reconciliation of operating income to net cash provided by operating activities
Operating income 910,942$ Adjustments to reconcile operating income to net cash
provided by operating activitiesDecrease in accounts payable accrued liabilities (4,600)
Total adjustments (4,600)
Net cash provided by operating activities 906,342$
SUPPLEMENTAL INFORMATION
42

STATIS
TICA
L SE
CTIO
N


TAMPA PORT AUTHORITY Comprehensive Annual Financial Report
For the Fiscal Year Ended September 30, 2009
STATISTICAL SECTION
This part of the Tampa Port Authority comprehensive annual financial report presents detailed information which provides further clarification to the information contained in the financial statements, note disclosures, and all required supplementary information. The information contained in this section includes important indicators about the Tampa Port Authority’s overall financial well being. Reports in this section have been prepared according to GASB 44 guidelines.
Contents
Financial Trends Information: The following schedules contain trend information to help the reader understand how the Tampa Port Authority’s financial performance and condition has changed over the pasted few years.
1) Net Asset by Component – Table 1 2) Changes in Fund Net Assets – Table 2
Revenue Capacity Information: The following schedules contain information to help the reader assess the Tampa Port Authority’s most significant sources of revenue.
1) Operating Revenue by Type and Related Averages – Table 3 2) Principal Revenue Sources and Revenue per Categories – Table 4 3) Wharfage and Dockage Revenue – Ten Largest Customers – Table 5 4) Revenue Rates – Table 6 5) Top Ten Customers – Table 7
Debt Capacity Information: The following schedules contain information to help the reader assess the Tampa Port Authority’s capability of meeting its current level of debt service and its ability to issue debt in the future.
1) Ratios of Outstanding Debt by Type – Table 8 2) Revenue Bond Coverage – Table 9 3) Summary of Surplus Port Revenues after Debt and Operating Costs – Table 10
Demographics and Economic Information: The following schedules contain information to help the reader understand demographics and economic indicators related to the Port Authority’s financial activities in their current environment.
1) Hillsborough County, FL Demographic and Economic Statistics – Table 11 2) Hillsborough County, FL Principal Employers – Table 12
43

TAMPA PORT AUTHORITY Comprehensive Annual Financial Report
For the Fiscal Year Ended September 30, 2009
STATISTICAL SECTION – Continued
3) Hillsborough County, FL Property Tax Millage Rates ‐ Table 13 4) Hillsborough County, FL Principal Taxpayers ‐ Table 14
Operating Information: The following schedules contain information directly related to the operating indicators, the capital assets, and the number of personnel employed by the Port Authority.
1) Schedule of Revenue by Activity – Table 15 2) Annual Cargo Tonnages and Passenger Count – Table 16 3) Capital Assets – Table 17 4) Staffing by Division/Department – Table 18
Other Information:
1) Cruise Statistics – Table 19 2) Insurance Coverage – Table 20 3) Financial Highlights – Table 21
44

Tabl
e 1
Net
Ass
ets
at Y
ear-
End
2002
2003
2004
2005
2006
2007
2008
2009
Inve
sted
in c
apita
l ass
ets,
net o
f rel
ated
deb
t18
4,90
0$
20
9,42
5$
23
3,24
1$
25
9,45
7$
29
6,45
4$
31
9,21
8$
32
4,47
9$
35
3,33
5$
Re
stri
cted
98
,145
$
11
7,96
1$
63
,053
$
23
,484
$
36
,720
$
36
,971
$
36
,655
$
31
,787
$
U
nres
tric
ted
145
$
(2
8,87
2)$
23
,258
$
45
,003
$
26
,585
$
30
,437
$
38
,751
$
44
,988
$
To
tal N
et A
sset
s28
3,19
0$
29
8,51
4$
31
9,55
2$
32
7,94
4$
35
9,75
9$
38
6,62
6$
39
9,88
5$
43
0,11
0$
*Tot
al o
f 8 y
ears
of i
nfor
mat
ion
avai
labl
e; th
e Po
rt A
utho
rity
adh
eren
ce to
GA
SB 3
4 w
as fu
lly re
flect
ed in
the
2003
fina
ncia
l sta
tem
ents
. 2
002
data
is a
vaila
ble
beca
use
it w
as p
rese
nted
in th
e 20
03 M
D&
A.
Man
agem
ent d
eter
min
ed th
at th
e co
sts o
f rec
alcu
latin
g Fi
scal
Yea
rs 2
000
and
2001
out
wei
ghed
the
bene
fits t
he re
ader
wou
ld g
ain
from
incl
usio
n of
this
info
rmat
ion.
(am
ount
s in
thou
sand
s)
TAM
PA P
OR
T A
UTH
OR
ITY
Net
Ass
et b
y C
ompo
nent
Last
Eig
ht Y
ears
*(U
naud
ited)
45

Table 2
Operating Revenue
2000
2001
2002
2003
2004
2005
2006
2007
2008
2009
Po
rt Usage Fees
14,441
$
15,745
$
18,311
$
21,684
$
22,899
$
25,375
$
29,352
$
27,256
$
28,334
$
28,947
$
La
nd & Building Le
ases
4,992
$
5,978
$
6,389
$
6,213
$
7,340
$
8,309
$
8,419
$
8,125
$
9,442
$
9,662
$
Te
nant Utilities
418
$
478
$
522
$
648
$
627
$
530
$
624
$
629
$
552
$
519
$
Other Port O
peratin
g Re
venu
e94
$
100
$
408
$
552
$
723
$
735
$
913
$
905
$
919
$
719
$
Total Operating Revenue
19,945
$
22,301
$
25,630
$
29,097
$
31,589
$
34,949
$
39,308
$
36,915
$
39,247
$
39,847
$
Non‐Operating Revenue
Ope
ratin
g Assistance Grants
‐$
‐$
‐$
1,651
$
1,166
$
1,268
$
340
$
‐$
‐$
‐$
Grants
3,597
$
5,926
$
14,270
$
5,416
$
8,493
$
4,070
$
4,845
$
13,991
$
3,604
$
20,062
$
Interest In
come
5,380
$
4,970
$
3,372
$
3,691
$
3,555
$
3,497
$
4,207
$
5,253
$
3,281
$
1,730
$
Ad Valorem Tax Receipts
10,296
$
10,891
$
11,962
$
12,907
$
14,117
$
14,039
$
16,205
$
16,681
$
16,807
$
15,700
$
Other N
on‐O
peratin
g Income
1,168
$
1,101
$
1,298
$
1,366
$
1,140
$
3,851
$
1,666
$
1,229
$
1,773
$
3,558
$
Total Non‐Operating Revenue
20,441
$
22,888
$
30,902
$
25,031
$
28,471
$
26,725
$
27,263
$
37,154
$
25,465
$
41,050
$
Total Revenues
40,386
$
45,189
$
56,532
$
54,128
$
60,060
$
61,674
$
66,571
$
74,069
$
64,712
$
80,897
$
Operating Expenses
Pe
rson
nel
4,855
$
5,517
$
6,372
$
6,735
$
7,315
$
7,756
$
8,441
$
8,912
$
9,407
$
10,089
$
Prom
otiona
l508
$
530
$
493
$
590
$
450
$
433
$
439
$
329
$
287
$
218
$
Adm
inistrative
3,296
$
3,750
$
6,809
$
8,572
$
9,508
$
10,340
$
11,033
$
12,195
$
12,849
$
12,560
$
Dep
reciation & Amortiz
ation Ex
pense
6,443
$
6,956
$
7,996
$
9,242
$
10,165
$
11,102
$
12,527
$
14,450
$
16,536
$
17,714
$
Total Operating Expenses
15,102
$
16,753
$
21,670
$
25,139
$
27,438
$
29,631
$
32,440
$
35,886
$
39,079
$
40,581
$
Non‐Operating Expenses
Interest Exp
ense
8,742
$
8,432
$
9,058
$
9,834
$
9,094
$
8,254
$
7,623
$
7,978
$
7,891
$
7,457
$
Bo
nd Related Costs
277
$
277
$
328
$
328
$
395
$
2,563
$
1,073
$
463
$
218
$
215
$
Ta
x Collector/Prope
rty App
raiser
844
$
1,000
$
980
$
1,028
$
1,083
$
1,266
$
1,470
$
1,850
$
1,441
$
1,431
$
Other non‐ope
ratin
g expe
nse
927
$
825
$
1,397
$
2,476
$
1,012
$
1,569
$
2,150
$
1,025
$
2,823
$
987
$
Total Non‐Operating Expenses
10,790
$
10,534
$
11,763
$
13,666
$
11,584
$
13,652
$
12,316
$
11,316
$
12,373
$
10,090
$
Total Expenses
25,892
$
27,287
$
33,433
$
38,805
$
39,022
$
43,283
$
44,756
$
47,202
$
51,452
$
50,671
$
Change in Fund Net Assets
14,494
$
17,902
$
23,099
$
15,323
$
21,038
$
18,391
$
21,815
$
26,867
$
13,260
$
30,226
$
(amounts in thousands)
TAMPA PORT AUTHORITY
Changes in Fund Net Assets
Last Ten Years
(Unaudited)
Note: E
xpan
ded to th
e full 10‐year c
ompa
rativ
e pe
riod
.
46

Table 3
Operating Revenue:
2000
2001
2002
2003
2004
2005
2006
2007
2008
2009
Dockage
Dockage ‐ Cargo
3,650
$
3,707
$
3,977
$
3,984
$
4,201
$
4,615
$
5,199
$
4,771
$
4,449
$
4,112
$
Dockage ‐ Cruise
603
$
620
$
766
$
722
$
747
$
785
$
985
$
792
$
780
$
808
$
Dockage ‐ Other
681
$
811
$
670
$
807
$
949
$
730
$
717
$
673
$
658
$
660
$
Subtotal ‐ Dockage
4,934
$
5,138
$
5,413
$
5,513
$
5,897
$
6,130
$
6,901
$
6,236
$
5,887
$
5,580
$
Wha
rfage
Wha
rfage ‐ C
argo
5,120
$
5,540
$
6,214
$
6,736
$
7,175
$
8,363
$
8,658
$
8,695
$
8,660
$
8,269
$
Wha
rfage ‐ C
ruise
2,189
$
2,456
$
2,917
$
4,495
$
4,385
$
4,310
$
5,119
$
4,449
$
4,463
$
4,669
$
Wha
rfage ‐ O
ther (a
)491
$
864
$
595
$
628
$
581
$
1,028
$
1,162
$
874
$
2,587
$
2,891
$
Subtotal ‐ Wharfage
7,800
$
8,860
$
9,726
$
11,859
$
12,141
$
13,701
$
14,939
$
14,018
$
15,710
$
15,829
$
Land & Building Le
ases
4,992
$
5,978
$
6,389
$
6,213
$
7,340
$
8,309
$
8,419
$
8,125
$
9,442
$
9,662
$
Other Ope
ratin
g Re
venu
e2,219
$
2,325
$
4,102
$
5,512
$
6,211
$
6,809
$
9,049
$
8,536
$
6,208
$
8,776
$
Total Operating Revenue
19,945
$
22,301
$
25,630
$
29,097
$
31,589
$
34,949
$
39,308
$
36,915
$
37,247
$
39,847
$
Cargo Ton
nage (to nearest tho
usan
d) (a
)11,730
13,642
13,372
14,043
15,049
16,477
16,738
15,578
14,377
13,211
Average W
harfage Re
venu
e pe
r Cargo Ton (w
hole $)
0.44
$
0.41
$
0.46
$
0.48
$
0.48
$
0.51
$
0.52
$
0.56
$
0.60
$
0.63
$
Cruise Pa
ssengers (to nearest tho
usan
d)460
517
587
810
792
772
911
781
768
803
Average W
harfage Re
venu
e pe
r Passeng
er (w
hole $)
4.76
$
4.75
$
4.97
$
5.55
$
5.54
$
5.58
$
5.62
$
5.70
$
5.81
$
5.81
$
Berth lin
ear feet
7,225
7,225
8,225
9,175
10,375
10,375
11,855
11,855
11,855
12,855
Average Dockage Revenue per Berth Linear F
eet
682.91
$
711.14
$
658.12
$
600.87
$
568.39
$
590.84
$
582.12
$
526.02
$
496.58
$
434.07
$
Leased Acreage (a
ctua
l in hu
ndreds)
1,239
1,259
1,273
1,298
1,298
1,325
1,300
1,290
1,290
1,285
Average per Acre (w
hole $)
4,029
$
4,748
$
5,019
$
4,787
$
5,655
$
6,271
$
6,476
$
6,298
$
7,319
$
7,519
$
(a) R
epresents tonn
age ha
ndled throug
h Ta
mpa Port A
utho
rity fa
cilities, private fa
cility tonn
age is exclude
d.
Note: E
xpan
ded to fu
ll 10‐year c
ompa
rativ
e pe
riod fo
r con
sistency w
ith primary compo
nents of port u
sage fees, d
ockage and w
harfage, allo
cated to m
ajor cargo categories .
(amounts in thousands)
TAMPA PORT AUTHORITY
Operating Revenue by Type and Related Averages
Last Ten Years
(Unaudited)
47
Table 3
Operating Revenue:
2000
2001
2002
2003
2004
2005
2006
2007
2008
2009
Dockage
Dockage ‐ Cargo
3,650
$
3,707
$
3,977
$
3,984
$
4,201
$
4,615
$
5,199
$
4,771
$
4,449
$
4,112
$
Dockage ‐ Cruise
603
$
620
$
766
$
722
$
747
$
785
$
985
$
792
$
780
$
808
$
Dockage ‐ Other
681
$
811
$
670
$
807
$
949
$
730
$
717
$
673
$
658
$
660
$
Subtotal ‐ Dockage
4,934
$
5,138
$
5,413
$
5,513
$
5,897
$
6,130
$
6,901
$
6,236
$
5,887
$
5,580
$
Wha
rfage
Wha
rfage ‐ C
argo
5,120
$
5,540
$
6,214
$
6,736
$
7,175
$
8,363
$
8,658
$
8,695
$
8,660
$
8,269
$
Wha
rfage ‐ C
ruise
2,189
$
2,456
$
2,917
$
4,495
$
4,385
$
4,310
$
5,119
$
4,449
$
4,463
$
4,669
$
Wha
rfage ‐ O
ther (a
)491
$
864
$
595
$
628
$
581
$
1,028
$
1,162
$
874
$
2,587
$
2,891
$
Subtotal ‐ Wharfage
7,800
$
8,860
$
9,726
$
11,859
$
12,141
$
13,701
$
14,939
$
14,018
$
15,710
$
15,829
$
Land & Building Le
ases
4,992
$
5,978
$
6,389
$
6,213
$
7,340
$
8,309
$
8,419
$
8,125
$
9,442
$
9,662
$
Other Ope
ratin
g Re
venu
e2,219
$
2,325
$
4,102
$
5,512
$
6,211
$
6,809
$
9,049
$
8,536
$
6,208
$
8,776
$
Total Operating Revenue
19,945
$
22,301
$
25,630
$
29,097
$
31,589
$
34,949
$
39,308
$
36,915
$
37,247
$
39,847
$
Cargo Ton
nage (to nearest tho
usan
d) (a
)11,730
13,642
13,372
14,043
15,049
16,477
16,738
15,578
14,377
13,211
Average W
harfage Re
venu
e pe
r Cargo Ton (w
hole $)
0.44
$
0.41
$
0.46
$
0.48
$
0.48
$
0.51
$
0.52
$
0.56
$
0.60
$
0.63
$
Cruise Pa
ssengers (to nearest tho
usan
d)460
517
587
810
792
772
911
781
768
803
Average W
harfage Re
venu
e pe
r Passeng
er (w
hole $)
4.76
$
4.75
$
4.97
$
5.55
$
5.54
$
5.58
$
5.62
$
5.70
$
5.81
$
5.81
$
Berth lin
ear feet
7,225
7,225
8,225
9,175
10,375
10,375
11,855
11,855
11,855
12,855
Average Dockage Revenue per Berth Linear F
eet
682.91
$
711.14
$
658.12
$
600.87
$
568.39
$
590.84
$
582.12
$
526.02
$
496.58
$
434.07
$
Leased Acreage (a
ctua
l in hu
ndreds)
1,239
1,259
1,273
1,298
1,298
1,325
1,300
1,290
1,290
1,285
Average per Acre (w
hole $)
4,029
$
4,748
$
5,019
$
4,787
$
5,655
$
6,271
$
6,476
$
6,298
$
7,319
$
7,519
$
(a) R
epresents tonn
age ha
ndled throug
h Ta
mpa Port A
utho
rity fa
cilities, private fa
cility tonn
age is exclude
d .
Note: E
xpan
ded to fu
ll 10‐year c
ompa
rativ
e pe
riod fo
r con
sistency w
ith primary compo
nents of port u
sage fees, d
ockage and w
harfage, allo
cated to m
ajor cargo categories.
(amounts in thousands)
TAMPA PORT AUTHORITY
Operating Revenue by Type and Related Averages
Last Ten Years
(Unaudited)
47

Table 4
2000
2001
2002
2003
2004
2005
2006
2007
2008
2009
Port Usage Fees Revenues:
Dockage
4,934
$
5,138
$
5,413
$
5,613
$
5,897
$
6,130
$
6,901
$
6,236
$
5,887
$
5,580
$
Wha
rfage
7,309
$
7,696
$
9,131
$
11,231
$
11,560
$
12,673
$
13,777
$
13,144
$
13,123
$
12,938
$
Wha
rfage (in lieu of w
harfage)
491
$
864
$
595
$
628
$
581
$
1,028
$
1,162
$
874
$
2,587
$
2,891
$
Pa
rking an
d related
1,076
$
1,746
$
2,658
$
3,455
$
3,810
$
4,168
$
5,569
$
5,431
$
4,976
$
5,892
$
Te
minal Ope
ratio
ns295
$
‐$
416
$
580
$
767
$
1,004
$
1,670
$
1,288
$
1,409
$
1,361
$
Other Usage Fees
336
$
301
$
98$
177
$
284
$
372
$
273
$
283
$
352
$
285
$
Total Port Usage Fees
14,441
$
15,745
$
18,311
$
21,684
$
22,899
$
25,375
$
29,352
$
27,256
$
28,334
$
28,947
$
Percentage of Total Revenue
35.76%
34.84%
32.39%
40.06%
38.13%
41.14%
44.09%
36.80%
43.78%
35.78%
Land & Building Leases:
La
nd & Building Le
ases
4,943
$
5,943
$
6,377
$
6,177
$
7,292
$
8,239
$
8,349
$
8,102
$
9,432
$
9,552
$
Cruise Te
rminal Rentals
49$
35$
12$
36$
40$
55$
45$
23$
5$
110
$
Po
rt Prope
rty Access Fees
‐$
‐$
‐$
‐$
8$
15$
25$
‐$
5$
‐$
Total Land & Building Leases
4,992
$
5,978
$
6,389
$
6,213
$
7,340
$
8,309
$
8,419
$
8,125
$
9,442
$
9,662
$
Percentage of Total Revenue
12.36%
13.23%
11.30%
11.48%
12.22%
13.47%
12.65%
10.97%
14.59%
11.94%
Tenant Utilities:
Te
nant W
ater
96$
73$
44$
37$
28$
21$
20$
25$
23$
17$
Dockside Water
313
$
402
$
476
$
609
$
566
$
501
$
593
$
598
$
527
$
501
$
Electricity
9$
3$
2$
2$
33$
8$
11$
6$
2$
1$
Total Tenant Utilities
418
$
478
$
522
$
648
$
627
$
530
$
624
$
629
$
552
$
519
$
Percentage of Total Revenue
1.04%
1.06%
0.92%
1.20%
1.04%
0.86%
0.94%
0.85%
0.85%
0.64%
Other Port Operating Revenue:
Work Pe
rmits
36$
33$
36$
52$
52$
50$
45$
48$
32$
29$
Fing
erprintin
g/Ba
dging
‐$
‐$
316
$
432
$
581
$
610
$
798
$
793
$
810
$
624
$
Security Training Fees
‐$
‐$
‐$
‐$
30$
11$
2$
‐$
‐$
‐$
License Fees
58$
67$
56$
68$
60$
64$
68$
64$
77$
66$
Total Other Port Operating Revenue
94$
100
$
408
$
552
$
723
$
735
$
913
$
905
$
919
$
719
$
Total Operating Revenue
19,945
$
22,301
$
25,630
$
29,097
$
31,589
$
34,949
$
39,308
$
36,915
$
39,247
$
39,847
$
Percentage of Total Revenue
49.39%
49.35%
45.34%
53.76%
52.60%
56.67%
59.05%
49.84%
60.65%
49.26%
(amounts in thousands)
TAMPA PORT AUTHORITY
Principal Revenue Sources and Revenue per Categories
Last Ten Years
(Unaudited)
48

Table 4
2000
2001
2002
2003
2004
2005
2006
2007
2008
2009
(amounts in thousands)
TAMPA PORT AUTHORITY
Principal Revenue Sources and Revenue per Categories
Last Ten Years
(Unaudited)
Non‐Operating Revenue:
Ope
ratin
g Grants
‐$
‐$
‐$
1,651
$
1,166
$
1,368
$
340
$
‐$
‐$
‐$
Cap
ital G
rants
3,597
$
5,926
$
14,270
$
5,416
$
8,493
$
4,070
$
4,845
$
13,991
$
3,604
$
20,062
$
Ad Valorem Tax Receipts
10,296
$
10,891
$
11,962
$
12,907
$
14,117
$
14,039
$
16,205
$
16,681
$
16,807
$
15,700
$
Interest, U
nrestricted
4,541
$
4,199
$
2,649
$
3,093
$
3,020
$
3,057
$
3,877
$
4,544
$
2,634
$
1,073
$
Interest, R
estricted
‐$
6$
9$
11$
45$
54$
54$
53$
54$
52$
Interest, P
AI C
rane
‐$
‐$
‐$
‐$
‐$
‐$
‐$
‐$
‐$
76$
Interest, T
BIT & TBS
B Notes
839
$
765
$
714
$
587
$
490
$
386
$
276
$
656
$
593
$
525
$
Other, T
BIT & TBS
B Notes
360
$
292
$
296
$
294
$
298
$
304
$
263
$
175
$
175
$
177
$
Dredg
e an
d Fill Income
4$
‐$
‐$
298
$
29$
43$
17$
57$
79$
1,362
$
Gain/Lo
ss on Sale of Inv
estm
ent
‐$
‐$
‐$
‐$
(165)
$
905
$
564
$
100
$
‐$
‐$
Gain/Lo
ss on Dispo
sal o
f Fixed Assets
90$
107
$
223
$
(3)
$
271
$
211
$
(1,020)
$
(269)
$
95$
19$
Harbo
rmaster F
ees
444
$
492
$
530
$
596
$
572
$
732
$
738
$
696
$
978
$
891
$
Con
ference Don
ations
70$
67$
96$
80$
74$
229
$
770
$
105
$
102
$
70$
Amortiz
ation Prem
iums
‐$
‐$
‐$
‐$
‐$
157
$
273
$
276
$
275
$
274
$
Other M
iscella
neou
s Re
venu
e200
$
143
$
153
$
101
$
61$
1,170
$
61$
89$
69$
769
$
Total Non‐Operating Revenue
20,441
$
22,888
$
30,902
$
25,031
$
28,471
$
26,725
$
27,263
$
37,154
$
25,465
$
41,050
$
Percentage of Total Revenue
50.61%
50.65%
54.66%
46.24%
47.40%
43.33%
40.95%
50.16%
39.35%
50.74%
Total Revenue
40,386
$
45,189
$
56,532
$
54,128
$
60,060
$
61,674
$
66,571
$
74,069
$
64,712
$
80,897
$
Note: E
xpan
ded to fu
ll 10‐years fo
r com
parativ
e pu
rposes.
49

Table 5
Tampa Port Authority
Wharfage Revenue
Current Year and Nine Years Prior
FY 2009
Percentage of
Percentage of
Customer
Revenu
eTo
tal W
harfage
Customer
Revenu
eTo
tal W
harfage
Carnival C
ruise Lines
3,901,569
24.65%
GATX Terminals
1,135,546
15.25%
Kinde
r Morgan
2,302,519
14.55%
Carnival C
ruise Lines
1,101,915
14.80%
Zim In
tegrated Services
1,091,979
6.90%
Tampa Bay In
ternationa
l Te
847,788
11.39%
Royal C
aribbean
760,368
4.80%
Martin Gas Sales, Inc.
403,380
5.42%
Vulcan Materials
747,236
4.72%
CF Indu
stries, Inc. (Ammo n
297,866
4.00%
Trad
emark Metals
708,254
4.47%
Vulcan/ICA Distribution Co
294,930
3.96%
Smorgo
n Steel R
ecyclin
g586,300
3.70%
CF Indu
stries, Inc. (Fertiliz e
262,334
3.52%
CF Indu
stries
486,131
3.07%
Harbo
rside Re
frigerated
233,501
3.14%
TPSI Terminals
475,086
3.00%
Martin M
arietta
205,851
2.76%
Murph
y Oil
468,693
2.96%
Holcim (U
S), Inc.
202,323
2.72%
Total 2009
11,528,135
72.82%
Total 2000
4,985,434
66.96%
Total W
harfage Re
venu
e15,829,626
100%
Total W
harfage Re
venu
e7,446,248
100%
Tampa Port Authority
Dockage Revenue
Current Year and Nine Years Prior
FY 2009
Percentage of
Percentage of
Customer
Revenu
eTo
tal D
ockage
Customer
Revenu
eTo
tal D
ockage
Kinde
r Morgan
1,235,213
22.14%
GATX Terminals
727,328
14.74%
Carnival C
ruise Lines
552,044
9.89%
Tampa Bay In
ternationa
l695,225
14.09%
CF Indu
stries
414,267
7.42%
Cargill, In
c. (G
rain)
353,953
7.17%
Murph
y Oil
357,819
6.41%
Carnival C
ruise Lines
295,920
6.00%
Ports America
271,249
4.86%
Harbo
rside Re
frigerated
289,898
5.88%
Royal C
aribbean
231,711
4.15%
CF Indu
stries, Inc. (Fertiliz e
237,779
4.82%
Martin M
arietta M
aterials
180,797
3.24%
CF Indu
stries, Inc. (Ammo n
214,547
4.35%
Trad
emark Metals
160,203
2.87%
Martin Gas Sales, Inc.
202,596
4.11%
Vulcan
158,383
2.84%
Tran
smon
taigne
155,553
3.15%
Sea‐3 of Florida
, Inc.
151,671
2.72%
Martin M
arietta
95,842
1.94%
Total 2009
3,713,357
66.54%
Total 2000
3,268,641
66.25%
Total D
ockage Revenue
5,580,354
100%
Total D
ockage Revenue
4,934,279
100%
FY2000
Ten Largest Customers
Ten Largest Customers
FY2000
50


Table 6
2000
2001
2002
2003
2004
2005
2006
2007
2008
2009
Dockage Rates (LOA) (per ft)
Vessels, B
arges & Tug Boats
0‐199 ft
1.68
$
1.75
$
1.85
$
1.90
$
1.90
$
2.00
$
2.06
$
2.12
$
2.25
$
2.32
$
200‐299
1.83
1.90
2.10
2.15
2.15
2.26
2.46
2.66
2.96
3.05
300‐349
2.16
2.25
2.25
2.31
2.31
2.43
2.58
2.73
2.96
4.15
350‐399
2.42
2.52
2.52
2.58
2.58
2.71
2.76
2.81
2.96
4.15
400‐449
3.19
3.38
3.38
3.46
3.46
3.63
3.72
3.81
4.03
4.15
450‐499
3.30
3.38
3.38
3.46
3.46
3.63
3.72
3.81
4.03
4.15
500.549
4.38
4.61
4.61
4.73
4.73
4.97
5.06
5.15
5.41
5.57
550‐599
4.48
4.61
4.61
4.73
4.73
4.97
5.06
5.15
5.41
5.57
600‐649
5.10
5.36
5.36
5.49
5.49
5.76
5.87
5.98
6.28
6.47
650‐699
5.20
5.36
5.36
5.49
5.49
5.76
5.87
5.98
6.28
6.47
700‐799
6.64
6.91
6.91
7.08
7.08
7.43
7.53
7.63
7.97
8.21
800‐899
7.98
8.30
8.30
8.51
8.51
8.94
9.07
9.20
9.60
9.89
900 ft +
9.53
9.91
9.91
10.16
10.16
10.67
10.83
10.99
11.49
11.83
Passenger V
essels
Und
er 550 ft
3.63
3.63
4.36
4.36
4.36
4.49
4.49
4.49
4.49
4.49
*FY 2001 Rates in
creased 04/01/01
4.36
551‐600
5.12
5.12
6.14
6.14
6.14
6.32
6.32
6.32
6.32
6.32
6.14
601‐650
5.28
5.28
6.34
6.34
6.34
6.53
6.53
6.53
6.53
6.53
6.34
651‐700
5.50
5.50
6.60
6.60
6.60
6.80
6.80
6.80
6.80
6.80
6.60
701‐725
5.83
5.83
7.00
7.00
7.00
7.21
7.21
7.21
7.21
7.21
7.00
726‐750
6.05
6.05
7.26
7.26
7.26
7.48
7.48
7.48
7.48
7.48
7.26
751 ft +
6.60
6.60
7.92
7.92
7.92
8.16
8.16
8.16
8.16
8.16
7.92
Tampa Port Authority
Revenue Rates
Last Ten Fiscal Years
51

Table 6
2000
2001
2002
2003
2004
2005
2006
2007
2008
2009
Tampa Port Authority
Revenue Rates
Last Ten Fiscal Years
Wharfage Rates (per ton)
All articles (not provide
d for b
elow
)2.00
2.06
2.06
2.12
2.12
2.25
2.36
2.36
2.36
2.36
Autom
obiles (N
ew) each
‐‐
‐‐
‐‐
4.10
4.10
4.10
4.10
Autom
obiles (used) each
3.25
3.35
3.35
3.75
3.75
3.98
5.60
5.60
7.10
7.10
Bana
nas & Plantains
Livestock
3.55
3.66
3.66
3.77
3.77
4.00
4.20
4.20
4.20
4.20
Citrus & Citrus Produ
cts
1.66
1.71
1.71
1.76
1.76
1.87
1.96
1.96
1.96
1.96
Con
tainers (lo
aded
)1.76
1.81
1.81
1.86
1.86
1.97
1.97
1.97
1.97
1.97
USD
A Bagged Goo
ds (P
ublic Law 480)
0.33
0.34
0.34
0.35
0.20
0.21
0.22
0.22
0.22
0.22
Citrus Con
centrate (D
rums or Tan
k)1.37
1.41
1.41
1.45
1.45
1.54
1.54
1.54
1.54
1.54
Corda
ge1.42
1.46
1.46
1.50
1.50
1.59
1.67
1.67
1.67
1.67
Fertilizer (in bags)
1.48
1.52
1.52
1.57
1.57
1.66
1.74
1.74
1.74
1.74
Flou
r or R
ice (in bags)
1.13
1.16
1.16
1.19
1.19
1.26
1.32
1.32
1.32
1.32
Forest Produ
cts
‐‐
‐1.50
1.50
1.59
1.59
1.59
1.59
n/a
Lumber & Log
s (per M
BF)
1.31
1.35
1.35
1.35
1.35
1.43
1.43
1.43
1.43
1.43
Frozen M
eat a
nd/or P
oultry
1.94
2.00
2.00
2.06
2.06
2.18
2.29
2.29
2.29
2.29
Fruits and Vegetables (fresh)
1.71
1.76
1.76
1.81
1.81
1.92
2.00
2.02
2.02
2.02
Iron & Steel Articles
1.71
1.76
1.76
1.81
1.81
1.92
1.92
1.92
1.92
1.92
Iron & Steel Coils and Reinforcing Rod
s‐
‐‐
‐‐
1.70
1.70
1.70
1.70
1.70
Mob
ile & M
odular H
omes (u
nder 10,000 lbs)each
18.48
19.03
19.03
19.60
19.60
20.78
21.82
21.82
21.82
21.82
Mob
ile & M
odular H
omes (o
ver 1
0,000 lbs) net to
n2.49
2.56
2.56
2.64
2.64
2.80
2.94
2.94
2.94
2.94
Pape
r Waste (in bales Dom
estic m
oves only)
1.09
1.12
1.12
1.15
1.15
1.22
1.28
1.28
1.28
1.28
Project C
argo (W
/M)
‐‐
‐‐
‐2.25
2.36
2.36
2.36
2.36
Scrap Metal
2.08
2.11
2.11
2.25
2.25
2.39
2.36
2.39
2.39
2.39
U.S.D.A. P
ublic Law 480 (b
agged go
ods)
0.35
0.36
0.36
0.37
0.37
0.39
0.41
0.41
0.41
0.41
U.S.D.A. P
rodu
cts (chilled & frozen)
1.43
1.47
1.47
1.51
1.51
1.60
1.68
1.68
1.68
1.68
Vehicles (trucks, buses tractors, etc.) NET TON
1.86
1.92
1.92
1.98
1.98
2.10
2.21
2.21
2.21
2.21
Yachts & Boats (less than 25ʹ LOA) (a)
9.95
10.25
10.25
10.56
10.56
1.00
1.05
1.05
1.05
1.05
Yachts & Boats (g
reater th
an 25ʹ LOA) (a)
31.83
32.70
32.70
33.76
33.76
1.50
1.58
1.58
1.58
1.58
52

Table 6
2000
2001
2002
2003
2004
2005
2006
2007
2008
2009
Tampa Port Authority
Revenue Rates
Last Ten Fiscal Years
Passengers Embarking (per passeng
er)
5.25
5.25
5.25
5.25
5.75
6.00
6.00
6.00
6.00
6.00
Passengers Disem
barking (per passeng
er)
5.25
5.25
5.25
5.25
5.75
6.00
6.00
6.00
6.00
6.00
Passengers in tran
sit (pe
r passeng
er)
5.25
5.25
5.25
5.25
5.75
6.00
6.00
6.00
6.00
6.00
Agg
regate (including pum
ice & slag)
0.70
0.70
0.72
0.72
0.76
0.76
0.76
0.76
0.76
0.76
Anh
ydrous Ammon
ia0.355
0.355
0.355
0.355
0.375
0.375
0.375
0.375
0.375
0.375
Bulk, D
ry N
.O.S.
1.03
1.03
1.06
1.06
1.12
1.12
1.18
1.18
1.18
1.18
Bulk, L
iquid N.O.S.
1.03
1.03
1.06
1.06
1.12
1.12
1.18
1.18
1.18
1.18
Cau
stic Sod
a0.37
0.37
0.38
0.38
0.40
0.40
0.42
0.42
0.42
0.42
Cem
ent
0.77
0.77
0.79
0.79
0.84
0.84
0.84
0.84
0.84
0.84
Citrus Con
centrate, (via pipe
line)
0.98
0.98
1.01
1.01
1.07
1.07
1.07
1.07
1.07
1.07
Citrus Pellets
0.36
0.36
0.37
0.37
0.39
0.39
0.40
0.40
0.40
0.40
Coal
0.57
0.57
0.59
0.59
0.63
0.63
0.66
0.66
0.66
0.66
Fertilizer, N.O.S.
0.230
0.230
0.230
0.230
0.250
0.245
0.245
0.245
0.245
0.245
Fly Ash
0.77
0.77
0.79
0.79
0.84
0.84
0.88
0.88
0.88
0.88
Grain, N
.O.S.
0.37
0.37
0.38
0.38
0.40
0.40
0.42
0.42
0.42
0.42
Gyp
sum
0.52
0.52
0.54
0.54
0.57
0.57
0.59
0.59
0.59
0.59
Petroleu
m and Petroleum Produ
cts (per barrel)
0.07
0.07
0.07
0.07
0.07
0.07
0.08
0.08
0.08
0.08
Petroleu
m (B
unkering
) (pe
r barrel)
0.08
0.08
0.08
0.08
0.09
0.09
0.09
0.09
0.09
0.09
Petroleu
m Cok
e0.57
0.57
0.59
0.59
0.63
0.63
0.66
0.66
0.66
0.66
Phosph
ate Prod
ucts (o
ther th
an crude ro
ck)
0.24
0.24
0.24
0.24
0.25
0.25
0.25
0.25
0.25
0.25
Phosph
ate Ro
ck, (Wet or D
ry)
0.24
0.24
0.24
0.24
0.25
0.25
0.25
0.25
0.25
0.25
Phosph
oric Acid
0.37
0.37
0.38
0.38
0.40
0.40
0.40
0.40
0.40
0.40
Pomace
0.59
0.59
0.61
0.61
0.65
0.65
0.68
0.68
0.68
0.68
Potash
0.24
0.24
0.25
0.25
0.27
0.27
0.28
0.28
0.28
0.28
Salt
0.46
0.46
0.47
0.47
0.50
0.50
0.53
0.53
0.53
0.53
Sand
0.65
0.65
0.67
0.67
0.71
0.71
0.75
0.75
0.75
0.75
Seaw
ater
0.23
0.23
0.24
0.24
0.25
0.25
0.26
0.26
0.26
0.26
Sulphu
r0.37
0.37
0.38
0.38
0.40
0.40
0.40
0.40
0.40
0.40
Sulphu
ric Acid
0.37
0.37
0.38
0.38
0.40
0.40
0.42
0.42
0.42
0.42
Tallo
w0.52
0.52
0.54
0.54
0.57
0.57
0.60
0.60
0.60
0.60
(a) P
rior to 2005, ra
tes were based on a per vessel cha
rge. Starting in 2005, th
e rate is calculated by LOA.
53

Table 7
% of TotalCustomer Type of Business Revenue Operating Revenue
Carnival Cruise Lines Cruise Industry 7,453,184 18.70%Kinder Morgan Transports liquid bulk commodities, petroleum 3,959,947 9.94%Ports America Terminal Operator for general cargo 2,186,270 5.49%Cemex Transports misc dry bulk commodities 1,605,213 4.03%Vulcan Transports bulk cargo, limestone 1,579,698 3.96%Royal Caribbean Cruise Industry 1,550,067 3.89%Trinity Materials Transports dry bulk commodities, cement 1,485,139 3.73%Zim Integrated Services Transports containerized general cargo 1,141,078 2.86%Tarmac America Transports dry bulk commodities, misc 1,058,481 2.66%CF Industries Transports anhydrous ammonia, fertilizer 1,045,406 2.62%
57.88%
% of TotalCustomer Type of Business Revenue Operating Revenue
Kinder Morgan (ex: GATX Terminals) Transports liquid bulk commodities, petroleum 1,982,874 9.94%Carnival Cruise Lines Cruise Industry 1,918,944 9.62%Tampa Bay International Terminals General cargo terminal operations 1,079,469 5.41%Harborside Refrigerated Services Terminal Operator for refrigerated cargo 1,063,399 5.33%Tampa Bay Shipbuilding & Repair Co. Ship repair operation 1,000,000 5.01%Martin Gas Sales, Inc. Transports liquid bulk commodities, petroleum 690,456 3.46%CF Industries, Inc. (Ammonia facility) Transports liquid bulk commodities, ammonia 559,369 2.80%Cargill, Inc. Transports dry bulk commodities, grain 556,472 2.79%CF Industries, Inc. Transports dry bulk commodities, fertilizer 519,493 2.60%International Ship Repair Ship repair operation 449,153 2.25%
39.27%
2009
2000
TAMPA PORT AUTHORITYTop Ten Customers
Current Year and Nine Years Prior
54
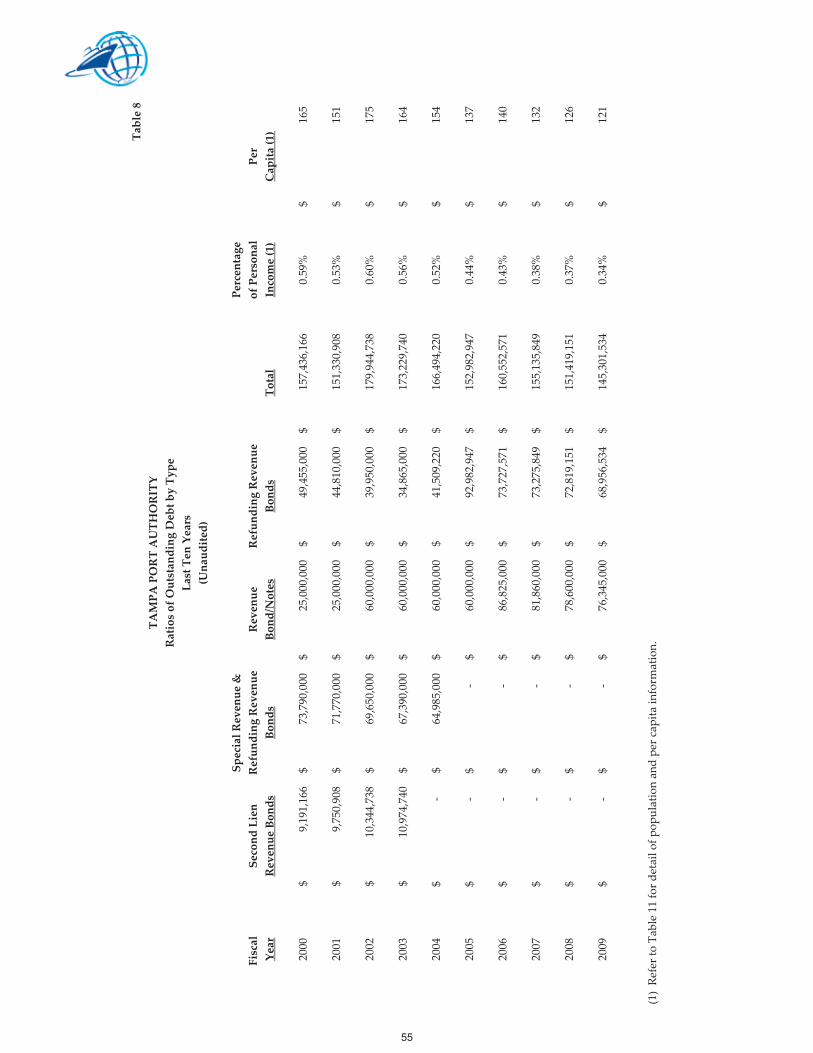
Table 8
Special Revenue &
Percentage
Fiscal
Second Lien
Refunding Revenue
Revenue
Refunding Revenue
of Personal
Per
Year
Revenue Bonds
Bonds
Bond/Notes
Bonds
Total
Income (1)
Capita (1)
2000
9,191,166
$
73,790,000
$
25,000,000
$
49,455,000
$
157,436,166
$
0.59%
165
$
2001
9,750,908
$
71,770,000
$
25,000,000
$
44,810,000
$
151,330,908
$
0.53%
151
$
2002
10,344,738
$
69,650,000
$
60,000,000
$
39,950,000
$
179,944,738
$
0.60%
175
$
2003
10,974,740
$
67,390,000
$
60,000,000
$
34,865,000
$
173,229,740
$
0.56%
164
$
2004
‐$
64,985,000
$
60,000,000
$
41,509,220
$
166,494,220
$
0.52%
154
$
2005
‐$
‐$
60,000,000
$
92,982,947
$
152,982,947
$
0.44%
137
$
2006
‐$
‐$
86,825,000
$
73,727,571
$
160,552,571
$
0.43%
140
$
2007
‐$
‐$
81,860,000
$
73,275,849
$
155,135,849
$
0.38%
132
$
2008
‐$
‐$
78,600,000
$
72,819,151
$
151,419,151
$
0.37%
126
$
2009
‐$
‐$
76,345,000
$
68,956,534
$
145,301,534
$
0.34%
121
$
(1) Re
fer to Ta
ble 11 fo
r detail o
f pop
ulation an
d pe
r cap
ita in
form
ation.
TAMPA PORT AUTHORITY
Ratios of Outstanding Debt by Type
Last Ten Years
(Unaudited)
55

Table 9
Net Revenue
Fiscal
Gross
Operating
Available for
Debt Service (e)
Coverage
Year
Revenues
Expenses
Debt Service
Principal
Interest
Total
Ratio
2000
28,583
$
8,659
$
19,924
$
6,308
$
8,098
$
14,406
$
1.38
2001
30,472
$
9,797
$
20,675
$
6,770
$
7,878
$
14,648
$
1.41
2002
32,444
$
13,674
$
18,770
$
7,102
$
8,424
$
15,526
$
1.21
2003
39,730
$
15,897
$
23,833
$
7,475
$
9,255
$
16,730
$
1.42
2004
40,947
$
17,273
$
23,674
$
7,870
$
9,314
$
17,184
$
1.38
2005
42,641
$
18,529
$
24,112
$
6,945
$
8,148
$
15,093
$
1.60
2006
46,089
$
19,913
$
26,176
$
5,023
$
7,709
$
12,732
$
2.06
2007
43,179
$
21,436
$
21,743
$
6,155
$
7,979
$
14,134
$
1.54
2008
43,626
$
22,543
$
21,083
$
5,468
$
7,674
$
13,142
$
1.60
2009
44,010
$
22,867
$
21,143
$
6,725
$
7,276
$
14,001
$
1.51
(a)
(b)
( c)
(d)
(a)
Gross Revenue
s means re
nts, fees, cha
rges and other in
come de
rived from th
e op
eration of port facilitie
s an
d certain income de
rived from
investments.
(b)
Ope
ratin
g expe
nses exclude dep
reciation, bon
d interest, amortiz
ation, and extraordina
ry lo
sses. No ad
justment h
as been mad
e for
pa
yments m
ade to other gov
ernm
ents.
( c)
Debt service re
quirem
ent d
oes no
t include cap
italiz
ation of in
terest, d
ebt service on de
feased bon
ds, n
or amortiz
ed bon
d issue costs
and discou
nts.
(d)
Net re
venu
e available for d
ebt service divided by total d
ebt service re
quirem
ents.
(e)
Up un
til 2004, TPA had both Senior and Ju
nior Lien de
bt. Th
e coverage ra
tio re
quirem
ent w
as 1.00‐1.25. Afte
r 2004, TPA had only
Senior Lien de
bt and th
e coverage ra
tio re
quirem
ent is 1.25.(amounts in thousands)
TAMPA PORT AUTHORITY
Revenue Bond Coverage
Last Ten Years
(Unaudited)
56

Table 10
Operating Revenue
2000
2001
2002
2003
2004
2005
2006
2007
2008
2009
Po
rt Usage Fees
14,441
$
15,745
$
18,311
$
21,684
$
22,899
$
25,375
$
29,352
$
27,256
$
28,333
$
28,947
$
La
nd & Building Le
ases
4,992
$
5,978
$
6,389
$
6,213
$
7,340
$
8,309
$
8,419
$
8,125
$
9,442
$
9,662
$
Te
nant Utilities
418
$
478
$
522
$
648
$
627
$
530
$
624
$
629
$
552
$
519
$
Other Port O
peratin
g Re
venu
e94
$
99$
408
$
552
$
723
$
735
$
913
$
906
$
920
$
711
$
Total Operating Revenue
19,945
$
22,300
$
25,630
$
29,097
$
31,589
$
34,949
$
39,308
$
36,916
$
39,247
$
39,839
$
Non‐Operating Revenue
Grants, Ope
ratin
g‐
$
‐$
‐$
1,651
$
1,166
$
1,368
$
340
$
‐$
‐$
‐$
Interest In
come, Unrestricted
5,380
$
4,964
$
3,363
$
3,680
$
3,510
$
3,443
$
4,153
$
5,200
$
3,227
$
1,674
$
Other N
on‐O
peratin
g Income
3,258
$
3,208
$
3,451
$
5,302
$
4,682
$
2,881
$
2,288
$
1,063
$
1,152
$
2,497
$
Total Non‐Operating Revenue
8,638
$
8,172
$
6,814
$
10,633
$
9,358
$
7,692
$
6,781
$
6,263
$
4,379
$
4,171
$
Gross Revenue Available for Debt (a)
28,583
$
30,472
$
32,444
$
39,730
$
40,947
$
42,641
$
46,089
$
43,179
$
43,626
$
44,010
$
Less: Annual debt service requirement (b)
14,406
$
14,648
$
15,526
$
16,730
$
17,184
$
15,093
$
12,732
$
14,134
$
13,142
$
14,001
$
Net Revenue Available for payment
of Operating Expenses:
14,177
$
15,824
$
16,918
$
23,000
$
23,763
$
27,548
$
33,357
$
29,045
$
30,484
$
30,009
$
Operating Expenses (c)
Pe
rson
nel
4,855
$
5,517
$
6,372
$
6,735
$
7,315
$
7,756
$
8,441
$
8,912
$
9,407
$
10,089
$
Prom
otiona
l454
$
471
$
493
$
590
$
450
$
433
$
439
$
329
$
287
$
218
$
Adm
inistrative
3,350
$
3,809
$
6,809
$
8,572
$
9,508
$
10,340
$
11,033
$
12,195
$
12,849
$
12,560
$
Total Operating Expenses
8,659
$
9,797
$
13,674
$
15,897
$
17,273
$
18,529
$
19,913
$
21,436
$
22,543
$
22,867
$
Surplus Port Revenues (d)
5,518
$
6,027
$
3,244
$
7,103
$
6,490
$
9,019
$
13,444
$
7,609
$
7,941
$
7,142
$
( a ) Gross re
venu
e as defined in th
e Senior Lien Bo
nd Resolution as availa
ble to pay debt; exclud
es cap
ital g
rants, ad valorem ta
xes, other re
venu
e which is re
stricted to th
e Po
rtʹs Cap
ital P
rogram
.( b ) Debt service re
quirem
ent exclude
s capitaliz
ation of in
terest, d
ebt service on de
feased bon
ds, n
or amortiz
ed bon
d issue costs an
d discou
nts.
( c ) Ope
ratin
g expe
nses exclude dep
reciation, bon
d interest, amortiz
ation, and extraordina
ry lo
sses. No ad
justment h
as been mad
e to ope
ratin
g expe
nse for p
ayments to other gov
ernm
ents.
( d ) Su
rplus Po
rt re
venu
es re
presents excess Po
rt re
venu
es afte
r debt service and ope
ratin
g expe
nses.
Note: D
ata presented on th
is ta
ble was re
calculated from last year to be con
sistent w
ith th
e bo
nd re
solutio
n de
finition of g
ross re
venu
es.
(amounts in thousands)
TAMPA PORT AUTHORITY
Summary of Surplus Port Revenues
Last Ten Years
(Unaudited)
after Debt and Operating Costs
Available for Capital Program
57

Table 11
Public
Total
High School
Public
Median
Graduation
School
Unemployment
Year
Population
Per Capita
Age
Rates
Enrollm
ent
Rate
1999
953,500
26,483,397
26,889
36 69.5
168,360
2.7
2000
998,948
28,645,545
28,558
35 71.4
173,953
3.3
2001
1,027,436
29,828,798
29,055
35 74.4
179,362
4.2
2002
1,055,807
31,150,902
29,602
36 77.5
184,483
5.3
2003
1,083,520
31,932,807
29,748
35 75.8
191,186
5.1
2004
1,115,960
34,848,801
31,671
36 79.3
197,500
4.3
2005
1,142,850
37,379,401
33,034
36 79.5
193,669
3.6
2006
1,172,970
40,757,703
35,079
36 77.3
193,480
3.3
2007
1,204,750
42,859,565
36,616
36 79.1
193,180
4.0
2008
1,234,010
**
**
36 80.0
191,965
6.3
(a)
(b)
(b)
(c)
(d)
(d)
(e)
Sources:
(a)
Hillsborou
gh Cou
nty City‐Cou
nty Plan
ning Com
mission
(b)
U.S. D
epartm
ent o
f Com
merce Bureau of Econo
mic Ana
lysis
(c)
U.S. C
ensus Bu
reau
(d)
Florida Dep
artm
ent o
f Edu
catio
n(e)
Florida Agency for W
orkforce In
novatio
n, Labor M
arket S
tatistics Center, Lo
cal A
rea Unemploy
ment
Statistics Prog
ram, in coo
peratio
n with th
e U.S. D
epartm
ent o
f Labor, B
ureau of Labor Statistics.
** P
ersona
l incom
e da
ta fo
r fiscal y
ear 2
008 was not yet availa
ble.
HILLSBOROUGH COUNTY, FLORIDA
Demographic and Economic Statistics
Last Ten Years
(in thousands)
Personal
Personal
Income
Income
58

Employer Type of Operation Employees % Rank Employees % Rank (a)
Hillsborough County School Board Public education 25,596 4.5 1 25,494 4.6 1 Hillsborough County Government Government 10,194 1.8 2 10,461 1.9 3 University of South Florida Education services 8,600 1.5 3 9,966 1.8 4 Verizon Communications Inc. Telecommunications 7,850 1.4 4 14,000 2.5 2
and data processingTampa International Airport International airport 7,500 1.3 5 8,000 1.5 5 MacDill Air Force Base Military base 6,734 1.2 6 5,580 1.0 6 Tampa General Hospital Medical facilities 6,020 1.1 7 3,465 0.6 13 Publix Food Centers Supermarkets 5,714 1.0 8 5,100 0.9 7 James A. Haley ‐ VA Hospital Medical facilities 4,900 0.9 9 – – City of Tampa Government 4,154 0.7 10 4,300 0.8 9 H. Lee Moffit Cancer Center Medical facilities 3,927 0.7 11 – – Bank of America Banks 3,876 0.7 12 4,000 0.7 11 St. Joseph Hospital Medical facilities 3,770 0.7 13 4,356 0.8 8 Busch Entertainment Corporation Tourist attraction 3,737 0.7 14 2,800 0.5 16 University Community Hospital Medical facilities 3,108 0.5 15 3,150 0.6 14 SweetBay Supermarkets Supermarket 2,811 0.5 16 3,075 0.6 15 (b)Tampa Electric Company Electric utility 2,711 0.5 17 3,592 0.7 12 USF Health Science Center Medical facilities 2,611 0.5 18 – – U.S. Postal Service Postal services 2,342 0.4 19 4,150 0.8 10 Hillsborough Community College Education services 2,237 0.4 20 – – Brandon Regional Hospital Medical facilities 1,654 0.3 21 1,323 0.2 21 (c)Tribune Company Newspaper publishing – – 2,200 0.4 17 IBM Corporation Marketing and info network – – 1,400 0.3 20 Chase Manhattan Bank Financial services – – 2,014 0.4 18 Citibank Travelers checks and finance – – 2,200 0.4 17 Time Customer Services Inc. Magazine subscription – – 1,900 0.3 19 Metropolitan Life Insurance Co. Computer services – – 1,400 0.3 20 Total 120,046 21.1 123,926 22.5
(a) Percentages shown represent the number of employees as a percent of total Hillsborough County employment. Total HillsboroughCounty employment for 2009 was not available so the 2008 figure of 567,648 was used instead. Total Hillsborough County employment for 2000 was 550,232.
(b) Kash ʹNʹ Karry was shown separately in 2000, but was shown as SweetBay Supermarkets in 2009.(c) Columbia Hospital ‐ Brandon was shown separately in 2000, but was shown as Brandon Regional Hospital in 2009.
Source: Hillsborough County City‐County Planning Commission, 2009Florida Agency for Workforce Innovation, Labor Statistics
2009 2000
Table 12
Principal EmployersLatest Fiscal Year Compared to the Fiscal Year Nine Years Earlier
HILLSBOROUGH COUNTY, FLORIDA
59

Table 13HILLSBOROUGH COUNTY, FLORIDA
Property Tax Millage Rates for Direct and Overlapping GovernmentsLast Ten Fiscal Years
2000 2001 2002 2003 2004 2005 2006 2007 2008 2009Countywide (BOCC):BOCC General Revenue 7.534 7.435 7.198 7.188 7.176 6.926 6.520 5.745 5.744 5.742BOCC Library Service 0.642 0.642 0.642 0.642 0.642 0.692 0.692 0.608 0.558 0.558Environmentally sensitive lands (voted) 0.149 0.127 0.114 0.105 0.097 0.084 0.067 0.060 0.060 0.060Total millage 8.325 8.204 7.954 7.935 7.915 7.702 7.279 6.413 6.362 6.360Maximum millage per statute (a) 10.149 10.127 10.114 10.105 10.097 10.084 10.067 10.060 10.060 10.060
Unincorporated Area (BOCC):BOCC Municipal Service Taxing Unit 5.062 5.062 5.062 5.062 5.062 5.162 4.995 4.376 4.375 4.375Parks and Recreation (voted) 0.068 0.058 0.050 0.050 0.040 0.036 0.029 0.026 0.026 0.026Total millage 5.130 5.120 5.112 5.112 5.102 5.198 5.024 4.402 4.401 4.401Maximum millage per statute (a) 10.068 10.058 10.050 10.050 10.040 10.036 10.029 10.026 10.026 10.026
Countywide (Other):Tampa Port Authority 0.295 0.290 0.290 0.290 0.260 0.260 0.220 0.198 0.195 0.193Southwest Florida Water Management District 0.422 0.422 0.422 0.422 0.422 0.422 0.422 0.387 0.387 0.387School Board 8.715 8.586 8.595 8.480 8.361 7.937 7.823 7.523 7.777 7.692Childrenʹs Board 0.417 0.417 0.500 0.500 0.500 0.500 0.500 0.463 0.500 0.500
Unincorporated Area (Other)Southwest Florida Water Management District (b): Alafia River Basin 0.240 0.240 0.240 0.240 0.240 0.240 0.240 0.216 0.216 0.216 Hillsborough River Basin 0.285 0.285 0.285 0.285 0.285 0.285 0.285 0.255 0.255 0.242 NW Hillsborough Basin 0.268 0.268 0.268 0.268 0.268 0.268 0.268 0.242 0.242 ‐‐Transit Authority 0.500 0.500 0.500 0.500 0.500 0.500 0.500 0.450 0.468 0.468
Municipalities:Tampa 6.539 6.539 6.539 6.539 6.539 6.539 6.408 5.733 5.733 5.733Temple Terrace 4.910 4.910 4.910 4.910 4.910 4.910 4.700 4.569 4.569 5.283Plant City 4.700 4.700 4.700 4.700 4.700 4.700 4.910 4.165 4.165 4.716
Total millage for unincorporatedarea within the Alafia River Basinexcluding any special districtassessments (for analysis only) 24.044 23.779 23.613 23.479 23.300 22.759 22.008 20.052 20.306 20.217
(a)
(b)During fiscal year 2009, the NW Hillsborough Basin was merged into the Hillsborough River Basin.
Source: Hillsborough County Tax Collector, www.hillstax.org/tax/proptaxinfo.asp
Dependent on its location, property within Tampa may either be in the Alafia, the Hillsborough River, or the NW Hillsborough Watershed Basin. Plant City property
(Millage Rates Rounded to Nearest Thousandth)
Section 200.071, Florida Statutes, states that the maximum ad valorem tax millage for either the countywide or unincorporated area (municipal services taxing unit) ofthe BOCC is set at 10 mills plus any voted levies.
60


Table 14
Percentage
Percentage
of Total
Taxes
of Total
Taxpayer
Type of Business
Rank
Taxes Levied
Levied (a)
Rank
Taxes Levied
Tampa Electric Com
pany
Electric utility
$31,181
1
1.6%
30,622
1
3.3%
Verizon Com
mun
ications In
c.Te
lecommun
ications
25,857
2
1.3
28,605
2
3.1
(b)
Hillsborou
gh Cou
nty Aviation Autho
rity
Airpo
rt12,008
3
0.6
–
–Mosaic Com
pany
Mining/fertilizer m
inerals
8,101
4
0.4
6,226
3
0.7
(c)
Highw
oods/Florida H
olding LP
Real estate man
agem
ent
6,455
5
0.3
–
–Cam
den Ope
ratin
g LP
Real estate
5,759
6
0.3
3,490
4
0.4
Liberty Prop
erty
Prop
erty m
anagem
ent
5,286
7
0.3
–
–Po
st Apa
rtment H
omes LP
Real estate
5,245
8
0.3
–
–Wal‐M
art
Retail stores
4,309
9
0.2
–
–Ta
mpa Port A
utho
rity
Cargo
/Cruise/Re
al Estate
4,071
10
0.2
–
–Bu
sch En
tertainm
ent C
orpo
ratio
nEn
tertainm
ent
–
–2,742
5
0.3
Time Warner E
ntertainment C
ompa
nyPu
blishing and entertainment
–
–2,582
6
0.3
Metropo
litan Life In
surance
Insurance
–
–2,366
7
0.3
Glim
cher University M
all L
td Partnership
Retail stores
–
–2,068
8
0.2
$
108,272
5.5%
78,701
8.6%
(a) Dollar a
mou
nts in th
ousand
s.(b) Verizon and Verizon Data Services, Inc. w
ere show
n sepa
rately in 1999, but are now kno
wn as Verizon Com
mun
ications In
c.(c) IM
C ‐ Agrico Com
pany and Cargill Fertilizer, Inc were show
n sepa
rately in 1999, but are now kno
wn as M
osaic Com
pany
.
Source: Hillsborou
gh Cou
nty Ta
x Collector
This
chartshow
sthetotaltaxes
levied
againstthetenlargesttaxp
ayersin
themostrecent
year
aswellas
nine
yearsearlier.Prop
erty
locatedwith
inthe
geog
raph
icbo
unda
ries
ofHillsborou
ghCou
ntyissubjecttotaxlevies
byHillsborou
ghCou
ntyas
wella
sseveralo
ther
taxing
authorities.T
heHillsborou
ghCou
ntyTa
xCollector
collectstaxesfora
llof
thesetaxing
authorities.T
axingau
thorities
such
astheCity
ofTa
mpa
andtheScho
olBo
ardareno
tapa
rtof
the
Hillsborou
ghCou
ntyfin
ancial
repo
rtingentity.
Theirtaxlevies,h
owever,are
includ
edin
thecharta
bove
inorde
rto
show
thetotaltaxes
duefrom
each
ofthetenlargesttaxpa
yers.T
hetotaltaxes
levied
byallo
fthese
taxing
authorities
againstp
rope
rtylocatedwith
inthegeog
raph
icbo
unda
ries
ofHillsborou
ghCou
nty was $1,942,561,000 for 2
008 an
d $931,014,000 fo
r 1999.
HILLSBOROUGH COUNTY, FLORIDA
Principal Taxpayers
Latest Fiscal Year Compared to the Fiscal Year Nine Years Earlier
(amounts in thousands)
2008
1999
Taxes
Levied (a)
61

Table 15
2000
2001
2002
2003
2004
2005
2006
2007
2008
2009
PORT USAGE FEES, MAJOR CARGO CATEGORIES
Bulk Cargo:
Dockage
2,678
$
2,917
$
3,218
$
3,058
$
3,363
$
3,770
$
4,077
$
3,699
$
3,686
$
3,470
$
Wha
rfage
3,868
$
4,177
$
4,790
$
5,038
$
5,405
$
6,247
$
6,277
$
6,165
$
6,079
$
5,632
$
Subtotal, Bulk Cargo
6,546
$
7,094
$
8,008
$
8,096
$
8,768
$
10,017
$
10,354
$
9,864
$
9,765
$
9,102
$
Bulk Cargo Tonnage
10,947
12,797
12,598
13,064
14,073
15,416
15,533
14,266
13,142
12,116
Average Dockage & Wharfage per Ton
0.60
$
0.55
$
0.64
$
0.62
$
0.62
$
0.65
$
0.67
$
0.69
$
0.74
$
0.75
$
General Cargo:
Dockage
972
$
790
$
759
$
926
$
838
$
845
$
1,122
$
1,072
$
763
$
642
$
Wha
rfage
1,252
$
1,363
$
1,424
$
1,698
$
1,770
$
2,116
$
2,381
$
2,530
$
2,581
$
2,637
$
Subtotal, General Cargo
2,224
$
2,153
$
2,183
$
2,624
$
2,608
$
2,961
$
3,503
$
3,602
$
3,344
$
3,279
$
General Cargo Tonnage
783
845
774
979
975
1,062
1,205
1,312
1,235
1,095
Average Dockage & Wharfage per Ton
2.84
$
2.55
$
2.82
$
2.68
$
2.67
$
2.79
$
2.91
$
2.75
$
2.71
$
2.99
$
Cruise:
Dockage
603
$
620
$
766
$
822
$
747
$
785
$
985
$
792
$
780
$
808
$
Wha
rfage
2,189
$
2,156
$
2,917
$
4,495
$
4,385
$
4,310
$
5,119
$
4,449
$
4,463
$
4,669
$
Subtotal, Cruise / Passengers
2,792
$
2,776
$
3,683
$
5,317
$
5,132
$
5,095
$
6,104
$
5,241
$
5,243
$
5,477
$
Passenger Count
460
517
587
810
792
772
911
781
768
803
Average Dockage & Wharfage per Passenger
6.07
$
5.37
$
6.27
$
6.56
$
6.48
$
6.60
$
6.70
$
6.71
$
6.83
$
6.82
$
Combined Dockage & Wharfage Major Cargo Category:
Cruise
2,792
$
2,776
$
3,683
$
5,317
$
5,132
$
5,095
$
6,104
$
5,241
$
5,243
$
5,477
$
Bulk Cargo
6,546
$
7,094
$
8,008
$
8,096
$
8,768
$
10,017
$
10,354
$
9,864
$
9,765
$
9,102
$
General Cargo
2,224
$
2,153
$
2,183
$
2,624
$
2,608
$
2,961
$
3,503
$
3,602
$
3,344
$
3,279
$
Total Combined Dockage & Wharfage Major Cargo
11,562
$
12,023
$
13,874
$
16,037
$
16,508
$
18,073
$
19,961
$
18,707
$
18,352
$
17,858
$
Schedule of Revenue by Activity
Last Ten Years
(Unaudited)
(amounts in thousands)
62

Table 15
2000
2001
2002
2003
2004
2005
2006
2007
2008
2009
Schedule of Revenue by Activity
Last Ten Years
(Unaudited)
(amounts in thousands)
OTHER PORT USAGE FEES:
Dockage, n
on‐cargo re
lated
681
$
811
$
670
$
807
$
949
$
730
$
717
$
673
$
658
$
660
$
In lieu of W
harfage, (sho
rtfalls, p
rodu
ct via ra
il, truck)
491
$
864
$
595
$
628
$
581
$
1,028
$
1,162
$
874
$
2,587
$
2,891
$
Parking an
d related
1,076
$
1,746
$
2,658
$
3,455
$
3,810
$
4,168
$
5,569
$
5,431
$
4,976
$
5,892
$
Term
inal Ope
ratio
ns295
$
‐$
416
$
300
$
667
$
1,004
$
1,670
$
1,288
$
1,409
$
1,361
$
Other Usage Fees
336
$
301
$
98$
457
$
384
$
372
$
273
$
283
$
352
$
285
$
Total Other Port Usage Fees:
2,879
$
3,722
$
4,437
$
5,647
$
6,391
$
7,302
$
9,391
$
8,549
$
9,982
$
11,089
$
PORT USAGE FEES, TOTAL
14,441
$
15,745
$
18,311
$
21,684
$
22,899
$
25,375
$
29,352
$
27,256
$
28,334
$
28,947
$
LAND & BUILDING LEASES
4,992
$
5,978
$
6,389
$
6,213
$
7,340
$
8,309
$
8,419
$
8,125
$
9,442
$
9,654
$
OTHER OPERATING:
Tenant Utilities
418
$
478
$
522
$
648
$
627
$
530
$
624
$
582
$
553
$
520
$
Fingerprinting/Badging
‐$
‐$
316
$
432
$
581
$
610
$
798
$
841
$
810
$
624
$
Other Port Operating
94$
99$
92$
120
$
142
$
125
$
115
$
112
$
108
$
94$
Total Other Operating Revenue
512
$
577
$
930
$
1,200
$
1,350
$
1,265
$
1,537
$
1,535
$
1,471
$
1,238
$
TOTAL OPERATING REVENUE
19,945
$
22,300
$
25,630
$
29,097
$
31,589
$
34,949
$
39,308
$
36,916
$
39,247
$
39,839
$
Note:
This ta
ble was exp
ande
d from last yearʹs ta
ble ad
ding a fu
ll 10 years of d
ata, categorizing do
ckage an
d wha
rfage to m
ajor cargo lines, and add
ing other frequ
ently re
quested
inform
ation to be more inform
ative to th
e users of th
e da
ta.
63

Table 16
2000
2001
2002
2003
2004
2005
2006
2007
2008
2009
DRY BULK CARGO
CEM
ENT, BULK
290
403
381
439
427
790
998
666
345
115
CITRU
S PE
LLET
S491
337
300
189
313
102
125
138
138
103
COAL
4644
131
136
188
220
168
216
00
GRA
NITE RO
CK, B
ULK
499
456
612
901
751
653
588
604
977
1,204
LIMES
TONE
660
1,049
1,103
1,285
1,478
1,728
1,708
1,676
1,136
542
PHOSP
HATIC CHEM
ICAL, BUL K
917
961
948
789
1,175
1,161
1,253
1,103
1,108
1,349
OTH
ER DRY BULK
382
482
535
368
424
216
341
157
147
198
TOTAL DRY BULK CARGO:
3,287
3,732
4,010
4,106
4,755
4,871
5,181
4,560
3,851
3,511
LIQUID BULK CARGO
AMMONIA
, ANHYD
ROUS
786
658
675
662
692
671
477
402
434
410
CONCEN
TRATE
, CITRU
S BU
LK50
7779
8145
4957
6577
52PE
TROLE
UM PRO
DUCTS
5,093
6,110
6,083
6,400
6,958
7,753
7,609
7,720
7,143
6,960
SULP
HUR, LIQ
UID
1,316
1,671
1,355
1,617
1,394
1,802
2,025
1,329
1,321
922
SULP
HURIC ACID
357
485
336
138
167
201
111
108
219
179
OTH
ER LIQ
UID BUL K
5965
6060
6269
7382
9782
TOTAL LIQUID BULK CARGO:
7,661
9,065
8,588
8,957
9,318
10,545
10,352
9,706
9,291
8,605
TOTAL BULK CARGO:
10,947
12,797
12,598
13,064
14,073
15,416
15,533
14,266
13,142
12,116
GENERAL CARGO
CONTA
INER
IZED
3333
2338
108
131
149
297
364
396
FORE
ST PRO
DUCTS
2346
3953
2050
623
81
GEN
ERAL CARG
O12
2842
206
117
1934
24RE
FFER CARG
O144
6264
5340
4239
1735
32SC
RAP MET
AL
80207
195
420
439
393
419
577
594
535
STEE
L PR
ODUCTS
457
404
338
342
322
380
463
338
154
85VEH
ICLE
S (in to
ns)
3365
7254
4155
6661
4622
TOTAL GENERAL CARGO:
783
845
774
979
975
1,062
1,205
1,312
1,235
1,095
TOTAL BULK AND GENERAL:
11,730
13,642
13,372
14,043
15,049
16,477
16,738
15,578
14,377
13,211
TOTAL CRUISE PASSENGERS
460
517
587
810
792
772
911
781
768
803
Represents to
nnage ha
ndled throug
h Ta
mpa Port A
utho
rity fa
cilities, private fa
cility tonn
age is exclude
d.
TAMPA PORT AUTHORITY
Annual Cargo Tonnages and Passenger Count
Last Ten Years
(in thousands)
64

Table 17
2000
2001
2002
2003
2004
2005
2006
2007
2008
2009
CHANNEL W
IDTH (feet)
Sparkm
an Cha
nnel
400
400
400
400
400
400
400
400
400
400
East Bay Cha
nnel
400
400
400
400
400
400
400
400
400
400
Ybor Cha
nnel
400
400
400
400
400
400
400
400
400
400
Port Sutton Cha
nnel
200
200
200
200
200
200
200
200
200
200
Garrison Cha
nnel
300
300
300
300
300
300
300
300
300
300
Sedd
on Cha
nnel
200
200
200
200
200
200
200
200
200
200
Hillsborou
gh Bay Cha
nnel Cut D
400
400
400
400
400
400
400
400
400
400
Port Sutton En
tran
ce Cha
nnel
200
200
200
200
200
200
200
200
200
200
Big Be
nd Cha
nnel E/W (P
ort R
edwing)
200
200
200
200
200
200
200
200
200
200
CHANNEL DEP
TH (feet)
Sparkm
an Cha
nnel (a
)34/41
34/41
34/41
34/41
34/41
34/41
34/41
34/41
34/41
34/41
Eastbay Cha
nnel (a
)34/41
34/41
34/41
34/41
34/41
34/41
34/41
34/41
34/41
34/41
Ybor Cha
nnel
3434
3434
3434
3434
3434
Port Sutton Cha
nnel
3434
3434
3434
3434
3434
Garrison Cha
nnel (n
ot m
aintained)
<34
<34
<34
<34
<34
<34
<34
<34
<34
<34
Sedd
on Cha
nnel (n
ot m
aintained)
<34
<34
<34
<34
<34
<34
<34
<34
<34
<34
Hillsborou
gh Bay Cha
nnel Cut D
4343
4341
4141
4141
4141
Port Sutton En
tran
ce Cha
nnel
4343
4343
4343
4343
4343
Big Be
nd Cha
nnel E/W (P
ort R
edwing)
3434
3434
3434
3434
3434
BERT
HIN
G SPA
CE
Wha
rf (linear feet)
7,225
7,225
8,225
9,175
10,375
10,375
11,855
11,855
11,855
12,855
Num
ber o
f Berths
5656
5757
5859
5959
5960
TOTA
L LA
ND (a
cres)
2,427
2,432
2,432
2,502
2,512
2,551
2,551
2,454
2,454
2,454
Port Owned/Usable ‐ E
stim
ated
1,450
1,455
1,455
1,525
1,535
1,574
1,574
1,477
1,477
1,477
Port Owned/Sp
oil Islan
ds ‐ Estim
ated
977
977
977
977
977
977
977
977
977
977
Leased ‐ Estim
ated
1,239
1,259
1,273
1,298
1,298
1,325
1,300
1,290
1,290
1,285
HARD SURF
ACED OPE
N STO
RAGE (acres) (b)
8383
8383
8383
8383
COVER
ED STO
RAGE (sq. ft.)
471,000
471,000
471,000
471,000
471,000
471,000
506,000*
506,000*
506,000*
506,000*
REFR
IGER
ATE
D STO
RAGE (sq. ft.)
114,000
114,000
114,000
114,000
114,000
114,000
114,000
118,267
118,267
0CRU
ISE TE
RMIN
AL SP
ACE (sq ft.)
126,000
126,000
126,000
236,000
236,000
236,000
201,000*
201,000
201,000
201,000
RAILRO
AD TRA
CK (m
iles)(Port O
wned)
22
77
77
77
77
(a) N
ormal cha
nnel dep
th is listed first followed by turning basin de
pth
(b) Information prior to this year n
ot availa
ble
* Cruise term
inal 7 w
as con
verted to w
arehou
se spa
ce in 2006
TAMPA PORT AUTHORITY
Capital Assets
Last Ten Fiscal Years
65

Table 18
FY 2000
FY 2001
FY 2002
FY 2003
FY 2004
FY 2005
FY 2006
FY 2007
FY 2008
FY 2009
Staffing
Staffing
Staffing
Staffing
Staffing
Staffing
Staffing
Staffing
Staffing
Staffing
EXECUTIVE/LEGAL DIVISION:
Chief Executiv
e Officer/Chief Ope
ratin
g Officer
33
33
22
33
33
DEPUTY PORT DIRECTOR OPERATIONS/ENGINEERING DIVISION:
Dep
uty Po
rt Director O
peratio
ns1
11
11
11
11
2Facilities Man
agem
ent
1616
1618
1717
1517
1718
Security (a
)0
021
2326
2828
2830
28En
gineering
1315
1414
1313
1415
1616
Ope
ratio
ns20
2510
1214
1314
1317
15Cruise Ope
ratio
ns3
33
53
22
22
2
Ope
ratio
ns/Eng
ineering Division Su
btotal
5360
6573
7474
7476
8381
DEPUTY PORT DIRECTOR ADMINISTRATION/PORT COUNSEL DIVISION:
Port Cou
nsel
32
34
43
44
45
Real Estate Senior Director
32
23
34
45
55
Environm
ental A
ffairs
44
34
44
42
43
Senior Director, Marketin
g Services
22
12
22
22
23
Cargo M
arketin
g4
33
33
33
33
1Trad
e Develop
ment
00
01
11
11
11
Cruise Marketin
g1
11
11
00
00
0Adm
inistration/Po
rt Cou
nsel Division Su
btotal
1714
1318
1817
1817
1918
CHIEF FINANCIAL OFFICER DIVISION:
Chief Finan
cial Officer
22
22
55
53
22
Hum
an Resou
rces
46
67
65
55
44
Fina
nce
88
910
88
88
77
Chief In
form
ation Officer
22
23
33
33
32
Chief Finan
cial Officer D
ivision Su
btotal
1618
1922
2221
2119
1615
COMMUNICATIONS/BOARD COORDINATION DIVISION
Sr. D
irector C
ommun
ications & Board Coo
rdination
12
22
23
32
22
Public Relations
34
24
23
21
11
Com
mun
ications/Board Coo
rdination Div Sub
total
46
46
46
53
33
PLANNING & ECONOMIC DEVELOPM
ENT DIVISION
11
11
11
11
11
TAMPA PORT AUTHORITY ‐Total Positions
94102
105
123
121
121
122
119
125
121
(a) S
ecurity personn
el w
ere includ
ed in ope
ratio
ns prior to 2002
TAMPA PORT AUTHORITY
STAFFING BY DIVISION/DEPARTM
ENT
66

Table 19
Cruise Average Total Percent ofFiscal Passenger Operating Revenue per Operating Cruise OperatingYear Count ( a ) Revenue ( b ) Passenger Revenue to Total Operating
2000 459,803 4,122,069$ 8.96$ 19,945,071$ 20.67%
2001 517,235 4,660,147$ 9.01$ 22,301,242$ 20.90%
2002 587,470 5,696,730$ 9.70$ 25,629,438$ 22.23%
2003 810,114 8,175,083$ 10.09$ 29,096,585$ 28.10%
2004 791,772 7,887,694$ 9.96$ 31,588,942$ 24.97%
2005 771,550 7,929,272$ 10.28$ 34,948,669$ 22.69%
2006 910,633 9,980,839$ 10.96$ 39,307,522$ 25.39%
2007 780,882 8,898,561$ 11.40$ 36,914,859$ 24.11%
2008 767,760 8,671,080$ 11.29$ 39,247,140$ 22.09%
2009 802,937 9,397,929$ 11.70$ 39,846,811$ 23.59%
( a ) Passenger count includes passengers disembarking, embarking, and in transit from cruise ships.
( b ) Cruise revenue includes dockage, wharfage, water, parking, and miscellaneous terminal revenue.
Source: Port Authority statistics
TAMPA PORT AUTHORITYCruise StatisticsLast Ten Years(Unaudited)
67

Table 20
Limits ofCoverage
1. Workersʹ Compensation & Employersʹ LiabilityWorkersʹ Compensation Limit StatutoryEmployersʹ Liability Level Limit 1,000,000$
2. General LiabilityPrimary Liability including Employment Practices 1,000,000$ Maritime Employers Liability 1,000,000$ Public Officials 5,000,000$ Umbrella Liability 50,000,000$
3. Automobile & GaragekeepersLiability 4,000,000$ Personal Injury (PIP) StatutoryGaragekeepers Legal Liability 1,500,000$
4. Employee CrimePublic Employees Dishonesty 1,000,000$ Forgery or Alteration 1,000,000$ Computer Fraud 1,000,000$ Funds Transfer Fraud 1,000,000$ Theft of Money & Securities 100,000$
5. Fire & Allied Property Total Buildings and Allied 113,824,637$
Sublimits: AmountBuildings 99,367,855$ Personal Property 14,456,782$ Contractorʹs Equipment 6,590,037$ Inland Marine (Scheduled Equipment) 356,594$ Business Income 1,000,000$ Computer Related & Video/Radio Equipment 1,061,855$
6. National FloodBuildings 6,924,200$ Contents 958,700$
7. WatercraftProtection & Indemnity 1,000,000$
8. Boiler & Machine 50,000,000$ 9. Gasoline Storage Tank Liability 1,000,000$ 10. Corporate Foreign Travel/Accident, Etc. 1,000,000$
Tampa Port AuthorityInsurance Coverage
as of September 30, 2009(Unaudited)
6868

Table 21TAMPA PORT AUTHORITY
Financial Highlights(Unaudited)
(amounts in thousands)
$32,500
$35,000
$37,500
$40,000
$42,500
2005 2006 2007 2008 2009
$ thousands
Fiscal year
Operating Revenue
$0
$5,000
$10,000
$15,000
$20,000
$25,000
2005 2006 2007 2008 2009
$ thousands
Fiscal year
Operating Expenses
$32,500
$35,000
$37,500
$40,000
$42,500
2005 2006 2007 2008 2009
$ thousands
Fiscal year
Operating Revenue
$0
$5,000
$10,000
$15,000
$20,000
$25,000
2005 2006 2007 2008 2009
$ thousands
Fiscal year
Operating Expenses
$0
$5,000
$10,000
$15,000
$20,000
$25,000
$30,000
$35,000
2005 2006 2007 2008 2009
$ thousands
Fiscal year
Net Income
69


CO
MP
LIAN
CE
SE
CTIO
N


Compliance Section
Included in the following section is information furnished in compliance with the disclosure requirements pursuant to Securities & Exchange Commission’s Rule 15c2‐12. This rule requires issuers of municipal securities to provide annual updates of selected financial information to a nationally recognized municipal securities information repository. This report will be filed with the State of Florida’s Municipal Advisory Council in conformance with that requirement. This section also includes compliance reports and the Schedule of Expenditures of Federal and State Financial Assistance.

Table 22
FiscalYear Phosphate Petroleum Coal Sulphur All Other Total
2000 13,115 16,384 7,397 4,081 8,265 49,242
2001 10,315 17,484 6,870 3,854 8,569 47,092
2002 12,910 17,669 6,572 3,694 8,868 49,713
2003 12,310 17,134 6,043 4,019 9,042 48,548
2004 12,684 18,156 4,766 3,866 9,226 48,698
2005 12,251 19,269 4,812 3,856 10,028 50,216
2006 9,610 19,742 4,922 3,659 10,256 48,189
2007 8,415 19,473 4,659 3,256 9,491 45,294
2008 8,445 18,008 3,971 3,356 8,833 42,613
2009 7,812 16,766 4,310 2,547 6,375 37,810
Reported in short tons.
Represents total cargo handled at the Port of Tampa which includes TPA ‐ owned and privately ‐ owned terminals.
This information is provided to meet ʹContinuing Disclosureʹ as required under SEC Rule 15c2‐12.
Tampa Port AuthorityPort of Tampa Tonnage Distribution
Last Ten Years
(in thousands)(Unaudited)
70

Table 23
Passenger Other
Fiscal Terminal Port UsageYear Dockage Wharfage Income Fees Total
2000 4,934$ 7,800$ 1,076$ 631$ 14,441$
2001 5,138$ 8,860$ 1,746$ 301$ 16,045$
2002 5,413$ 9,726$ 2,659$ 513$ 18,311$
2003 5,513$ 11,859$ 3,456$ 751$ 21,579$
2004 5,897$ 12,141$ 3,810$ 1,051$ 22,899$
2005 6,130$ 13,701$ 4,170$ 1,377$ 25,378$
2006 6,901$ 14,939$ 5,569$ 1,939$ 29,348$
2007 6,236$ 14,018$ 5,431$ 1,571$ 27,256$
2008 5,887$ 15,710$ 4,976$ 1,760$ 28,333$
2009 5,580$ 15,829$ 5,892$ 1,646$ 28,947$
This information is provided to meet ʹContinuing Disclosureʹ as required under SEC Rule 15c2‐12.
(in thousands)
Tampa Port AuthorityPort Usage FeesLast Ten Years(Unaudited)
71

Table 24
2009 2009
No. of Minimum Total
Initial Date Initial Renewal Option Annual Revenue
Tenant of Lease Term Options Term Revenue Received (d)
Carnival Cruise Lines (c ) 04/01/2002 10 0 0 4,072,358$ 7,453,184$
Kinder Morgan (GATX) (b) (c ) 10/01/1998 5 3 5 1,397,589$ 3,778,064$
Ports America (Break Bulk) (b) (c ) 05/30/2006 40 0 0 1,425,000$ 2,050,918$
Trinity Materials, LLC (c ) 01/01/2007 30 2 10 1,485,139$ 1,485,139$
Zim Integrated Shipping (c ) 10/01/2006 3 0 0 861,284$ 1,141,078$
Murphy Oil USA, Inc. (c ) 09/01/2007 20 2 10 764,400$ 1,042,112$
Trademark Metals (c ) 12/01/1999 10 2 5 353,054$ 1,036,111$
Vulcan (ex:Marigold) (b) (c ) 10/01/2000 10 4 5 1,000,000$ 1,000,000$
TPSI Terminals (ex: Transmontaigne) (c ) 09/01/2007 20 2 10 903,463$ 903,463$
One Steel (ex:Smorgon Steel Recycling) (c ) 05/15/2007 10 2 10 365,379$ 883,071$
Gaetano Cacciatore (c ) 12/01/2005 25 8 5 847,157$ 847,157$
Martin Marietta Materials, Inc. (c ) 01/01/2004 5 2 5 582,631$ 751,250$
Cemex (ex:RMC) (b) (c ) 12/12/2001 5 1/2 yrs 4 5 740,588$ 740,588$
Tampa Bay Shipbuilding & Repair Co. 03/01/2007 5 2 15 729,167$ 729,167$
C F Industries, Inc. (fertilizer facility) (b) (c ) 06/01/1972 10 4 10 85,626$ 611,726$
Vulcan /ICA Distribution (Inc Fla Rock) (b) (c ) 07/01/1991 1 4/3 1/5 579,698$ 579,698$
Tarmac America LLC (Aggregates) (b) (c ) 01/01/2002 20 3 10 554,400$ 554,400$
Gulf Marine Repair, Inc. (Berth 250/253) 09/01/2006 10 3 10 550,000$ 550,000$
Cemex (ex: Rinker Materials) (b) 11/01/2007 40 2 20 510,000$ 510,000$
Tarmac America (Cement) (b) (c ) 01/01/2002 20 3 10 504,081$ 504,081$
Sea‐3 of Florida, Inc. (c ) 01/01/1999 22 3 10 369,000$ 493,058$
Channelside Bay Mall 04/23/1997 39 3/4 yrs 8 5 483,000$ 483,000$
Martin Operating Partners (ex:Martin Gas) (c ) 12/16/2006 10 2 5 328,666$ 478,261$
Holcim (US), Inc. (c ) 07/01/2005 5 2 5 434,616$ 434,616$
C F Industries, Inc.(ammonia facility) (b) (c ) 04/01/1993 6 1/2 yrs 3 10 83,240$ 433,680$
Cargill, Inc. (salt facility) (b) (c ) 07/01/1999 20 2 10 386,132$ 391,412$
Cemex, Inc. (ex:Southdown) (b) (c ) 07/01/1996 2 yrs‐11 mos 3 5 354,625$ 354,625$
Gulf Marine Repair (Berth 251/252) 11/01/2008 4 3 5 353,042$ 353,042$
Andino Cements 11/15/2007 40 4 10 308,000$ 308,000$
Gulf Sulphur Services (c ) 01/01/2000 5 2 5 222,858$ 290,217$
Florida Rock (c ) 11/01/2006 5 3 5 271,355$ 271,355$
Sulphuric Acid Trading (SATCO) (c ) 11/01/1979 25 1/1 15/5 258,837$ 258,837$
International Ship Repair (Metroport) 10/01/2009 5 5 5 248,544$ 248,544$
Amalie Oil Company 07/01/1997 25 1 10 172,076$ 229,614$
Namasco Acquisition Corporation 07/15/2001 5 1 5 219,425$ 219,425$
Pasco Terminals (c ) 11/01/2000 10 2 5 204,026$ 217,820$
Seabulk Towing, Inc. 05/01/1998 15 0 0 162,006$ 169,901$
University of So Fl (Small Business Center) 06/01/2008 3 2 1 141,939$ 141,939$
Halcrow, Inc. (ex:River Consulting) 08/06/2007 2 1 3 141,650$ 141,650$
Lehigh Portland Cement (c ) 09/01/2000 10 2 5 140,662$ 140,662$
Ports America (Container) (b) (c ) 05/30/2006 40 0 0 127,095$ 135,352$
Tropical Shipping Company 10/01/1999 5 2 5 43,577$ 133,102$
Cargill Financial Center (grain facility) (b) (c ) 05/01/1973 20 3 20 33,000$ 130,249$
Kinder Morgan (Central Fl Pipeline) (b) 03/28/1995 20 2 10 44,900$ 108,541$
Tampa Juice Service, Inc. 04/05/1995 20 2 10 50,243$ 106,684$
Yara North America (ex: Hydro‐Agri ) (b) (c ) 10/01/2007 20 2 10 95,930$ 104,491$
Gladiator LLP (Titan) (c ) 10/01/2006 20 4 5 97,600$ 97,600$
University of So Fl (Education Center) (b) 06/01/2008 1 2 1 93,963$ 93,963$
Starship Cruise Line, Inc. 01/01/2006 10 2 10 85,000$ 85,000$
Diversified Marine 07/01/2009 11 1 5 84,100$ 84,100$
Ecoventure New Port Marina 11/01/2005 5 4 5 81,516$ 81,516$
TC Port Ybor 04/09/2004 40 4 10 80,594$ 80,594$
WCI Communities, Inc. 05/03/2005 5 7 5 75,890$ 75,890$
TAMPA PORT AUTHORITY
Summary of Leases of Principal Tenants
as of September 30, 2009
(Unaudited)
72

Table 24
2009 2009
No. of Minimum Total
Initial Date Initial Renewal Option Annual Revenue
Tenant of Lease Term Options Term Revenue Received (d)
TAMPA PORT AUTHORITY
Summary of Leases of Principal Tenants
as of September 30, 2009
(Unaudited)
International Ship Repair (Berth 200/206) (b) 02/01/1997 2 2/1/1 2/3/10 74,309$ 74,309$
Kinder Morgan (Pt Sutton Bulk Terminals) (b) 12/23/2002 20 4 10 73,342$ 73,342$
Carolco 01/01/2008 4 3 1 52,500$ 52,500$
OSG America (ex: Maritrans Operating) 01/01/1980 25 3 10 46,624$ 46,624$
Intermodal Shipping 10/01/2007 6 mos. 0 0 42,227$ 42,227$
Superior Seafoods (a ) 01/01/1993 5 1 5 35,552$ 35,552$
HCP Associates, Inc. 11/01/2008 5 yrs‐3 mos 1 3 33,660$ 33,660$
Citrus Products (a ) 10/01/2005 mo‐mo 0 0 4,116$ 30,853$
PCL Civil Engineers 07/01/2007 11 mos. 0 0 27,280$ 27,280$
Bronco Transportation 12/01/2006 3 2 1 24,107$ 24,107$
Marine Towing of Tampa 01/01/2006 10 3 5 22,765$ 22,765$
Clark Reporting Service 11/01/2008 6 mos. 1 5 mo. 19,602$ 19,602$
Versaggi (a ) 01/01/1993 5 1 5 17,776$ 17,776$
Gulfstream Natural Gas 09/01/2007 11 mos 0 0 17,306$ 17,306$
Anova 03/18/2008 3 2 1 13,790$ 13,790$
Destination Tampa Bay 10/01/2008 1 4 1 13,200$ 13,200$
Lands End Marina 04/01/1997 5 2 5 12,565$ 12,565$
American General Life 12/01/2008 6‐mos 1 5‐mo 12,378$ 12,378$
American Victory 04/18/2000 4 4 4 12,000$ 12,000$
Eagle Watch Homeowners Association 05/01/2005 5 1 5 10,519$ 10,519$
Total Minimum and Actual Revenue 25,153,739$ 35,120,302$
(a ) Leases are in a holdover status as of 9/30/2009 ‐ contract negotiations in progress.
(b ) 2009 Revenues reported on Table 7 of this Comprehensive Financial Report are inclusive of multiple leases for these customers.
(c ) These customersʹ leases/agreements include minimum annual revenue guarantees.
(d ) This table excludes tenants with lease revenue less than $10,000 per year.
This information is provided to meet ʹContinuing Disclosureʹ as required under SEC Rule 15c2‐12 in accordance with Tampa Port
Authority Revenue bond resolution.
73
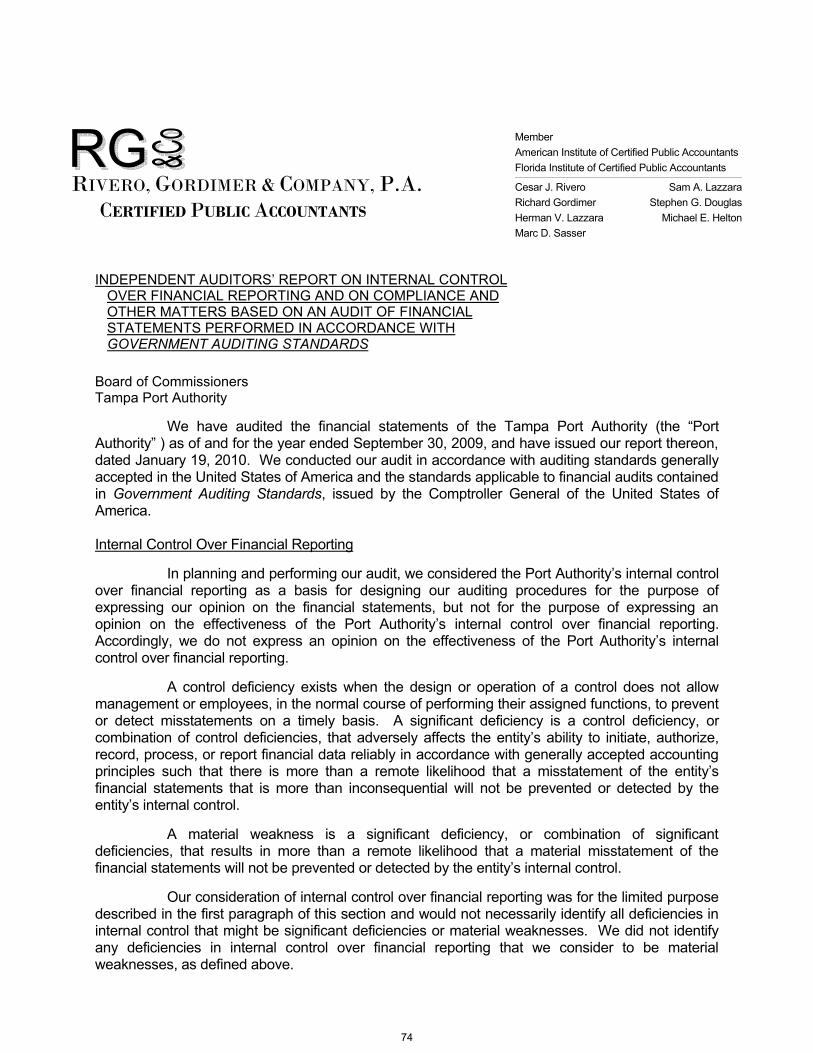
RIVERO, GORDIMER & COMPANY, P.A.CERTIFIED PUBLIC ACCOUNTANTS
INDEPENDENT AUDITORS’ REPORT ON INTERNAL CONTROL OVER FINANCIAL REPORTING AND ON COMPLIANCE AND OTHER MATTERS BASED ON AN AUDIT OF FINANCIAL STATEMENTS PERFORMED IN ACCORDANCE WITH GOVERNMENT AUDITING STANDARDS
Board of Commissioners Tampa Port Authority
We have audited the financial statements of the Tampa Port Authority (the “Port Authority” ) as of and for the year ended September 30, 2009, and have issued our report thereon, dated January 19, 2010. We conducted our audit in accordance with auditing standards generally accepted in the United States of America and the standards applicable to financial audits contained in Government Auditing Standards, issued by the Comptroller General of the United States of America.
Internal Control Over Financial Reporting
In planning and performing our audit, we considered the Port Authority’s internal control over financial reporting as a basis for designing our auditing procedures for the purpose of expressing our opinion on the financial statements, but not for the purpose of expressing an opinion on the effectiveness of the Port Authority’s internal control over financial reporting. Accordingly, we do not express an opinion on the effectiveness of the Port Authority’s internal control over financial reporting.
A control deficiency exists when the design or operation of a control does not allow management or employees, in the normal course of performing their assigned functions, to prevent or detect misstatements on a timely basis. A significant deficiency is a control deficiency, or combination of control deficiencies, that adversely affects the entity’s ability to initiate, authorize, record, process, or report financial data reliably in accordance with generally accepted accounting principles such that there is more than a remote likelihood that a misstatement of the entity’s financial statements that is more than inconsequential will not be prevented or detected by the entity’s internal control.
A material weakness is a significant deficiency, or combination of significant deficiencies, that results in more than a remote likelihood that a material misstatement of the financial statements will not be prevented or detected by the entity’s internal control.
Our consideration of internal control over financial reporting was for the limited purpose described in the first paragraph of this section and would not necessarily identify all deficiencies in internal control that might be significant deficiencies or material weaknesses. We did not identify any deficiencies in internal control over financial reporting that we consider to be material weaknesses, as defined above.
Member American Institute of Certified Public Accountants Florida Institute of Certified Public Accountants
Cesar J. Rivero Sam A. Lazzara Richard Gordimer Stephen G. Douglas Herman V. Lazzara Michael E. Helton Marc D. Sasser
74

ONE TAMPA CITY CENTER • SUITE 2600 • 201 N. FRANKLIN STEET • P. O. BOX 172359 • TAMPA, FLORIDA 33672 • 813- 875-7774 FAX 813-874-6785
Compliance and Other Matters
As part of obtaining reasonable assurance about whether the Port Authority’s financial statements are free of material misstatement, we performed tests of its compliance with certain provisions of laws, regulations, contracts, and grant agreements, noncompliance with which could have a direct and material effect on the determination of financial statement amounts. However, providing an opinion on compliance with those provisions was not an objective of our audit, and accordingly, we do not express such an opinion. The results of our tests disclosed no instances of noncompliance or other matters that are required to be reported under Government Auditing Standards.
This report is intended solely for the information and use of the Board of Commissioners of the Tampa Port Authority, management, federal and state awarding agencies and pass-through entities and is not intended to be and should not be used by anyone other than these specified parties.
Tampa, Florida January 19, 2010
75

RIVERO, GORDIMER & COMPANY, P.A.CERTIFIED PUBLIC ACCOUNTANTS
INDEPENDENT AUDITORS’ REPORT ON COMPLIANCE WITHREQUIREMENTS APPLICABLE TO EACH MAJOR STATE PROJECT AND ON INTERNAL CONTROL OVERCOMPLIANCE IN ACCORDANCE WITH CHAPTER 10.550 RULES OF THE AUDITOR GENERAL
Board of Commissioners Tampa Port Authority
Compliance
We have audited the compliance of the Tampa Port Authority (the "Port Authority") with the types of compliance requirements, described in the Department of Financial Service’s State Projects Compliance Supplement that are applicable to each of its major state projects for the year ended September 30, 2009. The Port Authority's major state projects are identified in the summary of auditors' results section of the accompanying Schedule of Findings and Questioned Costs. Compliance with the requirements of laws, regulations, contracts, and grants applicable to each of its major state projects is the responsibility of the Port Authority's management. Our responsibility is to express an opinion on the Port Authority's compliance based on our audit.
We conducted our audit of compliance in accordance with auditing standards generally accepted in the United States of America; the standards applicable to financial audits contained in Government Auditing Standards, issued by the Comptroller General of the United States of America; and Chapter 10.550, Rules of the Auditor General. Chapter 10.550, Rules of the Auditor General, requires that we plan and perform the audit to obtain reasonable assurance about whether noncompliance with the types of compliance requirements referred to above that could have a direct and material effect on a major state financial assistance project occurred. An audit includes examining, on a test basis, evidence about the Authority's compliance with those requirements and performing such other procedures, as we considered necessary in the circumstances. We believe that our audit provides a reasonable basis for our opinion. Our audit does not provide a legal determination on the Port Authority's compliance with those requirements.
In our opinion, the Port Authority complied, in all material respects, with the requirements referred to above that are applicable to each of its major state financial assistance projects for the year ended September 30, 2009.
Internal Control over Compliance
The management of the Port Authority is responsible for establishing and maintaining effective internal control over compliance with requirements of laws, regulations, contracts and grants applicable to state projects.
ONE TAMPA CITY CENTER • SUITE 2600 • 201 N. FRANKLIN STEET • P. O. BOX 172359 • TAMPA, FLORIDA 33672 • 813- 875-7774 FAX 813-874-6785
Member American Institute of Certified Public Accountants Florida Institute of Certified Public Accountants
Cesar J. Rivero Sam A. Lazzara Richard Gordimer Stephen G. Douglas Herman V. Lazzara Michael E. Helton Marc D. Sasser
76

In planning and performing our audit, we considered the Port Authority's internal control over compliance with requirements that could have a direct and material effect on a major state project to determine our auditing procedures for the purpose of expressing our opinion on compliance and to test and report on internal control over compliance in accordance with Chapter 10.550, Rules of the Auditor General, but not for the purpose of expressing an opinion on the effectiveness of internal control over compliance. Accordingly, we do not express an opinion on the effectiveness of the Port Authority’s internal control over compliance.
A control deficiency in an entity’s internal control over compliance exists when the design or operation of a control does not allow management or employees, in the normal course of performing their assigned functions, to prevent or detect noncompliance with a type of compliance requirement of a state project on a timely basis. A significant deficiency is a control deficiency, or combination of control deficiencies, that adversely affects the entity’s ability to administer a state financial assistance project such that there is more than a remote likelihood that noncompliance with a type of compliance requirement of a state financial assistance project that is more than inconsequential will not be prevented or detected by the entity’s internal control.
A material weakness is a significant deficiency, or combination of significant deficiencies, that results in more than a remote likelihood that material noncompliance with a type of compliance requirement of a state project will not be prevented or detected by the entity’s internal control.
Our consideration of internal control over compliance was for the limited purpose described in the first paragraph of this section and would not necessarily identify all deficiencies in internal control that might be significant deficiencies or material weaknesses. We did not identify any deficiencies in internal control over compliance that we consider to be material weaknesses, as defined above.
This report is intended solely for the information and use of the Board of Commissioners of the Tampa Port Authority, management, state awarding agencies and pass-through entities and is not intended to be and should not be used by anyone other than these specified parties.
Tampa, Florida January 19, 2010
77

Tam
pa P
ort A
utho
rity
SC
HE
DU
LE O
F E
XPE
ND
ITU
RE
S O
F S
TATE
FIN
AN
CIA
L A
SS
ISTA
NC
E
For t
he y
ear e
nded
Sep
tem
ber 3
0, 2
009
Stat
e CS
FA
Num
ber
Gran
t Num
ber
Awar
d Am
ount
Accr
ued
Reve
nue
Sept
embe
r 30,
20
08Re
ceipt
sEx
pend
iture
s
Accr
ued
Reve
nue
Sept
embe
r 30,
20
09
Stat
e Ag
ency
Flor
ida D
epar
tmen
t of T
rans
porta
tion
Seap
ort G
rant
s55
.005
4197
9119
401
5,62
5,00
0$
227,
042
$
22
7,04
2$
-
$
-
$
Seap
ort G
rant
s55
.005
4197
9219
401
6,75
0,00
0$
308,
516
30
8,51
6
-
-
Seap
ort G
rant
s55
.005
4205
9419
401
5,02
4,25
0$
-
5,02
4,25
0
5,02
4,25
0
-
Seap
ort G
rant
s55
.005
4206
1119
401
3,82
8,00
0$
-
2,09
3,76
9
2,19
6,65
9
10
2,89
0
Se
apor
t Gra
nts
55.0
0542
3146
1940
110
,450
,000
$
-
161,
134
2,70
4,87
0
2,
543,
736
T
otal
Seap
ort G
rant
s53
5,55
8
7,81
4,71
1
9,92
5,77
9
2,
646,
626
Pass
-thro
ugh
Hills
boro
ugh
Coun
ty Co
unty
Ince
ntive
Gra
nt P
rogr
am55
.008
4202
8547
7,00
0$
47
7,00
0
477,
000
-
-
Flor
ida D
epar
tmen
t of T
rans
porta
tion
Inte
rmod
al De
velop
men
t Pro
gram
Infra
struc
ture
impr
ovem
ents
55.0
1441
2746
1940
112
,121
,920
$
207,
091
9,
425,
233
9,
525,
279
307,
137
T
otal
state
finan
cial a
ssist
ance
1,21
9,64
9$
17
,716
,944
$
19,4
51,0
58$
2,
953,
763
$
Gran
tor a
nd P
rogr
am T
itle
78
Tabl
e 25

Tampa Port Authority
NOTES TO SCHEDULE OF EXPENDITURES OF STATE FINANCIAL ASSISTANCE
September 30, 2009
NOTE A - BASIS OF PRESENTATION
The accompanying Schedule of Expenditures of State Financial Assistance includes the state grant activity of the Port Authority and is presented on the accrual basis of accounting. The information in this schedule is presented in accordance with the requirements of Chapter 10.550, Rules of the Auditor General. Therefore, some amounts presented in this schedule may differ from amounts presented in, or used in the preparation of the basic financial statements.
NOTE B - CONTINGENCIES
These state programs are subject to financial and compliance audits by grantor agencies, which, if instances of material noncompliance are found, may result in disallowed expenditures, and affect the Port Authority’s continued participation in specific programs. The amount of expenditures which may be disallowed by the grantor agencies cannot be determined at this time, although the Port Authority expects such amounts, if any, to be immaterial.
NOTE C - SUBRECIPIENTS
The Port Authority did not provide state financial assistance to subrecipients.
79

Tampa Port Authority
SCHEDULE OF FINDINGS AND QUESTIONED COSTS – STATE FINANCIAL ASSISTANCE PROJECTS
For the year ended September 30, 2009
Section I - Summary of Auditors' Results
Type of auditors' report issued
Internal control over financial reportingMaterial weakness(es) identified? yes X noSignificant deficiency(ies) identified that are not
considered to be material weakness(es)? yes X none reported
Noncompliance material to financial statements noted? yes X no
Internal control over major projectsMaterial weakness(es) identified? yes X noSignificant deficiency(ies) identified that are not
considered to be material weakness(es)? yes X none reported
Type of auditors' report issued on compliance for major state projects
Any audit findings disclosed that are to be reportedin accordance with Chapter 10.550, Rules of the Auditor General? yes X no
Identification of major state projects:
CSFA Number55.00555.014
Dollar threshold used to distinguish between type Aand type B state projects
Section II - Financial Statement Findings
No matters were reported
583,532$
Name of State Projects
Financial Statements
Major State Projects
Seaport GrantsIntermodal Development Program
Unqualified
Unqualified
80
Table 26

Tampa Port Authority
SCHEDULE OF FINDINGS AND QUESTIONED COSTS – STATE FINANCIAL ASSISTANCE PROJECTS - CONTINUED
For the year ended September 30, 2009
Section III - Federal Award and State Financial Assistance Findings and Questioned Costs
No matters were reported
Section IV - Other Issues
A summary Schedule of Prior Audit Findings is not required because there were no prioraudit findings related to State Projects.
81
Table 26

RIVERO, GORDIMER & COMPANY, P.A.CERTIFIED PUBLIC ACCOUNTANTS
MANAGEMENT LETTER BASED ON RULE 10.554 OF THE AUDITOR GENERAL OF THE STATE OF FLORIDA
Board of Commissioners Tampa Port Authority
We have audited the financial statements of the Tampa Port Authority (the “Port Authority”) whose headquarters is located in Tampa, Florida, as of and for the fiscal year ended September 30, 2009, and have issued our report thereon, dated January 19, 2010.
We conducted our audit in accordance with auditing standards generally accepted in the United States of America; the standards applicable to financial audits contained in Government Auditing Standards issued by the Comptroller General of the United States of America. We have issued our Independent Auditors' Report on Internal Control over Financial Reporting and on Compliance and other Matters Based on an Audit of Financial Statements Performed in Accordance with Government Auditing Standards, Independent Auditors’ Report on Compliance with Requirements Applicable to Each Major State Project and on Internal Control over Compliance, and Schedule of Findings and Questioned Costs – State Financial Assistance Projects. Disclosures in those reports and schedule, which are dated January 19, 2010, should be considered in conjunction with this management letter.
Additionally, our audit was conducted in accordance with Chapter 10.550, Rules of the Auditor General, which governs the conduct of local government entity audits performed in the State of Florida and require that certain items be addressed in this letter. Those rules (Section 10.554(1)(i)1) require that we address in the management letter, if not already addressed in the auditors' reports on compliance and internal controls or schedule of findings and questioned costs, whether or not inaccuracies, shortages, defalcations, fraud and/or violations of laws, rules, regulations and contractual provisions reported in the preceding annual financial audit report have been corrected. There are no inaccuracies, irregularities, shortages, defalcations, and/or violations of laws, rules, regulations and contractual provisions disclosed in the preceding annual report.
As required by the Rules of the Auditor General (Section 10.554(1)(i)2.) the scope of our audit included a review of the provisions of Section 218.415, Florida Statutes, regarding the investment of public funds. In connection with our audit, we determined that the Port Authority complied with Section 218.415, Florida Statutes.
The Rules of the Auditor General (Section 10.554(1)(i)3.) require that we address in the management letter any findings and recommendations to improve financial management, accounting procedures, and internal controls. In connection with our audit, we did not have any such findings.
ONE TAMPA CITY CENTER • SUITE 2600 • 201 N. FRANKLIN STEET • P. O. BOX 172359 • TAMPA, FLORIDA 33672 • 813- 875-7774 FAX 813-874-6785
Member American Institute of Certified Public Accountants Florida Institute of Certified Public Accountants
Cesar J. Rivero Sam A. Lazzara Richard Gordimer Stephen G. Douglas Herman V. Lazzara Michael E. Helton Marc D. Sasser
82

The Rules of the Auditor General (Section 10.554(1)(i)4.), requires that we address violations of provisions of contracts or grant agreements, or abuse, that have an effect on the financial statements that is less than material but more than inconsequential. In connection with our audit, we did not have any such findings.
The Rules of the Auditor General (Section 10.554(1)(i)5.), requires, based on professional judgment, the reporting of the following matters that are inconsequential to the financial statements, considering both quantitative and qualitative factors: (1) violations of laws, rules, regulations, and contractual provisions or abuse that have occurred, or were likely to have occurred, and would have an immaterial effect on the financial statements; (2) improper expenditures or illegal acts that would have an immaterial effect on the financial statements; and (3) control deficiencies that are not significant deficiencies, including, but not limited to; (a) improper or inadequate accounting procedures (e.g., the omission of required disclosures from the financial statements); (b) failures to properly record financial transactions; and (c) other inaccuracies, shortages, defalcations, and instances of fraud discovered by, or that come to the attention of the auditor. In connection with our audit, we did not have any such findings.
The Rules of the Auditor General (Section 10.554 (1)(i)(6.) also require that the name or official title and legal authority for the primary government and each component unit of the reporting entity be disclosed in the management letter, unless disclosed in the notes to the financial statements. The required information is disclosed in the Notes to General Purpose Financial Statements (see Note A - Organization and Reporting Entity).
As required by the Rules of the Auditor General (Section 10.554(1)(i)7.a), a statement must be included as to whether or not the local government entity has met one or more of the conditions described in Section 218.503(1), Florida Statutes, regarding financial emergencies. In connection with our audit, we determined that the Port Authority is not in a state of financial emergency as a consequence of the conditions described in Section 218.503(1), Florida Statutes.
As required by the Rules of the Auditor General (Sections 10.554(1)(i)7.b.), we determined that the annual financial report for the Port Authority for the fiscal year ended September 30, 2009, filed with the Department of Banking Finance pursuant to Section 218.32(1)(a), Florida Statutes, is in agreement with the annual financial audit report for the fiscal year ended September 30, 2009.
As required by the Rules of the Auditor General (Sections 10.554(1)(i)7.c.), and 10.556(7)), we applied financial condition assessment procedures. It is management's responsibility to monitor the entity's financial condition, and our financial condition assessment was based in part on representations made by management and the review of financial information provided by same.
Pursuant to Chapter 119, Florida Statues, this management letter is a public record and its distribution is not limited. Auditing standards generally accepted in the United States of America require us to indicate that this letter is intended solely for the information and use of management, and the Florida Auditor General, and is not intended to be and should not be used by anyone other these specified parties.
Tampa, Florida January 19, 2010
83
