hinode “a new solar observatory in space” - terrapub · hinode optical telescope has a large...
TRANSCRIPT
ClimateandWeatherof theSun-EarthSystem(CAWSES):SelectedPapers fromthe2007KyotoSymposium,Edited by T. Tsuda, R. Fujii, K. Shibata, and M. A. Geller, pp. 63–75.c© TERRAPUB, Tokyo, 2009.
Hinode “a new solar observatory in space”
Saku Tsuneta1, Louise K. Harra2, and Satoshi Masuda3
1National Astronomical Observatory, JapanE-mail: [email protected]
2Mullard Space Science Laboratory, University College London, UK3Solar-Terrestrial Environment Laboratory, Nagoya University, Japan
Since its launch in September 2006, the Japan-US-UK solar physics satellite, Hin-ode, has continued its observation of the sun, sending back solar images of unprece-dented clarity every day. Hinode is equipped with three telescopes, a visible lighttelescope, an X-ray telescope, and an extreme ultraviolet imaging spectrometer. TheHinode optical telescope has a large primary mirror measuring 50 centimeters in di-ameter and is the world’s largest space telescope for observing the sun and its vectormagnetic fields. The impact of Hinode as an optical telescope on solar physics iscomparable to that of the Hubble Space Telescope on optical astronomy. While theoptical telescope observes the sun’s surface, the Hinode X-ray telescope captures im-ages of the corona and the high-temperature flares that range between several millionand several tens of millions of degrees. The telescope has captured coronal structuresthat are clearer than ever. The Hinode EUV imaging spectrometer possesses approx-imately ten times the sensitivity and four times the resolution of a similar instrumenton the SOHO satellite. The source of energy for the sun is in the nuclear fusion reac-tion that takes place at its core. Here temperature drops closer to the surface, wherethe temperature measures about 6,000 degrees. Mysteriously, the temperature startsrising again above the surface, and the temperature of the corona is exceptionallyhigh, several millions of degrees. It is as if water were boiling fiercely in a kettleplaced on a stove with no fire, inconceivable as it may sound. The phenomenonis referred to as the coronal heating problem, and it is one of the major astronom-ical mysteries. The Hinode observatory was designed to solve this mystery. It isexpected that Hinode would also provide clues to unraveling why strong magneticfields are formed and how solar flares are triggered. An overview on the initial re-sults from Hinode is presented. Dynamic video pictures captured by Hinode can beviewed on the website of the National Astronomical Observatory of Japan (NAOJ) athttp://hinode.nao.ac.jp/index e.shtml.
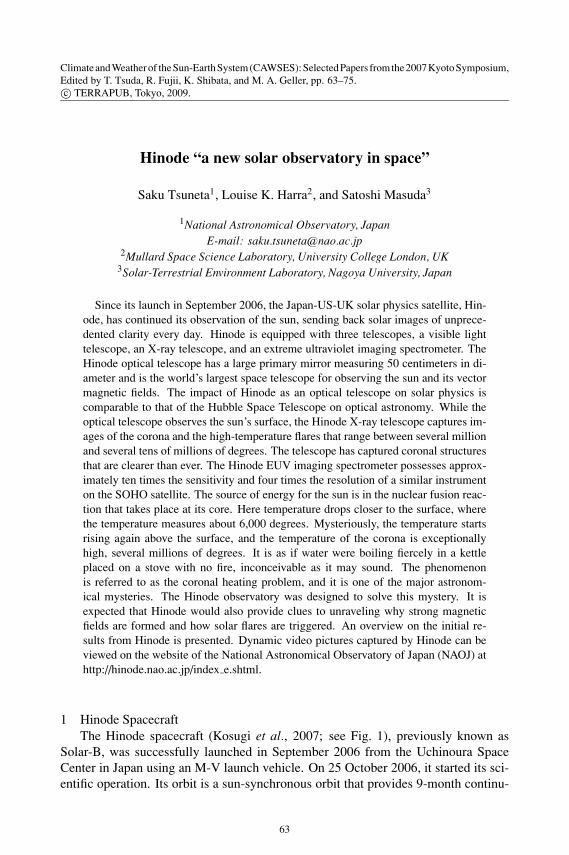
1 Hinode SpacecraftThe Hinode spacecraft (Kosugi et al., 2007; see Fig. 1), previously known as
Solar-B, was successfully launched in September 2006 from the Uchinoura SpaceCenter in Japan using an M-V launch vehicle. On 25 October 2006, it started its sci-entific operation. Its orbit is a sun-synchronous orbit that provides 9-month continu-
63

64 S. Tsuneta et al.
Fig. 1. Image of the Hinode spacecraft in orbit. (Courtesy of NAOJ, JAXA, and NASA.)
ous observations. It comprises an observatory style set of instruments that functiontogether with the aim of answering the following mission science goals:
• To understand the process of magnetic field generation and transport.
• To investigate the processes responsible for energy transfer from the photo-sphere to the corona.
• To determine the mechanisms responsible for eruptive phenomena such asflares and coronal mass ejections.
Hinode is designed to answer the fundamental question of how magnetic fields areformed and how they interact with the atmosphere to create the activity that we ob-serve on the sun. This subsequently addresses all phenomena that have an impacton the Sun-Earth system, such as the formation of the solar winds (both slow andfast), triggering of flares and coronal mass ejections, formation and maintenance offilaments and prominences. This review summarizes how the new results from Hin-ode are addressing these critical questions as well as probing fundamental physicalprocesses that will have applications in many other scenarios across the universe.
There are three instruments onboard Hinode, the Solar Optical Telescope (SOT),the X-ray Telescope (XRT), and the EUV Imaging Spectrometer (EIS), each mea-suring critical parts of the sun’s atmosphere from the surface (photosphere) to thechromosphere, the transition region and finally the outer and hottest part of the atmo-sphere, the corona.1.1 The Solar Optical Telescope (SOT)
SOT is the first large optical telescope flown in space to observe the sun (Tsunetaet al., 2008a). It has an aperture of 50 cm and achieves an angular resolution of 0.25′′
(175 km on the sun) covering a wavelength range from 480–650 nm. It consists of
Hinode “A New Solar Observatory in Space” 65
2 components, the Optical Telescope Assembly (OTA: Suematsu et al., 2008) andthe Focal Plane Package (FPP). The FPP includes the narrow-band (NFI) and thewide-band (BFI) filtergraphs and the Stokes spectropolarimeter (SP). This complexinstrument allows measurements of the magnetic field both in the longitudinal andtransverse directions, Doppler shifts, and imaging in the range from the low photo-sphere through to the chromosphere very accurately under precise calibration (Ichi-moto et al., 2008).1.2 The X-ray Telescope (XRT)
XRT is an advanced solar X-ray telescope (Golub et al., 2007; Kano et al., 2008)with the highest angular resolution of 2′′. It is a Wolter Type III grazing incidencetelescope that uses 2 reflections to focus soft X-rays onto a CCD array. It can provideboth full sun and partial disk images. Filters ranging in thickness by a factor of 10,000provide a huge dynamic range able to measure very weak features in coronal holesand very large flares. The temperature range extends from 1 million K to 30 millionK. This temperature range is much wider than that of the soft X-ray Telescope onboard Yohkoh.1.3 The EUV Imaging Spectrometer (EIS)
EIS is an imaging spectrometer (Culhane et al., 2007) built by a consortium con-sisting of UCL-MSSL, RAL, NRL, GSFC, UiO, and NAOJ. EIS was designed toprobe the dynamics and composition of the solar atmosphere with a spatial resolutionof 1′′. For observations, it uses two EUV wave-bands which were chosen to measureplasma with temperatures ranging from 50,000 K to 20 million K. EIS is a flexibleinstrument with the ability to measure high-resolution spectra along with imagingachieving velocity resolutions of several km/s, and it can also observe fast cadence(seconds) monochromatic images. The two wave-bands cover a total of 90 A contain-ing at least 500 spectral lines of which 55% are identified to come from previouslyknown atomic transitions (Brown et al., 2007).
In the following sections, highlights of the new results from Hinode during itsinitial operational phase are introduced.
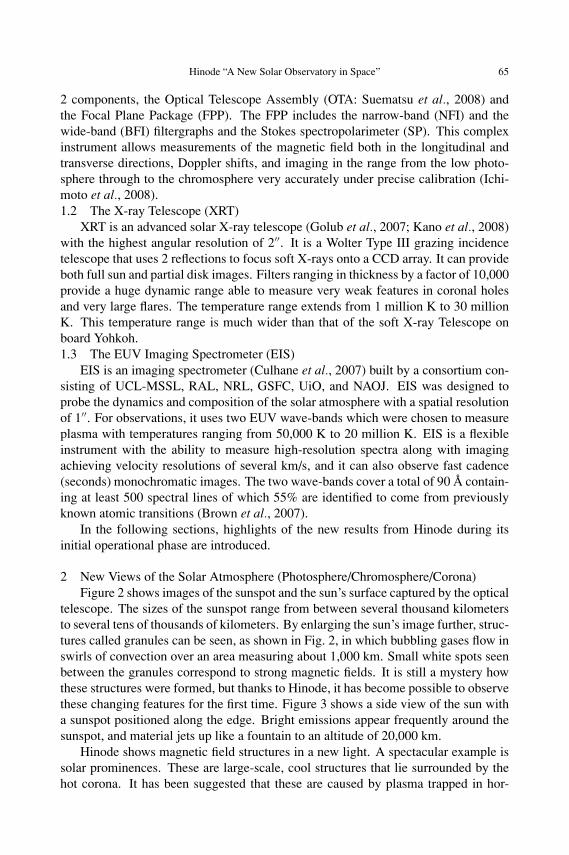
2 New Views of the Solar Atmosphere (Photosphere/Chromosphere/Corona)Figure 2 shows images of the sunspot and the sun’s surface captured by the optical
telescope. The sizes of the sunspot range from between several thousand kilometersto several tens of thousands of kilometers. By enlarging the sun’s image further, struc-tures called granules can be seen, as shown in Fig. 2, in which bubbling gases flow inswirls of convection over an area measuring about 1,000 km. Small white spots seenbetween the granules correspond to strong magnetic fields. It is still a mystery howthese structures were formed, but thanks to Hinode, it has become possible to observethese changing features for the first time. Figure 3 shows a side view of the sun witha sunspot positioned along the edge. Bright emissions appear frequently around thesunspot, and material jets up like a fountain to an altitude of 20,000 km.
Hinode shows magnetic field structures in a new light. A spectacular example issolar prominences. These are large-scale, cool structures that lie surrounded by thehot corona. It has been suggested that these are caused by plasma trapped in hor-
66 S. Tsuneta et al.
50,
000
km
size
of
the
eart
h
Fig.
2.Su
nspo
ton
the
sun’
ssu
rfac
eca
ptur
edby
the
optic
alte
lesc
ope
onbo
ard
Hin
ode.
The
obse
rvat
ions
wer
em
ade
ata
wav
elen
gth
of46
0nm
.(T
heco
lors
inth
eim
age
have
been
artifi
cial
lyen
hanc
edan
ddi
ffer
from
the
actu
alco
lors
.)C
onve
ctio
nca
lled
gran
ules
can
bese
enin
the
phot
osph
ere
(rig
ht).
Smal
lsp
ots
betw
een
the
conv
ectio
nce
llsar
em
agne
ticel
emen
ts(t
hem
inim
umun
itof
am
agne
ticfie
ld)
that
have
anex
cept
iona
llyst
rong
mag
netic
field
.(C
ourt
esy
ofN
AO
J,JA
XA
,and
NA
SA.)

Hinode “A New Solar Observatory in Space” 67
Fig. 3. Dynamic solar activities around the sunspot as seen through the optical telescope; substancesof temperatures of several tens of thousands of degrees are being sprayed into the solar atmosphere.(Courtesy of NAOJ, JAXA, and NASA.)
izontal magnetic field-line configurations. Observations show horizontal threads ofplasma which have oscillatory behavior with periods around 170s which is consis-tent with Alfven wave propagation which may possibly heat the surrounding corona(Okamoto et al., 2007). What comes as a surprise is that these threads show darkupward flows that are turbulent and move at speeds of 20 km/s (Berger et al., 2008).The existence of these flows is a real challenge to the current MHD understanding ofprominences as they are inconsistent with the idea of a low-Beta (where Beta is theratio of gas to magnetic pressure) plasma lying in horizontal magnetic fields.
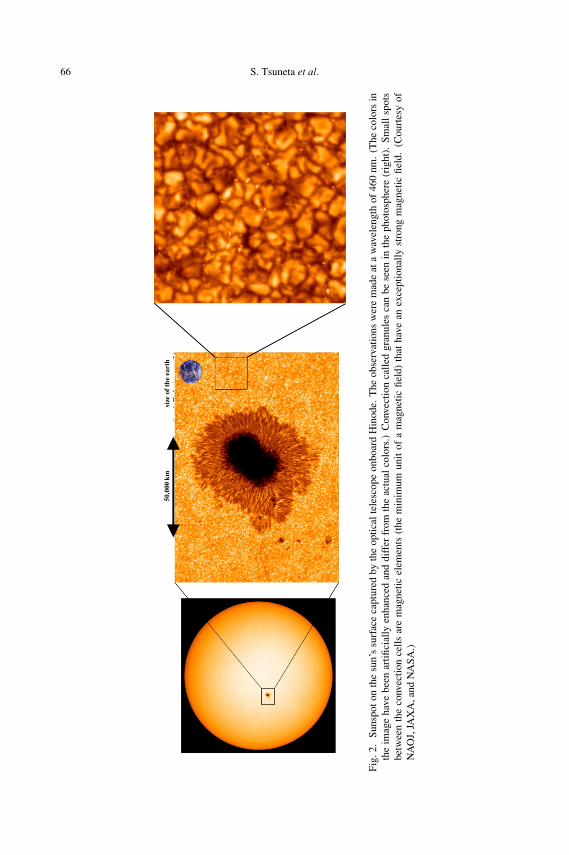
While the optical telescope observes the photosphere/chromosphere, the X-raytelescope captures images of the corona and the high-temperature flares that rangefrom between several million and several tens of millions of degrees. The telescopehas achieved the greatest spatial resolution in history, and it has captured coronalstructures that are clearer than ever. The sun viewed through the X-ray (Fig. 4) iscompletely different from that seen in the visible light range. The area around thesunspot, where the strong magnetic fields exist, is referred to as an active region,from which X-rays further radiate. Many stripes can be seen around the active region,which represent the magnetic lines of force that spread upward from the photosphere.
The source of energy for the sun is in the nuclear fusion reaction that takes placeat its core. The temperature drops closer to the surface where the temperature mea-sures about 6,000 degrees. Mysteriously, the temperature starts rising again abovethe surface and the temperature of the corona is exceptionally high at several millionsof degrees. This is the so-called coronal heating problem, and it is one of the majorastronomical mysteries involving something of a lower temperature being able to heatsomething of a higher temperature.
There is now the possibility that the results of the observations of Hinode may be
68 S. Tsuneta et al.
Fig. 4. X-ray images of the entire solar surface photographed by the X-ray telescope onboard Hinode. Apunctuate structure called an X-ray bright point was identified for the first time, which revealed that thecorona is made up of magnetic loops. (Courtesy of NAOJ, JAXA, and NASA.)
used to solve the problem. Hinode has revealed there are strong magnetic fields andstrong corona activity in areas without the sunspot. Sources of X-rays are scatteredhere and there on the photosphere, and it still remains a mystery as to how theywere formed. Scientists expect to understand the solar corona heating mechanism bycomparing such information with information on the magnetic fields obtained by theoptical telescope. The current hypothesis is that there are areas on the photospherewhere there is a strong magnetic field, and the corona is being vigorously heated bythe magnetic energy. An explanation of the specific mechanism is now anticipated.In the near future, there may also be clues to unraveling why such strong magneticfields are formed and how solar flares are generated.
EIS has the capability of obtaining physical information of the coronal plasma,such as temperature, density, and velocity. Broad EUV emission lines might corre-spond to some turbulent or non-thermal processes critical to understand energy trans-fer, for example, coronal heating. The fact that the most turbulent regions which wehave been studying for decades can actually be seen outside the bright loops has hugeimplications on how the atmosphere of the sun is heated and sustained. The processesthat make loops bright may not actually be the key to understanding the atmosphereas a whole. This is also seen in the quiet corona where weak emission regions havemeasured outflows of 100 km/s (Dere et al., 2007). Another discovery is that the
Hinode “A New Solar Observatory in Space” 69
density of very weak emission regions can be high, which suggests that the observedactive region is surrounded by weakly emitting high-density loops. The weak regionsoften show large line widths in the EUV spectral lines (Doschek et al., 2007).
3 Alfven Waves and Solar Wind SourceThe activity on the sun is known to be driven by the magnetic fields that are
prevalent everywhere. Hinode has higher temporal, spatial and velocity resolutionthan any satellite previously and is probing wavelength regimes that have never hadsuch continuous time coverage available. This has allowed us to measure waves inthe atmosphere in a way we have been unable to do before. In 1947 Alfven predictedthe existence of magnetic waves caused by the constant movement due to convectionon the surface of the sun. The convection disturbs the magnetic fields causing wavesand may then be damped in the corona providing an energy source that may createenough heating for the atmosphere and energy to accelerate the solar wind. Attemptsto measure Alfven waves have been ambiguous in previous missions, but Hinodenow appears to be opening the door to these waves being observed in many differentcircumstances.
The chromosphere is highly structured as can be seen in Fig. 2. At the solar limb,spiky features known as spicules are seen in abundance. Now with Hinode, observa-tions can be made continuously without being concerned about seeing conditions as isthe case with ground-based telescopes. De Pontieu et al. (2007a) have analyzed thesespicules and found that there are two types. The first type is formed when global os-cillations and convective flows leak into the atmosphere causing shocks. These havetimescales of minutes and show persistent upward and downward motions. The typeII spicules (named straws) have lifetimes of seconds, are much thinner and moveplasma at speeds of over 100 km/s. These seem to be related directly to the mag-netic reconnection process. However both types of spicules show a swaying behaviorstrongly indicative of Alfven waves. They show amplitudes and periods that areconsistent with simulations of the generation, propagation and dissipation of Alfvenwaves from the photosphere to Earth orbit (De Pontieu et al., 2007b), and they haveenough energy to power the solar wind.
Jets of collimated, hot plasma have been observed for many years on the sun.These can occur in the active region loops that lie above sunspot groups or withinthe coronal holes. One explanation of the formation of jets involves a scenario inwhich emerging flux from below the surface interacts with coronal holes. Hinodenow has the ability to observe jets in significantly more detail to study basic physicalprocesses (Shimojo et al., 2007). Jets in coronal holes have been observed to havespeeds of 200 km/s. However, a new component that occurs at the beginning ofthe jet formation has been discovered, high speed, reaching 800 km/s, close to theAlfven speed in the corona (Cirtain et al., 2007). The characteristics of these jets areconsistent with plasma being ejected at the Alfven speed during a relaxation periodfollowing magnetic reconnection. These small jets carry as much as a tenth of themass necessary for the solar wind.
The sun supplies a huge amount of plasma into interplanetary space as solar wind.
70 S. Tsuneta et al.
Fig.
5.T
heri
ght
hand
side
show
sa
full
sun
XR
Tim
age
with
the
box
show
ing
the
EIS
FOV
.T
hele
ftE
ISim
age
isth
ein
tens
ityan
dth
eri
ght
imag
eis
the
Dop
pler
velo
city
.T
hebl
uear
row
show
sth
eso
urce
ofth
est
rong
est
outfl
ow(i
.e.,
from
Saka
oet
al.,
Con
tinuo
usPl
asm
aO
utflo
ws
from
the
Edg
eof
aSo
lar
Act
ive
Reg
ion
asa
Poss
ible
Sour
ceof
Sola
rW
ind,
Scie
nce,
318,
1585
–158
8,20
07,r
epri
nted
with
perm
issi
onfr
omA
AA
S;H
arra
etal
.,20
08,r
epro
duce
dby
perm
issi
onof
the
AA
S).
Hinode “A New Solar Observatory in Space” 71
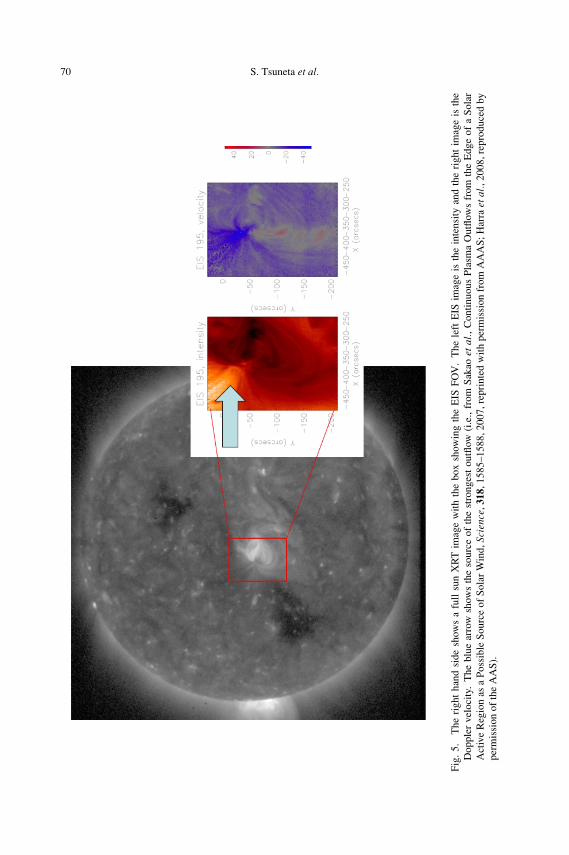
Fig. 6. South polar view of the magnetic field strength taken at 12:02:19–14:55:48 UT on 16 March 2007.The original observing field of view is 327.52′′ (east-west) by 163.84′′ (north-south) and was convertedto a map seen from above the south pole. East is to the left, west is to the right, and the observation wascarried out from the top down. Spatial resolution is lost near the extreme limb (i.e., near the bottom ofthe figure). The field of view for the line-of-sight direction (163.84′′) expands to 472.96′′ as a result ofcorrection for foreshortening. The pixel size is 0.16′′. Latitudinal lines for 85◦, 80◦, 75◦, and 70◦ areshown as large circles, while the plus sign marks the south pole. The magnetic field strength is obtainedfor pixels meeting a given threshold. (From Tsuneta et al. (2008b). Reproduced by permission of theAAS.)
It is well known that the solar wind consists of two components, a fast solar windthat comes from predominantly coronal holes that have open magnetic fields, and aslow solar wind that comes from other open magnetic fields, such as the boundaryof large-scale coronal holes and small-scale coronal holes even though its source hasbeen debated for many years. Alfven waves as mentioned above are also critical forsolar wind formation. However, in this paper we focus on the source of solar wind.
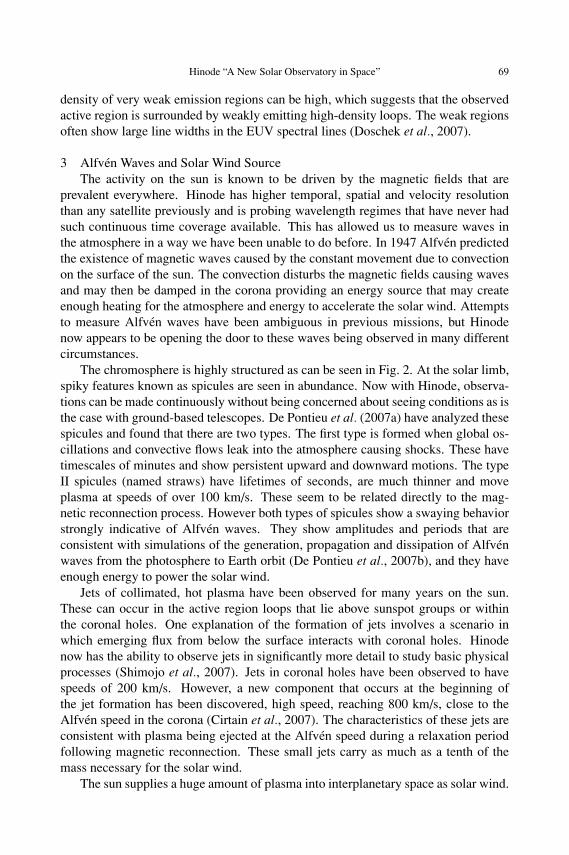
The slow solar wind has fluctuating speeds between 200–500 km/s. XRT hasobserved persistent and steady flows directly at the edges of active regions (Sakao etal., 2007) with speeds of over 100 km/s that persist for days. The mass loss rate wasestimated to be 25% of the slow solar wind. Using EIS alongside this dataset, thereal Doppler flows can be then observed. Figure 5 shows the XRT image for contextalongside the EIS data. The EIS data show the intensity of the corona on the left-handside. Now for the first time, the Doppler velocities can also be observed (on the righthand side of Fig. 5). The region of weakest emission at the top of the active regionshows the strongest velocities (Harra et al., 2008). Probing the magnetic field shows
72 S. Tsuneta et al.
that this region is highly extended, most likely open fields caused by reconnectionwith a much smaller active region to the west of the one studied. These large-scalereconnections are of significant importance when aiming to understand the slow solarwind.
We have also new observations related to a fast solar wind. Tsuneta et al. (2008b)reported SOT observations of the magnetic landscape of the polar region of the sunwith an extremely high spatial resolution and high polarimetric precision. Usinga Milne-Eddington inversion, it was found that many vertically oriented magneticflux tubes with field strengths as strong as 1 kG were scattered in latitude between70◦ and 90◦ (Fig. 6). They all have the same polarity, consistent with the globalpolarity of the polar region. The field vectors have been observed to diverge fromthe centers of the flux elements, consistent with a view of magnetic fields that areexpanding and fanning out with height. The polar region has also been found to haveubiquitous horizontal fields. The polar regions are the source of the fast solar wind,which is channeled along unipolar coronal magnetic fields whose photospheric sourceis evidently rooted in the strong-field, vertical patches of flux. We conjecture thatvertical flux tubes with large expansion around the photospheric-coronal boundaryserve as efficient chimneys for Alfven waves that accelerate the solar wind.
4 Solar Flare: 13 November 2006 EventAlso observed on the surface of the sun are explosive phenomena called solar
flares that last for several minutes to several hours and the eruption of substancesreferred to as high-speed jets caused by the explosions. A magnetic field controls theactivities in the corona, and large explosions take place frequently near the sunspotwhere magnetic field lines are in close proximity.
Although the sun is now in at the minimum of its activity level, we are still oc-casionally treated to an active region which produces solar flares. Such a regionappeared in December 2006 just after the Hinode scientific operation started. Daysbefore the large X-flare on 13 December 2006, the active region had been monitored.There was a large negative polarity sunspot, and to the south of it emerged a smallerpositive polarity sunspot. Over the days of this evolution, the smaller sunspot rotateddramatically, colliding into the pre-existing sunspot (Kubo et al., 2007). The impacton the corona above of this shearing motion could be seen (Su et al., 2007). Justas the smaller sunspot was emerging, the coronal loops were lying perpendicular tothe inversion line (marking out the separation between positive and negative polar-ity). At this stage the loops were essentially potential with little stored energy. By12 December 2006, the story was completely different. At this stage the new sunspothad been emerging and rotating at the surface, dragging the field lines around, andcausing the magnetic loops to become so sheared that they were now lying parallelto the inversion line. A few hours after this, a huge X-class flare took place there.Figure 7 shows an image of a gigantic flare captured by Hinode, which stretches toseveral tens of thousands of kilometers. Even more dynamic video pictures capturedby Hinode can be viewed on the website of the National Astronomical Observatoryof Japan (NAOJ) at http://hinode.nao.ac.jp/index e.shtml.

Hinode “A New Solar Observatory in Space” 73
Fig. 7. Large solar flare captured by SOT on 13 December 2006. Two-Ribbon structure and some ofpost-flare loops between the two ribbons are clearly seen. (Courtesy of NAOJ, JAXA, and NASA.)
During this X-class flare, we measured directly for the first time what part of theatmosphere erupted away from the sun. Imada et al. (2007) analyzed the flare on13 December 2006 and found that the strongest outflows were away from the mainflare site. The force of the flare had ripped off some of the plasma from the sun.Interestingly, there seems to be a strong relationship between this outflow and thetemperature of the plasma. The strongest outflows are from the hottest plasma whichprovides a constraint to the mechanism that forms this fast component to the solarwind. Speeds of 1000 km/s were measured at ACE from this event.
The sun is currently in a period of minimum activity. Solar flares will start tooccur more frequently as the sun heads toward its period of maximum activity around2012, when it will then undergo a transformation that will make it appear as a differentstar. Hinode is sure to change fundamentally the academic perspectives on solar ob-servation through the analysis of clear and high-resolution images and spectroscopicdata during the period of maximum activity that received for the first time.
Acknowledgments. The author expresses sincere thanks to the ISAS/JAXA Solar-B launchteam for their exceptional achievement. Hinode is a Japanese mission developed and launchedby ISAS/JAXA, collaborating with NAOJ as a domestic partner and NASA and STFC (UK) asinternational partners.
ReferencesBerger, T. E., R. A. Shine, G. L. Slater, T. D. Tarbell, A. M. Title, T. J. Okamoto, K. Ichimoto, Y. Kat-
sukawa, Y. Suematsu, S. Tsuneta, B. W. Lites, and T. Shimizu, Hinode SOT Observations of SolarQuiescent Prominence Dynamics, Astrophys. J., 676, L89–L92, 2008.
Brown, C. M., H. Hara, S. Kamio, U. Feldman, J. F. Seely, G. A. Doschek, J. T. Mariska, C. M. Korendyke,J. Lang, K. P. Dere, L. Culhane, R. J. Thomas, and J. M. Davila, Wavelength Determination for SolarFeatures Observed by the EUV Imaging Spectrometer on Hinode, PASJ, 59, S865–S869, 2007.

74 S. Tsuneta et al.
Cirtain, J. W., L. Golub, L. Lundquist, A. van Ballegooijen, A. Savcheva, M. Shimojo, E. DeLuca, S.Tsuneta, T. Sakao, K. Reeves, M. Weber, R. Kano, N. Narukage, and K. Shibasaki, Evidence for AlfvenWaves in Solar X-ray Jets, Science, 318, 1580–1582, 2007.
Culhane, J. L., L. K. Harra, A. M. James, K. Al-Janabi, L. J. Bradley, R. A. Chaudry, K. Rees, J. A. Tandy,P. Thomas, M. C. R. Whillock, B. Winter, G. A. Doschek, C. M. Korendyke, C. M. Brown, S. Myers, J.Mariska, J. Seely, J. Lang, B. J. Kent, B. M. Shaughnessy, P. R. Young, G. M. Simnett, C. M. Castelli,S. Mahmoud, H. Mapson-Menard, B. J. Probyn, R. J. Thomas, J. Davila, K. Dere, D. Windt, J. Shea, R.Hagood, R. Moye, H. Hara, T. Watanabe, K. Matsuzaki, T. Kosugi, V. Hansteen, and Ø. Wikstol, TheEUV Imaging Spectrometer for Hinode, Sol. Phys., 243, 19–61, 2007.
De Pontieu, B., S. McIntosh, V. H. Hansteen, M. Carlsson, C. J. Schrijver, T. D. Tarbell, A. M. Title, R. A.Shine, Y. Suematsu, S. Tsuneta, Y. Katsukawa, K. Ichimoto, T. Shimizu, and S. Nagata, A Tale of TwoSpicules: The Impact of Spicules on the Magnetic Chromosphere, PASJ, 59, S655–S662, 2007a.
De Pontieu, B., S. W. McIntosh, M. Carlsson, V. H. Hansteen, T. D. Tarbell, C. J. Schrijver, A. M. Title,R. A. Shine, S. Tsuneta, Y. Katsukawa, K. Ichimoto, Y. Suematsu, T. Shimizu, and S. Nagata, Chromo-spheric Alfvenic Waves Strong Enough to Power the Solar Wind, Science, 318, 1574–1577, 2007b.
Dere, K. P., G. A. Doschek, J. T. Mariska, V. H. Hansteen, L. K. Harra, K. Matsuzaki, and R. J. Thomas,The Structure and Dynamics of the Quiet Corona from Observations with the Extreme Ultraviolet Imag-ing Spectrometer on Hinode, PASJ, 59, S721–S726, 2007.
Doschek, G. A., J. T. Mariska, H. P. Warren, C. M. Brown, J. L. Culhane, H. Hara, T. Watanabe, P. R.Young, and H. E. Mason, Nonthermal Velocities in Solar Active Regions Observed with the Extreme-Ultraviolet Imaging Spectrometer on Hinode, Astrophys. J., 667, L109–L112, 2007.
Golub, L., E. DeLuca, G. Austin, J. Bookbinder, D. Caldwell, P. Cheimets, J. Cirtain, M. Cosmo, P. Reid,A. Sette, M. Weber, T. Sakao, R. Kano, K. Shibasaki, H. Hara, S. Tsuneta, K. Kumagai, T. Tamura,M. Shimojo, J. McCracken, J. Carpenter, H. Haight, R. Siler, E. Wright, J. Tucker, H. Rutledge, M.Barbera, G. Peres, and S. Varisco, The X-Ray Telescope (XRT) for the Hinode Mission, Sol. Phys.,243, 63–86, 2007.
Harra, L. K., T. Sakao, C. H. Mandrini, H. Hara, S. Imada, P. R. Young, L. van Driel-Gesztelyi, and D.Baker, Outflows at the Edges of Active Regions: Contribution to Solar Wind Formation?, Astrophys. J.,676, L147–L150, 2008.
Ichimoto, K., B. Lites, D. Elmore, Y. Suematsu, S. Tsuneta, Y. Katsukawa, T. Shimizu, R. Shine, T. Tarbell,A. Title, J. Kiyohara, K. Shinoda, G. Card, A. Lecinski, K. Streander, M. Nakagiri, M. Miyashita, M.Noguchi, C. Hoffmann, and T. Cruz, Polarization Calibration of the Solar Optical Telescope onboardHinode, Sol. Phys., 249, 233–261, 2008.
Imada, S., H. Hara, T. Watanabe, S. Kamio, A. Asai, K. Matsuzaki, L. K. Harra, and J. T. Mariska,Discovery of a Temperature-Dependent Upflow in the Plage Region During a Gradual Phase of theX-Class Flare, PASJ, 59, S793–S799, 2007.
Kano, R., T. Sakao, H. Hara, S. Tsuneta, K. Matsuzaki, K. Kumagai, M. Shimojo, K. Minesugi, K.Shibasaki, E. E. DeLuca, L. Golub, J. Bookbinder, D. Caldwell, P. Cheimets, J. Cirtain, E. Dennis,T. Kent, and M. Weber, The Hinode X-Ray Telescope (XRT): Camera Design, Performance and Opera-tions, Sol. Phys., 249, 263–279, 2008.
Kosugi, T., K. Matsuzaki, T. Sakao, T. Shimizu, Y. Sone, S. Tachikawa, T. Hashimoto, K. Minesugi, A.Ohnishi, T. Yamada, S. Tsuneta, H. Hara, K. Ichimoto, Y. Suematsu, M. Shimojo, T. Watanabe, S.Shimada, J. M. Davis, L. D. Hill, J. K. Owens, A. M. Title, J. L. Culhane, L. K. Harra, G. A. Doschek,and L. Golub, The Hinode (Solar-B) Mission: An Overview, Sol. Phys., 243, 3–17, 2007.
Kubo, M., T. Yokoyama, Y. Katsukawa, B. Lites, S. Tsuneta, Y. Suematsu, K. Ichimoto, T. Shimizu,S. Nagata, T. D. Tarbell, R. A. Shine, A. M. Title, and D. Elmore, Hinode Observations of a VectorMagnetic Field Change Associated with a Flare on 2006 December 13, PASJ, 59, S779–S784, 2007.
Okamoto, T. J., S. Tsuneta, T. E. Berger, K. Ichimoto, Y. Katsukawa, B. W. Lites, S. Nagata, K. Shibata,T. Shimizu, R. A. Shine, Y. Suematsu, T. D. Tarbell, and A. M. Title, Coronal Transverse Magnetohy-drodynamic Waves in a Solar Prominence, Science, 318, 1577–1580, 2007.
Sakao, T., R. Kano, N. Narukage, J. Kotoku, T. Bando, E. E. DeLuca, L. L. Lundquist, S. Tsuneta, L. K.Harra, Y. Katsukawa, M. Kubo, H. Hara, K. Matsuzaki, M. Shimojo, J. A. Bookbinder, L. Golub, K. E.
Hinode “A New Solar Observatory in Space” 75
Korreck, Y. Su, K. Shibasaki, T. Shimizu, and I. Nakatani, Continuous Plasma Outflows from the Edgeof a Solar Active Region as a Possible Source of Solar Wind, Science, 318, 1585–1588, 2007.
Shimojo, M., N. Narukage, R. Kano, T. Sakao, S. Tsuneta, K. Shibasaki, J. W. Cirtain, L. L. Lundquist,K. Reeves, and A. Savcheva, Fine Structures of Solar X-Ray Jets Observed with the X-Ray Telescopeaboard Hinode, PASJ, 59, S625–S630, 2007.
Su, Y., L. Golub, A. Van Ballegooijen, E. E. DeLuca, K. K. Reeves, T. Sakao, R. Kano, N. Narukage, and K.Shibasaki, Evolution of the Sheared Magnetic Fields of Two X-Class Flares Observed by Hinode/XRT,PASJ, 59, S785–S791, 2007.
Suematsu, Y., S. Tsuneta, K. Ichimoto, T. Shimizu, M. Otsubo, Y. Katsukawa, M. Nakagiri, M. Noguchi, T.Tamura, Y. Kato, H. Hara, M. Kubo, I. Mikami, H. Saito, T. Matsushita, N. Kawaguchi, T. Nakaoji, K.Nagae, S. Shimada, N. Takeyama, and T. Yamamuro, The Solar Optical Telescope of Solar-B ( Hinode):The Optical Telescope Assembly, Sol. Phys., 249, 197–220, 2008.
Tsuneta, S., K. Ichimoto, Y. Katsukawa, S. Nagata, M. Otsubo, T. Shimizu, Y. Suematsu, M. Nakagiri, M.Noguchi, T. Tarbell, A. Title, R. Shine, W. Rosenberg, C. Hoffman, B. Jurcevich, G. Kushner, M. Levay,B. Lites, D. Elmore, T. Matsushita, N. Kawaguchi, H. Saito, I. Mikami, L. D. Hill, and J. K. Owens,The Solar Optical Telescope for the Hinode Mission: An Overview, Sol. Phys., 249, 167–196, 2008a.
Tsuneta, S., K. Ichimoto, Y. Katsukawa, B. W. Lites, K. Matsuzaki, S. Nagata, D. Orozco Suarez, T.Shimizu, M. Shimojo, R. A. Shine, Y. Suematsu, T. K. Suzuki, T. D. Tarbell, and A. M. Title, TheMagnetic Landscape of the Sun’s Polar Region, Astrophys. J., 688, 1374–1381, 2008b.