hispanicsandhealthcare intheunitedstates: access ... intheunitedstates: access, information and...
TRANSCRIPT

Hispanics and Health Carein the United States:Access, Information and Knowledge
A Joint Pew Hispanic Center and Robert WoodJohnson Foundation Research Report
Written by:Gretchen Livingston,Senior Researcher
Susan Minushkin,Deputy DirectorPew Hispanic Center
D’Vera Cohn,Senior Writer
Hispanics and Health Care in the United States: Access, Information and KnowledgeB
� TABLE OF CONTENTS
ACKNOWLEDGMENTS ......................................................................................1
FOREWORD.........................................................................................................3
OVERVIEW AND EXECUTIVE SUMMARY ...................................................4The Likelihood of Having a Usual Health Care Provider .......................................6
Profile of Persons Who Lack a Usual Health Care Provider..................................7
Quality of Health Care ........................................................................................8
Health Information Sources .................................................................................8
Diabetes Knowledge ...........................................................................................9
CHAPTER 1 – INTRODUCTION: HISPANICS AND CHRONICDISEASE IN THE U.S. .......................................................................................10
CHAPTER 2 – UTILIZATION OF A USUAL HEALTH CARE PROVIDERAND SATISFACTION WITH HEALTH CARE ...............................................13
Importance of Having a Usual Health Care Provider ..........................................14
The Likelihood of Having a Usual Health Care Provider .....................................15
Getting Care Outside of the U.S. ......................................................................18
Profile of Latinos Lacking a Usual Health Care Provider.....................................19
Why Don’t People Have a Usual Place for Health Care?....................................21
Folk Healing ......................................................................................................22
Quality of Health Care .......................................................................................22
CHAPTER 3 – SOURCES OF INFORMATION ON HEALTHAND HEALTH CARE .........................................................................................26
Where Do Hispanics Get Health Care Information? ...........................................26
Who Gets Information from the Medical Community? .......................................28
Who Gets Information from the Media?.............................................................30
Who Gets Health Information from the Media in Spanish, andWho Gets It in English? .....................................................................................32
CHAPTER 4 – HOW MUCH DO HISPANICS KNOW ABOUTDIABETES?.........................................................................................................35
Knowledge Differences by Demographic Group ................................................36
Knowledge Differences by Insurance Status andHealth Care Access ..........................................................................................39
Knowledge Differences by Sources of Information.............................................39
Composition of the Low-Scoring Group............................................................40
Diabetics’ Knowledge of Diabetes.....................................................................43
REFERENCES ......................................................................................................44
APPENDIX A: METHODOLOGY............................................................................45
APPENDIX B: DETAILED TABLES.........................................................................48

Hispanics and Health Care in the United States: Access, Information and Knowledge1
� ACKNOWLEDGMENTS
About the Pew Hispanic Center
Founded in 2001, the Pew Hispanic Center is a nonpartisan research organizationthat seeks to improve understanding of the U.S. Hispanic population and tochronicle Latinos’ growing impact on the nation. The Center does not takepositions on policy issues. It is a project of the Pew Research Center, anonpartisan “fact tank” in Washington, D.C., that provides information on theissues, attitudes and trends shaping America and the world. It is funded bythe Pew Charitable Trusts, a public charity based in Philadelphia.
The Pew Hispanic Center conducts and commissions studies on a wide range oftopics with the aim of presenting research that at once meets the most rigorousscientific standards and is accessible to the interested public. The Center alsoregularly conducts public opinion surveys that aim to illuminate Latino viewson a range of social matters and public policy issues. For more information,visit www.pewhispanic.org.
About the Robert Wood Johnson Foundation
The Robert Wood Johnson Foundation focuses on the pressing health and healthcare issues facing our country. As the nation’s largest philanthropy devotedexclusively to improving the health and health care of all Americans, theFoundation works with a diverse group of organizations and individuals toidentify solutions and achieve comprehensive, meaningful and timely change.For more than 35 years, the Foundation has brought experience, commitment,and a rigorous, balanced approach to the problems that affect the health andhealth care of those it serves. When it comes to helping Americans leadhealthier lives and get the care they need, we expect to make a difference inyour lifetime. For more information, visit www.rwjf.org.

Hispanics and Health Care in the United States: Access, Information and Knowledge2
� ACKNOWLEDGMENTS
This project would not have been possible without the intellectual leadership ofRoberto Suro, previously director of the Pew Hispanic Center and the project’sprincipal investigator, and the insightful comments and input of an exceptionalgroup of senior scholars who make up the project’s Scientific Advisory Groupand are experts in the field of health and health care research among Latinos.The Pew Hispanic Center and the Robert Wood Johnson Foundation areparticularly indebted to William Vega of the University of California, LosAngeles, project director of the Scientific Advisory Group, for his leadership andwisdom in identifying the important challenges and helping us overcome them.We are also grateful for the contribution of other members of the ScientificAdvisory Group: Margarita Alegria, Harvard University; Glorisa Canino,University of Puerto Rico; Jose Escarce, University of California, Los Angeles;Michael Rodriguez, University of California, Los Angeles; Ruben Rumbaut,University of California, Irvine; William Sribney, independent consultant;and Marta Tienda, Princeton University. We are also very appreciative of thework of Michael Rodriguez for his ability to help us move the project forward.In addition, RWJF would like to thank Anne Weiss and the Quality/EqualityTeam for advising on this project and understanding how these data caninform our work on reducing disparities; and Adam Coyne, Gina Ivey andHope Woodhead for their contributions to the development, productionand dissemination of the findings.

Hispanics and Health Care in the United States: Access, Information and Knowledge3
� FOREWORD
The Hispanic population in the United States has more than doubled in size inthe past 15 years and is now estimated to have reached 45 million. This rapidexpansion, combined with the increasing heterogeneity of the nationalitiescomposing the Hispanic population, underlines the need for up-to-date, accurateinformation on Hispanics that takes into account their growing diversity.
Health care is one realm where such information is especially critical. When itcomes to Latinos, what may appear to be the well-known effects of socio-economic inequality on health care may also be conditioned by unique social,cultural and economic circumstances confronting both Hispanic immigrantsand Hispanics born in the United States.
With the heterogeneity of the Latino population in mind, the Robert WoodJohnson Foundation and the Pew Hispanic Center designed this survey toprovide up-to-date, accurate information on Hispanics and health care in theUnited States. This report focuses on how the diverse characteristics of theLatino population influence their health information needs, their help-seekingbehaviors, their access to health services, their perceptions of the quality ofhealth care, and their level of understanding of chronic disease.
The vast growth and the increasing diversity of the Hispanic population createa challenge for improving public health interventions and reducing medical caredisparities. This report seeks to address that challenge by providing informationthat we hope will be of use to policy-makers, the medical and public healthcommunities, and the media.
Susan Minushkin, Ph.D. Debra Perez, Ph.D., M.P.A., M.A.Deputy Director Senior Program OfficerPew Hispanic Center Robert Wood Johnson Foundation
Hispanics and Health Care in the United States: Access, Information and Knowledge4
� OVERVIEW AND EXECUTIVE SUMMARY
Overview
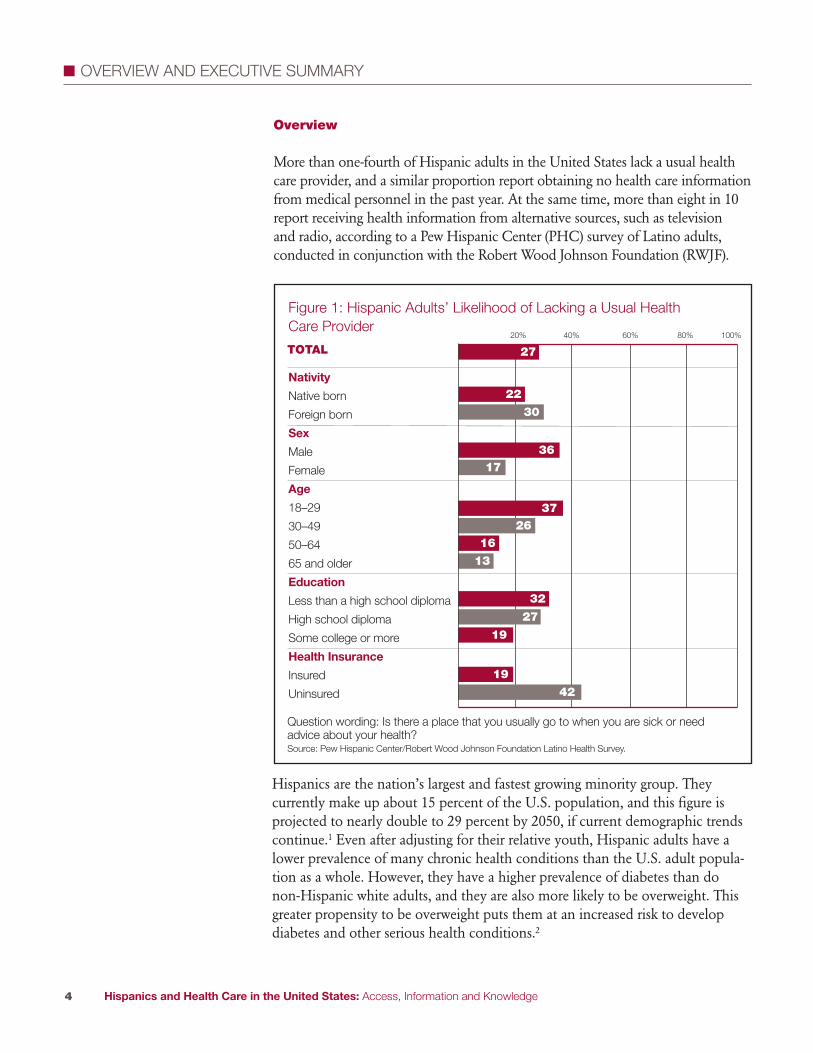
More than one-fourth of Hispanic adults in the United States lack a usual healthcare provider, and a similar proportion report obtaining no health care informationfrom medical personnel in the past year. At the same time, more than eight in 10report receiving health information from alternative sources, such as televisionand radio, according to a Pew Hispanic Center (PHC) survey of Latino adults,conducted in conjunction with the Robert Wood Johnson Foundation (RWJF).
Hispanics are the nation’s largest and fastest growing minority group. Theycurrently make up about 15 percent of the U.S. population, and this figure isprojected to nearly double to 29 percent by 2050, if current demographic trendscontinue.1 Even after adjusting for their relative youth, Hispanic adults have alower prevalence of many chronic health conditions than the U.S. adult popula-tion as a whole. However, they have a higher prevalence of diabetes than donon-Hispanic white adults, and they are also more likely to be overweight. Thisgreater propensity to be overweight puts them at an increased risk to developdiabetes and other serious health conditions.2
Figure 1: Hispanic Adults’ Likelihood of Lacking a Usual HealthCare Provider
Nativity
Native born
Foreign born
Sex
Male
Female
Age
18–29
30–49
50–64
65 and older
Education
Less than a high school diploma
High school diploma
Some college or more
Health Insurance
Insured
Uninsured
20% 40% 60% 80% 100%
22
27
36
16
13
32
19
27
19
42
17
3726
30
TOTAL
Question wording: Is there a place that you usually go to when you are sick or needadvice about your health?Source: Pew Hispanic Center/Robert Wood Johnson Foundation Latino Health Survey.
Hispanics and Health Care in the United States: Access, Information and Knowledge5
�
Previous research by the U.S. Centers for Disease Control and Prevention hasshown that Hispanics are twice as likely as non-Hispanic blacks and three timesas likely as non-Hispanic whites to lack a regular health care provider.3 Hispanicsare a diverse community, and the Pew Hispanic Center/Robert Wood JohnsonFoundation Latino Health survey of 4,013 Hispanic adults explores not onlytheir access to health care, but also their sources of health information and theirknowledge about a key disease (diabetes) at greater depth and breadth than anynational survey done to date by other research organizations or the federalgovernment.
It finds that among Hispanic adults, the groups least likely to have a usual healthcare provider are men, the young, the less educated, and those with no healthinsurance. A similar demographic pattern applies to the non-Hispanic adultpopulation. The new survey also finds that foreign-born and less-assimilatedLatinos—those who mainly speak Spanish, who lack U.S. citizenship, or whohave been in the United States for a short time—are less likely than other Latinosto report that they have a usual place to go for medical treatment or advice.
Nevertheless, a significant share of Hispanics with no usual place to go formedical care are high school graduates (50 percent), were born in the UnitedStates (30 percent) and have health insurance (45 percent). Indeed, the primaryreason that survey respondents give for lacking a regular health care provider isnot related to the cost of health care or assimilation. Rather, when asked aboutwhy they lack a usual provider, a plurality of respondents (41 percent) say theprincipal reason is that they are seldom sick.
As for sources of health information, about seven in 10 Latinos (71 percent)report that they received information from a doctor in the past year. An equalproportion report obtaining health information through their social networks,including family, friends, churches, and community groups. An even largershare (83 percent) report that they obtained health information from somebranch of the media, with television being the dominant source.
Not only are most Latinos obtaining information from media sources, but asizeable proportion (79 percent) say they are acting on this information. It isbeyond the scope of this report to assess the accuracy and usefulness of healthinformation obtained from non-medical sources, but the survey findings clearlydemonstrate the power and potential of these alternative outlets to disseminatehealth information to the disparate segments of the Latino population.

Hispanics and Health Care in the United States: Access, Information and Knowledge6
�
Regarding the quality of the health care they receive, Latinos are generally pleased,according to the survey. Among Latinos who have received health care in the pastyear, 78 percent rate that care as good or excellent. However, almost one in fourwho received health care in the past five years reported having received poorquality medical treatment. Those who believed that the quality of their medicalcare was poor attribute it to their financial limitations (31 percent), their race orethnicity (29 percent), or the way they speak English or their accent (23 percent).
The PHC/RWJF survey also asked respondents a battery of eight knowledgequestions about diabetes, a condition that afflicts an estimated 9.5 percent ofLatino adults, compared with 8.7 percent of non-Latino whites.4* Nearly six in10 respondents (58 percent) answered at least six of the eight diabetes questionscorrectly. Better educated and more assimilated Latinos scored better, as didthose with a usual health care provider.
These findings are from a bilingual telephone survey of a nationally representa-tive sample of 4,013 Hispanic adults conducted from July 16, 2007 throughSeptember 23, 2007. The survey’s margin of error is +/- 1.83 (see Appendix Afor a full description of the survey methodology). Among the key findings:
The Likelihood of Having a Usual Health Care Provider
� Some 73 percent of Latino adults report having a usual place where they seekmedical help or advice, while 27 percent have no usual health care provider.
� As in the general population, males, the young, and the less educated are lesslikely to have a usual health care provider.• 36 percent of men lack a usual provider, compared with 17 percent of women.
* These figures represent the overall prevalence of diabetes. For age-adjusted statistics on the prevalenceof diabetes, see Table 1.
71
83
70
Figure 2: Hispanic Adults Receiving Information About Health and HealthCare in the Past Year, by Source of Information
20%
0
40%
60%
80%
100%
Medical professional Media Social networks
Source: Pew Hispanic Center/Robert Wood Johnson Foundation Latino Health Survey.

Hispanics and Health Care in the United States: Access, Information and Knowledge7
�
• 37 percent of persons ages 18–29 lack a regular place to obtain health care,compared with 13 percent of persons ages 65 or older.
• 32 percent of adults with less than a high school diploma lack access to aregular place for health care, compared with 19 percent of people with atleast some college education.
� Foreign-born and less assimilated Latinos are less likely than other Hispanicsto have a usual health care provider.• 30 percent of Latinos born outside of the 50 states lack a usual place forhealth care, compared with 22 percent of U.S.-born Latinos.
• 32 percent of Latinos who mainly speak Spanish lack a regular health careprovider, compared with 22 percent of Latinos who mainly speak English.
• 49 percent of Latinos who have lived in the United States for less than fiveyears lack a usual health care provider, compared with 21 percent of thosewho have lived in the United States for 15 years or more.
� Some 42 percent of the Latinos who have no health insurance lack a usualhealth care provider, compared with 19 percent of the insured.
Profile of Persons Who Lack a Usual Health Care Provider
� The primary reason that respondents give for not having a regular health careprovider is their belief that they do not need one.• 41 percent of those lacking a regular provider say that they are seldom sick,and 13 percent say they prefer to treat themselves.
• 17 percent report a lack of health insurance as the primary reason that theydon’t have a regular provider, and 11 percent report that the cost of healthcare is prohibitive.
• 3 percent report that they have trouble navigating the U.S. health care system.
� A significant share of Hispanic adults who lack a regular health care providerare native born, have a high school diploma, speak English and have healthinsurance.• 50 percent of those with no usual health care provider are at least highschool graduates.
• 30 percent of those with no usual health care provider were born in theUnited States.
• 52 percent of those with no usual health care provider speak predominantlyEnglish or are bilingual.
• 45 percent of those with no usual health care provider have health insurance.
Hispanics and Health Care in the United States: Access, Information and Knowledge8
�
Quality of Health Care
� 77 percent of Latinos who have received health care in the past year rate thatcare as good or excellent.
� Of those Latinos who have received health care in the past year, assessmentsof the quality of care are higher rated among those who have health insuranceand a usual health care provider.• 80 percent of people with a usual health care provider state that their healthcare was good or excellent, compared with 64 percent of people with nousual health care provider.
• 80 percent of the insured rate their health care as good or excellent,compared with 70 percent of the uninsured.
� Of those respondents who have received health care in the past five years,23 percent report having received poor-quality medical treatment• A plurality (31 percent) attribute this poor treatment to their financiallimitations.
• 29 percent attribute the poor treatment to their race or ethnicity.• 23 percent report that their accent or the manner in which they speakEnglish contributed to their poor treatment.
Health Information Sources
� Some 71 percent of Latinos report getting information from a medicalprofessional in the past year, while 28 percent report having obtained noinformation at all from a health care professional in that time.
� Most Latinos receive information about health care either from the media,or from their families, friends, churches and community groups.• 83 percent report obtaining at least some information about health andhealth care from television, radio, newspapers, magazines or the Internetin the past year.
• 70 percent report obtaining information from family and friends, orchurches and community groups in the past year.
� Television is an especially powerful conduit of information; 68 percent ofLatinos report obtaining health information from television in the past year.
Hispanics and Health Care in the United States: Access, Information and Knowledge9
�
� Not only are Latinos obtaining a substantial amount of health informationfrom the media, but they are making behavioral changes based on whatthey learn.*• 64 percent report that the health information that they obtained from themedia led them to change their diet or exercise regimes.
• 57 percent report that the health information they obtained from the medialed them to visit a health care professional.
• 41 percent say that the information they obtained from the media affectedtheir decision about how to treat an illness or medical condition.
Diabetes Knowledge
� In a battery of eight questions assessing diabetes knowledge, 58 percentof respondents scored “high,” meaning they correctly answered six or moreof the questions.
� Better-educated, more assimilated Latinos are more knowledgeableabout diabetes.• 50 percent of adults lacking a high school diploma score high on theknowledge battery, compared with 70 percent of adults with at leastsome college education.
• 60 percent of naturalized citizens score high on the knowledge battery,compared with 48 percent of immigrant respondents who are neithercitizens nor legal permanent residents.
• 50 percent of immigrants who have lived in the United States for less thanfive years score high on the knowledge battery, compared with 61 percentof immigrants who have lived in the United States for 15 years or more.
� 61 percent of adults with a usual place for health care scored high on thediabetes knowledge index, compared with 50 percent of adults with no usualplace for health care.
� Among adults diagnosed with diabetes, 73 percent scored high on theknowledge test, while 27 percent answered five or fewer questions correctly.
* The survey does not allow us to evaluate the validity of the health information obtained, or theappropriateness of subsequent behavioral changes that respondents make.
Hispanics and Health Care in the United States: Access, Information and Knowledge10
� CHAPTER 1 – INTRODUCTION: HISPANICS AND CHRONIC DISEASE IN THE U.S.
Chronic conditions have large impacts on U.S. health and medical spending.According to the Centers for Disease Control and Prevention, 133 millionU.S. residents have at least one chronic condition. Treating those diseases costs$1.5 trillion a year, which accounts for 75 percent of the nation’s spending ondirect medical costs.5 Given the aging of the U.S. population, the prevalenceof chronic disease and the rising costs of treatment, medical expenditures areexpected to continue to go up.6
The size and rapid growth of the Latino population offers considerable reason tofocus on its chronic disease management. Latinos will account for most of theU.S. population growth through 2050. While in 2007, Latinos comprised 15percent of the U.S. population, or about 45.5 million people,7 projections basedon current demographic trends suggest that by 2050, they will comprise upwardsof 29 percent of the population, or 128 million people.8
Though they are now relatively youthful compared with the general population,Latinos will account for a growing proportion of middle-aged and elderlyAmericans in the future. By 2050, for example, the Hispanic share of the elderlypopulation will almost triple to 17 percent from 6 percent in 2005. Furthermore,growth in the Hispanic population increasingly will be driven by births in theUnited States, rather than immigration from abroad.9 Since U.S.-born Hispanicstend to be less healthy than Hispanic immigrants, this compositional changemay further predispose the population to chronic illness.
At present, Hispanics have a lower prevalence of many conditions than thepopulation as a whole, but they have a higher prevalence of diabetes thannon-Hispanic whites (see Table 1). Furthermore, their rates of overweight andobese adults are relatively higher than those of non-Hispanic whites, whichputs Hispanics at greater risk for the development of diabetes and other healthconditions.10

Hispanics and Health Care in the United States: Access, Information and Knowledge11
�
Table 1: Age-Adjusted Percentages of Disease Prevalence and RiskFactors for Persons Ages 18+, 2006
Hispanics % Non-Hispanic Non-HispanicWhite % Black %
Heart disease (includes coronary 7.6 11.7 10.0heart disease, angina pectoris, orany other heart condition or disease)
Hypertension 20.4 22.4 31.6
Asthma (ever had) 8.2 11.5 12.0
Chronic bronchitis 2.7 4.5 4.3
Cancer (ever had) 3.6 8.2 4.0
Diabetes (excludes gestational and 10.5 6.7 12.0borderline diabetes)
Overweight 39.6 34.5 33.7
Obese 27.4 24.7 35.3
When people don’t get the information or treatment that would allow themto manage illnesses at an early stage or avoid a disease altogether, the costs ofhealth care escalate and the burden of expensive late-stage medicine often falls topublicly funded health services. An important strategy to reduce chronic illness,and the costs associated with it, is through prevention via regular monitoringand educational initiatives.6
According to the CDC,3 the proportion of Hispanics who report that they haveno usual place to receive health care is more than double that of non-Hispanicwhites and non-Hispanic blacks.* Though it is more difficult to measure generalknowledge and education about health issues among the population, thesheer diversity of the Hispanic population creates a challenge to informationdissemination within medical environments as well as through public healthcampaigns.
In addition to divisions by gender, income and education, a number of otherkey characteristics distinguish Hispanics from each other. The language dividebetween Hispanics who are English speakers and those who are primarilySpanish speakers creates obstacles to public health campaigns and medical care.Differences between U.S.-born Hispanics and Hispanic immigrants, betweenHispanic immigrants from different countries of origin, as well as differing ratesof assimilation by Latino immigrants add to the complexity of understandingthis rapidly growing population and determining how best to convey healthinformation to it.
* This cross-group pattern persists even controlling for age differences among the populations.
Source: National Health Interview Survey data from Pleis and Lethbridge–Cejku (2007).

Hispanics and Health Care in the United States: Access, Information and Knowledge12
�
Table 2: Profile of Hispanic Adults
Sex
Male 52
Female 48
Age
18–29 30
30–49 44
50–64 15
65 and older 8
Education
Less than a high school diploma 39
High school diploma 32
Some college or more 26
Language
English-dominant 24
Bilingual 35
Spanish-dominant 41
Origin
Mexico 63
Puerto Rico 8
Cuba 4
Dominican Republic 3
Central America 10
South America 6
Nativity
Native born 36
Foreign born 63
Citizenship
Native-born citizen 41
Naturalized 22
Legal permanent resident (LPR) 21
Foreign born, not LPR 16
Years in U.S. (Foreign born only)
Less than 5 years 13
5–9 years 18
10–14 years 14
15 years or more 54
Results based upon the PHC/RWJF 2007 Latino Health Survey.
Note: Percentage may not total 100 due to rounding and the exclusion of “don’t know” and “refused”responses.

Hispanics and Health Care in the United States: Access, Information and Knowledge13
� � CHAPTER 2 – UTILIZATION OF A USUAL HEALTH CARE PROVIDER AND SATISFACTIONWITH HEALTH CARE
According to the survey results, more than one in four Latinos (27 percent) lacka regular health care provider.* Latinos are a diverse population, and a varietyof factors need to be considered to understand why some have regular providersand some don’t. Immigration and assimilation are factors, as large shares ofLatinos born outside of the United States and those who speak little English lackregular health care. Socioeconomic factors, such as education, immigration andlanguage, weigh heavily in creating these disparities. However, there is also asubstantial share of U.S.-born, fully assimilated Latinos in the ranks of thosewith no usual health care provider.
Hispanics who are most likely to lack a usual place for health care include men(36 percent), the young (37 percent of those ages 18–29), and the less educated(32 percent of those lacking a high school diploma). Generally, Latinos who areless assimilated into U.S. life are also at a disadvantage: 30 percent of thoseborn outside of the 50 states, 32 percent of Spanish speakers and 43 percent ofimmigrants who are neither citizens nor legal permanent residents lack a regularhealth care provider.
The uninsured are more than twice as likely (42 percent) as the insured(19 percent) to lack a usual provider. Although lacking health insurance raisesthe likelihood of not having a usual health care provider, having healthinsurance in no way guarantees it. Of those without a usual source of healthcare, 45 percent have health insurance.
Finally, even though the poorly educated and less assimilated are less likely tohave a regular health care provider, they comprise only a portion of the populationthat falls into this category. A sizeable proportion of those with no usual placefor health care have at least a high school diploma (50 percent), are native born(30 percent), are proficient in English (52 percent) or are U.S. citizens (50 percent).
* These results differ slightly from the statistic (32 percent) cited from the CDC, which is based on theNational Health Interview Survey. For more information on NHIS methodology and variable definitions,see www.cdc.gov/nchs/nhis.htm.

Hispanics and Health Care in the United States: Access, Information and Knowledge14
� �
IMPORTANCE OF HAVING A USUAL HEALTH CARE PROVIDER
Access to health care can be defined in any number of ways, but one widely usedapproach is to consider whether a person reports having a usual place to seekhealth care and advice. As is common practice,13 we consider any respondentswho report having a place, other than an emergency room, “where they usually
go when they are sick or need advice abouttheir health,” other than an emergency room,as having a regular health care provider. Weconsider those who report having no usualplace to obtain health care, or whose onlyusual place for health care is an emergencyroom, to be lacking a health care provider.
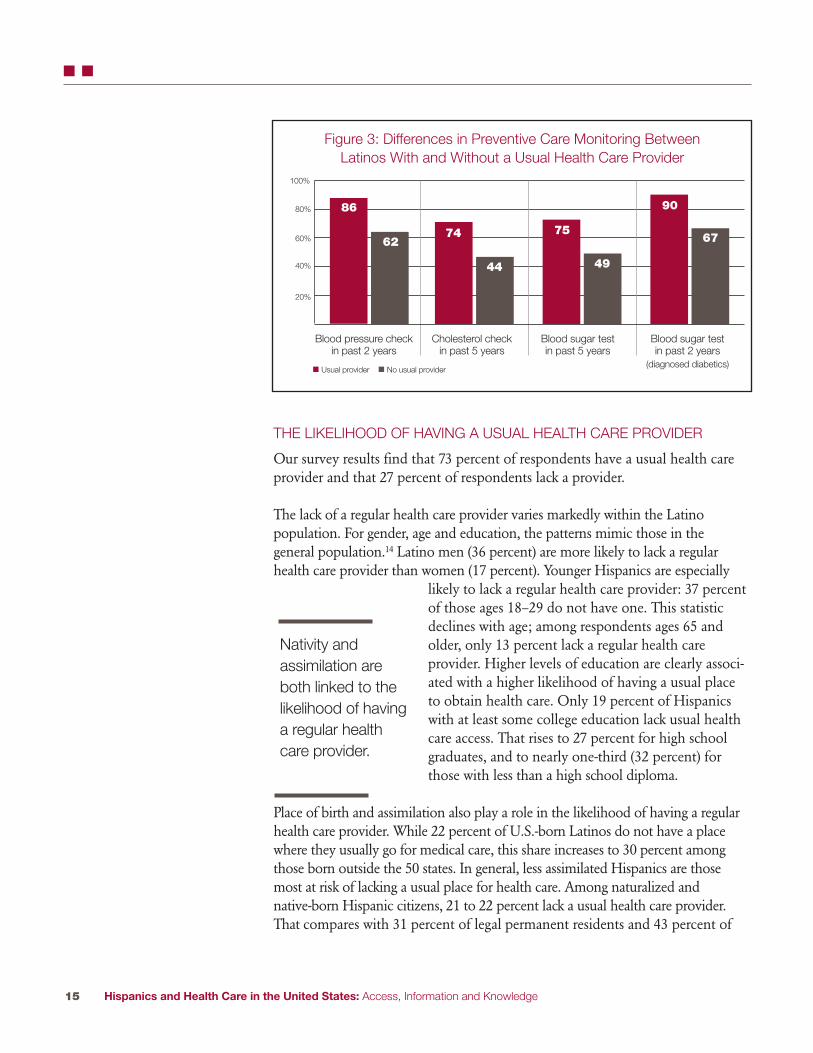
Defined this way, having a usual providercorrelates with preventive care and monitor-ing. And preventive care and monitoring areboth associated with better long-term healthoutcomes, including better control of chronicconditions. Among Hispanics with a regularhealth care provider, 86 percent report a bloodpressure check in the past two years, whileonly 62 percent of those lacking a providerreport this. While almost three-fourths ofthose with a usual place to get health carereport having their cholesterol checked in thepast five years, fewer than half (44 percent) ofthose with no usual place have done so.Latinos generally are at heightened risk ofdiabetes, and three-fourths of those with aregular health care provider report having had
a blood test to check this in the past five years, compared with only 49 percent ofthose lacking a regular health care provider. Among already-diagnosed diabetics,it is especially noteworthy that, while 10 percent of those with a regular place forhealth care have not had a test to check their blood sugar in the past two years,this share jumps to 33 percent among those with no regular provider.*
USUAL HEALTH CAREPROVIDER
Respondents areconsidered to have a“usual” or “regular” healthcare provider or place toreceive health care if they:
1. Report that they have aplace where they usuallygo to when they are sickor need advice abouttheir health, and
2. This usual place is nota hospital emergencyroom
* These differences between Latinos with and without a usual provider persist, even controlling for age.
Hispanics and Health Care in the United States: Access, Information and Knowledge15
� �
THE LIKELIHOOD OF HAVING A USUAL HEALTH CARE PROVIDER
Our survey results find that 73 percent of respondents have a usual health careprovider and that 27 percent of respondents lack a provider.
The lack of a regular health care provider varies markedly within the Latinopopulation. For gender, age and education, the patterns mimic those in thegeneral population.14 Latino men (36 percent) are more likely to lack a regularhealth care provider than women (17 percent). Younger Hispanics are especially
likely to lack a regular health care provider: 37 percentof those ages 18–29 do not have one. This statisticdeclines with age; among respondents ages 65 andolder, only 13 percent lack a regular health careprovider. Higher levels of education are clearly associ-ated with a higher likelihood of having a usual placeto obtain health care. Only 19 percent of Hispanicswith at least some college education lack usual healthcare access. That rises to 27 percent for high schoolgraduates, and to nearly one-third (32 percent) forthose with less than a high school diploma.
Place of birth and assimilation also play a role in the likelihood of having a regularhealth care provider. While 22 percent of U.S.-born Latinos do not have a placewhere they usually go for medical care, this share increases to 30 percent amongthose born outside the 50 states. In general, less assimilated Hispanics are thosemost at risk of lacking a usual place for health care. Among naturalized andnative-born Hispanic citizens, 21 to 22 percent lack a usual health care provider.That compares with 31 percent of legal permanent residents and 43 percent of
86
6274
44
75
49
90
67
Figure 3: Differences in Preventive Care Monitoring BetweenLatinos With and Without a Usual Health Care Provider
20%
40%
60%
80%
100%
Blood pressure checkin past 2 years
Cholesterol checkin past 5 years
Blood sugar testin past 5 years
Blood sugar testin past 2 years
(diagnosed diabetics)� Usual provider � No usual provider
Nativity andassimilation areboth linked to thelikelihood of havinga regular healthcare provider.
Hispanics and Health Care in the United States: Access, Information and Knowledge16
� �
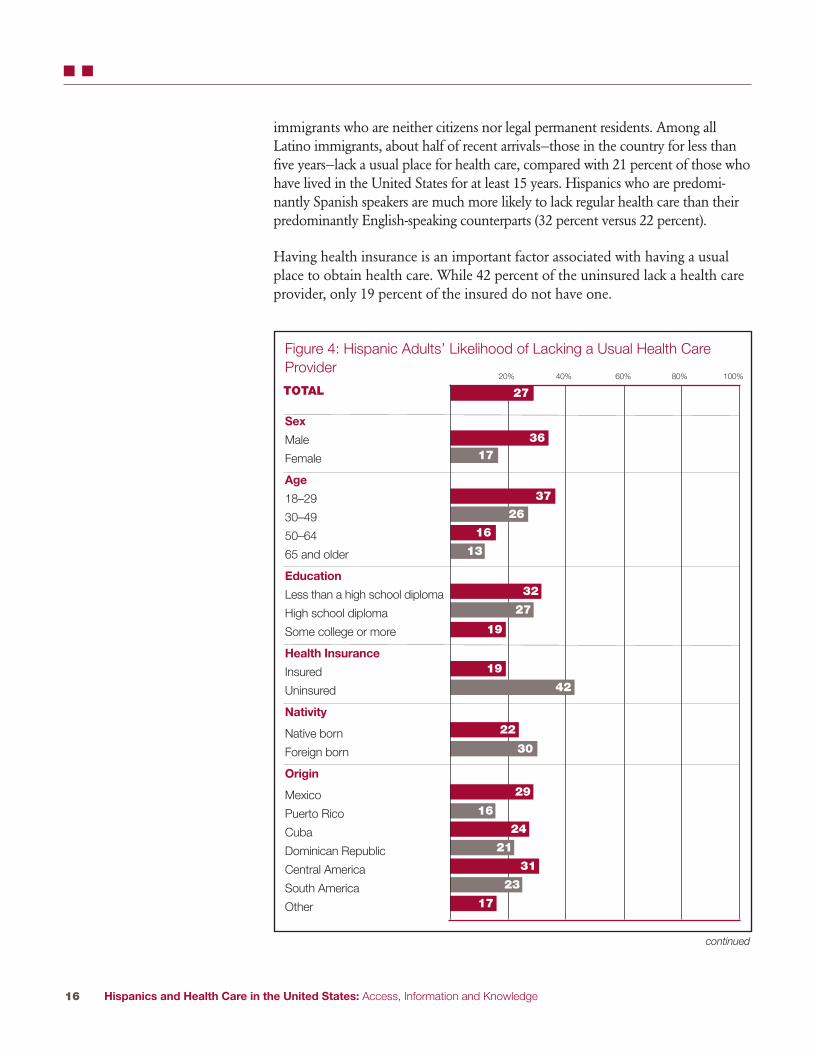
immigrants who are neither citizens nor legal permanent residents. Among allLatino immigrants, about half of recent arrivals—those in the country for less thanfive years—lack a usual place for health care, compared with 21 percent of those whohave lived in the United States for at least 15 years. Hispanics who are predomi-nantly Spanish speakers are much more likely to lack regular health care than theirpredominantly English-speaking counterparts (32 percent versus 22 percent).
Having health insurance is an important factor associated with having a usualplace to obtain health care. While 42 percent of the uninsured lack a health careprovider, only 19 percent of the insured do not have one.
Figure 4: Hispanic Adults’ Likelihood of Lacking a Usual Health CareProvider
Sex
Male
Female
Age
18–29
30–49
50–64
65 and older
Education
Less than a high school diploma
High school diploma
Some college or more
Health Insurance
Insured
Uninsured
Nativity
Native born
Foreign born
Origin
Mexico
Puerto Rico
Cuba
Dominican Republic
Central America
South America
Other
20% 40% 60% 80% 100%
27
36
16
13
32
19
27
19
42
17
37
26
TOTAL
22
29
31
17
23
16
24
21
30
continued

Figure 4: Hispanic Adults’ Likelihood of Lacking a Usual Health CareProvider, continued
Language
English-dominant
Bilingual
Spanish-dominant
Citizenship
Native-born citizen
Naturalized
Legal permanentresident (LPR)
Foreign born, not LPR
Years in U.S.(Foreign born only)
Less than 5
5–9
10–14
15 or more
20% 40% 60% 80% 100%
27TOTAL
Hispanics and Health Care in the United States: Access, Information and Knowledge17
� �
22
32
25
22
21
31
43
49
40
31
21

Hispanics and Health Care in the United States: Access, Information and Knowledge18
� �
GETTING CARE OUTSIDE OF THE U.S.
About one in 12 Hispanics (8 percent) in the U.S. have obtained medicalcare, treatment or drugs in Latin America during the previous year, andone in six (17 percent) knows a family member or friend who has done so.
Latinos who describe their recent medical care in the United States as onlyfair to poor are somewhat more likely to get medical services outside thecountry—11 percent have, compared with 6 percent of those who describetheir care in this country as excellent. Hispanics without health insurancealso are more likely to have received care in another country. Of thosewithout insurance, 11 percent did; of those with insurance, 7 percent did.Of Latinos with a regular provider in the U.S. medical system, 8 percentsay they have gotten care abroad, compared with 10 percent of those withno regular provider.
Hispanics ages 65 and older are the least likely to seek care outside theUnited States (4 percent) and those ages 50–64 are the most likely(9 percent). Foreign-born Latinos are somewhat more likely (9 percent)than the native born (6 percent) to get medical care in Latin America,and those from Mexico (10 percent) are more likely than non-Mexicansoverall. A higher share of bilingual (10 percent) and Spanish-dominant(9 percent) Hispanics seek medical care in Latin America than do Englishspeakers (4 percent).
One in 10 people with at least some college education report gettingrecent treatment or drugs in Latin America, compared with single-digitpercentages for those with less education.

Hispanics and Health Care in the United States: Access, Information and Knowledge19
� �
PROFILE OF LATINOS LACKING A USUAL HEALTH CARE PROVIDER
Who are the Hispanics who are not being reached by the health care system?This section looks at the characteristics of people who lack a usual health careprovider.
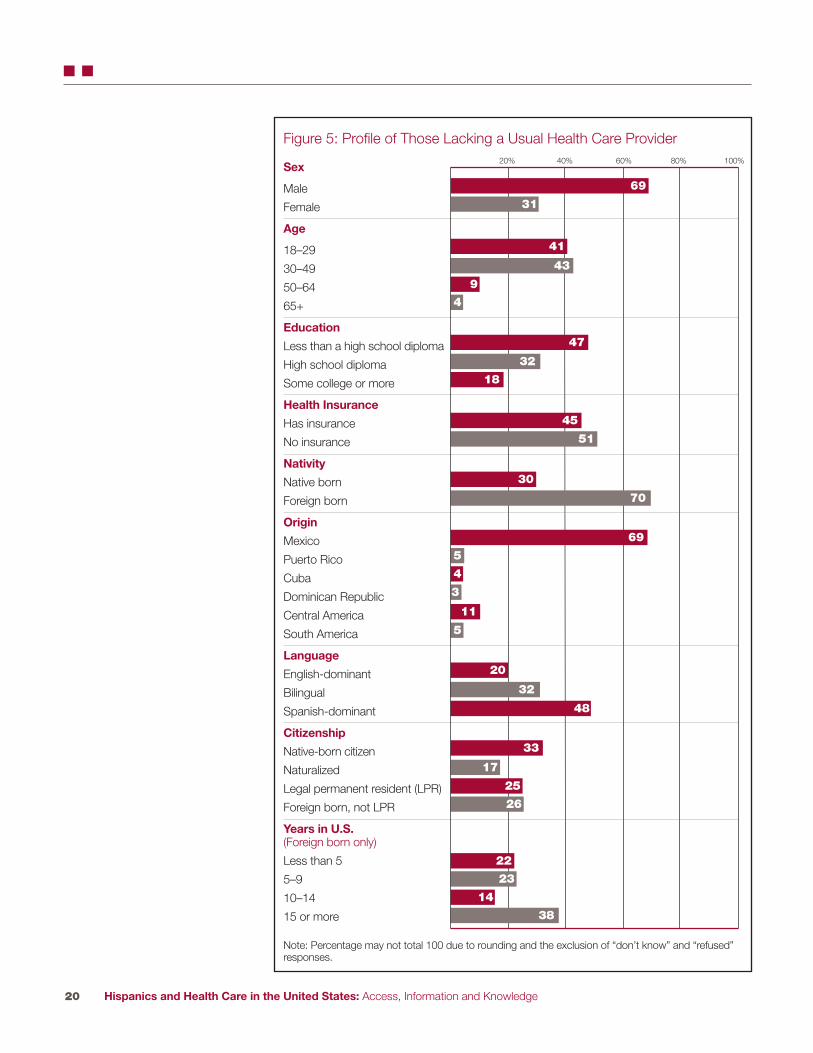
Most Hispanics who lack a provider are male (69 percent). The population alsotends to be young: 41 percent are 18–29 years of age, and 43 percent are 30–49.As is expected, Hispanics with low educational attainment comprise a largeproportion of those lacking a provider; 47 percent report having less than ahigh school diploma. The vast majority of those with no usual place for healthcare are of Mexican origin (69 percent), and an additional 11 percent are ofCentral American origin.
Yet, what is also notable about those lacking a usual health care provider isthe prevalence of Latinos whose characteristics suggest assimilation. While mostLatinos who lack a provider are foreign born (70 percent), a full 30 percent wereborn in the 50 states. Half of those lacking a usual place for health care arecitizens. A sizeable minority of immigrants who lack regular health care(45 percent) have lived in the United States for fewer than 10 years, but themajority (52 percent) have lived in the United States for 10 years or more.
On a similar note, a slight majority of those with nousual health care provider is English-dominant orbilingual (52 percent).
Finally, 45 percent of Hispanics who have no usualplace for health care say they have health insurance.So though health insurance is correlated with usualcare, it does not guarantee it.
Of those Hispanicswho have no usualplace for health care,45 percent havehealth insurance.
Hispanics and Health Care in the United States: Access, Information and Knowledge20
� �
Figure 5: Profile of Those Lacking a Usual Health Care Provider
Sex
Male
Female
Age
18–29
30–49
50–64
65+
Education
Less than a high school diploma
High school diploma
Some college or more
Health Insurance
Has insurance
No insurance
Nativity
Native born
Foreign born
Origin
Mexico
Puerto Rico
Cuba
Dominican Republic
Central America
South America
Language
English-dominant
Bilingual
Spanish-dominant
Citizenship
Native-born citizen
Naturalized
Legal permanent resident (LPR)
Foreign born, not LPR
Years in U.S.(Foreign born only)
Less than 5
5–9
10–14
15 or more
20% 40% 60% 80% 100%
69
41
47
32
45
51
30
20
48
32
33
25
26
22
23
14
38
17
70
69
18
43
9
4
5
4
3
5
11
31
Note: Percentage may not total 100 due to rounding and the exclusion of “don’t know” and “refused”responses.

Hispanics and Health Care in the United States: Access, Information and Knowledge21
� �
WHY DON’T PEOPLE HAVE A USUAL PLACE FOR HEALTH CARE?
The survey asked respondents who lacked a usual place to get medical care oradvice why they did not have one.* By far the most commonly cited reason wasthat they felt they did not need one because they are seldom sick (41 percent).An additional 13 percent report that they prefer to treat themselves than to seekhelp from medical doctors.
The next most prevalent set of responses relates to finances: 17 percent reportthat they lack health insurance, and 11 percent report that the cost of health careprevents them from having a regular health care provider.
About 3 percent of Hispanics respond that difficulties navigating the health caresystem are to blame for their lack of a regular provider: 2 percent report that theydo not know where to get regular health care, and about 1 percent reports thatthey were unable to find a provider who spoke their language.
Finally, 3 percent say they prefer to go to a number of different health careproviders, not just to one place, and 4 percent say they have just moved to thearea, so presumably have yet to establish a relationship with a provider.
Table 3: What is the One Main Reason You Do Not Have a PlaceThat You Usually Go To When You Are Sick or Need Advice AboutYour Health?
No Need PercentageSeldom/never sick 41
Don’t use doctors/treat myself 13
Financial ReasonsNo health insurance 17
Cost of medical care 11
Trouble Negotiating Health Care SystemDon’t know where to go for care 2
Can’t find provider who speaks my language 1
OtherLike different places for different health care needs 3
Recently moved to area 4
* Respondents who reported that their usual health care provider was an emergency room were not askedthis question.
Note: Percentage may not total 100 due to rounding and the exclusion of “don’t know” and “refused”responses.
Hispanics and Health Care in the United States: Access, Information and Knowledge22
� �
QUALITY OF HEALTH CARE
While visiting a health care provider is important, the perceived quality of carereceived during health care visits is equally important. To assess the perceivedquality of care, respondents who received any medical care in the past year wereasked to rate that care as “excellent”, “good”, “fair”, or “poor.”
More than three-quarters of Hispanics who have had medical care withinthe past year rate it as good to excellent: 32 percent say it was excellent, and46 percent say it was good. At the other extreme, 17 percent say their carewas only fair, and 4 percent report poor care.
FOLK HEALING
An overwhelming majority of Latinos believe that sick people should obtaintreatment only from medical professionals, but a small minority say they seekhealth care from folk healers. Those who receive care from folk healers areslightly more likely to be U.S.-born than foreign born and to speak mainlyEnglish, not Spanish.
Asked whether they obtain care from a curandero, shaman or someoneelse with special powers to heal the sick, 6 percent of Hispanics say they doand 10 percent report that someone in their household receives such care.
About one in 12 Hispanics born in the 50 states use folk medicine, comparedwith one in 20 of those born in other countries or Puerto Rico. Similarly,one in 12 English-dominant Hispanics use folk medicine, as do one in 20Spanish-dominant Latinos. Hispanics of Cuban ancestry (11 percent) are morelikely to obtain such care than other Latino groups. Hispanics without healthinsurance or a usual place for care are no more likely to seek folk care thanthose with health insurance or a usual place for care.
Most Hispanics (87 percent) say that sick people should seek care only frommedical professionals; only 8 percent say there is a role for folk medicine.Opinions about this echo usage patterns to some extent. Hispanics who speakEnglish (14 percent), as well as those born in the United States (12 percent),are the most likely to say there is a role for potions and folk healing. So areyounger Hispanics, as well as those with at least some college education.

Hispanics and Health Care in the United States: Access, Information and Knowledge23
� �
In general, more educated Latinos, and those who have access to the medicalsystem, give better evaluations of the quality of their medical care than doLatinos with lower education levels, no insurance or no regular source of care.
Women are more likely than men to say their recent medical care was good orexcellent, 80 percent to 74 percent. Eighty-one percent of the college-educated
report being satisfied with their care, as compared with75 percent of people lacking a high school diploma.
Among Hispanics with health insurance, 80 percentrate their care as good to excellent; among the unin-sured, 70 percent do. Similarly, 80 percent of Latinoswho have a usual health care provider rate their care asgood to excellent, compared with 64 percent who haveno usual provider. Among those with a usual provider,Hispanics who usually get care in doctors’ offices givehigher ratings than those who go to medical clinics.Fully four in 10 who go to a doctor’s office rate their
care as excellent, compared with 27 percent of those who get care from a clinic.
32
46
17 4
Figure 6: Overall How Would You Rate the Quality of Medical CareThat You Received in the Past 12 Months?
20%
40%
60%
80%
100%
Excellent Good Fair Poor
Having healthinsurance or a usualhealth care provideris associated withbetter perceivedquality of care.
Note: Percentage may not total 100 due to rounding and the exclusion of “don’t know” and “refused”responses.
Hispanics and Health Care in the United States: Access, Information and Knowledge24
� �
Generally, nativity and assimilation are not strongly associated with perceivedquality of care. However, a mismatch between a Hispanic’s primary language andthe language spoken at his or her appointment lowered the satisfaction ratingssomewhat. For example, 30 percent of Spanish speakers whose appointmentsusually are conducted in English rate their care fair to poor, compared with 19percent of those whose appointments are in Spanish.
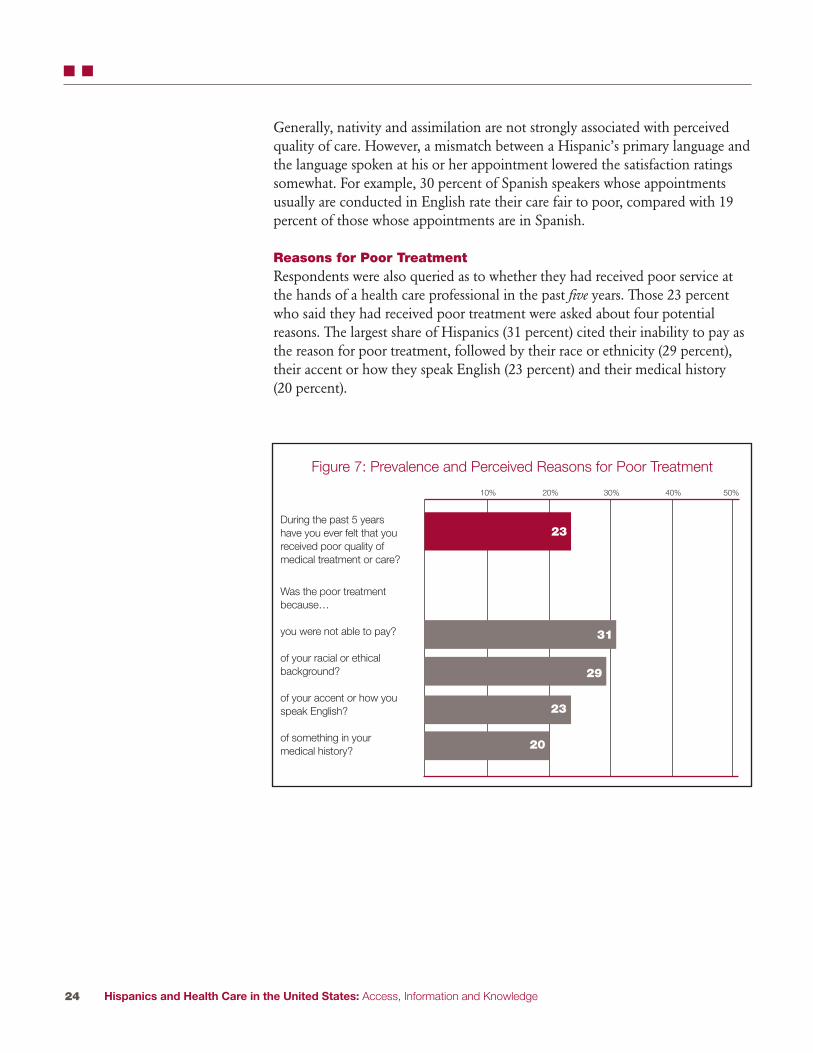
Reasons for Poor TreatmentRespondents were also queried as to whether they had received poor service atthe hands of a health care professional in the past five years. Those 23 percentwho said they had received poor treatment were asked about four potentialreasons. The largest share of Hispanics (31 percent) cited their inability to pay asthe reason for poor treatment, followed by their race or ethnicity (29 percent),their accent or how they speak English (23 percent) and their medical history(20 percent).
Figure 7: Prevalence and Perceived Reasons for Poor Treatment
10% 20% 30% 40% 50%
23
29
31
20
During the past 5 yearshave you ever felt that youreceived poor quality ofmedical treatment or care?
Was the poor treatmentbecause…
you were not able to pay?
of your racial or ethicalbackground?
of your accent or how youspeak English?
of something in yourmedical history?
23

Hispanics and Health Care in the United States: Access, Information and Knowledge25
� �
Respondents who lacked health insurance, or a usual health care provider, wereespecially likely to claim that their inability to pay, their race, or their languageskills contributed to their poor treatment. Forty-one percent of Hispanics with nousual place for health care, and 53 percent of Hispanics with no health insurance,reported that their inability to pay contributed to poor treatment. In comparison,27 percent of Latinos with a usual provider reported as much, as did 20 percentof Latinos with health insurance. Thirty-eight percent of Latinos with no usualprovider and 34 percent of those with no health insurance reported that their racecontributed to poor treatment by medical professionals, as compared to 25 percentof those with a usual provider and 26 percent of those with health insurance.Thirty-two percent of Latinos who lacked either health insurance or a usualprovider reported that their accent or poor English skills led to poor treatment,while 20 percent of the insured and those with a usual provider reported as much.
Other groups more likely than Hispanics overall to cite a lack of money as areason for poor treatment include immigrants who aren’t citizens or legalpermanent residents (45 percent), Spanish speakers (38 percent) and Latinoswho did not graduate from high school (41 percent).
Among the groups that are more likely than Hispanics overall to cite race as areason they were treated poorly are Spanish speakers (36 percent), and non-citizens (38 percent of legal permanent residents and 35 percent of immigrantswho are not citizens or legal permanent residents).
Among the groups most likely to cite language as the reason they receivedpoor care are Hispanics with less than a high school education (37 percent),immigrants (33 percent) and those who mainly speak Spanish (43 percent).
Medical history is given as a reason for poor care by a somewhat higher shareof older Hispanics (25 percent) and those whose primary language is Spanish(25 percent).

Hispanics and Health Care in the United States: Access, Information and Knowledge26
� � � CHAPTER 3 - SOURCES OF INFORMATION ON HEALTH AND HEALTH CARE
While preventive care and regular health monitoring are essential in maintaininggood long-term health and limiting the severity of chronic diseases, more thanone in four Hispanics say they received no information regarding health orhealth care from doctors or health care professionals in the past year. This groupincludes a wide cross-section of the Hispanic population.
However, medical professionals are not the only ones providing health andmedical information. Specific information regarding the importance of preventa-tive care and regular health monitoring as well as the symptoms and treatment ofchronic diseases can be delivered through alternate sources. Print and broadcastmedia, churches, community groups, family and friends, and the Internet are allsources of health and medical information for many Hispanics. Though thesurvey results do not address the validity or quality of the health informationobtained through sources other than medical personnel, results do suggest thatthe information from these alternative sources has an impact on respondents’behaviors.
Different sub-groups of Hispanics rely on different types of media. In general,U.S.-born Hispanics and those who have higher levels of education are morelikely to get information in English from sources such as television, newspapers,magazines and the Internet. Immigrant Hispanics and those who have lowerlevels of education rely more on Spanish-language media, including televisionand print media, for information.
WHERE DO HISPANICS GET HEALTH CARE INFORMATION?
Respondents were queried as to how much information about health and healthcare they got from several different sources in the past year. For each potentialinformation source, they could report getting “a lot” of information, “a little”information, or no information at all. Results show that doctors and othermedical professionals are the most common source of health and medicalinformation for Hispanics, as they are likely to be for most groups. Nearly athird of Hispanics say they received a lot of health and health care informationfrom doctors or other medical professionals over the past year, and 39 percentsay they received a little information.
Hispanics and Health Care in the United States: Access, Information and Knowledge27
� � �
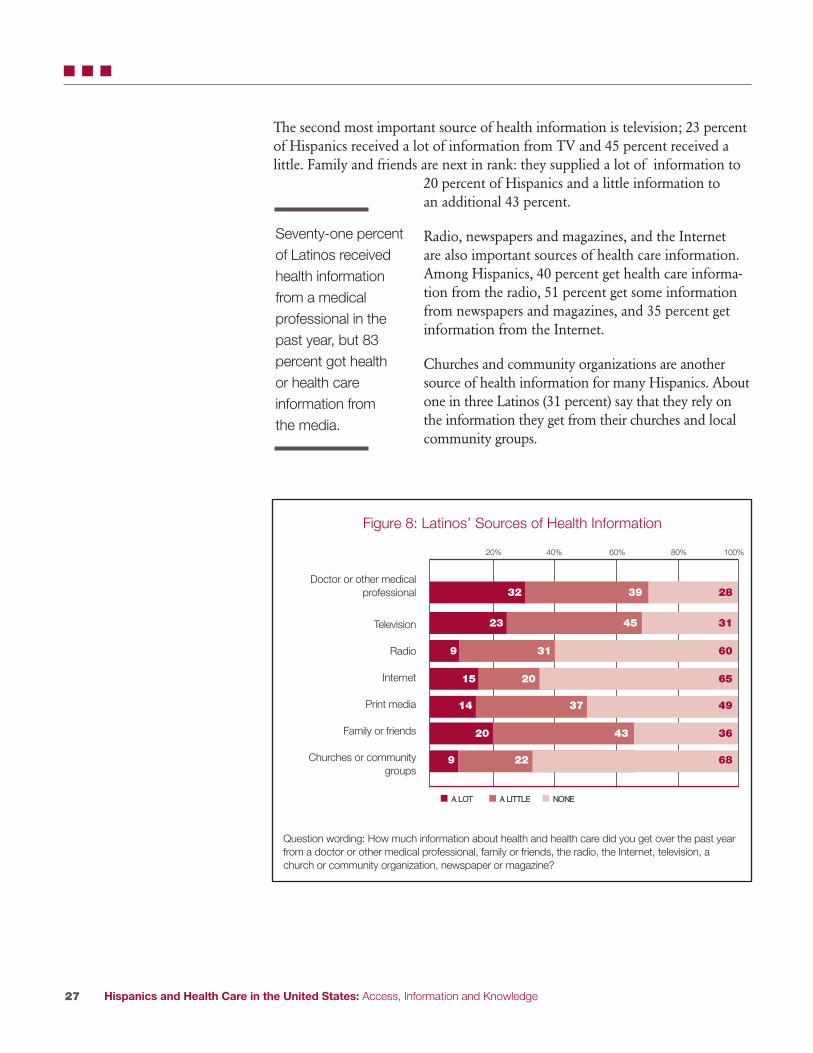
The second most important source of health information is television; 23 percentof Hispanics received a lot of information from TV and 45 percent received alittle. Family and friends are next in rank: they supplied a lot of information to
20 percent of Hispanics and a little information toan additional 43 percent.
Radio, newspapers and magazines, and the Internetare also important sources of health care information.Among Hispanics, 40 percent get health care informa-tion from the radio, 51 percent get some informationfrom newspapers and magazines, and 35 percent getinformation from the Internet.
Churches and community organizations are anothersource of health information for many Hispanics. Aboutone in three Latinos (31 percent) say that they rely onthe information they get from their churches and localcommunity groups.
Figure 8: Latinos’ Sources of Health Information
Doctor or other medicalprofessional
Television
Radio
Internet
Print media
Family or friends
Churches or communitygroups
20% 40% 60% 80% 100%
AA LLOOTT NNOONNEEAA LLIITTTTLLEE
3932 28
4523 31
319 60
2015 65
3714 49
4320 36
229 68
Question wording: How much information about health and health care did you get over the past yearfrom a doctor or other medical professional, family or friends, the radio, the Internet, television, achurch or community organization, newspaper or magazine?
Seventy-one percentof Latinos receivedhealth informationfrom a medical professional in thepast year, but 83 percent got health or health care information from the media.

Hispanics and Health Care in the United States: Access, Information and Knowledge28
� � �
WHO GETS INFORMATION FROM THE MEDICAL COMMUNITY?
Hispanic women are more likely than are men to report getting health informationfrom doctors and the medical community in the past year—77 percent report asmuch, compared with 66 percent of men. Overall, the age differences in receivingany information from medical professionals are not huge, but respondents ages65 and older are more likely to have gotten a lot of health information from aprofessional (41 percent) than respondents under age 30 (28 percent).
As is the case with usual health care providers, those who are more educated and more assimilated are more likely to report exposure to the medical system.People with at least some college education are almost 33 percent more likely tohave gotten a medical professional’s advice than people lacking a high school diploma. Seventy-nine percent of Latinos who speak primarily English and three-fourths of those who are bilingual report obtaining information from medical providers in the past year, while 62 percent of Spanish-dominant Latinos have done so. Legal status is also correlated with the likelihood of obtaining health advice from a medical professional. Citizens born in the United States or Puerto Rico are most likely to have received medical advice (80 percent) from a professional, followed by naturalized citizens (70 percent),and legal permanent residents (64 percent). Fifty-nine percent of immigrants who are neither naturalized nor legal permanent residents reported obtaininghealth information from a medical professional.
Respondents of Puerto Rican (80 percent) and Cuban (78 percent) origin are especially likely to have received help from a medical professional in the pastyear. Conversely, Mexican-origin persons (69 percent) and Central Americans (69 percent) were less likely to report as much.

Hispanics and Health Care in the United States: Access, Information and Knowledge29
� � �
Table 4: Sources of Health Information Family Churches
Medical TV Radio Internet Print or or comm.media friends groups
Total 71% 68% 40% 35% 51% 63% 31%
SexMale 66 67 43 33 50 62 32Female 77 69 36 37 52 64 31
Age18–29 71 69 41 43 51 71 3530–49 71 69 43 35 52 63 3050–65 69 69 34 30 51 57 2865 and older 77 61 29 14 46 46 32
EducationLess than a high 62 66 39 16 40 55 34school diplomaHigh school diploma 74 73 43 36 55 67 33Some college or more 82 67 39 63 63 71 26
LanguageEnglish-dominant 79 63 35 53 56 73 25Bilingual 75 69 40 43 56 64 32Spanish-dominant 62 70 42 17 42 56 35
OriginMexico 69 69 41 31 49 63 32Puerto Rico 80 65 34 49 55 68 31Cuba 78 61 40 37 51 62 28Dominican Republic 72 67 42 42 55 65 34Central American 69 70 38 29 48 58 33South American 71 72 39 51 58 61 29
NativityNative born 80 64 35 53 57 71 28Foreign born 66 70 43 25 47 58 33
CitizenshipNative-born citizen 80 65 36 51 56 69 29Naturalized 70 68 38 30 50 56 29Legal permanent resident 64 71 45 23 48 60 35Foreign born, not 59 71 45 18 42 60 35LPR
Years in U.S. (Foreign born only)Less than 5 years 58 72 42 27 45 63 365–9 62 73 46 25 47 61 37
10–14 66 72 46 22 45 58 315 or more 69 69 41 25 49 57 32
Health insuranceInsured 78 69 40 41 53 64 31Not insured 59 68 40 24 47 61 32
Usual health care provider
Has 78 70 39 38 53 65 32Does not have 53 64 42 27 44 58 30
Question wording: How much information about health and health care did you get over the past yearfrom a doctor or other medical professional, family or friends, the radio, the Internet, television, a churchor community group, newspaper or magazine?
Hispanics and Health Care in the United States: Access, Information and Knowledge30
� � �
WHO GETS HEALTH INFORMATION FROM THE MEDIA?
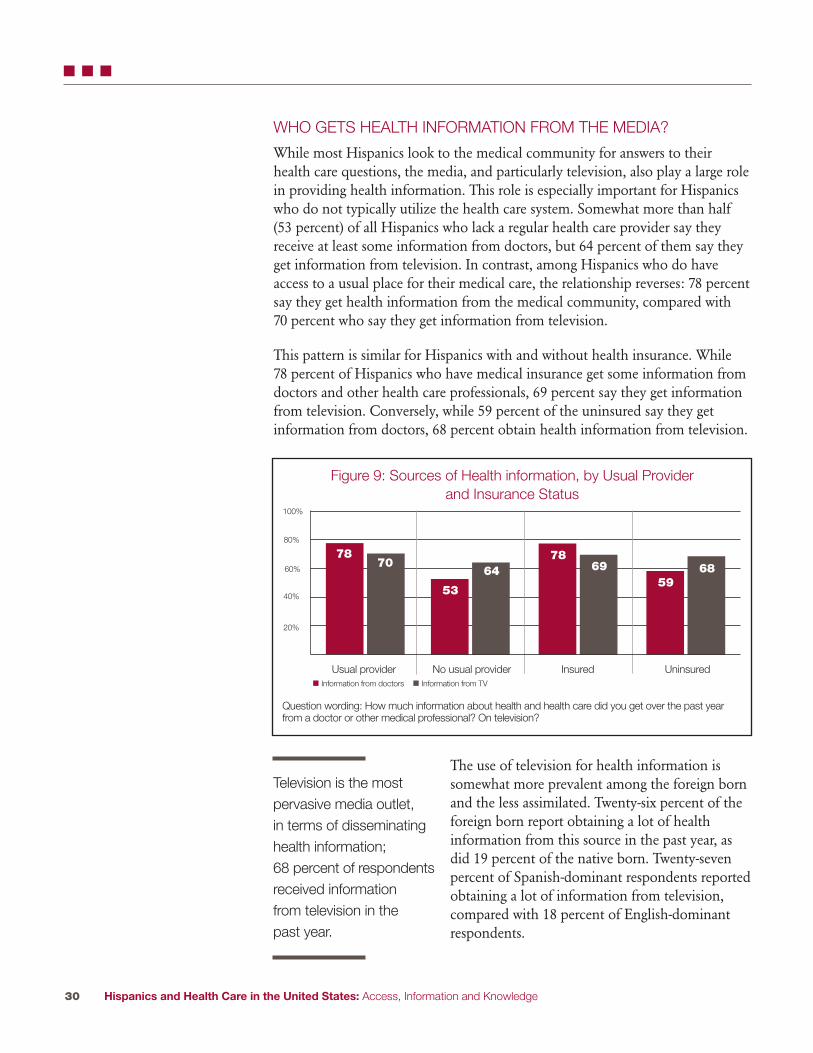
While most Hispanics look to the medical community for answers to theirhealth care questions, the media, and particularly television, also play a large rolein providing health information. This role is especially important for Hispanicswho do not typically utilize the health care system. Somewhat more than half(53 percent) of all Hispanics who lack a regular health care provider say they receive at least some information from doctors, but 64 percent of them say theyget information from television. In contrast, among Hispanics who do have access to a usual place for their medical care, the relationship reverses: 78 percent say they get health information from the medical community, compared with 70 percent who say they get information from television.
This pattern is similar for Hispanics with and without health insurance. While 78 percent of Hispanics who have medical insurance get some information fromdoctors and other health care professionals, 69 percent say they get informationfrom television. Conversely, while 59 percent of the uninsured say they get information from doctors, 68 percent obtain health information from television.
The use of television for health information issomewhat more prevalent among the foreign bornand the less assimilated. Twenty-six percent of theforeign born report obtaining a lot of health information from this source in the past year, asdid 19 percent of the native born. Twenty-sevenpercent of Spanish-dominant respondents reportedobtaining a lot of information from television, compared with 18 percent of English-dominant respondents.
7870
53
6478
6959
68
20%
40%
60%
80%
100%
Usual provider No usual provider Insured Uninsured� Information from doctors � Information from TV
Television is the most pervasive media outlet, in terms of disseminatinghealth information; 68 percent of respondentsreceived information from television in the past year.
Question wording: How much information about health and health care did you get over the past yearfrom a doctor or other medical professional? On television?
Figure 9: Sources of Health information, by Usual Provider and Insurance Status

Hispanics and Health Care in the United States: Access, Information and Knowledge31
� � �
Radio also is an important source of health care information for Hispanics.Radio’s role as an information source is roughly similar for Hispanics with ahealth care provider (39 percent) and those without one (42 percent). Likewisefor Hispanics who have health insurance and those who do not—40 percent inboth cases obtain health information from the radio.
Like television, radio as an information source is somewhat skewed toward immigrants and those whose primary language is Spanish. Thirty-five percent ofEnglish-dominant respondents get health information from the radio, comparedwith 42 percent of Spanish-dominant respondents. The results are similar whenconsidering nativity. Thirty-five percent of the native born use the radio as asource for health information, compared with 42 percent of the foreign born.
More than half of all Hispanics say they received a lot of information (14 percent) or a little information (37 percent) from print sources. Higher educationlevels, being native born and assimilation are all associated with higher likelihoodsof retrieving health information from these print media. Forty-one percent ofLatinos with less than a high school diploma report getting information fromnewspapers or magazines, compared with 63 percent of people with at least some college education. Fifty-seven percent of the native born use print media,as do 47 percent of the foreign born. While 56 percent of English-dominant and bilingual Latinos obtained at least some health information from these sources,the share drops to 42 percent among Spanish-dominant Latinos.
Youth, education, nativity and assimilation are all strongly linked to Internetusage for Latinos in general,15 and to the likelihood of using the Internet forhealth information in particular. Younger Hispanics use the Internet more thanolder Hispanics—42 percent of those ages 18 to 29 say they get information from the Internet, compared with 14 percent of those ages 65 and older. The educational differences in the likelihood of getting health care informationfrom the Internet are stark. While only 16 percent of Hispanics with less than ahigh school diploma and 36 percent of those with a high school diploma get information on health issues from the Internet, 63 percent of Hispanics whohave at least some college education say that they get a lot or a little informationfrom the Internet. Hispanics born in the United States are twice as likely as areimmigrants to get health care information from the Internet—52 percent versus25 percent. English dominance, too, is strongly associated with using the Internetfor health information; 53 percent of the English-dominant do so, comparedwith 17 percent of the Spanish-dominant.

Hispanics and Health Care in the United States: Access, Information and Knowledge32
� � �
WHO GETS HEALTH CARE INFORMATION FROM THE MEDIA INSPANISH, AND WHO GETS IT IN ENGLISH?
Among Hispanics who receive any health-related information from television, 40 percent get that information from only Spanish-language television stations,32 percent from a mix of Spanish and English-language stations and 28 percentfrom only English-language stations. Similarly, among the Hispanics who useradio to obtain any of their health care information, 47 percent rely on Spanish-language radio stations, 26 percent listen to Spanish and English-language stations and 27 percent rely on only English stations.
Women are more likely than men to get their healthinformation in Spanish (44 percent versus 36 percentfor television viewers, and 53 percent versus 43 percentfor radio listeners). Age is also correlated with obtain-ing health information from Spanish-language broad-casts. Thirty-eight percent of respondents younger than30, and 48 percent of respondents ages 65 and olderwho got health information from television got it inSpanish. Similarly for radio listeners, 44 percent ofthose ages 18 to 29 and 54 percent of those ages 65 orolder received their health information in Spanish.
Among those who watch television and those wholisten to the radio, there is a strong association between educational levels andlanguage use. In both cases, people with less than a high school diploma weremore likely to get their information in Spanish (56 percent for television, 64 percent for radio) compared to those with at least some college education(17 percent for television, 20 percent for radio).
Figure 10: Language of Health Information Obtained in Past Year
Television
Radio
Internet
Print media
20% 40% 60% 80% 100%
SSPPAANNIISSHH EENNGGLLIISSHHBBOOTTHH
3240 28
2647 27
2913 58
2927 43
Question wording: Was the information mainly in Spanish or in English or in both languages?
More than half of respondents who getinformation from television or radio report getting that information in Spanish,or in a mix of Spanishand English.

Hispanics and Health Care in the United States: Access, Information and Knowledge33
� � �
Of course, being native born and assimilated are associated with lower likelihoods of obtaining broadcast media health information in Spanish.
Most frequently, the information obtained from the Internet was solely in English (58 percent). However, 13 percent of respondents reported obtainingonly Spanish-language Internet health care information. Twenty-nine percent of respondents got Internet health information in both English and Spanish. The pattern is similar for newspapers and magazines. Hispanics who get some information from print media are most likely to read English-language newspapers and magazines (43 percent), though 27 percent read Spanish-only publications and 29 percent got health information from both Spanish and English publications.
Health Care Information from Social NetworksMore than 60 percent of Hispanics report that they received health informationfrom their family and friends in the past year: 19 percent got a lot of informationthat way, and 43 percent got a little. Immigrants are less likely to get informationfrom family and friends (59 percent) than are native-born Hispanics (71 percent),plausibly because they have smaller networks of family and friends in the United States. Younger Latinos are more likely to get information from familyand friends than are older Latinos—those ages 18 to 29 are 25 percentage pointsmore likely to get information from family and friends than are Hispanics ages65 and older.
Churches and community groups also play a role in providing health and healthcare information to Hispanics. Roughly 9 percent of Hispanics say they receive alot of information from churches and community groups, and 22 percent say theyreceive a little information from these sources. There are few notable differencesamong demographic groups here. Around one-third of Hispanics with a high
school education or less get information from churchesand community groups, compared with 26 percent of people without at least some college education.Another group that relies more heavily on churches andcommunity groups are Spanish-dominant respondents;34 percent report obtaining health information fromthese sources, compared with 25 percent of English-dominant Latinos.
As such, it’s no surprise that the information that Hispanics received from churches or communitygroups was more likely to be in Spanish only (49 percent) or in both Spanish and English (31 percent)
than only in English (19 percent). This is similar to the language of informationobtained from the radio and quite distinct from that of information obtainedfrom the Internet, newspapers and magazines.
Seventy-nine percentof respondents who received healthor health care information from themedia acted uponthat information.

Hispanics and Health Care in the United States: Access, Information and Knowledge34
� � �
Health information provided by the media led 57 percent of Hispanics to ask adoctor or medical professional new questions. Six in 10 Hispanics who have ausual provider say this. So do nearly half of all Hispanics who do not have ausual provider. Latinos whose primary language is Spanish are more likely to asknew questions to health care professionals as a result of media coverage than areEnglish speakers, pointing again to the important role played by the Spanish-language media.
The media even influence how some 41 percent of Hispanics make decisions on how to treat an illness or medical condition. Here, demographic differencesamong Latinos are not great. Both those who have a usual provider (42 percent)and those who do not (38 percent) are nearly as likely to say that what theylearned from the media affected how they think about treatment.
4157
64
Figure 11: Thinking About the Past Year, Did Any Information You Found from the Media…
20%
0
40%
60%
80%
100%
Affect decisions about how totreat an illness of medical
condition?
Lead you to ask a doctor orother medical professional
new questions?
Change the way you thinkabout diet or exercise?
Note: This question was asked only of those who reported obtaining information from the media in thepast year.
The Impact of the Media Though the survey data do not allow for an evaluation of the appropriateness of the behavioral changes that result from media exposure to health information,results clearly indicate that alternative channels of health information have an effect on Latinos’ behavior.
The media’s impact is strongest in producing reported changes in how Hispanicsthink about diet and exercise. Almost two-thirds of all Hispanics who receivedhealth and health care information last year from broadcast or print media, orfrom the Internet, say that what they learned changed the way they think aboutdiet or exercise.
Younger Latinos and women are more receptive to these types of changes than areolder Hispanics or men. And while immigrants (69 percent) are more likely to saythat health information from the television, radio, newspapers or the Internet ledthem to change how they think about diet and exercise, a majority of native-bornHispanics (56 percent) also report making changes in how they think about nutrition and physical activity because of what they learned from the media.

Hispanics and Health Care in the United States: Access, Information and Knowledge35
� � � � CHAPTER 4 – HOW MUCH DO HISPANICS KNOW ABOUT DIABETES?
According to the American Diabetes Association, millions of Americans are unaware that they have diabetes. Although there is no cure for diabetes, people who know they have the disease often can keep it under control, and reduce the risk of serious side effects or death, through treatment that includesdiet and medication.
Three-quarters (76 percent) of Hispanics know that there are effective treatmentsfor diabetes that reduce the chances of death or serious side effects; the sameshare correctly say there is no medicine or treatment “that can permanently fixit.” A slightly lower share (72 percent) of Hispanics is aware that maintaining ahealthy weight is more helpful in preventing diabetes than avoiding all sugar.Seven in 10 Latinos (71 percent) say correctly that even people without a familyhistory of diabetes have a risk of developing it.
These findings emerge from a battery of eight questions testing basic knowledgeabout the causes, symptoms and treatment of diabetes. Although most Latinos doreasonably well (58 percent answered at least six questions correctly), a sizeable minority faltered on the test with nearly a third (32 percent) giving three to fivecorrect answers and 10 percent scoring even lower.
Among the less knowledgeableHispanics are men, Spanishspeakers and Latinos who are foreign born. The best-informedHispanics about diabetes arethose with at least some collegeeducation, or with high levels ofassimilation—U.S. citizens andlong-term immigrants. Hispanicswho have been diagnosed with diabetes score higher on the knowl-edge test than other Latinos, but a
DIABETES KNOWLEDGE BATTERY SCORING � High: Respondents answered at least
six out of eight questions correctly.
� Medium: Respondents answered three to five questions correctly.
� Low: Respondents answered two or fewer questions correctly.
Diabetes Knowledge Battery
As far as you know, are any of the following a symptom of diabetes?• Frequent urination • Increased fatigue • Excessive thirst • Blurry vision
As far as you know, is there a cure for diabetes, meaning that there is a medicine or a treatment that can permanently fix it?
Once someone has been diagnosed with diabetes, do you happen to know whether there are effective treatments that will significantly reduce the chances of blindness, death or otherserious complications?
What’s more helpful in preventing diabetes? (1) Avoiding all sugar (2) Maintaining a healthyweight.
If none of your relatives has a history of diabetes, do you have a risk of getting it yourself?

Hispanics and Health Care in the United States: Access, Information and Knowledge36
� � � �
notable share (27 percent) answered at least three of the eight questions wrong.Having health insurance and a regular health care provider are both associatedwith more diabetes knowledge but they do not guarantee being well-informed.Similarly, obtaining health information from medical personnel is associatedwith higher levels of knowledge but certainly does not guarantee them. Obtaininghealth information from some other sources is also associated with higher levelsof diabetes knowledge. Respondents who report obtaining health informationfrom family and friends and from print media, in particular, score better on thebattery of diabetes knowledge questions.
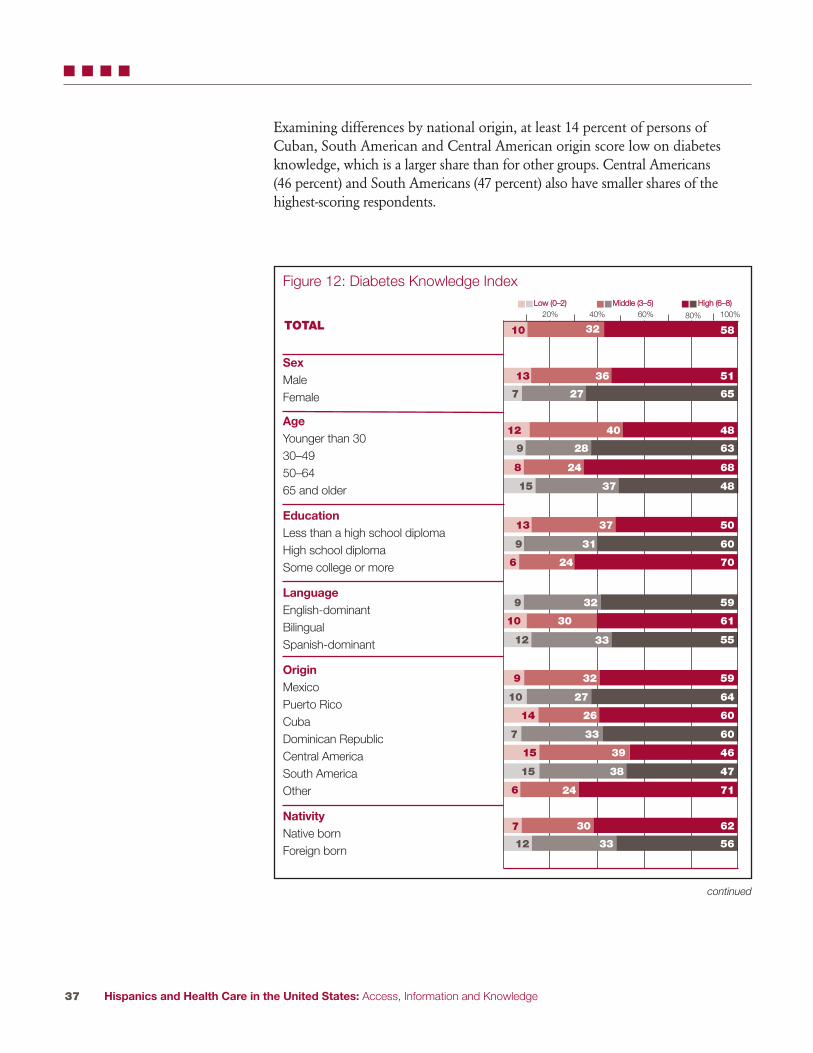
Knowledge Differences by Demographic GroupThere are notable differences by demographic characteristic in which Hispanicsscore high (six to eight correct answers), medium (three to five correct answers) or low (two or fewer correct answers) on a battery of eight questions testing basic diabetes knowledge.
About two-thirds of women (65 percent) correctly answer six or more questions,compared with half (51 percent) of men. Men also are more likely to get a lowscore, 13 percent compared with 7 percent of women.
The youngest and oldest Latinos know less than those in the middle: 48 percentof those ages 18–29 and 65 and older score well, compared with substantial majorities of those ages 30 to 49 (63 percent) and 50 to 64 (68 percent). Among theoldest Hispanics, 15 percent score low, a larger share than for other age groups.
There are differences across several demographic measures that point to greaterknowledge by more assimilated, established Hispanics.
Looking at differences by education level, 13 percent of Latinos who did notcomplete high school score low on diabetes knowledge, compared with 6 percentof those with at least some college education. Although half of Latinos without ahigh school diploma score high, that compares with 70 percent of those with at
least some college education.
Similarly, U.S.-born Hispanics are more likely to scorehigh on diabetes knowledge (62 percent) than thosewho are foreign born or Puerto Rican (56 percent).When responses are analyzed by citizenship status, naturalized citizens are more likely to score high (60percent) than are legal permanent residents (55 percent)or immigrants who are neither citizens nor legal permanent residents (48 percent). Among long-term
immigrants, those who have been in the country for 15 years or more, 61 percentscore high, compared with about half of shorter-term immigrants.
Nativity and assimilation are associated with higher levels of diabetes knowledge.
Hispanics and Health Care in the United States: Access, Information and Knowledge37
� � � �
Examining differences by national origin, at least 14 percent of persons ofCuban, South American and Central American origin score low on diabetesknowledge, which is a larger share than for other groups. Central Americans (46 percent) and South Americans (47 percent) also have smaller shares of the highest-scoring respondents.
Figure 12: Diabetes Knowledge Index
SexMaleFemale
AgeYounger than 3030–4950–6465 and older
EducationLess than a high school diplomaHigh school diplomaSome college or more
LanguageEnglish-dominantBilingualSpanish-dominant
Origin MexicoPuerto RicoCubaDominican RepublicCentral AmericaSouth AmericaOther
NativityNative bornForeign born
20% 40% 60%
513613
65277
484012
68248
63289
503713
70246
483715
60319
613010
59329
59329
553312
642710
602614
60337
463915
473815
71246
MMiiddddllee ((33––55)) HHiigghh ((66––88))LLooww ((00––22))
continued
100%
62307
563312
583210TOTAL80%

20% 40% 60% 100%80%
Figure 12: Diabetes Knowledge Index, continued
CitizenshipNative-born citizenNaturalizedLegal permanent resident (LPR)Foreign born, not LPR
Years in U.S. (Foreign born only)Less than 55–910–1415 or more
Usual health care providerHasDoes not have
Health insuranceInsuredUninsured
Respondent has diabetesYesNo
Respondent, family member or close friend has diabetesYesNo
Health information sourcesDoctor or other medical professionalTelevisionRadioInternetPrint mediaFamily or friendsChurches or community groups
62308
553410
603010
503614
483912
483516
493516
61309
61309
613010
503614
553511
62308
61309
62307
65296
65278
MMiiddddllee ((33––55)) HHiigghh ((66––88))LLooww ((00––22))
62308
73243
573310
553311
67285
443818
Hispanics and Health Care in the United States: Access, Information and Knowledge38
� � � �
Note: Percentage may not total 100 due to rounding and the exclusion of “don’t know” and “refused”responses.

Hispanics and Health Care in the United States: Access, Information and Knowledge39
� � � �
Knowledge Differences by Insurance Status and Health Care Access Hispanics with health insurance are somewhat more likely to score high thanthose without insurance (61 percent versus 55 percent), but they are no less likely to get a low diabetes knowledge score than respondents with no insurance. There are, however, differences between Hispanics with and without a usualsource of care: 61 percent of those with a usual source score high, compared with 50 percent of those who have no usual provider. A higher share of Latinos(14 percent) with no usual source of care scores low, as compared with Hispanicswho do have a usual source of care (9 percent). Among those with a usualprovider, the type of place where care is obtained also factors into diabetesknowledge. Respondents who visit a doctor regularly score better on diabetesknowledge questions than respondents who primarily visit clinics for their care;65 percent score high, as compared with 57 percent of respondents who frequent clinics.
Knowledge Differences by Sources of InformationLatinos who get a lot of health information from doctors are more likely to scorehigh (65 percent) on diabetes knowledge than those who get little (59 percent) orno information (49 percent) from doctors. Those who get a lot of informationfrom newspapers and magazines also are more likely to score high (69 percent)than those who get no information from those sources (50 percent). Those whoget a lot of information from family and friends or the Internet also are morelikely to score higher (62 percent and 71 percent, respectively) than those who do not (51 percent and 54 percent).
However, the gap in persons scoring high on diabetes knowledge is smaller whencomparing respondents who report getting a lot of health information from television (59 percent) with those who report getting no health information from television (52 percent). The same is true for radio: 60 percent of those whoget a lot of health information from radio score high, compared with 55 percentwho get no health information from radio. Among those who get a lot of information from churches or community groups, a larger share scores low(58 percent) than high (52 percent).*
* Even when controlling for educational differences, the association between diabetes knowledge and use ofcertain information sources persisted. Latinos who get a lot of information from doctors, family and friends,radio and print still scored better than those who do not.

Hispanics and Health Care in the United States: Access, Information and Knowledge40
� � � �
When these responses are analyzed another way—comparing people who get atleast some health information from any source with those obtaining no health information from any source—getting information is associated with betterknowledge scores. One in four Hispanics who get no health information scorelow on diabetes knowledge, compared with one in 11 who get at least some information. Four in 10 of those who get no health information score high on diabetes knowledge, compared with six in 10 of those who get at least some information from any source.
Composition of the Low-Scoring GroupThis section will look at the survey data on diabetes knowledge from another per-spective: The makeup of the low-scoring group. Although less educated and lessassimilated Hispanics generally score lower on a test of diabetes knowledge, theleast knowledgeable group also includes a notable share of higher-status Latinos.
Nearly two-thirds of the low-scoring group (65 percent) are men. A third of thelow scorers are ages 18–29, a slightly higher share (38 percent) are ages 30–49, 12 percent are ages 50–64, and the remaining 12 percent are 65 years and older.
Half of the group that knows little about diabetes consists of Hispanics who didnot complete high school. High school graduates account for 27 percent andLatinos with at least some college education make up 15 percent.
Foreign-born Hispanics account for more than seven in 10 of the low-scoringgroup. The foreign-born low-scoring group is split nearly evenly into citizens (20 percent of all low scorers), legal permanent residents (22 percent) and persons
lacking citizenship or legal permanent residency(26 percent). Although Spanish speakers account fornearly half of low scorers (47 percent), one in five areEnglish-dominant and one in three are bilingual.
Most Hispanics who score low on the knowledge testabout diabetes have health insurance (59 percent), and a usual place to go for medical care (63 percent).About six in 10 of the low-scoring group (58 percent)say they get health information from medical professionals.
The majority of Hispanics scoring low on the diabetesknowledge index have health insuranceor a usual health care provider.

20% 40% 60% 80% 100%
Hispanics and Health Care in the United States: Access, Information and Knowledge41
� � � �
65
35
33
38
12
12
50
15
27
20
47
34
58
8
6
2
14
3
9
27
73
32
20
22
26
16
23
14
43
Figure 13: Profile of Persons Scoring Low on Diabetes Knowledge Index
SexMaleFemale
Age18–2930–4950–6465 and older
EducationLess than a high school diplomaHigh school diplomaSome college or more
LanguageEnglish-dominantBilingualSpanish-dominant
Origin MexicoPuerto RicoCubaDominican RepublicCentral AmericaSouth AmericaOther
NativityNative bornForeign born
CitizenshipNative-born citizenNaturalizedLegal permanent resident (LPR)Foreign born, not LPR
Years in U.S. (Foreign born only)Less than 55–910–1415 or more
Low (0–2)
continued
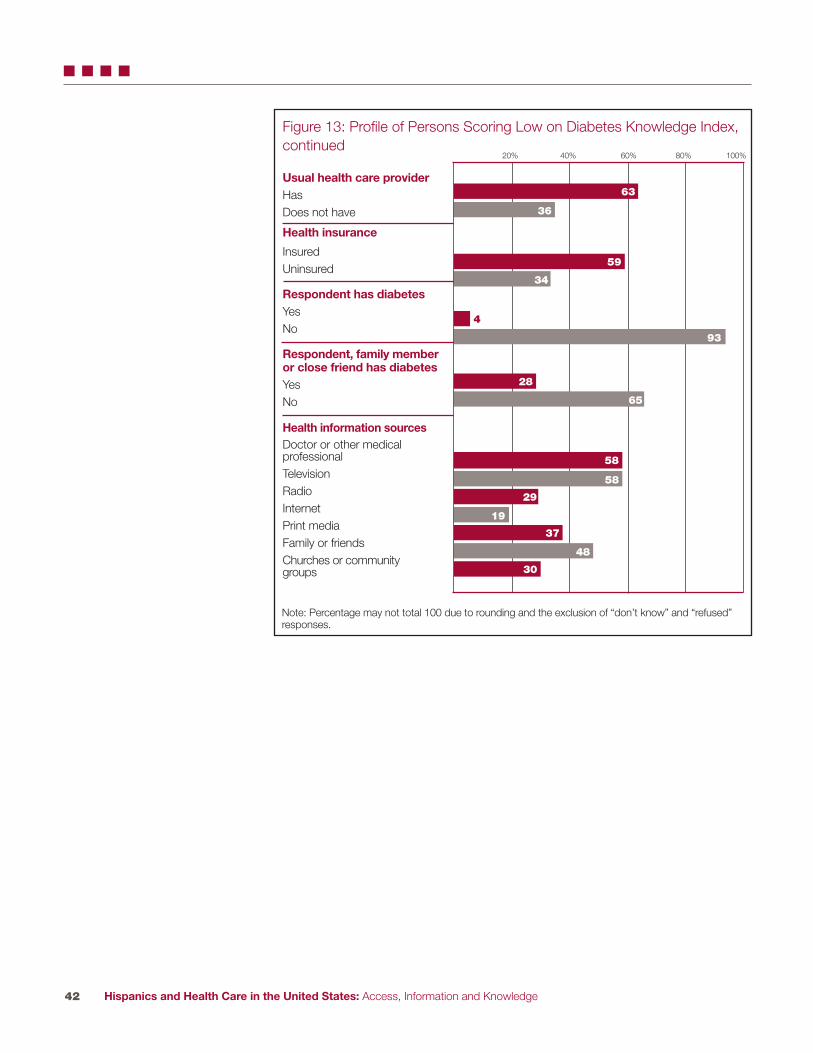
Hispanics and Health Care in the United States: Access, Information and Knowledge42
� � � �
Figure 13: Profile of Persons Scoring Low on Diabetes Knowledge Index,continued
Usual health care providerHas Does not have
Health insurance
InsuredUninsured
Respondent has diabetesYesNo
Respondent, family memberor close friend has diabetesYesNo
Health information sourcesDoctor or other medical professionalTelevisionRadioInternetPrint mediaFamily or friendsChurches or community groups
20% 40% 60% 80% 100%
59
34
4
93
28
65
58
29
58
37
19
48
30
63
36
Note: Percentage may not total 100 due to rounding and the exclusion of “don’t know” and “refused”responses.
Hispanics and Health Care in the United States: Access, Information and Knowledge43
� � � �
Diabetics’ Knowledge of Diabetes Diabetics are more likely to know the basic facts about their condition than thegeneral population does, but not all diabetics are well-informed: 73 percent scorehigh on the knowledge test, 24 percent get a medium score and 3 percent get alow score.
Generally, diabetics have the same pattern of answersas the general population, but at higher levels ofknowledge. For example, they are more likely to know that blurry vision is a symptom (82 percent)than increased fatigue (69 percent). However, diabeticsare no more likely than all Hispanics (76 percent) to know that effective treatments are available to reduce the chances of blindness, death or other serious complications. Nor are they more likely toknow that maintaining a healthy weight is a betterway to prevent diabetes than avoiding sugar intake(71 percent of diabetics are aware of this, as compared
with 72 percent of non-diabetics).
With diabetics, as in the general population, the most educated and establishedHispanics score the highest on a test of knowledge about diabetes. Eighty-six percent of diabetic Hispanics with at least some college education score high onthe knowledge battery, compared with 71 percent of people lacking a high schooldiploma, and diabetics with regular care providers are more likely to score high(75 percent) than those without a usual place for care (66 percent).
Twenty-seven percentof diabetics correctlyanswered fewer thansix out of eight questions on the diabetes knowledgebattery.

Hispanics and Health Care in the United States: Access, Information and Knowledge44
� REFERENCES
1 Passel J, and Cohn D’Vera. “U.S. Population Projections: 2005–2050.” Pew Research Center, 2008.
2 www.diabetes.org. American Diabetes Association. Accessed 6/18/2008.
3 Pleis JR, and Lethbridge-Cejku M. “Summary Health Statistics for U.S.Adults: National Health Interview Survey, 2006.” National Center for Health Statistics Vital and Health Statistics Series 10:235, 2007.
4 National Diabetes Fact Sheet: General Information and National Estimates on Diabetes in the United States, 2005. Centers for Disease Control and Prevention, 2005.
5 www.cdc.gov/nccdphp/overview.htm. Chronic Disease Overview. Accessed 4/8/2008.
6 The Power of Prevention: Reducing the Health and Economic Burden of Chronic Disease. Centers for Disease Control and Prevention, 2003.
7 www.census.gov/Press-Release/www/releases/archives/population/011910.html. “U.S. Hispanic Population Surpasses 45 Million—Now 15 Percent of Total.” U.S. Census Bureau Press Release. Accessed 6/2/2008.
8 Passel et al.
9 Passel et al.
10 www.diabetes.org et al.
11 The Power of Prevention et al.
12 Pleis et al.
13 Zuvekas S, and Taliaferro G. “Pathways to Access: Health Insurance, The Health Care Delivery System, and Racial/Ethnic Disparities, 1996–1999.” Health Affairs 22: 139–153, 2003.
14 Pleis et al.
15 Fox S, and Livingston, G. “Latinos Online.” Pew Hispanic Center and Pew Internet and American Life Project, 2007.

Hispanics and Health Care in the United States: Access, Information and Knowledge45
� APPENDIX A: METHODOLOGY
The Pew Hispanic Center conducted a public opinion survey among people of Latino background or descent that was designed to elicit opinions on issuesrelated to health care. To fully represent the opinions of Latino people living inthe United States, ICR conducted interviews with a statistically representativesample of Latinos so they could be examined nationally.
The study was conducted for the Pew Hispanic Center via telephone by ICR,an independent research company. Interviews were conducted from July 16 toSeptember 23, 2007, among a nationally representative sample of 4,013 Latinorespondents ages 18 and older. Of those respondents, 1,625 were native born(including Puerto Rico) and 2,378 were foreign born (excluding Puerto Rico).The margin of error for total respondents is +/-1.83 at the 95 percentconfidence level. The margin of error for native-born respondents is +/-3.42 at the 95 percent confidence level. The margin of error for foreign-born respondents is +/- 2.11 at the 95 percent confidence level.
For this survey, ICR maintained a staff of Spanish-speaking interviewers whom,when contacting a household, were able to offer respondents the option ofcompleting the survey in Spanish or in English. A total of 1,320 respondentswere surveyed in English and 2,639 in Spanish (and 54 were interviewedequally in both languages).
Eligible RespondentThe survey was administered to any male or female age 18 and older who is of Latino origin or descent.
Field PeriodThe field period for this study was July 16 to September 23, 2007. The interviewing was conducted by ICR/International Communications Research in Media, Pennsylvania. All interviews were conducted using theComputer Assisted Telephone Interviewing (CATI) system. The CATI systemensured that questions followed logical skip patterns and that the listed attributes automatically rotated, eliminating “question position” bias.

Hispanics and Health Care in the United States: Access, Information and Knowledge46
� APPENDIX A: METHODOLOGY
Sampling Methodology
A stratified sample via the Optimal Sample Allocation sampling technique was used for the survey. By utilizing a stratified sample, one sample source wasused to complete all interviews. This technique provides a highly accurate sampling frame, thereby reducing the cost per effective interview. In this case,we examined a list of all telephone exchanges within a target area (national, bystate, etc.) and listed them based on concentration of Latino households. We then divided these exchanges into various groups, or strata.
Consequently, we used a disproportionate stratified RDD sample of Latinohouseholds. The primary stratification variables are the estimates of Latinohousehold incidence and heritage in each NPA-NXX (area code and exchange)as provided by the GENESYS System—these estimates are derived from Claritas and are updated at the NXX level with each quarterly GENESYS database update. The basic procedure was to rank all NPA-NXXs in the U.S. bythe incidence of Latino households. This produced strata that were called VeryHigh, High, Medium, and Low Latino. These strata were then run against InfoUSA and other listed databases, and then scrubbed against known Latinosurnames. Any “hits” were subdivided into a “surname” strata, with all othersample remaining in their originally designated strata. Overall, then, the studyemployed five strata. It is important to note that the existence of surnamestrata does not mean this was a surname sample design. The sample is RDD;telephone numbers were then divided by whether they were found to be associated with or without a Latino surname. This was done simply to increasethe number of strata (thereby increasing the control we have to meet ethnictargets) and to ease administration (allowing for more effective assignment ofinterviewers and labor hours).
For purposes of estimation, we employed an optimal allocation scheme. This“textbook” approach allocates interviews to a stratum proportionate to thenumber of Latino HH, but inversely proportionate to the square root of therelative cost, the relative cost in this situation being a simple function of the incidence. As such, the number of completed interviews increases as you movefrom a lower incidence strata to higher incidence strata. Again, this is a known,formulaic approach to allocation that provides a starting point for discussions ofsample allocation and associated costs. We have also provided estimates of the“effective sample size” associated with the resultant disproportionate allocation.
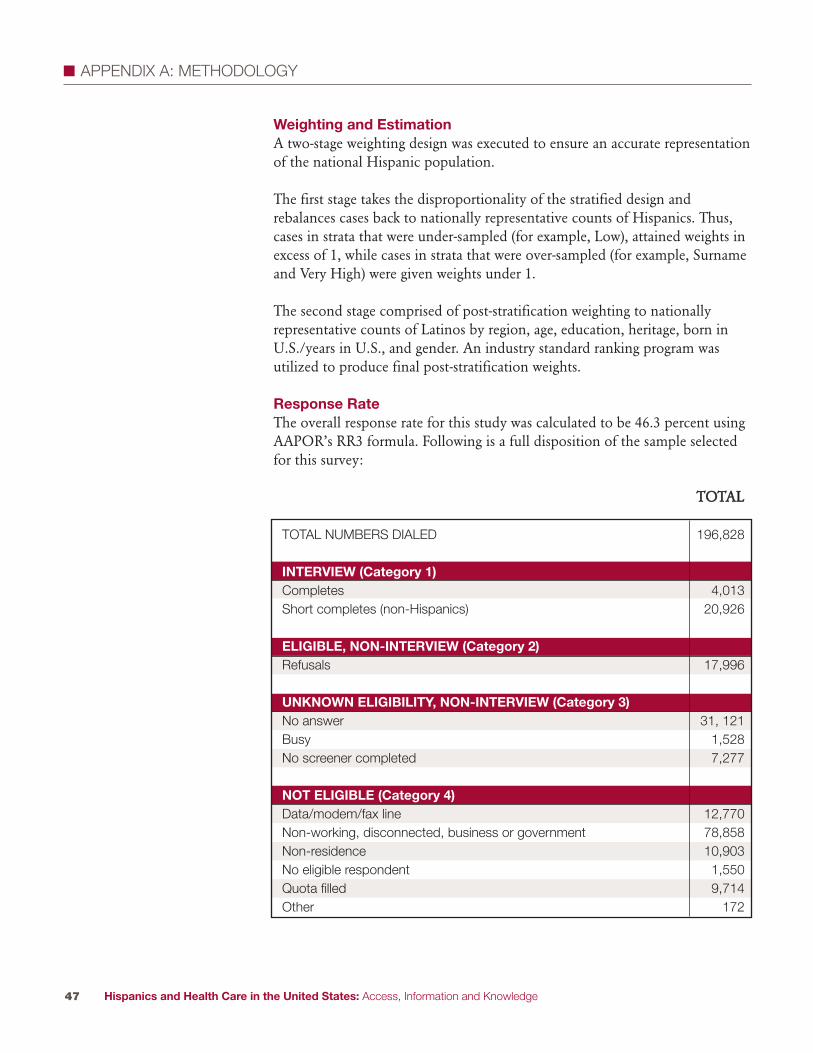
Hispanics and Health Care in the United States: Access, Information and Knowledge47
� APPENDIX A: METHODOLOGY
Weighting and EstimationA two-stage weighting design was executed to ensure an accurate representationof the national Hispanic population.
The first stage takes the disproportionality of the stratified design and rebalances cases back to nationally representative counts of Hispanics. Thus,cases in strata that were under-sampled (for example, Low), attained weights inexcess of 1, while cases in strata that were over-sampled (for example, Surnameand Very High) were given weights under 1.
The second stage comprised of post-stratification weighting to nationally representative counts of Latinos by region, age, education, heritage, born inU.S./years in U.S., and gender. An industry standard ranking program was utilized to produce final post-stratification weights.
Response RateThe overall response rate for this study was calculated to be 46.3 percent usingAAPOR’s RR3 formula. Following is a full disposition of the sample selectedfor this survey:
TTOOTTAALL
TOTAL NUMBERS DIALED 196,828
INTERVIEW (Category 1)Completes 4,013Short completes (non-Hispanics) 20,926
ELIGIBLE, NON-INTERVIEW (Category 2)Refusals 17,996
UNKNOWN ELIGIBILITY, NON-INTERVIEW (Category 3)No answer 31, 121Busy 1,528No screener completed 7,277
NOT ELIGIBLE (Category 4)Data/modem/fax line 12,770Non-working, disconnected, business or government 78,858Non-residence 10,903No eligible respondent 1,550Quota filled 9,714Other 172

Hispanics and Health Care in the United States: Access, Information and Knowledge48
� � APPENDIX B: DETAILED TABLES
Access to Health Care (row %)
Connected DisconnectedTOTAL 73 27
SexMale 63 36Female 83 17
Age18–29 63 3730–49 73 2650–64 83 1665 and older 86 13
EducationLess than a high school diploma 68 32High school diploma 72 27Some college or more 80 19
EmploymentEmployed 70 30Unemployed 72 28Not in labor force 80 20
Household incomeLess than $30,000 69 31$30,000–$49,999 73 26$50,000 or more 84 16Income missing 70 29
Marital statusMarried/Has a partner 75 25Widowed/Divorced/Separated 77 23Single 62 37
RegionNortheast 77 22North Central 74 25South 69 30West 74 26
AreaUrban 72 28Suburban 75 25Rural 73 26
LanguageEnglish-dominant 77 22Bilingual 75 25Spanish-dominant 68 32
continued
Note: “Not in labor force” includes those who reported that they were a homemaker or stay-at-homeparent, retired or a student.

Hispanics and Health Care in the United States: Access, Information and Knowledge49
� � APPENDIX B: DETAILED TABLES
Origin Mexico 70 29Puerto Rico 84 16Cuba 76 24Dominican Republic 79 21Central America 68 31South America 76 23Other 83 17
NativityNative born 77 22Foreign born 70 30
GenerationFirst 70 30Second 77 23Third or higher 78 21
CitizenshipNative-born citizen 78 22Naturalized 79 21Legal permanent resident (LPR) 69 31Foreign born, not LPR 57 43
Years in U.S. (Foreign born only)Less than 5 51 495–9 60 4010–14 68 3115 or more 79 21
Health insuranceInsured 81 19Uninsured 58 42
Access to Health Care, continued(row %)
Note: Percentage may not total 100 due to rounding and the exclusion of “don’t know” and “refused”responses.

Hispanics and Health Care in the United States: Access, Information and Knowledge50
� � APPENDIX B: DETAILED TABLES
Access to Health Care (column %)
Connected DisconnectedTOTAL 100 100
SexMale 45 69Female 55 31
Age18–29 26 4130–49 44 4350–64 18 965 and older 10 4
EducationLess than a high school diploma 37 47High school diploma 32 32Some college or more 29 18
Employment Employed 60 69Unemployed 7 7Not in labor force 31 21
Household incomeLess than $30,000 44 53$30,000–$49,999 19 18$50,000 or more 21 11Income missing 16 18
Marital statusMarried/Has a partner 63 56Widowed/Divorced/Separated 19 15Single 17 28
RegionNortheast 16 12North Central 8 7South 35 41West 42 40
AreaUrban 70 72Suburban 20 18Rural 11 10
LanguageEnglish-dominant 25 20Bilingual 36 32Spanish-dominant 38 48
continued
Note: “Not in labor force” includes those who reported that they were a homemaker or stay-at-homeparent, retired or a student.
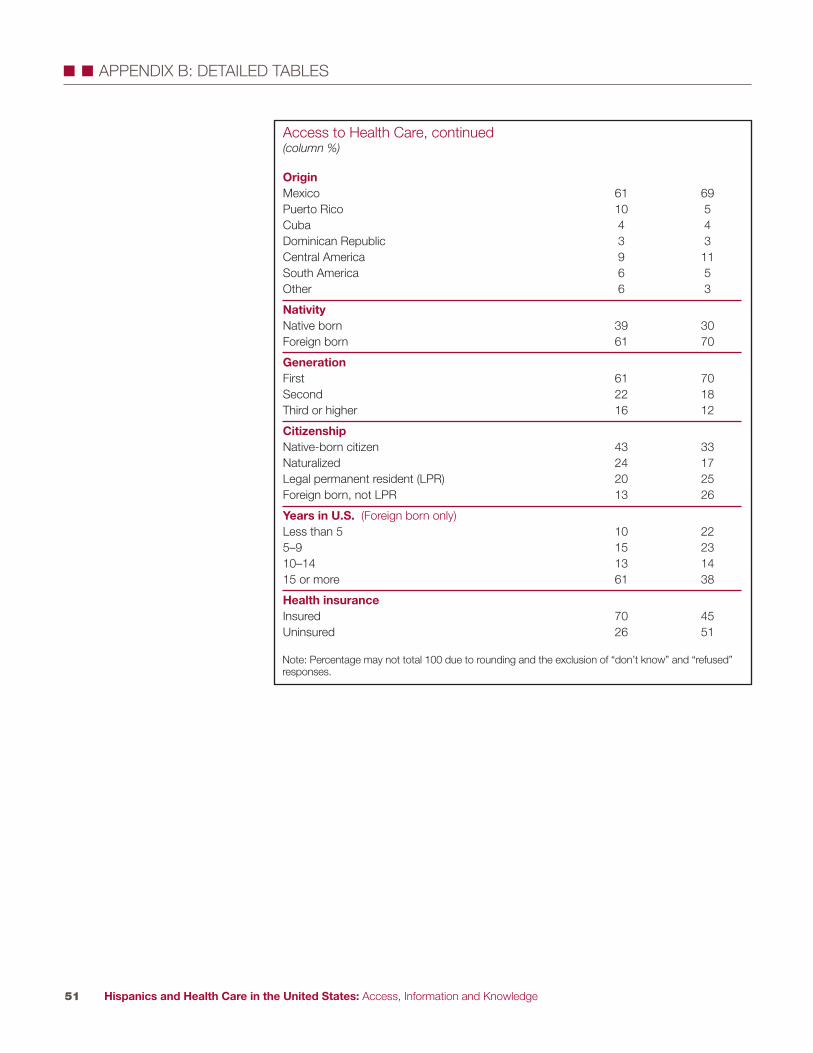
Hispanics and Health Care in the United States: Access, Information and Knowledge51
� � APPENDIX B: DETAILED TABLES
Access to Health Care, continued(column %)
Origin Mexico 61 69Puerto Rico 10 5Cuba 4 4Dominican Republic 3 3Central America 9 11South America 6 5Other 6 3
NativityNative born 39 30Foreign born 61 70
GenerationFirst 61 70Second 22 18Third or higher 16 12
CitizenshipNative-born citizen 43 33Naturalized 24 17Legal permanent resident (LPR) 20 25Foreign born, not LPR 13 26
Years in U.S. (Foreign born only)Less than 5 10 225–9 15 2310–14 13 1415 or more 61 38
Health insuranceInsured 70 45Uninsured 26 51
Note: Percentage may not total 100 due to rounding and the exclusion of “don’t know” and “refused”responses.
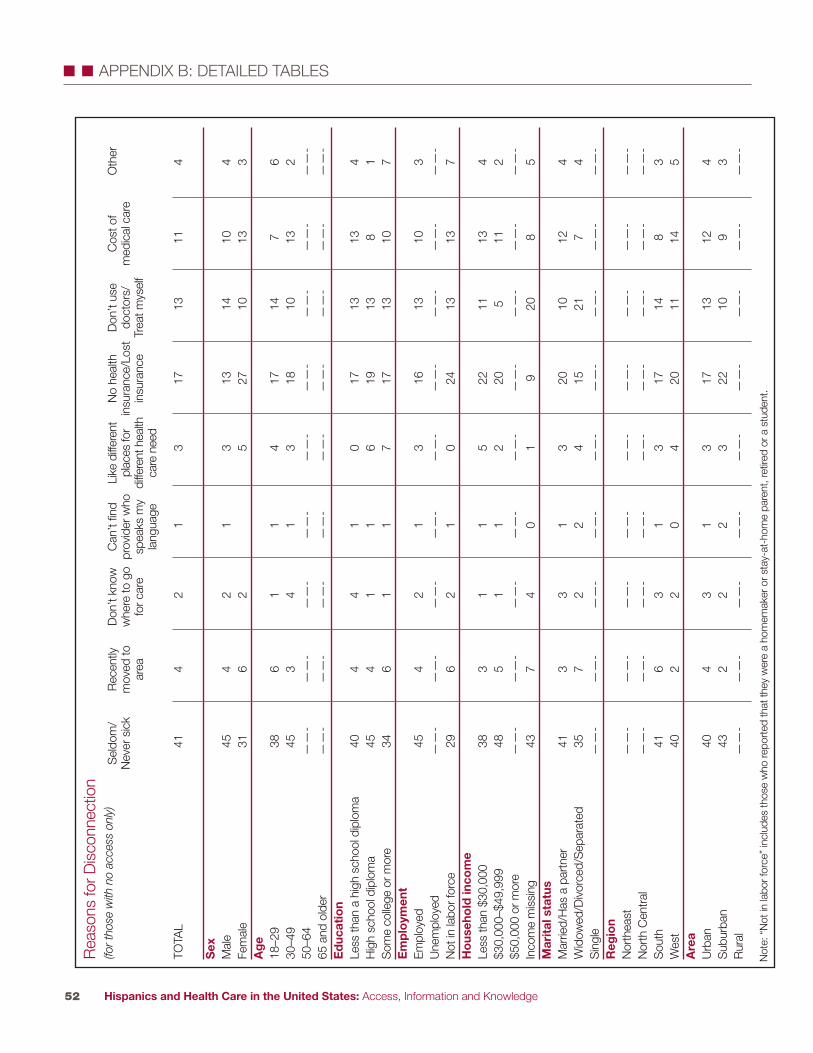
Hispanics and Health Care in the United States: Access, Information and Knowledge52
� � APPENDIX B: DETAILED TABLES
TOTA
L41
42
13
1713
114
Sex
Mal
e45
42
13
1314
104
Fem
ale
316
25
2710
133
Age
18–2
938
61
14
1714
76
30–4
945
34
13
1810
132
50–6
4—
—-
——
-—
—-
——
-—
—-
——
-—
—-
——
-—
—-
65 a
nd o
lder
——
-—
—-
——
-—
—-
——
-—
—-
——
-—
—-
——
-Education
Less
than
a h
igh
scho
ol d
iplo
ma
404
41
017
1313
4H
igh
scho
ol d
iplo
ma
454
11
619
138
1S
ome
colle
ge o
r mor
e34
61
17
1713
107
Employment
Empl
oyed
454
21
316
1310
3U
nem
ploy
ed—
—-
——
-—
—-
——
-—
—-
——
-—
—-
——
-—
—-
Not
in la
bor f
orce
296
21
024
1313
7Household income
Less
than
$30
,000
383
11
522
1113
4$3
0,00
0–$4
9,99
948
51
12
205
112
$50,
000
or m
ore
——
-—
—-
——
-—
—-
——
-—
—-
——
-—
—-
——
-In
com
e m
issi
ng43
74
01
920
85
Marital status
Mar
ried/
Has
a p
artn
er41
33
13
2010
124
Wid
owed
/Div
orce
d/S
epar
ated
357
22
415
217
4S
ingl
e—
—-
——
-—
—-
——
-—
—-
——
-—
—-
——
-—
—-
Region
Nor
thea
st—
—-
——
-—
—-
——
-—
—-
——
-—
—-
——
-—
—-
Nor
th C
entr
al—
—-
——
-—
—-
——
-—
—-
——
-—
—-
——
-—
—-
Sou
th41
63
13
1714
83
Wes
t40
22
04
2011
145
Area
Urb
an40
43
13
1713
124
Sub
urba
n43
22
23
2210
93
Rur
al—
—-
——
-—
—-
——
-—
—-
——
-—
—-
——
-—
—-
Rea
sons
for D
isco
nnec
tion
(for tho
se w
ith no ac
cess only)
Sel
dom
/N
ever
sic
kR
ecen
tlym
oved
toar
ea
Don
’t kn
oww
here
to g
ofo
r car
e
Can
’t fin
dpr
ovid
er w
hosp
eaks
my
lang
uage
Like
diff
eren
tpl
aces
for
diffe
rent
hea
lthca
re n
eed
No
heal
th
insu
ranc
e/Lo
stin
sura
nce
Don
’t us
edo
ctor
s/Tr
eat m
ysel
f
Cos
t of
med
ical
car
eO
ther
Not
e: “
Not
in la
bor f
orce
” in
clud
es th
ose
who
repo
rted
that
they
wer
e a
hom
emak
er o
r sta
y-at
-hom
e pa
rent
, ret
ired
or a
stu
dent
.

Hispanics and Health Care in the United States: Access, Information and Knowledge53
� � APPENDIX B: DETAILED TABLES
Language
Engl
ish-
dom
inan
t—
—-
——
-—
—-
——
-—
—-
——
-—
—-
——
-—
—-
Bilin
gual
393
32
420
1111
3S
pani
sh-d
omin
ant
454
31
116
1312
4Origin
Mex
ico
423
21
217
1510
4P
uerto
Ric
o—
—-
——
-—
—-
——
-—
—-
——
-—
—-
——
-—
—-
Cub
a—
—-
——
-—
—-
——
-—
—-
——
-—
—-
——
-—
—-
Dom
inic
an R
epub
lic—
—-
——
-—
—-
——
-—
—-
——
-—
—-
——
-—
—-
Cen
tral
Am
eric
a—
—-
——
-—
—-
——
-—
—-
——
-—
—-
——
-—
—-
Sou
th A
mer
ica
——
-—
—-
——
-—
—-
——
-—
—-
——
-—
—-
——
-O
ther
——
-—
—-
——
-—
—-
——
-—
—-
——
-—
—-
——
-Nativity
Nat
ive
born
345
11
617
187
5Fo
reig
n bo
rn44
43
12
1811
123
Generation
Firs
t44
43
12
1811
123
Sec
ond
——
-—
—-
——
-—
—-
——
-—
—-
——
-—
—-
——
-Th
ird o
r hig
her
——
-—
—-
——
-—
—-
——
-—
—-
——
-—
—-
——
-Citizenship
Nat
ive-
born
citi
zen
345
11
716
187
5N
atur
aliz
ed43
22
12
1610
144
Lega
l per
man
ent r
esid
ent (
LPR
)42
61
12
2013
103
Fore
ign-
born
, not
LP
R46
35
12
1710
133
Years in U.S.(
Fore
ign
born
onl
y)Le
ss th
an 5
468
51
213
1011
45–
941
22
21
2013
152
10–1
445
21
123
612
615
or m
ore
433
31
417
1312
2Health insurance
Insu
red
485
21
47
178
6U
nins
ured
354
21
325
1113
3
Rea
sons
for D
isco
nnec
tion,
con
tinue
d(fo
r tho
se w
ith no ac
cess only)
Sel
dom
/N
ever
sic
kR
ecen
tlym
oved
toar
ea
Don
’t kn
oww
here
to g
ofo
r car
e
Can
’t fin
dpr
ovid
er w
hosp
eaks
my
lang
uage
Like
diff
eren
tpl
aces
for
diffe
rent
hea
lthca
re n
eed
No
heal
th
insu
ranc
e/Lo
stin
sura
nce
Don
’t us
edo
ctor
s/Tr
eat m
ysel
f
Cos
t of
med
ical
car
eO
ther
Not
e: P
erce
ntag
e m
ay n
ot to
tal 1
00 d
ue to
roun
ding
and
the
excl
usio
n of
“do
n’t k
now
” an
d “r
efus
ed”
resp
onse
s.

Hispanics and Health Care in the United States: Access, Information and Knowledge54
� � APPENDIX B: DETAILED TABLES
TOTAL 43 49 4 1 2
SexMale 41 50 6 1 2Female 45 49 3 1 2
Age18–29 49 43 5 0 330–49 42 52 3 1 250–64 42 52 4 1 165 and older 36 53 8 1 1
EducationLess than a high school diploma 58 36 4 0 2High school diploma 44 48 5 1 2Some college or more 24 68 4 1 3
EmploymentEmployed 40 52 4 1 2Unemployed 42 48 5 1 5Not in labor force 49 44 5 0 1
Household incomeLess than $30,000 56 37 4 0 3$30,000–$49,999 40 54 3 2 2$50,000 or more 19 75 4 2 1Income missing 45 45 7 0 2
Marital statusMarried/Has a partner 43 50 4 1 2Widowed/Divorced/Separated 44 49 4 2 1Single 42 48 7 0 3
RegionNortheast 36 58 5 0 1North Central 50 45 4 0 1South 36 56 4 0 3West 51 42 4 2 2
AreaUrban 43 49 6 1 2Suburban 41 54 3 2 1Rural 49 44 4 0 3
LanguageEnglish-dominant 29 61 5 2 3Bilingual 36 56 5 1 2Spanish-dominant 60 35 3 0 1
Usual Place of Care for Those with Access (connected only)
CommunityClinic orHealth Center
Doctor’s Office
HospitalOutpatient
Department
HMO Other
continued
Note: “Not in labor force” includes those who reported that they were a homemaker or stay-at-home parent, retired or a student.

Hispanics and Health Care in the United States: Access, Information and Knowledge55
� � APPENDIX B: DETAILED TABLES
OriginMexico 49 44 4 1 2Puerto Rico 27 64 5 2 2Cuba 33 58 7 1 0Dominican Republic 39 52 10 0 0Central America 50 44 4 1 2South America 29 64 5 0 1Other 29 65 1 1 3
NativityNative born 28 63 5 2 2Foreign born 53 41 4 0 2
GenerationFirst 53 41 4 0 2Second 30 62 6 1 1Third or higher 26 64 4 3 3
CitizenshipNative-born citizen 29 62 5 2 2Naturalized 42 51 4 0 3Legal permanent resident (LPR) 59 37 3 0 1Foreign born, not LPR 71 24 2 1 2
Years in U.S. (Foreign born only)Less than 5 64 31 3 1 25–9 65 29 3 1 210–14 63 32 3 0 215 or more 46 48 4 0 2
Health insuranceInsured 38 55 4 1 2Uninsured 57 35 5 0 3
Usual Place of Care for Those with Access, continued(connected only)
CommunityClinic orHealth Center
Doctor’s Office
HospitalOutpatient
Department
HMO Other
Note: Percentage may not total 100 due to rounding and the exclusion of “don’t know” and “refused”responses.
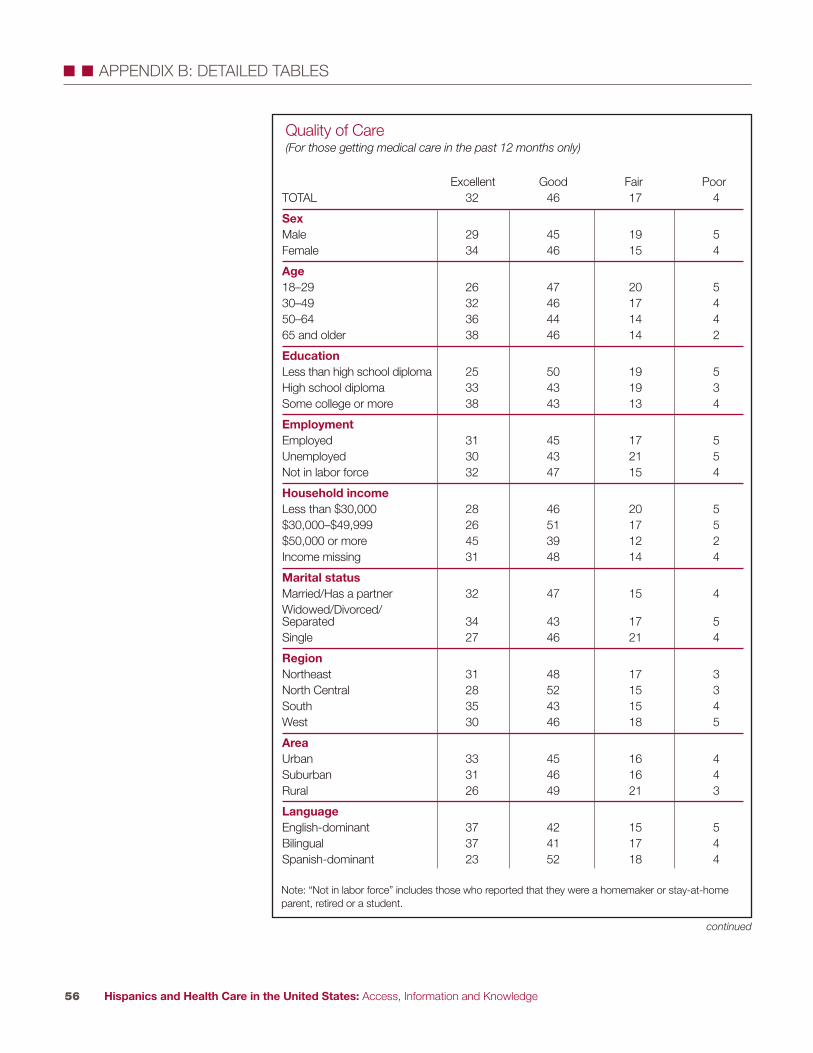
Hispanics and Health Care in the United States: Access, Information and Knowledge56
� � APPENDIX B: DETAILED TABLES
TOTAL 32 46 17 4
SexMale 29 45 19 5Female 34 46 15 4
Age18–29 26 47 20 530–49 32 46 17 450–64 36 44 14 465 and older 38 46 14 2
EducationLess than high school diploma 25 50 19 5High school diploma 33 43 19 3Some college or more 38 43 13 4
EmploymentEmployed 31 45 17 5Unemployed 30 43 21 5Not in labor force 32 47 15 4
Household incomeLess than $30,000 28 46 20 5$30,000–$49,999 26 51 17 5$50,000 or more 45 39 12 2Income missing 31 48 14 4
Marital statusMarried/Has a partner 32 47 15 4Widowed/Divorced/Separated 34 43 17 5Single 27 46 21 4
RegionNortheast 31 48 17 3North Central 28 52 15 3South 35 43 15 4West 30 46 18 5
AreaUrban 33 45 16 4Suburban 31 46 16 4Rural 26 49 21 3
LanguageEnglish-dominant 37 42 15 5Bilingual 37 41 17 4Spanish-dominant 23 52 18 4
Quality of Care(For those getting medical care in the past 12 months only)
Excellent Good Fair Poor
continued
Note: “Not in labor force” includes those who reported that they were a homemaker or stay-at-home parent, retired or a student.

Hispanics and Health Care in the United States: Access, Information and Knowledge57
� � APPENDIX B: DETAILED TABLES
Quality of Care, continued(For those getting medical care in the past 12 months only)
Excellent Good Fair Poor
OriginMexico 31 47 16 4Puerto Rico 37 44 15 2Cuba 30 46 17 6Dominican Republic 27 52 19 2Central America 26 43 22 5South America 32 52 11 3Other 41 37 17 4
NativityNative born 39 40 15 5Foreign born 27 50 18 4
GenerationFirst 27 50 18 4Second 38 40 17 5Third or higher 40 40 13 5
CitizenshipNative-born citizen 39 40 16 5Naturalized 32 45 17 4Legal permanent resident (LPR) 23 53 17 5Foreign born, not LPR 22 55 18 3
Years in U.S. (Foreign born only)Less than 5 24 49 22 15–9 18 54 21 310–14 25 52 17 415 or more 30 48 16 5
Usual health care providerHas 34 46 16 4Does not have 19 45 22 7
Health insuranceInsured 35 45 15 4Uninsured 23 47 22 5
Note: Percentage may not total 100 due to rounding and the exclusion of “don’t know” and “refused”responses.

continued
Hispanics and Health Care in the United States: Access, Information and Knowledge58
� � APPENDIX B: DETAILED TABLES
TOTAL 23 31 29 20 23
SexMale 22 33 29 20 25Female 25 28 29 19 22
Age18–29 28 36 30 21 2330–49 25 28 28 17 2450–64 19 26 32 25 2765 and older 12 ——- ——- ——- ——-
EducationLess than a high school diploma 19 41 33 23 37High school diploma 23 34 28 22 23Some college or more 32 19 26 15 12
EmploymentEmployed 24 28 26 18 22Unemployed 27 ——- ——- ——- ——-Not in labor force 22 32 27 23 25
Household incomeLess than $30,000 22 40 35 24 30$30,000–$49,999 26 28 22 17 25$50,000 or more 30 12 19 12 11Income missing 18 ——- ——- ——- ——-
Marital statusMarried/Has a partner 22 30 28 19 25Widowed/Divorced/ 24 28 33 25 21SeparatedSingle 26 32 26 18 21
RegionNortheast 23 24 28 16 25North Central 21 ——- ——- ——- ——-South 24 35 31 18 24West 23 32 29 23 24
AreaUrban 23 29 27 19 23Suburban 25 37 30 22 31Rural 24 ——- ——- ——- ——-
LanguageEnglish-dominant 30 27 20 20 8Bilingual 25 27 30 16 20Spanish-dominant 18 38 36 25 43
Reasons for Bad Care(% responding yes to each reason)
Experiencedbad care in thepast five years
Not able to pay (money)
Race/Ethnicity
Language(accent or poor
English)
Medical history
Note: “Not in labor force” includes those who reported that they were a homemaker or stay-at-home parent, retired or a student.

Hispanics and Health Care in the United States: Access, Information and Knowledge59
� � APPENDIX B: DETAILED TABLES
OriginMexico 21 34 32 22 27Puerto Rico 29 18 21 22 13Cuban 33 ——- ——- ——- ——-Dominican Republic 24 ——- ——- ——- ——-Central America 24 ——- ——- ——- ——-South America 20 ——- ——- ——- ——-Other 36 ——- ——- ——- ——-
NativityNative born 30 31 26 18 12Foreign born 20 31 32 21 33
GenerationFirst 20 31 32 21 33Second 29 36 29 23 17Third or higher 31 24 22 13 6
CitizenshipNative-born citizen 29 29 25 18 14Naturalized 21 22 28 23 26Legal permanent resident (LPR) 18 37 38 19 37Foreign born, not LPR 17 45 35 22 43
Years in U.S.(Foreign born only)Less than 5 16 ——- ——- ——- ——-5–9 18 ——- ——- ——- ——-10–14 14 ——- ——- ——- ——-15 or more 22 26 30 20 28
Usual health care providerHas 23 27 25 19 20Does not have 24 41 38 23 32
Health insuranceInsured 24 20 26 19 20Uninsured 22 53 34 22 32
Reasons for Bad Care, continued(% responding yes to each reason)
Experiencedbad care in thepast five years
Not able to pay (money)
Race/Ethnicity
Medical history
Language(accent or
poor English)

Hispanics and Health Care in the United States: Access, Information and Knowledge60
� � APPENDIX B: DETAILED TABLES
A L
otLi
ttle
Non
eA
Lot
Litt
leN
one
A L
otLi
ttle
Non
eA
Lot
Litt
leN
one
A L
otLi
ttle
Non
eA
Lot
Litt
leN
one
A L
otLi
ttle
Non
e
TOTA
L32
3928
2345
319
3160
1520
6514
3749
2043
369
2268
Sex
Mal
e28
3833
2344
3210
3456
1420
6611
3850
1943
3710
2268
Fem
ale
3541
2224
4531
828
6417
2063
1735
4821
4335
922
69
Age
18–2
928
4329
2247
318
3359
1824
5712
3948
2447
299
2565
30–4
931
4028
2446
3010
3356
1719
6414
3848
2043
3610
2170
50–6
436
3329
2742
319
2565
1218
6917
3448
1840
428
2072
65 a
nd o
lder
4136
2223
3838
921
706
885
1927
5216
3053
1221
67
Education
Less
than
a h
igh
2537
3726
4034
1028
616
1083
1130
5918
3744
1123
66sc
hool
dip
lom
aH
igh
scho
ol d
iplo
ma
3241
2626
4826
1033
5715
2163
1441
4521
4633
1023
67S
ome
colle
ge o
r m
ore
4141
1717
4933
633
6131
3237
2043
3723
4828
719
74
Employment
Em
ploy
ed29
4129
2346
3110
3357
1821
6114
3847
2044
359
2169
Une
mpl
oyed
3434
3021
4336
627
6712
1969
1538
4519
4534
725
68N
ot in
labo
r fo
rce
3638
2526
4331
927
6412
1572
1434
5121
3940
1122
67
Household income
Less
than
$30
,000
2740
3325
4529
1031
5810
1376
1335
5219
4337
1123
66$3
0,00
0–$4
9,99
934
4025
2643
318
3656
2025
5414
3946
2047
339
2269
$50,
000
or m
ore
4242
1518
4933
732
6130
3337
2046
3421
4831
518
76In
com
e m
issi
ng31
3334
2340
369
2467
1016
7411
3057
2233
449
2367
Marital status
Mar
ried/
Has
a p
artn
er32
3928
2345
319
3159
1520
6513
3749
1944
369
2269
Wid
owed
/Div
orce
d/S
epar
ated
3635
2824
4234
1027
6313
1769
1732
5120
3940
1121
68S
ingl
e28
4527
2346
319
3159
2022
5813
3947
2442
3311
2267
Region
Nor
thea
st37
3923
2741
3110
2762
1921
5918
3645
2245
3211
2365
Nor
th C
entr
al28
4130
2149
298
2864
1820
6212
3651
2243
3510
2466
Sou
th31
3929
2544
328
3359
1619
6416
3746
2042
3710
2169
Wes
t31
4028
2246
329
3160
1319
6711
3752
1943
378
2270
Area
Urb
an32
3928
2345
319
3259
1620
6415
3748
2143
369
2269
Sub
urba
n29
4326
2542
3210
3159
1722
6112
3552
1845
378
2468
Rur
al32
3631
2245
327
2567
1215
7313
3848
2240
3811
1870
Language
Eng
lish-
dom
inan
t36
4421
1844
374
3165
2132
4612
4543
2449
276
1975
Bilin
gual
3838
2323
4630
931
5921
2257
1838
4321
4435
923
68S
pani
sh-d
omin
ant
2438
3627
4429
1230
587
1082
1131
5718
3843
1123
65
Sou
rces
of H
ealth
Info
rmat
ion
Doc
tor/
Oth
erTe
levi
sion
Rad
ioIn
tern
etP
rint M
edia
Fam
ily/F
riend
s
Chu
rche
s or
C
omm
unity
G
roup
s continue
d
Not
e: “
Not
in la
bor
forc
e” in
clud
es th
ose
who
repo
rted
that
they
wer
e a
hom
emak
er o
r st
ay-a
t-ho
me
pare
nt, r
etire
d or
a s
tude
nt.

Hispanics and Health Care in the United States: Access, Information and Knowledge61
� � APPENDIX B: DETAILED TABLES
A L
otLi
ttle
Non
eA
Lot
Litt
leN
one
A L
otLi
ttle
Non
eA
Lot
Litt
leN
one
A L
otLi
ttle
Non
eA
Lot
Litt
leN
one
A L
otLi
ttle
Non
e
Origin
Mex
ico
3039
3024
4531
933
5813
1968
1237
5119
4436
923
68P
uert
o R
ico
3941
1928
3834
925
6623
2650
2035
4525
4331
1120
68C
uba
3345
2218
4339
1228
6020
1763
1735
4725
3738
1018
73D
omin
ican
Rep
ublic
3636
2526
4132
1627
5718
2457
1640
4223
4234
1222
66C
entr
al A
mer
ica
2842
3024
4629
1127
6214
1570
1236
5220
3841
1023
67S
outh
Am
eric
a33
3829
2250
277
3360
2526
4916
4241
1745
3810
1971
Oth
er44
3916
1848
344
3066
2223
5623
3938
2741
326
1579
Nativity
Nat
ive
born
3941
2019
4635
530
6523
2947
1542
4325
4629
721
72Fo
reig
n bo
rn28
3833
2644
2911
3157
1114
7513
3452
1841
4111
2366
Generation
Firs
t28
3833
2644
2911
3157
1114
7513
3452
1841
4111
2366
Sec
ond
3840
2220
4535
628
6624
2847
1442
4324
4431
724
69Th
ird o
r hi
gher
3943
1817
4637
333
6522
3146
1642
4225
4926
617
77
Citizenship
Nat
ive-
born
citi
zen
3941
2020
4535
530
6423
2848
1641
4324
4530
821
71N
atur
aliz
ed34
3628
2445
3110
2861
1317
7017
3349
1739
439
2071
Lega
l per
man
ent
resi
dent
(LP
R)
2539
3528
4428
1232
5510
1277
1236
5221
3939
1223
65Fo
reig
n-bo
rn, n
ot L
PR
1940
4025
4628
1233
557
1281
933
5814
4539
1124
64
Years in U.S. (
Fore
ign
born
onl
y)Le
ss th
an 5
1939
4226
4628
1132
5711
1673
1332
5521
4237
1026
645–
919
4337
3142
2713
3353
916
7410
3753
1546
3811
2563
10–1
427
3833
2745
2812
3454
913
7713
3255
1840
4113
2166
15 o
r m
ore
3237
2925
4430
1130
5912
1374
1534
5018
3942
1022
68
Usual health care provider
Has
3741
2124
4630
930
6117
2162
1538
4621
4435
922
68D
oes
not h
ave
1736
4622
4235
1032
5811
1673
1033
5618
4041
921
69
Health insurance
Insu
red
3840
2224
4431
931
5918
2359
1638
4621
4335
1021
69U
nins
ured
1939
4022
4632
1030
6011
1376
1136
5319
4239
923
68
Sou
rces
of H
ealth
Info
rmat
ion,
con
tinue
d
Doc
tor/
Oth
erTe
levi
sion
Rad
ioIn
tern
etP
rint M
edia
Fam
ily/F
riend
s
Chu
rche
s or
C
omm
unity
G
roup
s
Not
e: P
erce
ntag
e m
ay n
ot to
tal 1
00 d
ue to
roun
ding
and
the
excl
usio
n of
“do
n’t k
now
” an
d “r
efus
ed”
resp
onse
s.

Hispanics and Health Care in the United States: Access, Information and Knowledge62
� � APPENDIX B: DETAILED TABLES
TOTA
L40
2832
4727
2613
5829
2743
2949
1931
Sex
Mal
e36
3033
4328
2911
5632
2643
3248
1734
Fem
ale
4426
3053
2521
1460
2629
4427
5120
29
Age
18–2
938
2735
4427
2812
5533
2443
3344
1640
30–4
940
2931
4827
2413
6027
3042
2851
1931
50–6
438
3230
4627
2710
6524
2645
2953
2521
65 a
nd o
lder
4826
2554
2123
——
-—
—-
——
-31
4624
5722
21
Education
Less
than
a h
igh
scho
ol d
iplo
ma
5614
3064
1124
3029
4048
2328
6510
24H
igh
scho
ol d
iplo
ma
3831
3148
2526
1158
3125
4531
4621
33S
ome
colle
ge o
r mor
e17
4834
2051
296
7023
1061
2922
3345
Employment
Empl
oyed
3828
3446
2727
1161
2825
4431
4718
35U
nem
ploy
ed31
3335
——
-—
—-
——
-—
—-
——
-—
—-
3447
19—
—-
——
-—
—-
Labo
r for
ce s
tatu
s46
2726
5225
2220
4931
3141
2752
1928
Household income
Less
than
$30
,000
5119
3058
1626
2044
3540
3029
5714
29$3
0,00
0–$4
9,99
933
3235
4230
278
6229
2144
3542
2236
$50,
000
or m
ore
1255
3318
5427
673
217
6924
2134
44In
com
e m
issi
ng46
2330
5521
2221
4533
3139
2957
1924
Marital status
Mar
ried/
Has
a p
artn
er41
2732
5124
2513
5730
2942
2852
1829
Wid
owed
/Div
orce
d/S
epar
ated
4130
2946
2923
1558
2829
4229
4825
27S
ingl
e33
3334
3733
3010
6227
2048
3242
1642
Region
Nor
thea
st35
3628
3931
3012
6027
2642
3147
1934
Nor
th C
entra
l35
3629
4139
19—
—-
——
-—
—-
2746
2742
2335
Sou
th40
2734
4729
2413
5433
2643
3149
1832
Wes
t42
2632
5121
2713
6126
2943
2852
1930
Area
Urb
an40
2832
4727
2613
5928
2742
3050
1732
Sub
urba
n43
2632
5024
2512
5532
3140
2948
2131
Rur
al36
3727
4333
23—
—-
——
-—
—-
2354
2348
2427
Language
Engl
ish-
dom
inan
t6
7024
1173
174
8214
476
2013
4937
Bilin
gual
2732
4136
2637
759
3417
5033
4120
39S
pani
sh-d
omin
ant
684
2874
521
4014
4558
1032
716
23
Lang
uage
of H
ealth
Inf
orm
atio
n R
ecei
ved
(for tho
se gettin
g an
y info from
eac
h so
urce
) Tele
visi
onS
pani
sh
Eng
lish
Bot
hR
adio
Spa
nish
E
nglis
h B
oth
Inte
rnet
Spa
nish
E
nglis
h B
oth
Prin
t Med
iaS
pani
sh
Eng
lish
Bot
hC
hurc
hes
or C
omm
unity
Gro
ups
Spa
nish
E
nglis
h B
oth
continue
d
Not
e: “
Not
in la
bor f
orce
” in
clud
es th
ose
who
repo
rted
that
they
wer
e a
hom
emak
er o
r sta
y-at
-hom
e pa
rent
, ret
ired
or a
stu
dent
.

Hispanics and Health Care in the United States: Access, Information and Knowledge63
� � APPENDIX B: DETAILED TABLES
Origin
Mex
ico
4325
3252
2325
1359
2831
4029
5117
31P
uerto
Ric
o22
4928
2849
239
6427
1558
2738
2141
Cub
a—
—-
——
-—
—-
——
-—
—-
——
-—
—-
——
-—
—-
——
-—
—-
——
-—
—-
——
-—
—-
Dom
inic
an R
epub
lic39
2437
——
-—
—-
——
-—
—-
——
-—
—-
——
-—
—-
——
-—
—-
——
-—
—-
Cen
tral A
mer
ica
4918
3256
1331
1844
3732
2839
619
30S
outh
Am
eric
a36
2835
——
-—
—-
——
-12
4839
2441
34—
—-
——
-—
—-
Oth
er10
6129
——
-—
—-
——
-—
—-
——
-—
—-
——
-—
—-
——
-—
—-
——
-—
—-
Nativity
Nat
ive
born
1160
2815
5925
576
186
7123
2237
39Fo
reig
n bo
rn54
1233
6211
2621
3642
4224
3462
1028
Generation
Firs
t54
1233
6211
2621
3642
4224
3462
1028
Sec
ond
1650
3521
4730
670
238
6626
2629
43Th
ird o
r hig
her
575
197
7617
485
113
7818
1554
31
Citizenship
Nat
ive-
born
citi
zen
1557
2919
5625
674
197
6924
2634
38N
atur
aliz
ed44
1938
4918
3311
5337
3035
3554
1729
Lega
l per
man
ent r
esid
ent (
LPR
)59
734
687
2525
2647
4817
3569
526
Fore
ign
born
, not
LP
R67
528
745
2138
1151
609
3164
728
Years in U.S.(
Fore
ign
born
onl
y)Le
ss th
an 5
676
2673
423
——
-—
—-
——
-57
1330
658
265–
965
531
695
2531
1455
5112
3864
333
10–1
458
636
695
26—
—-
——
-—
—-
5018
3262
731
15 o
r mor
e47
1735
5617
2712
5236
3432
3460
1426
Usual health care provider
Has
3731
3146
2826
1161
2725
4629
4821
31D
oes
not h
ave
4819
3352
2126
1746
3634
3432
5412
32
Health insurance
Insu
red
3434
3242
3225
1163
2623
5027
4523
32U
nins
ured
5117
3257
1626
1845
3736
2935
5711
31
Lang
uage
of H
ealth
Inf
orm
atio
n R
ecei
ved,
con
tinue
d(fo
r tho
se gettin
g an
y info from
eac
h so
urce
) Tele
visi
onS
pani
sh
Eng
lish
Bot
hR
adio
Spa
nish
E
nglis
h B
oth
Inte
rnet
Spa
nish
E
nglis
h B
oth
Prin
t Med
iaS
pani
sh
Eng
lish
Bot
hC
hurc
hes
or C
omm
unity
Gro
ups
Spa
nish
E
nglis
h B
oth
Not
e: P
erce
ntag
e m
ay n
ot to
tal 1
00 d
ue to
roun
ding
and
the
excl
usio
n of
“do
n’t k
now
” an
d “r
efus
ed”
resp
onse
s.

Hispanics and Health Care in the United States: Access, Information and Knowledge64
� � APPENDIX B: DETAILED TABLES
TOTAL 41 57 64
SexMale 40 51 60Female 42 62 68
Age18–29 42 57 6530–49 41 58 6750–64 40 55 6165 and older 39 50 49
EducationLess than a high school diploma 38 56 66High school diploma 41 56 66Some college or more 45 59 60
EmploymentEmployed 40 56 65Unemployed 47 55 54Not in labor force 41 60 64
Household incomeLess than $30,000 40 59 67$30,000–$49,999 39 57 64$50,000 or more 44 52 61Income missing 41 53 61
Marital statusMarried/Has a partner 40 59 66Widowed/Divorced/Separated 43 53 61Single 42 51 61
RegionNortheast 43 61 62North Central 37 54 63South 45 57 63West 37 55 67
AreaUrban 42 57 65Suburban 40 59 64Rural 36 50 59
LanguageEnglish-dominant 37 47 54Bilingual 46 57 64Spanish-dominant 39 62 71
Impact of Media on Behavior(For anyone who received any health information by television, radio, Internet, printmedia)
Affect decisionabout how to treat
an illness or medical condition
Ask a doctor orother medical
professional newquestions
Change thinkingabout diet or
exercise
continued
Note: “Not in labor force” includes those who reported that they were a homemaker or stay-at-homeparent, retired or a student.
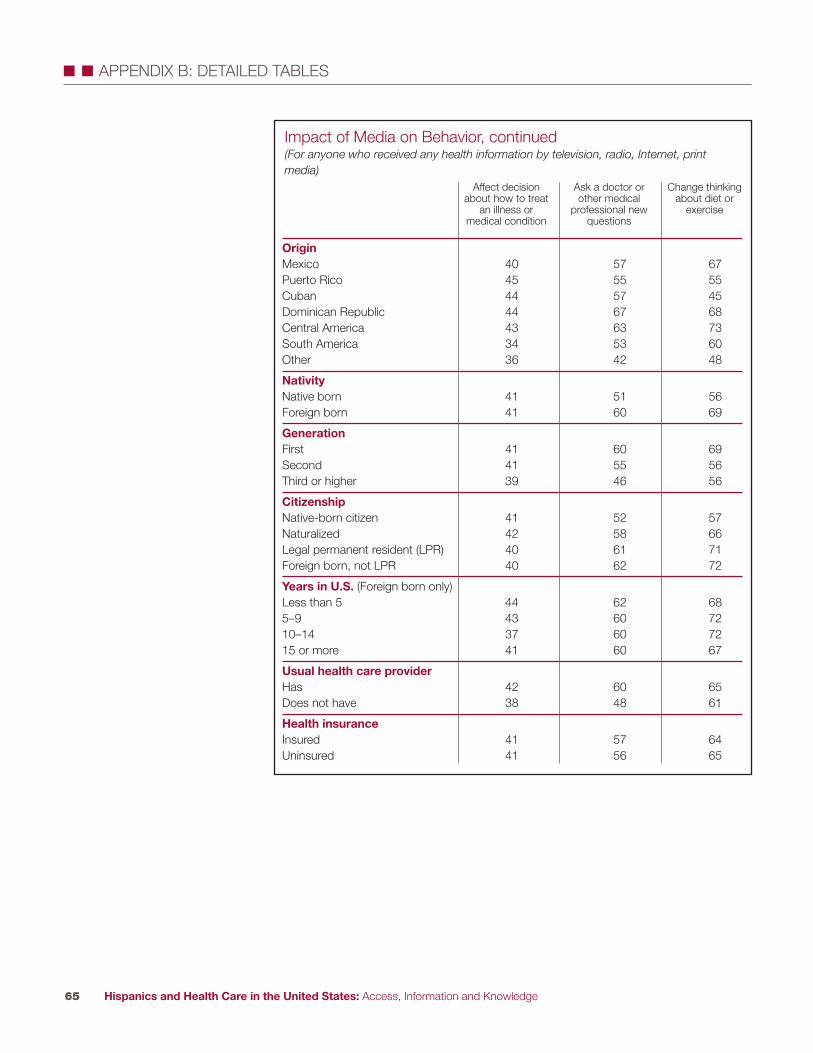
Hispanics and Health Care in the United States: Access, Information and Knowledge65
� � APPENDIX B: DETAILED TABLES
OriginMexico 40 57 67Puerto Rico 45 55 55Cuban 44 57 45Dominican Republic 44 67 68Central America 43 63 73South America 34 53 60Other 36 42 48
NativityNative born 41 51 56Foreign born 41 60 69
GenerationFirst 41 60 69Second 41 55 56Third or higher 39 46 56
CitizenshipNative-born citizen 41 52 57Naturalized 42 58 66Legal permanent resident (LPR) 40 61 71Foreign born, not LPR 40 62 72
Years in U.S. (Foreign born only)Less than 5 44 62 685–9 43 60 7210–14 37 60 7215 or more 41 60 67
Usual health care providerHas 42 60 65Does not have 38 48 61
Health insuranceInsured 41 57 64Uninsured 41 56 65
Impact of Media on Behavior, continued(For anyone who received any health information by television, radio, Internet, printmedia)
Affect decisionabout how to treat
an illness or medical condition
Ask a doctor orother medical
professional newquestions
Change thinkingabout diet or
exercise

Hispanics and Health Care in the United States: Access, Information and Knowledge66
� � APPENDIX B: DETAILED TABLES
TOTA
L63
5963
7076
7672
71
Sex
Mal
e58
5556
6572
7770
69Fe
mal
e69
6471
7580
7575
72
Age
18–2
952
5352
6274
7675
7130
–49
6764
6773
7877
7273
50–6
472
6475
7879
7971
7265
and
old
er67
5362
6670
6963
58
Education
Less
than
a h
igh
scho
ol d
iplo
ma
6154
5866
7174
6667
Hig
h sc
hool
dip
lom
a63
6064
7077
7674
73S
ome
colle
ge o
r mor
e66
6973
7782
8280
75
Employment
Empl
oyed
6261
6370
7679
7372
Une
mpl
oyed
6354
5868
7574
7769
Not
in la
bor f
orce
6759
6670
7773
6970
Household income
Less
than
$30
,000
6457
6370
7575
6869
$30,
000–
$49,
999
6561
6170
7780
7672
$50,
000
or m
ore
6673
7478
8483
8381
Inco
me
mis
sing
5550
5461
6969
6561
Marital status
Mar
ried/
Has
a p
artn
er65
6265
7277
7773
72W
idow
ed/D
ivor
ced/
Sep
arat
ed68
5970
7276
7671
69S
ingl
e52
5253
6173
7670
69
Region
Nor
thea
st67
5365
7475
7969
69N
orth
Cen
tral
5660
5965
7776
7172
Sou
th63
6064
6976
7571
68W
est
6361
6370
7677
7473
Area
Urb
an62
6064
7177
7672
70S
ubur
ban
6559
6369
7678
7073
Rur
al62
5762
6772
7672
72
Language
Engl
ish-
dom
inan
t57
6165
6780
7679
76B
ilingu
al65
6364
7276
7774
71S
pani
sh-d
omin
ant
6555
6269
7376
6667
Kno
wle
dge
of D
iabe
tes
(% ans
wering co
rrec
tly)
Freq
uent
urin
atio
nIn
crea
sed
fatig
ueEx
cess
ive
thirs
tB
lurr
y vi
sion
No
perm
anen
tcu
reEf
fect
ive
treat
men
tsex
ist
Mai
ntai
ning
ahe
alth
y w
eigh
t as
apr
even
tion
tact
ic
Ris
k ev
en if
no
fam
ily m
embe
rsha
ve d
iabe
tes
continue
d
Not
e: “
Not
in la
bor f
orce
” in
clud
es th
ose
who
repo
rted
that
they
wer
e a
hom
emak
er o
r sta
y-at
-hom
e pa
rent
, ret
ired
or a
stu
dent
.

Hispanics and Health Care in the United States: Access, Information and Knowledge67
� � APPENDIX B: DETAILED TABLES
Origin
Mex
ico
6461
6470
7675
7373
Pue
rto R
ico
6954
6676
7781
7276
Cub
a67
5965
6475
7876
64D
omin
ican
Rep
ublic
7160
6869
7779
7662
Cen
tral A
mer
ica
5754
5464
7475
6064
Sou
th A
mer
ica
4454
5766
7377
6561
Oth
er68
7173
7684
8381
73
Nativity
Nat
ive
born
6064
6770
8077
8075
Fore
ign
born
6457
6170
7476
6768
Generation
Firs
t64
5761
7074
7667
68S
econ
d60
6262
6880
7882
74Th
ird o
r hig
her
6167
7373
8075
7977
Citizenship
Nat
ive-
born
citi
zen
6263
6771
7977
7975
Nat
ural
ized
70
6065
7277
7769
67Le
gal p
erm
anen
t res
iden
t (LP
R)
6458
6370
7577
6568
Fore
ign
born
, not
LP
R55
5453
6568
7367
67
Years in U.S. (
FB o
nly)
Less
than
558
5256
6167
7665
675–
958
5152
6869
7365
6710
–14
5757
5866
7478
6766
15 o
r mor
e70
6066
7477
7668
69
Usual health care provider
Has
6561
6673
7977
7372
Doe
s no
t hav
e57
5456
6369
7468
68
Health insurance
Insu
red
6561
6672
7777
7472
Uni
nsur
ed61
5760
6774
7569
70
Respondent has diabetes
Yes
8069
7882
8176
7186
No
6058
6168
7577
7268
Kno
wle
dge
of D
iabe
tes,
con
tinue
d(%
ans
wering co
rrec
tly)
Freq
uent
urin
atio
nIn
crea
sed
fatig
ueEx
cess
ive
thirs
tB
lurr
y vi
sion
No
perm
anen
tcu
reEf
fect
ive
treat
men
tsex
ist
Mai
ntai
ning
ahe
alth
y w
eigh
t as
apr
even
tion
tact
ic
Ris
k ev
en if
no
fam
ily m
embe
rsha
ve d
iabe
tes
continue
d

Hispanics and Health Care in the United States: Access, Information and Knowledge68
� � APPENDIX B: DETAILED TABLES
Respondent, fam
ily mem
ber, or
close friend has diabetes
Yes
6966
7177
8080
7579
No
5349
5160
7171
6857
Health information sources
Doc
tor o
r oth
er m
edic
al p
rofe
ssio
nal
6563
6673
7878
7372
Tele
visi
on65
6265
7278
7872
73R
adio
6663
6474
7779
7373
Inte
rnet
6367
6874
8081
7976
Prin
t med
ia67
6568
7479
8074
73Fa
mily
or f
riend
s64
6366
7278
7874
73C
hurc
hes
or c
omm
unity
gro
ups
6359
6268
7478
7069
Kno
wle
dge
of D
iabe
tes,
con
tinue
d(%
ans
wering co
rrec
tly)
Freq
uent
urin
atio
nIn
crea
sed
fatig
ueEx
cess
ive
thirs
tB
lurr
y vi
sion
No
perm
anen
tcu
reEf
fect
ive
treat
men
tsex
ist
Mai
ntai
ning
ahe
alth
y w
eigh
t as
apr
even
tion
tact
ic
Ris
k ev
en if
no
fam
ily m
embe
rsha
ve d
iabe
tes

Hispanics and Health Care in the United States: Access, Information and Knowledge69
� � APPENDIX B: DETAILED TABLES
TOTAL 10 32 58
SexMale 13 36 51Female 7 27 65
Age18–29 12 40 4830–49 9 28 6350–64 8 24 6865 and older 15 37 48
EducationLess than a high school diploma 13 37 50High school diploma 9 31 60Some college or more 6 24 70
EmploymentEmployed 10 32 59Unemployed 11 35 53Not in labor force 10 31 59
Household incomeLess than $30,000 11 32 57$30,000–$49,999 7 35 58$50,000 or more 4 23 72Income missing 17 38 45
Marital statusMarried/Has a partner 10 30 61Widowed/Divorced/Separated 9 32 60Single 14 38 48
RegionNortheast 10 31 59North Central 12 34 54South 11 32 57West 10 32 59
AreaUrban 10 32 58Suburban 9 32 59Rural 12 33 55
LanguageEnglish-dominant 8 32 59Bilingual 10 30 61Spanish-dominant 12 33 55
Diabetes Knowledge Index(row % of correct answers)
Low (0–2) Middle (3–5) High (6–8)
continued
Note: “Not in labor force” includes those who reported that they were a homemaker or stay-at-homeparent, retired or a student.
Note: Percentage may not total 100 due to rounding and the exclusion of “don’t know” and “refused”responses.

Hispanics and Health Care in the United States: Access, Information and Knowledge70
� � APPENDIX B: DETAILED TABLES
OriginMexico 9 32 59Puerto Rico 10 27 64Cuba 14 26 60Dominican Republic 7 33 60Central America 15 39 46South America 15 38 47Other 6 24 71
NativityNative born 8 30 62Foreign born 12 33 56
GenerationFirst 12 33 56Second 9 31 60Third or higher 6 29 65
CitizenshipNative-born citizen 8 30 62Naturalized 10 30 60Legal permanent resident (LPR) 10 34 55Foreign born, not LPR 16 35 48
Years in U.S. (Foreign born only)Less than 5 14 36 505–9 16 35 4910–14 12 39 4815 or more 9 30 61
Usual health care providerHas 9 30 61Does not have 14 36 50
Health insuranceInsured 10 30 61Uninsured 11 35 55
Respondent has diabetesYes 3 24 73No 11 33 55
Respondent, family member, or close friend has diabetesYes 5 28 67No 18 38 44
Health information sourcesDoctor/other medical professional 8 30 62Television 9 30 61Radio 7 30 62Internet 6 29 65Print media 8 27 65Family or friends 8 30 62Churches or community groups 10 33 57
Diabetes Knowledge Index, continued(row % or correct answers)
Low (0–2) Middle (3–5) High (6–8)

Hispanics and Health Care in the United States: Access, Information and Knowledge71
� � APPENDIX B: DETAILED TABLES
TOTAL 100 100 100
SexMale 65 59 45Female 35 41 55
Age18–29 33 38 2530–49 38 38 4850–64 12 12 1865 and older 12 9 7
EducationLess than a high school diploma 50 46 34High school diploma 27 31 33Some college or more 15 20 31
EmploymentEmployed 59 62 64Unemployed 7 7 6Not in labor force 27 27 28
Household incomeLess than $30,000 51 46 45$30,000–$49,999 13 20 19$50,000 or more 8 13 23Income missing 28 21 13
Marital statusMarried/Has a partner 56 57 64Widowed/Divorced/Separated 15 18 18Single 27 24 17
RegionNortheast 14 14 15North Central 9 8 7South 38 37 36West 39 41 42
AreaUrban 71 70 70Suburban 17 19 20Rural 12 11 10
LanguageEnglish-dominant 20 24 24Bilingual 34 33 37Spanish-dominant 47 43 39
Profile of Persons by Diabetes Knowledge Index(column % of correct answers)
Low (0–2) Middle (3–5) High (6–8)
continued
Note: “Not in labor force” includes those who reported that they were a homemaker or stay-at-home parent, retired or a student.
Note: Percentage may not total 100 due to rounding and the exclusion of “don’t know” and “refused”responses.
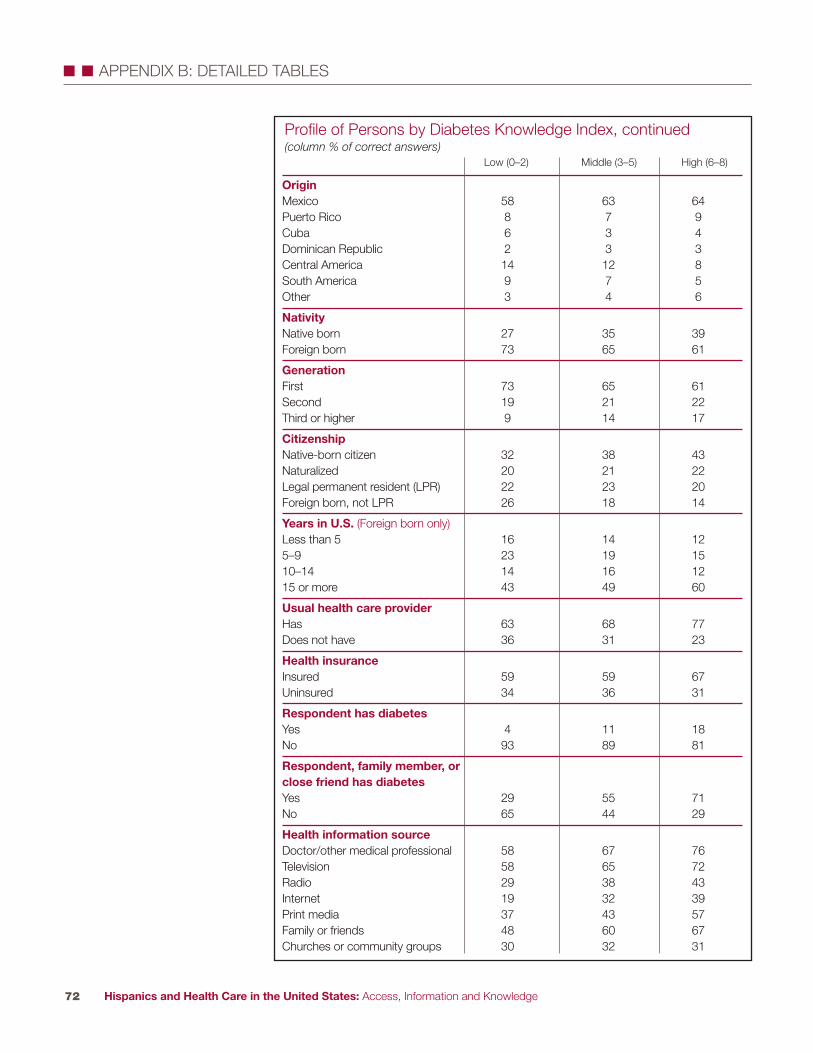
Hispanics and Health Care in the United States: Access, Information and Knowledge72
� � APPENDIX B: DETAILED TABLES
OriginMexico 58 63 64Puerto Rico 8 7 9Cuba 6 3 4Dominican Republic 2 3 3Central America 14 12 8South America 9 7 5Other 3 4 6
NativityNative born 27 35 39Foreign born 73 65 61
GenerationFirst 73 65 61Second 19 21 22Third or higher 9 14 17
CitizenshipNative-born citizen 32 38 43Naturalized 20 21 22Legal permanent resident (LPR) 22 23 20Foreign born, not LPR 26 18 14
Years in U.S. (Foreign born only)Less than 5 16 14 125–9 23 19 1510–14 14 16 1215 or more 43 49 60
Usual health care providerHas 63 68 77Does not have 36 31 23
Health insuranceInsured 59 59 67Uninsured 34 36 31
Respondent has diabetesYes 4 11 18No 93 89 81
Respondent, family member, orclose friend has diabetesYes 29 55 71No 65 44 29
Health information sourceDoctor/other medical professional 58 67 76Television 58 65 72Radio 29 38 43Internet 19 32 39Print media 37 43 57Family or friends 48 60 67Churches or community groups 30 32 31
Profile of Persons by Diabetes Knowledge Index, continued(column % of correct answers)
Low (0–2) Middle (3–5) High (6–8)

Hispanics and Health Care in the United States: Access, Information and Knowledge73
� � APPENDIX B: DETAILED TABLES
TOTAL 8
SexMale 8Female 9
Age18–29 830–49 950–64 965 and older 4
EducationLess than a high school diploma 7High school diploma 8Some college or more 10
EmploymentEmployed 9Unemployed 9Not in labor force 7
Household incomeLess than $30,000 9$30,000–$49,999 8$50,000 or more 7Income missing 9
Marital statusMarried/Has a partner 9Widowed/Divorced/Separated 7Single 7
RegionNortheast 4North Central 5South 11West 8
AreaUrban 8Suburban 7Rural 10
LanguageEnglish-dominant 4Bilingual 10Spanish-dominant 9
Sought Medical Care or Medicines in Another Country(% responding yes)
continued
Note: “Not in labor force” includes those who reported that they were a homemaker or stay-at-home parent, retired or a student.
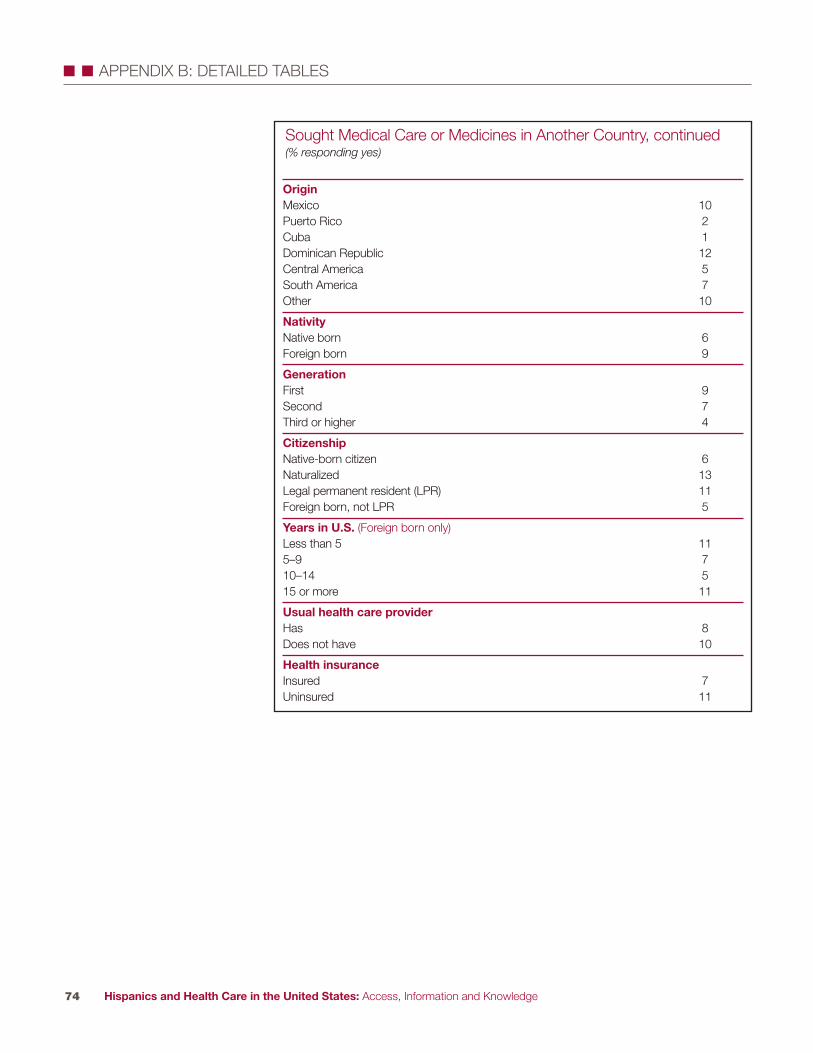
Hispanics and Health Care in the United States: Access, Information and Knowledge74
� � APPENDIX B: DETAILED TABLES
OriginMexico 10Puerto Rico 2Cuba 1Dominican Republic 12Central America 5South America 7Other 10
NativityNative born 6Foreign born 9
GenerationFirst 9Second 7Third or higher 4
CitizenshipNative-born citizen 6Naturalized 13Legal permanent resident (LPR) 11Foreign born, not LPR 5
Years in U.S. (Foreign born only)Less than 5 115–9 710–14 515 or more 11
Usual health care providerHas 8Does not have 10
Health insuranceInsured 7Uninsured 11
Sought Medical Care or Medicines in Another Country, continued(% responding yes)

Hispanics and Health Care in the United States: Access, Information and Knowledge75
� � APPENDIX B: DETAILED TABLES
TOTAL 6
SexMale 7Female 5
Age18–29 730–49 650–64 665 and older 5
EducationLess than a high school diploma 6High school diploma 6Some college or more 8
EmploymentEmployed 7Unemployed 10Not in labor force 5
Household incomeLess than $30,000 6$30,000-$49,999 7$50,000 or more 6Income missing 6
Marital statusMarried/Has a partner 6Widowed/Divorced/Separated 7Single 7
RegionNortheast 7North Central 7South 7West 5
AreaUrban 6Suburban 6Rural 8
LanguageEnglish-dominant 8Bilingual 7Spanish-dominant 5
Sought Medical Care from a Curandero(% responding yes)
continued
Note: “Not in labor force” includes those who reported that they were a homemaker or stay-at-home parent, retired or a student.
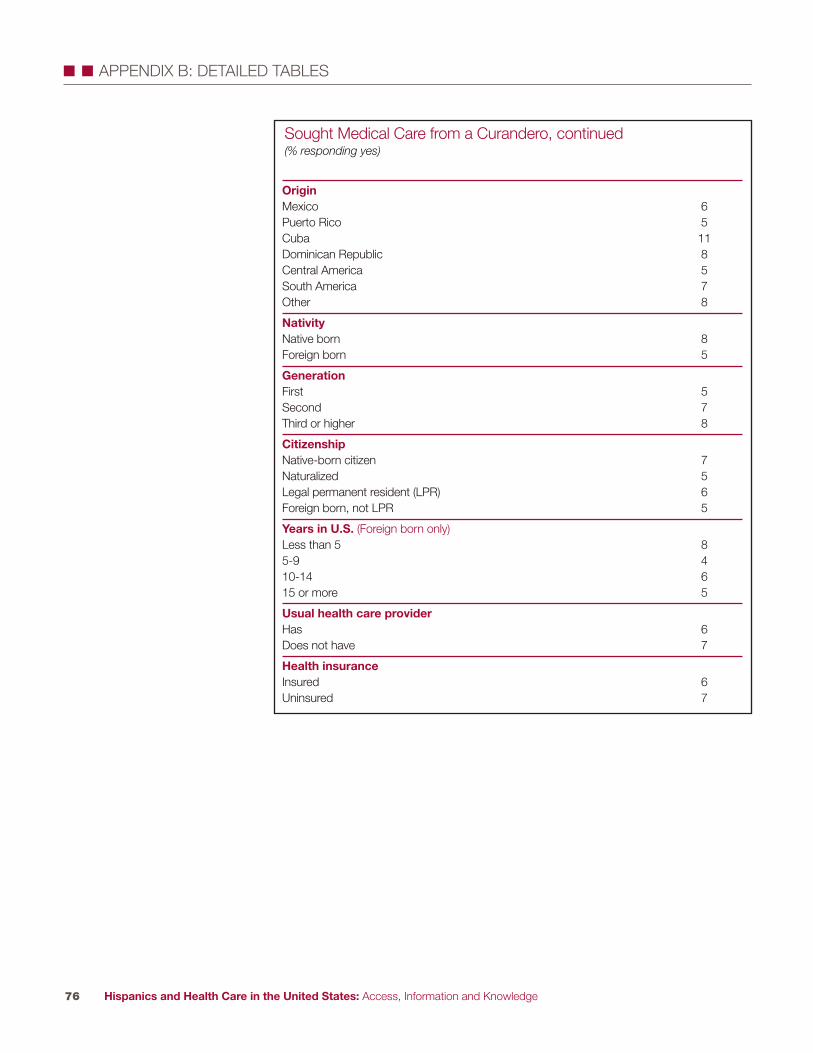
Hispanics and Health Care in the United States: Access, Information and Knowledge76
� � APPENDIX B: DETAILED TABLES
OriginMexico 6Puerto Rico 5Cuba 11Dominican Republic 8Central America 5South America 7Other 8
NativityNative born 8Foreign born 5
GenerationFirst 5Second 7Third or higher 8
CitizenshipNative-born citizen 7Naturalized 5Legal permanent resident (LPR) 6Foreign born, not LPR 5
Years in U.S. (Foreign born only)Less than 5 85-9 410-14 615 or more 5
Usual health care providerHas 6Does not have 7
Health insuranceInsured 6Uninsured 7
Sought Medical Care from a Curandero, continued(% responding yes)

Hispanics and Health Care in the United States: Access, Information and Knowledge77
� � APPENDIX B: DETAILED TABLES
TOTAL 87 8
SexMale 87 9Female 88 7
Age18–29 85 1030–49 88 850–64 88 565 and older 90 3
EducationLess than a high school diploma 88 6High school diploma 89 7Some college or more 84 11
EmploymentEmployed 87 9Unemployed 83 8Not in labor force 90 5
Household incomeLess than $30,000 89 6$30,000–$49,999 86 10$50,000 or more 84 13Income missing 86 5
Marital statusMarried/Has a partner 89 7Widowed/Divorced/Separated 88 7Single 82 12
RegionNortheast 91 4North Central 86 10South 86 8West 87 9
AreaUrban 88 7Suburban 88 8Rural 83 11
LanguageEnglish–dominant 79 14Bilingual 89 7Spanish-dominant 90 5
Opinions of Different Treatments
continued
Sick persons should rely ONLY on treatments
recommended by doctors orother medical professionals
Treatments in the form of potions, powders,
spells or healing rituals can ALSO be useful
Note: “Not in labor force” includes those who reported that they were a homemaker or stay-at-home parent, retired or a student.
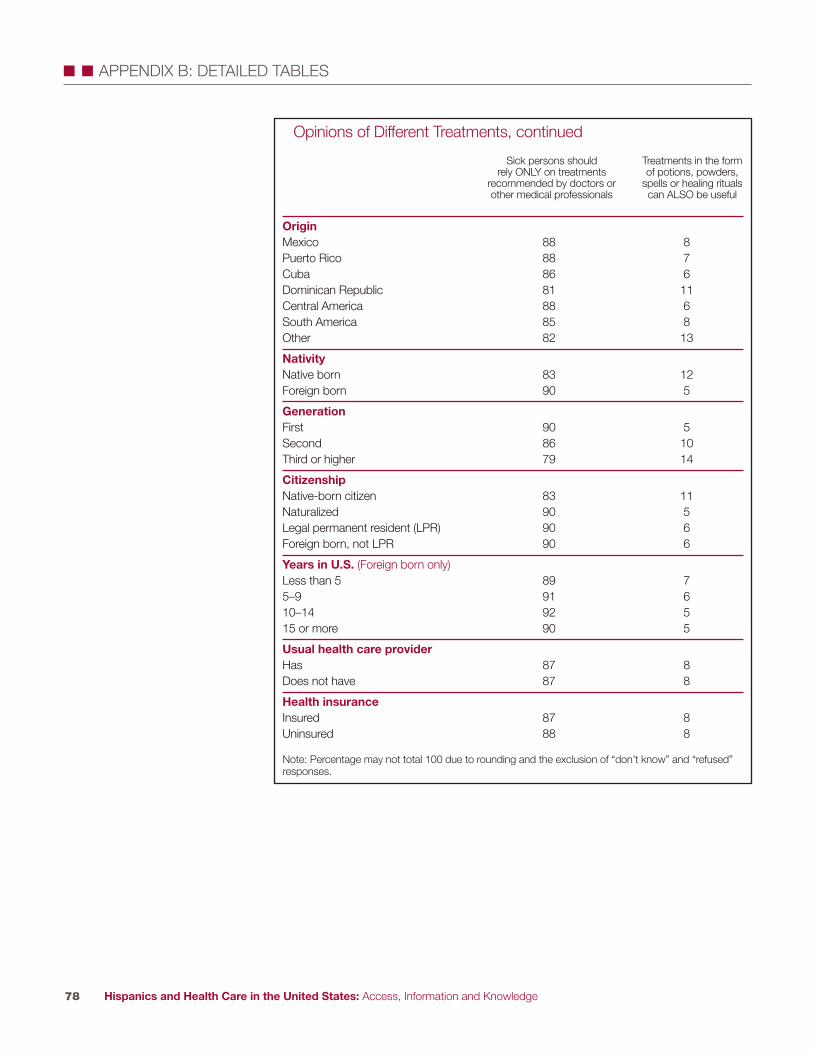
Hispanics and Health Care in the United States: Access, Information and Knowledge78
� � APPENDIX B: DETAILED TABLES
OriginMexico 88 8Puerto Rico 88 7Cuba 86 6Dominican Republic 81 11Central America 88 6South America 85 8Other 82 13
NativityNative born 83 12Foreign born 90 5
GenerationFirst 90 5Second 86 10Third or higher 79 14
CitizenshipNative-born citizen 83 11Naturalized 90 5Legal permanent resident (LPR) 90 6Foreign born, not LPR 90 6
Years in U.S. (Foreign born only)Less than 5 89 75–9 91 610–14 92 515 or more 90 5
Usual health care providerHas 87 8Does not have 87 8
Health insuranceInsured 87 8Uninsured 88 8
Opinions of Different Treatments, continued
Sick persons should rely ONLY on treatments
recommended by doctors orother medical professionals
Treatments in the form of potions, powders,
spells or healing rituals can ALSO be useful
Note: Percentage may not total 100 due to rounding and the exclusion of “don’t know” and “refused”responses.

Route 1 and College Road EastP.O. Box 2316Princeton, NJ 08543-2316www.rwjf.org
1615 L Street, NW Suite 700 Washington, DC 20036-5610www.pewhispanic.org
August 2008