historic trace data: enhanced historic time and sales ... · historic trace data: enhanced historic...
TRANSCRIPT
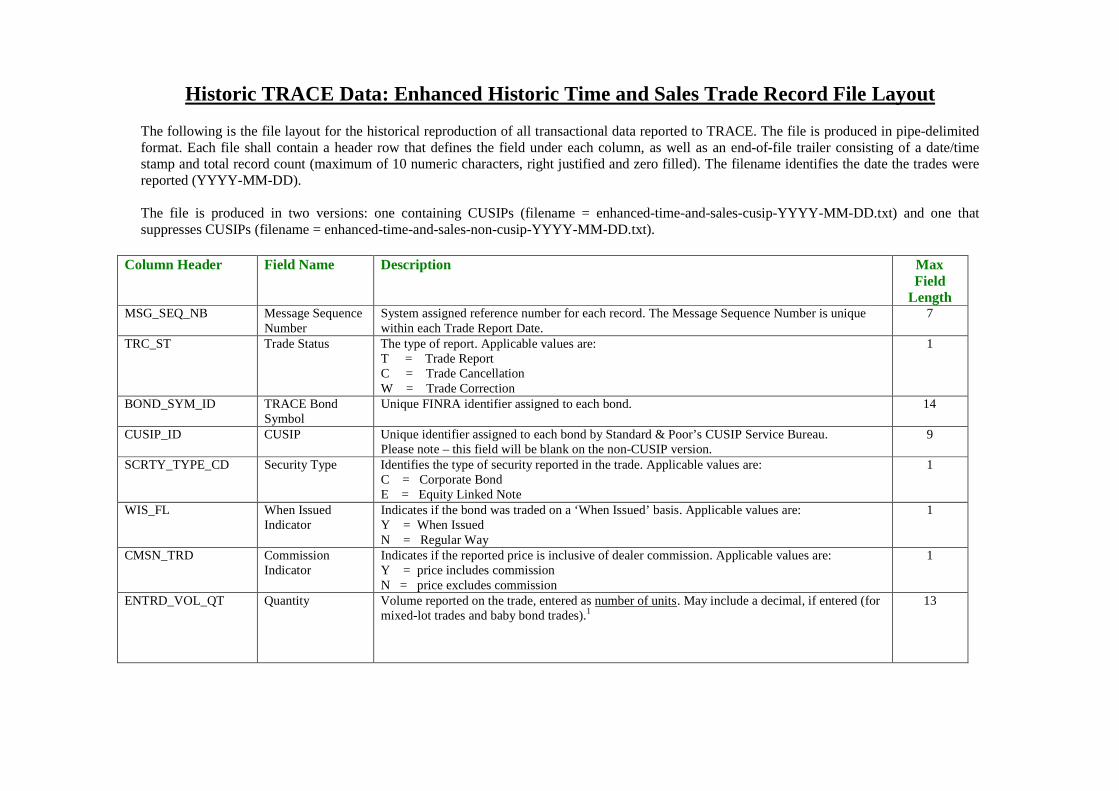
Historic TRACE Data: Enhanced Historic Time and Sales Trade Record File Layout
The following is the file layout for the historical reproduction of all transactional data reported to TRACE. The file is produced in pipe-delimitedformat. Each file shall contain a header row that defines the field under each column, as well as an end-of-file trailer consisting of a date/timestamp and total record count (maximum of 10 numeric characters, right justified and zero filled). The filename identifies the date the trades werereported (YYYY-MM-DD).
The file is produced in two versions: one containing CUSIPs (filename = enhanced-time-and-sales-cusip-YYYY-MM-DD.txt) and one thatsuppresses CUSIPs (filename = enhanced-time-and-sales-non-cusip-YYYY-MM-DD.txt).
Column Header Field Name Description MaxField
LengthMSG_SEQ_NB Message Sequence
NumberSystem assigned reference number for each record. The Message Sequence Number is uniquewithin each Trade Report Date.
7
TRC_ST Trade Status The type of report. Applicable values are:T = Trade ReportC = Trade CancellationW = Trade Correction
1
BOND_SYM_ID TRACE BondSymbol
Unique FINRA identifier assigned to each bond. 14
CUSIP_ID CUSIP Unique identifier assigned to each bond by Standard & Poor’s CUSIP Service Bureau.Please note – this field will be blank on the non-CUSIP version.
9
SCRTY_TYPE_CD Security Type Identifies the type of security reported in the trade. Applicable values are:C = Corporate BondE = Equity Linked Note
1
WIS_FL When IssuedIndicator
Indicates if the bond was traded on a ‘When Issued’ basis. Applicable values are:Y = When IssuedN = Regular Way
1
CMSN_TRD CommissionIndicator
Indicates if the reported price is inclusive of dealer commission. Applicable values are:Y = price includes commissionN = price excludes commission
1
ENTRD_VOL_QT Quantity Volume reported on the trade, entered as number of units. May include a decimal, if entered (formixed-lot trades and baby bond trades).1
13

RPTD_PR Price This field represents the reported bond price and is inclusive of any commission, mark-ups,and/or mark-downs reported by the firm in the trade transaction.
11
YLD_SIGN_CD Yield Direction This field indicates the yield direction for the subsequent Yield field. Applicable values are:- = minus sign indicates a negative yield.
+ = plus sign indicates a positive or zero yield.
1
YLD_PT Yield This field indicates the effective rate of return earned on a security, expressed as a percentage.The field will be blank if no yield is available.2
13
ASOF_CD As Of Indicator This field indicates if the transaction being reported is an As/Of trade or Reversal from a priorbusiness day. Applicable values are:A = As-ofR = Reversal3
Blank = regular trade
1
TRD_EXCTN_DT Execution Date This field represents the date that the trade was executed. Date is in YYYYMMDD format. 8TRD_EXCTN_TM Execution Time This field represents the execution time of the trade. Time is in HHMMSS military time format. 6TRD_RPT_DT Trade Report Date This field represents the date that the trade was reported to TRACE. Date is in YYYYMMDD
format.8
TRD_RPT_TM Trade Report Time This field represents the time that the trade was reported to TRACE. Time is in HHMMSSmilitary time format.
6
DAYS_TO_STTL_CT Seller Sales Day Used when Sale Condition = ‘R’, this field will represent the number of days to settlementassociated with the transaction. Otherwise, the field will contain the value ‘000’.
3
SALE_CNDTN_CD Sale Condition This field will indicate if there are any special conditions or modifiers applicable to the tradetransaction, using alphanumeric or special characters. Applicable values are:A = Trades reported outside Market hoursC = Cash SaleN = Next Day SettlementR = Sellers Option SettlementW = Weighted Average PriceZ = Sold out of sequence (reported late)@ = Regular trade
1
SALE_CNDTN2_CD Second Modifier This field is used to describe a second sale condition that is applicable to the trade. Applicablevalues are:A = Trades reported outside Market hoursZ = Sold out of sequence (reported late)Blank = Single or no modifiers on trade
1
RPT_SIDE_CD Buy/Sell Indicator This field is used to identify whether the reported trade is a buy or sell. Applicable values are:B = BuyS = Sell
1
BUY_CMSN_RT Buyer Commission Represents the commission rate charged by the buyer, if applicable. Reported as points per bond.Includes decimal.
9

BUY_CPCTY_CD Buyer Capacity Represents the capacity reported by the buyer. Applicable values are:A = AgencyP = Principal
1
SELL_CMSN_RT Seller Commission Represents the commission rate charged by the seller, if applicable. Reported as points per bond.Includes decimal.
9
SELL_CPCTY_CD Seller Capacity Represents the capacity reported by the seller. Applicable values are:A = AgencyP = Principal
1
CNTRA_MP_ID Contra PartyIndicator
Identifies the type of trade based on the contra party reported. Applicable values are:C = Customer tradeD = Inter Dealer trade4
1
AGU_QSR_ID AGU Indicator This field indicates whether the trade is an AGU (Automatic Give Up) or QSR (QualifiedService Representative) trade, or a regular trade.5 Applicable values are:A = AGU tradeQ = QSR tradeBlank = Regular (non-AGU/non-QSR) trade
1
SPCL_TRD_FL Special PriceIndicator
This field indicates the existence of a special trade condition (as defined in FINRA Rule6730(d)(4)(A)) that impacted the execution price. Applicable values are:Y = Special Price tradeBlank = non-Special Price trade
1
TRDG_MKT_CD Trading MarketIndicator
This field indicates whether a trade was reported as a secondary market trade or a primarymarket trade. Applicable values are:S1 = Secondary market trade or a primary market trade executed at a market priceP1 = Primary market trade that qualifies as a List or Fixed Offering Price transaction, or aTakedown transaction.
Trades reported with the S1 trading market indicator are eligible for dissemination. Tradesreported with the P1 trading market indicator are not eligible for dissemination and arereportable on a T+1 basis.6
2
DISSEM_FL Dissemination Flag Indicates whether the trade was disseminated (via BTDS) or not. Applicable values are:Y = Trade was disseminatedN = Trade was not disseminated
1
ORIG_MSG_SEQ_NB Original MessageSequence Number
On Trade Cancellation (TRC_ST = C) and Trade Correction (TRC_ST = W) records, this fieldwill be populated with the Message Sequence Number (MSG_SEQ_NB) of the underlying traderecord. The Original Message Sequence Number is unique within each Trade Report Date.
7

Example of end-of-file trailer:
200912282116120000040815
The trailer indicates the file was generated on December 28, 2009 at 9:16:12 p.m. ET and contains 40,815 records.
Notes:
1 Note that the unit for trade size in the Historical TRACE Data file differs from real-time dissemination via BTDS where Par Value of the trade is transmitted.The TRACE system assumes a $1,000 par value. Quantities for bonds with a par value of greater than $1,000 are translated into a $1,000 equivalent.
2 Yield (along with Yield Direction) was reported by member firms on their trade reports up until October 31, 2008. Effective November 3, 2008, yield was nolonger required to be reported; instead FINRA calculated yield and yield direction and included the calculated yield on all reported transactions eligible fordissemination.
3 A Reversal is a cancellation of a trade report that was originally submitted into TRACE on a previous day. Reversals are identified in the dataset by the As OfIndicator value “R.” To apply reversals to their original trade report, reference all the basic trade details (TRACE Bond Symbol/CUSIP, Quantity, Price,Execution Date, Execution Time, Buy/Sell Indicator, Contra Party Indicator) provided in the reversal and look for matching details on earlier non-reversaltransactions. Please note, the original trade may have been reported on an As Of basis therefore the original Trade Report Date may not necessarily reflect theoriginal and reversal Execution Date.
4 The Enhanced Historic Time and Sales dataset includes disseminated and non-disseminated transactions, indicated by the Dissemination Flag. Inter-DealerBuys (Contra Party Indicator = D, Buy/Sell Indicator = B) and Inter-Dealer Sells (Contra Party Indicator = D, Buy/Sell Indicator = S) reflect two sides of thesame trade, reported from each member firm’s perspective. Only the Inter-Dealer Sell trade report is included in real-time dissemination. As long as the Inter-Dealer Sell trade meets the eligibility criteria for dissemination, the Dissemination Flag in the dataset shall reflect the value “Y.”
5 An AGU is an agreement that allows a member firm to report on behalf of another member firm. A QSR is similar to an AGU in that it allows a third party toreport on behalf of a member firm: however, a QSR is an NSCC maintained agreement and QSR trades can only be submitted to TRACE via RTTM.
6 The reporting requirement of the Trading Market Indicator went into effect March 1, 2010. As a default, all trades reported prior to March 1, 2010 will reflectthe value “S1” in this field.