historical flash floods retromodelling in the ondara river ... · tarrega was founded in the 11th...
TRANSCRIPT

Nat. Hazards Earth Syst. Sci., 11, 3359–3371, 2011www.nat-hazards-earth-syst-sci.net/11/3359/2011/doi:10.5194/nhess-11-3359-2011© Author(s) 2011. CC Attribution 3.0 License.
Natural Hazardsand Earth
System Sciences
Historical flash floods retromodelling in the Ondara River inTarrega (NE Iberian Peninsula)
J. C. Balasch1, J. L. Ruiz-Bellet1, and J. Tuset2,3
1Department of Environment and Soil Sciences, University of Lleida, Spain2Forest Science Centre of Catalonia, Solsona, Spain3RIUS Fluvial Dynamics Research Group, UdL, Spain
Received: 15 April 2011 – Revised: 12 August 2011 – Accepted: 7 October 2011 – Published: 21 December 2011
Abstract. Flash floods in the Ondara River have causedmany fatalities and damages in the town of Tarrega in thelast 400 yr. Unfortunately, no flow records are available.
However, floods can sometimes be reconstructed thanksto available historical information: limnimarks, written ac-counts and archaeological surveys. Indeed, from these dataand using the retromodelling method on three different sce-narios to take into account morphology changes, the peakflows of the seven greatest floods occurred in Tarrega sincethe 17th century were estimated.
The results showed that the heaviest flood’s specific peakflow (10.7 m3 s−1 km−2) ranks among the highest ever mod-elled or measured in similar-sized catchments in the WesternMediterranean region. The results pointed out, as well, thatthe changes in channel’s morphology (mainly, the disappear-ance of a mediaeval bridge under sediment) caused by one ofthe floods increased the hydraulic capacity of a crucial cross-section. All this resulted in modest floods invading the townless often, but with much faster and, thus, more destructiveflows.
A preliminary estimation of the results’ uncertainty was4 % for great floods and 18 % for modest floods.
The reconstructed peak flows will be introduced in adatabase for a future use in climatic and hydrological studies.
1 Introduction
Flash floods are a common hydrological event in the smalland medium-sized catchments located in the Mediterraneancoastal fringe of Catalonia, in NE Iberian Peninsula (Llasatet al., 2003; Gaume et al., 2009). Nevertheless, this torren-tial behaviour is also known to catchments located inland,
Correspondence to:J. C. Balasch([email protected])
specifically to those enclosed in the Ebro River basin havingtheir headwaters on the coastal ranges, the water divide be-tween the coastal and the inland catchments. Indeed, in thesecatchments, flash floods occur frequently – usually causedby autumn convective rainstorms coming from the Mediter-ranean Sea – and have historically caused fatalities and dam-ages.
However, flash floods have not been studied in these catch-ments so far. Besides, historical floods in the Iberian Penin-sula have usually been used to find climatic temporal trends(Barriendos and Martın-Vide, 1998; Llasat et al. 2005; Ben-ito et al., 2008) and, except for floods occurred in large basins(Benito et al., 2003; Thorndycraft et al., 2006; Ortega andGarzon, 2009), rarely have they been hydraulically recon-structed.
Thus, our research focuses on historical flash-floods’ re-construction in 200–500 km2, westward-flowing catchmentslocated in the eastern-most fringe of the Ebro River basin.
Among them, we have chosen the Ondara River’s catch-ment as the paradigm to study flood reconstruction because alot of information about historical floods can be found there,both as flood marks, also called limnimarks, and as docu-ments: written accounts found in archives (Salvado, 1875;Iglesies, 1971; Segarra, 1987; Farre, 2008), press chroniclesand photographs (Coma, 1990).
A reason for this abundance of information might havebeen the great magnitude of the damages caused by thefloods, due to the Ondara’s catchment having historicallybeen a very populated area, with important towns such asTarrega and Cervera (16 500 and 9300 inhabitants respec-tively, in 2009).
Thus, according to written and epigraphic documents, theOndara River has flash-flooded the town of Tarrega at leastseven times since the early 17th century: in 1615, 1644,1783, 1842, 1874, 1930 and 1989, sometimes causing a greatnumber of fatalities: more than 300 in 1644 and about 150 in1874.
Published by Copernicus Publications on behalf of the European Geosciences Union.

3360 J. C. Balasch et al.: Historical flash floods retromodelling in the Ondara River
Fig. 1. Location of the Ondara River’s catchment within the IberianPeninsula(a) and within Catalonia(b), and map of the catchmentitself with the location of the town of Tarrega(c).
Besides specific information about the floods, hydraulicmodelling requires data about the channel’s and floodplain’smorphology and roughness. Fortunately, a lot of informa-tion about the evolution of these features in the Ondara Riveris available thanks to the efforts of local archaeologists andhistorians.
In spite of this abundance of information, it has never beenused to hydraulically or hydrologically reconstruct thoseevents; with one exception: 1874Santa Tecla’s flood hasonly recently been modelled in order to quantify its peak flowand the rainstorm that caused it (Balasch et al., 2010a, b).
Therefore, the objectives of this paper were to find andprocess all the available information in order to calculate1615, 1644, 1783, 1842, 1930 and 1989 floods’ peak flowsand improve the previously calculated 1874 flood’s peakflow.
2 Study framework
2.1 Catchment
The Ondara River is a left-side tributary of the downstreamstretch of the Segre River, which is, at its turn, the main tribu-tary of the Ebro River (Fig. 1); however, before reaching theSegre, the Ondara River’s water flows into a large alluvialfan just downstream Tarrega. When it arrives at Tarrega, ata height of 362 m above sea level, the Ondara has a length of28.6 km and an average slope of 1.5 %.
Its catchment is 150 km2 and has an east-west orienta-tion, its headwaters lying on the Central Catalan Depres-sion’s monoclinal relieves, with the highest point at Coll dela Creu del Vent, in Montmaneu Range (804 m). Cereal unir-rigated crops cover 85 % of the catchment’s area, whereasforest and uncultured soil cover 13 % and urban soil, 2 %.
Fig. 2. Tarrega’s urbanized area evolution since the 17th century(a)and detail of Sant Agustı Street area(b).
Although there has never been any flow gauging stationon the Ondara River, its modest average flow at the end ofthe alluvial fan could be estimated through water resourcesmodelling (CHE, 1996): 0.5 m3 s−1. However, the alluvialfan’s flow is greatly increased by the seepage from irrigatedfields; thus, the share of water coming from the Ondara mustbe smaller, a good estimation of its average flow in Tarregabeing 0.1 m3 s−1 or less.
Ondara’s hydrological regime, not regulated by any hy-draulic structure, shows a high-water period around Mayand long low-water periods, a consequence of the continen-tal Mediterranean climate (Koppen Csa) of the catchment,which has an annual mean rainfall of 450 mm with a vari-ation coefficient of 20 %. In any case, autumn overflowingflash floods are not rare, occurring about three or four timesper century, according to the most complete record compiledby Coma (1990) and Espinagosa et al. (1996). Severe flashfloods, caused by great rainstorms, often occur simultane-ously in Ondara and its adjoining catchments: Sio and Corb.
Certainly, severe rainstorms are common; this can be par-tially explained by the regional relief, which triggers stormsin two ways: stopping weather fronts that come from theMediterranean Sea and contributing to the development ofconvective rainstorms during summer and early autumn. Allthis results in an eastward rainfall gradient, because weatherfronts come from the east and because the highest lands,where convective rainstorms are more likely to form, are inthe eastern part of the catchment.
2.2 Evolution of the town’s and the floodplain’smorphology
The knowledge of the channel’s and the floodplain’s mor-phology is essential in hydraulic modelling (see Methods).However, this morphology can change greatly in 400 yr, es-pecially in urban areas (Fig. 2).
Nat. Hazards Earth Syst. Sci., 11, 3359–3371, 2011 www.nat-hazards-earth-syst-sci.net/11/3359/2011/
J. C. Balasch et al.: Historical flash floods retromodelling in the Ondara River 3361
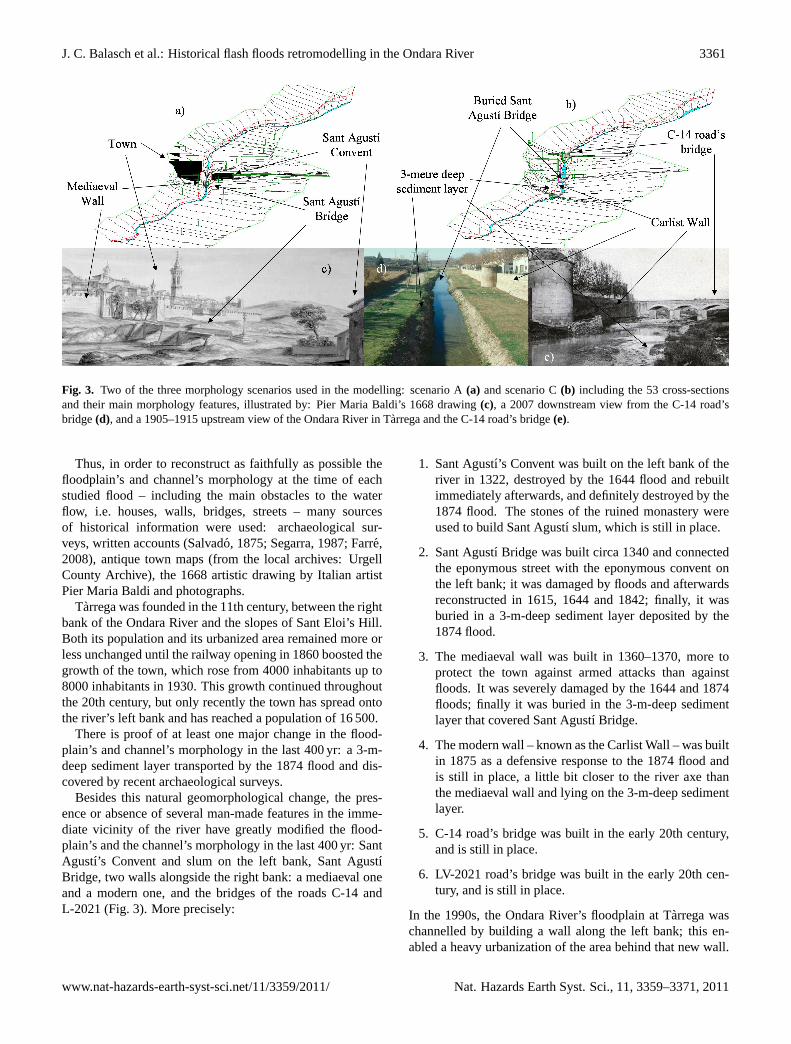
Fig. 3. Two of the three morphology scenarios used in the modelling: scenario A(a) and scenario C(b) including the 53 cross-sectionsand their main morphology features, illustrated by: Pier Maria Baldi’s 1668 drawing(c), a 2007 downstream view from the C-14 road’sbridge(d), and a 1905–1915 upstream view of the Ondara River in Tarrega and the C-14 road’s bridge(e).
Thus, in order to reconstruct as faithfully as possible thefloodplain’s and channel’s morphology at the time of eachstudied flood – including the main obstacles to the waterflow, i.e. houses, walls, bridges, streets – many sourcesof historical information were used: archaeological sur-veys, written accounts (Salvado, 1875; Segarra, 1987; Farre,2008), antique town maps (from the local archives: UrgellCounty Archive), the 1668 artistic drawing by Italian artistPier Maria Baldi and photographs.
Tarrega was founded in the 11th century, between the rightbank of the Ondara River and the slopes of Sant Eloi’s Hill.Both its population and its urbanized area remained more orless unchanged until the railway opening in 1860 boosted thegrowth of the town, which rose from 4000 inhabitants up to8000 inhabitants in 1930. This growth continued throughoutthe 20th century, but only recently the town has spread ontothe river’s left bank and has reached a population of 16 500.
There is proof of at least one major change in the flood-plain’s and channel’s morphology in the last 400 yr: a 3-m-deep sediment layer transported by the 1874 flood and dis-covered by recent archaeological surveys.
Besides this natural geomorphological change, the pres-ence or absence of several man-made features in the imme-diate vicinity of the river have greatly modified the flood-plain’s and the channel’s morphology in the last 400 yr: SantAgustı’s Convent and slum on the left bank, Sant AgustıBridge, two walls alongside the right bank: a mediaeval oneand a modern one, and the bridges of the roads C-14 andL-2021 (Fig. 3). More precisely:
1. Sant Agustı’s Convent was built on the left bank of theriver in 1322, destroyed by the 1644 flood and rebuiltimmediately afterwards, and definitely destroyed by the1874 flood. The stones of the ruined monastery wereused to build Sant Agustı slum, which is still in place.
2. Sant Agustı Bridge was built circa 1340 and connectedthe eponymous street with the eponymous convent onthe left bank; it was damaged by floods and afterwardsreconstructed in 1615, 1644 and 1842; finally, it wasburied in a 3-m-deep sediment layer deposited by the1874 flood.
3. The mediaeval wall was built in 1360–1370, more toprotect the town against armed attacks than againstfloods. It was severely damaged by the 1644 and 1874floods; finally it was buried in the 3-m-deep sedimentlayer that covered Sant Agustı Bridge.
4. The modern wall – known as the Carlist Wall – was builtin 1875 as a defensive response to the 1874 flood andis still in place, a little bit closer to the river axe thanthe mediaeval wall and lying on the 3-m-deep sedimentlayer.
5. C-14 road’s bridge was built in the early 20th century,and is still in place.
6. LV-2021 road’s bridge was built in the early 20th cen-tury, and is still in place.
In the 1990s, the Ondara River’s floodplain at Tarrega waschannelled by building a wall along the left bank; this en-abled a heavy urbanization of the area behind that new wall.
www.nat-hazards-earth-syst-sci.net/11/3359/2011/ Nat. Hazards Earth Syst. Sci., 11, 3359–3371, 2011

3362 J. C. Balasch et al.: Historical flash floods retromodelling in the Ondara River
Fig. 4. Iterative procedure of the retromodelling method applied ineach reconstructed flood.
Moreover, in early 2000s, the floodplain between the twowalls was turned into an urban park and a footbridge wasbuilt just over the nowadays buried Sant Agustı’s Bridge.
2.3 Historical floods
An historical flood is a flooding event not measured by in-struments, but recorded in different historical informationsources: limnimarks, written accounts, photographs. Some-times, there is enough information, both in quality and inquantity, to allow a reliable hydraulic reconstruction of thehistorical floods’ peak flows.
The basic piece of information needed in historical floods’reconstruction is maximum water height. This datum canbe obtained from a limnimark (a commemorative plaque ora carving on a wall which points out the maximum heightreached by one particular flood), a written account or a pho-tograph; sometimes, the latter two can even inform of thewater height at times other than the peak time, thus allowingthe estimation of the flood’s evolution over time, that is, ofits approximate hydrograph. Moreover, written accounts canprovide some details required for the reconstruction of therainstorm hyetograph – such as the rainstorm’s starting andending times and the rain occurrence in previous days.
So far, we have found seven historical floods in the On-dara in Tarrega with enough information to reconstruct theirpeak flows: three maximum water heights given by limni-marks (1644, 1783 and 1874) and four by written accounts(1615, 1842, 1930 and 1989).
Two of them stand out due to their magnitude and thedamages they caused: 1644 and 1874, both occurred atnight, which explains the great number of deaths (morethan 300 and 150, respectively). Besides, there is a lot of
Fig. 5. Three of the five limnimarks found:(a) carving on a columnat Sant Antoni Square marking the 1644 flood’s maximum waterheight (observation 2 in Fig. 6),(b) sandstone plaque at Sant AgustıStreet corresponding to the 1783 flood (observation 3 in Fig. 6),(c) marble plaque (marked by an arrow) at Sant Agustı Street corre-sponding to the 1874 flood (observation 5a in Fig. 6) and(d) detailof that plaque.
information about the 1874 flood, and that is why we choseit as the paradigm to start historical flood reconstruction inthe area, having so far successfully estimated its hydrographand hyetograph (Tuset, 2007; Balasch et al., 2010b).
Summarized information about the seven greatest histori-cal floods found in Tarrega is gathered in Table 1, along withthe sources of information that report them and the most con-spicuous morphology features at the time of each flood.
3 Methods
Depending on the available information, the hydraulic recon-struction of a historical flood can have different types of re-sults: from just the peak flow value to the entire hydrograph.
In this case, hydrological and morphological informationof the seven studied floods (the only seven known to us thatflooded the town since the 17th century), which was gatheredfrom multiple historical and archaeological sources, only al-lowed peak flow estimations.
We calculated these seven peak flows using the HEC-RAS4.0 (USACE, 2008) hydraulic modelling software on one-dimensional, gradually varied, steady, sub-critical flow. Ac-tually, this software calculates water height from a flowvalue; hence, we applied it iteratively, trying tentative peakflows until the difference between the modelled and thehistorically observed water heights was smaller than 1 cm
Nat. Hazards Earth Syst. Sci., 11, 3359–3371, 2011 www.nat-hazards-earth-syst-sci.net/11/3359/2011/

J. C. Balasch et al.: Historical flash floods retromodelling in the Ondara River 3363
Table 1. Summary of the information about the seven studied floods, their nine historically observed water height records, and the majormorphology features present at the time of each flood.
Year 1615 1644 1783 1842 1874 1930 1989
Date 25 July 17 September 17 September 25 August 23 September 19 October 28 October
Popular name Sant Jaume’s flood – – Sant Bar-tomeu’s flood
Santa Tecla’s flood Sant Lluc’s flood –
Fatalities 0 > 300 0 0 150 0 1
Historicallyobserved waterheight (m a.s.l.)
366.0 368.39 364.91 363.5 367.26 368.30 369.08 363.4 363.3
Location of the ob-servation (Fig. 6)
1 2 3 4 5a 5b 5c 6 7
Observation’s record ACUR (1621)1 Carving in acolumn at SantAntoni Square
Stone plaqueatSant AgustıStreet
Salvado (1875) Marbleplaque atSantAgustıStreet
Marbleplaqueat FontStreet
Marbleplaque atPiquesStreet
Local press3 Local press4
Type of record Written account Limnimark Limnimark Writtenaccount
Limnimark Limnimark Limnimark Written account Writtenaccount
Other informationsources
– Parets (1891)2
andSalvado (1875)
Salvado (1875) – Salvado (1875) and Iglesies (1971) – –
Morphology features
Sant Agustı Bridge 3-m-deep sediment layer
Mediaeval Wall – Carlist Wall
Sant Agustı Convent Sant Agustı’s slum
– C-14 road’s bridge
– LV-2021 road’s bridge
1 Found in Segarra (1987) and Farre (2008);2 found in Vila (1998);3 reported by Tarrega’s Regional Museum’s director (Anonymous, 1930);4 Castella and Miranda (1989).
(Fig. 4). This method is known as retromodelling and itsaccuracy has been successfully tested by Lang et al. (2004),Naulet et al. (2005) and Remo and Pinter (2007).
We applied the retromodelling method separately for eachof the seven studied floods along a 2700 m long reach of theOndara River by the town of Tarrega. In order to do that, wefirst measured and estimated the required input data: histori-cally observed maximum water height and the channel’s andfloodplain’s morphology and roughness.
3.1 Historically observed maximum water height
Historically observed maximum water height above sea levelwas acquired either directly from limnimarks, or indirectlyfrom written accounts. Whichever the case, this height wasmeasured with topographic equipment and its reliability wasassessed with source analysis methods (Bayliss and Reed,2001) and hermeneutical techniques.
When a limnimark was available, the maximum waterheight reached by the flood was directly marked either bya line carved on a stone column (1644 flood mark) or by thelower edge of a commemorative plaque (1783 and 1874 floodmarks), as Fig. 5 shows.
When no limnimark was found, the maximum waterheight was estimated from information found in contempo-rary accounts; more precisely:
1. 1615 flood: an indication of maximum water heightwas found inLlibre d’Actes i Memories: 1603–1621(ACUR, 1621; Farre, 2008). It says that the floodreached the ball playground located in Font Street (ap-proximately 366.0 m a.s.l.).
2. 1842 flood: according to the account written by Sal-vado (1875), the water arrived somewhat further thanthe main door of the Codina mill, the remains of whichare still to be found at Sant Agustı Street. We estimatedthis maximum water height as 363.5 m a.s.l., i.e., theheight of the door threshold.
3. 1930 and 1989 floods: several journalistic accountsare conserved from these floods. Cronica Targarina(Anonymous, 1930) and La Vanguardia (Castella andMiranda, 1989) describe how the water overflowed atthe end of the Carlist Wall and how it flowed back up tothe beginning of Sant Agustı Street. We estimated theseheights as 363.4 and 363.3 m a.s.l., respectively.
Since an actual line is usually more precisely placed (and,thus, measured) than a description of that line, the accuracyof the water height estimation is higher when done from alimnimark than from a written account: 5 mm against 5 cm(Table 1); this gives an idea of the importance of limnimarksin historical flood reconstruction.
www.nat-hazards-earth-syst-sci.net/11/3359/2011/ Nat. Hazards Earth Syst. Sci., 11, 3359–3371, 2011

3364 J. C. Balasch et al.: Historical flash floods retromodelling in the Ondara River
Fig. 6. Location of the nine observed maximum water heights ofthe seven studied floods, obtained from historical information (akey can be found in Table 1); and the four reference cross-sectionsused when comparing observed and modelled water heights.
In total, we found nine documented maximum waterheight observations, one for each of the seven floods, exceptfor the 1874 flood, which had three (Fig. 6). In that specificcase, one observation was used to model the flood and the re-maining two, to visually assess the accuracy of the modelledflow.
Each historically observed maximum water height wascompared to the modelled height at a particular cross-section,called the reference cross-section, which usually was theclosest one to the observation. Actually, four different cross-sections had to be used to properly compare the nine ob-served water heights to the nine modelled ones:
1. Piques Street cross section, 1333 m upstream of thejunction with the Cercavins River, for one of the ob-servations of 1874 flood (observation 5c in Fig. 6).
2. Font Street cross-section, 1245 m upstream of the junc-tion with the Cercavins River, for the 1615 flood ob-servation (observation 1 in Fig. 6) and for one of 1874flood (observation 5b in Fig. 6).
3. Sant Agustı Street cross-section, 1147 m upstream ofthe junction with the Cercavins River, for 1644, 1783,1842 and 1874 floods’ maximum water height observa-tions (observations 2, 3, 4 and 5a in Fig. 6).
4. A cross-section 1123 m upstream of the junction withthe Cercavins River, for 1930 and 1989 floods’ maxi-mum water height observations (observations 6 and 7
Fig. 7. Sant Agustı Street cross-section in scenarios A and C asseen from upstream with the six water height historical observa-tions found in Sant Agustı Street. Scenario A includes Sant Agustı-Bridge and Convent and Scenario C, the Carlist Wall, which ishigher than 1930 and 1989 floods maximum heights, as explainedin Sect. 3.1. (Horizontal axis marks the distance from an arbitraryspot on the left bank).
in Fig. 6). In these cases, the observed maximum wa-ter heights do not mark the height of the streamflow atthe cross-section where they were placed (Sant Agustı-Street’s) but at the spot where the two floods overflowedthe right bank and flowed back along the town-sideof the Carlist Wall; as explained above, this overflow-ing spot was the downstream end of the Carlist Wall,i.e. 1123 cross-section. Actually, both observed waterheights were lower than the Carlist Wall at Sant AgustıStreet cross-section (Fig. 7) and, thus, the right bankwas not hydraulically connected with the channel in thatspot.
3.2 Channel’s and floodplain’s morphology
Present-day channel’s and floodplain’s morphology was de-fined with 53 cross-sections obtained from a 1:1000 map;moreover, Sant Agustı Street section was measured with to-pographic equipment in order to increase its precision, sinceit was the reference section in four of the flood reconstruc-tions. Transition between two contiguous cross-sections wasdefined by expansion and contraction coefficients, whichwere chosen among the HEC-RAS tabulated values.
Afterwards, combinations of the corresponding changesexplained in Sect. 2.2 were added to present-day morphol-ogy and we obtained three different morphologies or scenar-ios, which were used in modelling the corresponding floods.
1. Scenario A (pre-1874 scenario): the river bed was threemetres below present-day one, and its longitudinal slopewas 0.95 % just upstream of Sant Agustı Street cross-section and 0.24 % just downstream of it. Sant AgustıBridge was not buried, the Mediaeval Wall ran along
Nat. Hazards Earth Syst. Sci., 11, 3359–3371, 2011 www.nat-hazards-earth-syst-sci.net/11/3359/2011/

J. C. Balasch et al.: Historical flash floods retromodelling in the Ondara River 3365
the right bank and Sant Agustı Convent lay on the leftfloodplain. 1615, 1644, 1783, 1842 and 1874 floodswere modelled on this scenario.
2. Scenario B (1874 scenario): the river bed was thepresent-day one, with a longitudinal slope of 0.15 % justupstream of Sant Agustı Street cross-section and 1 %just downstream of it. Sant Agustı Bridge and the Me-diaeval Wall were completely buried and Sant AgustıConvent lay on the left floodplain. 1874 flood was mod-elled on this scenario, as well as on scenario A.
3. Scenario C (post-1874 scenario): the river bed was thepresent-day one, as in scenario B. Sant Agustı Bridgeand the Mediaeval Wall were completely buried, theCarlist Wall ran along the right bank, Sant Agustı Con-vent was replaced by Sant Agustı Slum on the left flood-plain, and two new bridges were in place: C-14 road’sand LV-2021 road’s. 1930 and 1989 floods were mod-elled on this scenario.
3.3 Channel’s and floodplain’s roughness
Channel’s and floodplain’s roughness, which accounts forfriction against the flow, is quantified, for the use in HEC-RAS software, with Manning’sn, which is estimated fromtables that give its value on different river types and land uses(Chow, 1959).
Aerial photos and historical maps and documents wereused to determine the different land uses around the studiedreach of the river at the time of each flood. Obviously, the un-certainty of such a determination increases for older floods.However, we hypothesized (and we found no evidence of thecontrary) that no great changes occurred between the 17thand 19th centuries.
Actually, each cross-section was divided into homoge-neous land-use segments, which were assigned a Manning’sn value from tabulated values, as in the example shown inTable 2. Then a composed value for the cross-section wascalculated weight-averaging the land-use segments’ values.This value varied according to the modelling scenario: forinstance, Sant Agustı Street cross-section had a composedManning’sn of 0.089 in scenario A and 0.070 in both sce-nario B and C.
3.4 Uncertainty assessment
The input data required in historical flood reconstructionare old-time magnitudes. Unfortunately, estimating old-timemagnitudes from historical information can never be as ac-curate as measuring present-day ones on a field survey.
In order to assess the influence of the limited accuracy ofsome input data on the peak flow results, several sensitivityanalyses were done at Sant Agustı Street cross-section:
1. The first sensitivity analysis was performed on a highpeak flow (1200 m3 s−1) in scenario A; it quantified the
Table 2. Land uses identified at Sant Agustı Street cross-section(number 1147) in scenario C and their related Manning’sn values.
Cross-section Land Manning’ssegment use n
ChannelNon-vegetated channel 0.035Vegetated channel 0.075
Bank
Road 0.037Field 0.040Meadow 0.065Urban area 0.100Riparian forest 0.116
influence of an error in the observed maximum waterheight on the peak flow value .
2. The second sensitivity analysis was also performed ona high peak flow (1200 m3 s−1) in scenario A; it quanti-fied the influence of an error in Manning’sn on the peakflow value .
3. The third sensitivity analysis was performed on a lowpeak flow (300 m3 s−1) in scenario C; it quantified theinfluence of an error in Manning’sn on the peak flowvalue.
Afterwards, the results of the sensitivity analyses werequadratically summed to obtain the peak flows’ uncertainty,hypothesizing that water height uncertainty was 5 cm (forvalues found in written accounts) or 0.5 cm (for values foundin limnimarks) and that Manning’sn uncertainty was 25 %,estimated from the average range within a tabulated category(Chow, 1959).
This uncertainty assessment could be improved by includ-ing a sensitivity analysis on morphology measurement er-rors, which is a major factor in hydraulic modelling (espe-cially, longitudinal slope). Besides, an even more thoroughuncertainty assessment could include other factors, such asbackwater effects and lateral flows (not taken into account ina one-dimensional modelling software), non-permanent floweffects (not taken into account in a steady flow procedure) orthe undulations of the water surface.
4 Results and discussion
4.1 Hydraulic modelling
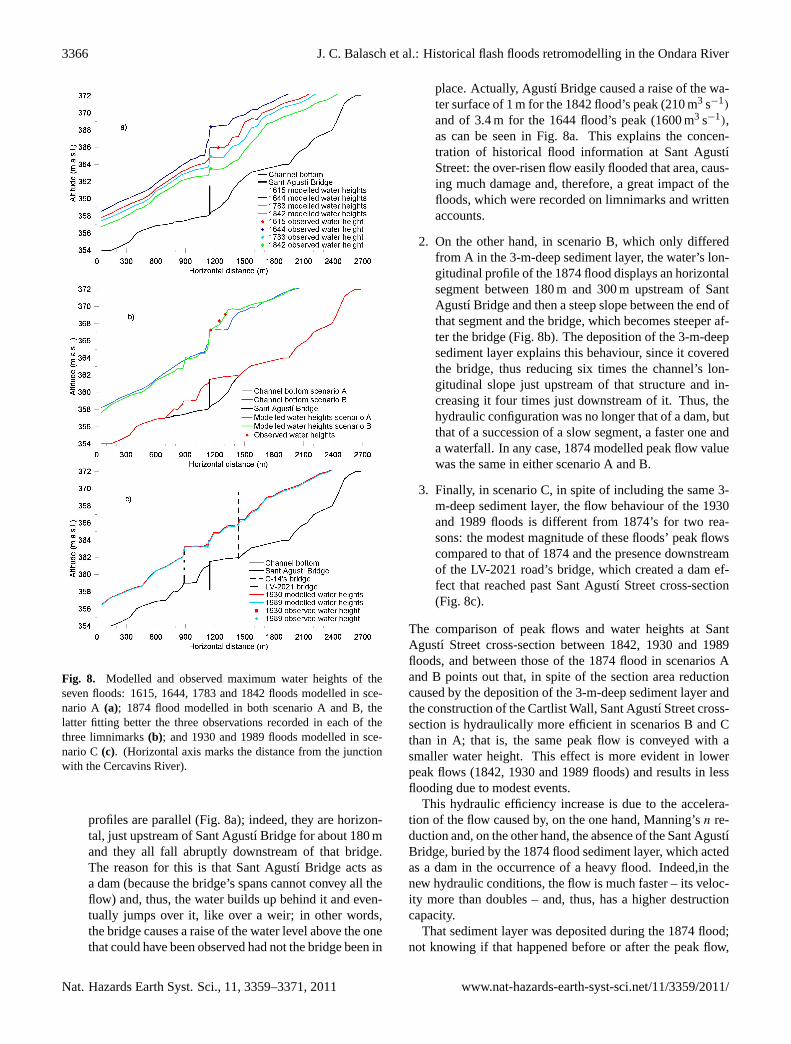
As results in Table 3 and Fig. 8 show, the morphology sce-nario strongly determined the hydraulic behaviour of themodelled flows:
1. First, in scenario A, the flows of four different floods’behave similarly along the modelled river reach regard-less of their peak flow magnitude: water longitudinal
www.nat-hazards-earth-syst-sci.net/11/3359/2011/ Nat. Hazards Earth Syst. Sci., 11, 3359–3371, 2011
3366 J. C. Balasch et al.: Historical flash floods retromodelling in the Ondara River
Fig. 8. Modelled and observed maximum water heights of theseven floods: 1615, 1644, 1783 and 1842 floods modelled in sce-nario A (a); 1874 flood modelled in both scenario A and B, thelatter fitting better the three observations recorded in each of thethree limnimarks(b); and 1930 and 1989 floods modelled in sce-nario C(c). (Horizontal axis marks the distance from the junctionwith the Cercavins River).
profiles are parallel (Fig. 8a); indeed, they are horizon-tal, just upstream of Sant Agustı Bridge for about 180 mand they all fall abruptly downstream of that bridge.The reason for this is that Sant Agustı Bridge acts asa dam (because the bridge’s spans cannot convey all theflow) and, thus, the water builds up behind it and even-tually jumps over it, like over a weir; in other words,the bridge causes a raise of the water level above the onethat could have been observed had not the bridge been in
place. Actually, Agustı Bridge caused a raise of the wa-ter surface of 1 m for the 1842 flood’s peak (210 m3 s−1)
and of 3.4 m for the 1644 flood’s peak (1600 m3 s−1),as can be seen in Fig. 8a. This explains the concen-tration of historical flood information at Sant AgustıStreet: the over-risen flow easily flooded that area, caus-ing much damage and, therefore, a great impact of thefloods, which were recorded on limnimarks and writtenaccounts.
2. On the other hand, in scenario B, which only differedfrom A in the 3-m-deep sediment layer, the water’s lon-gitudinal profile of the 1874 flood displays an horizontalsegment between 180 m and 300 m upstream of SantAgustı Bridge and then a steep slope between the end ofthat segment and the bridge, which becomes steeper af-ter the bridge (Fig. 8b). The deposition of the 3-m-deepsediment layer explains this behaviour, since it coveredthe bridge, thus reducing six times the channel’s lon-gitudinal slope just upstream of that structure and in-creasing it four times just downstream of it. Thus, thehydraulic configuration was no longer that of a dam, butthat of a succession of a slow segment, a faster one anda waterfall. In any case, 1874 modelled peak flow valuewas the same in either scenario A and B.
3. Finally, in scenario C, in spite of including the same 3-m-deep sediment layer, the flow behaviour of the 1930and 1989 floods is different from 1874’s for two rea-sons: the modest magnitude of these floods’ peak flowscompared to that of 1874 and the presence downstreamof the LV-2021 road’s bridge, which created a dam ef-fect that reached past Sant Agustı Street cross-section(Fig. 8c).
The comparison of peak flows and water heights at SantAgustı Street cross-section between 1842, 1930 and 1989floods, and between those of the 1874 flood in scenarios Aand B points out that, in spite of the section area reductioncaused by the deposition of the 3-m-deep sediment layer andthe construction of the Cartlist Wall, Sant Agustı Street cross-section is hydraulically more efficient in scenarios B and Cthan in A; that is, the same peak flow is conveyed with asmaller water height. This effect is more evident in lowerpeak flows (1842, 1930 and 1989 floods) and results in lessflooding due to modest events.
This hydraulic efficiency increase is due to the accelera-tion of the flow caused by, on the one hand, Manning’sn re-duction and, on the other hand, the absence of the Sant AgustıBridge, buried by the 1874 flood sediment layer, which actedas a dam in the occurrence of a heavy flood. Indeed,in thenew hydraulic conditions, the flow is much faster – its veloc-ity more than doubles – and, thus, has a higher destructioncapacity.
That sediment layer was deposited during the 1874 flood;not knowing if that happened before or after the peak flow,
Nat. Hazards Earth Syst. Sci., 11, 3359–3371, 2011 www.nat-hazards-earth-syst-sci.net/11/3359/2011/

J. C. Balasch et al.: Historical flash floods retromodelling in the Ondara River 3367
Fig. 9. Results of the sensitivity analyses performed by varying his-torically observed maximum water height(a) and Manning’sn (b).
that flood was modelled in both scenarios A and B. The luckyexistence of two additional limnimarks allowed us to de-cide that scenario B results fitted better with the actual flood(Fig. 8b) and, therefore, that the sediment was mainly de-posited before the peak flow, that is, during the ascendinglimb of the hydrograph.
Since the 1644 flood’s peak flow was even higher than1874’s, a similar sediment deposition might as well have oc-curred at that time. However, the 1668 Pier Maria Baldi’sdrawing does not show such an accretion and there is noproof of dredging between the flood’s and the drawing’sdates. Therefore, the 1874 flood’s sediment deposition mightbe related to factors other than the mere peak flow value, suchas the hydrograph shape, the flood’s duration or even possi-ble changes in land uses within the catchment.
4.2 Uncertainty assessment of the hydraulic modelling
The results of the sensitivity analyses displayed in Table 4and Fig. 9 show that the relationships between the variationof the modified input magnitudes and the variation of themodelled peak flow are linear within the explored range ofinput magnitude:
1. The first sensitivity analysis showed that each increase(decrease) of 5 cm in historically observed water height
Fig. 10. Modelled peak flows of the major floods occurred in theOndara River in Tarrega since the 17th century and their uncertain-ties.
causes an increase (decrease) of 4.5 % in a 1200 m3 s−1
peak flow modelled in scenario A.
2. The second sensitivity analysis showed that each in-crease (decrease) of 10 % in Manning’sn causes a de-crease (increase) of 1.5 % in a 1200 m3 s−1 peak flowmodelled in scenario A.
3. The third analysis showed that an increase of 10 % inManning’sn causes a decrease of 7 % in a 300 m3 s−1
peak flow modelled in scenario C; whereas a decreaseof up to 50 % causes no variation, and a decrease ofa further 10 % causes an increase of 17 % in the peakflow. The reason of the strange shape of this relationshipis that this peak flow is coincidentally the critical flowand, in such a case, the hydraulic modelling softwarefinds the same resulting flow even if the input data aremodified within a range around their critical values.
According to these results and to the fact that it is far moredifficult to estimate the channel’s roughness than to mea-sure a water height, Manning’sn had a much greater influ-ence in peak flow uncertainty than historically observed wa-ter height, and that influence was even greater in low flows.
As a first approach to quantifying the results accuracy,we applied the results of the first and the second analysesto high flows (1644 and 1874 floods) and those of the firstand the third ones to low flows (the rest of the floods) andthen quadratically summed the resulting relative uncertain-ties, and obtained that peak flow uncertainty was±4 % forhigh peak flows and (−18 %, +4.5 %) for low peak flows,except for the 1783 flood, which was (−18 %, +0.45 %) (Ta-ble 5 and Fig. 10). The assimetry of the uncertainty inter-vals for low peak flows is caused by the strange shape of thethird sensitivity analysis explained above. This uncertainty isvery low when compared to the 50 % estimated by Gaume etal. (2004) in flood reconstruction in the Aude River (France).
Indeed, our results’ uncertainty is underestimated becauseits assessment did not include the possible influence of
www.nat-hazards-earth-syst-sci.net/11/3359/2011/ Nat. Hazards Earth Syst. Sci., 11, 3359–3371, 2011

3368 J. C. Balasch et al.: Historical flash floods retromodelling in the Ondara River
Table 3. Results of the hydraulic modelling at the time of the peak flow.
Flood Scenario Reference Channel’s bottom Peak flow Specific peak Water height at Wetted area at Mean water velocity Froude’s number atcross height at reference (m3 s−1) flow 1147 cross 1147 cross at 1147 cross 1147 cross
section∗ cross-section (m a.s.l.) (m3 s−1 km−2) section (m) section (m2) section (m s−1) section
1615
A
1245 359.0 790 5.3 7.3 293 2.7 0.381644 1147 358.2 1600 10.7 10.19 516 3.1 0.391783 1147 358.2 490 3.3 6.71 233 2.1 0.381842 1147 358.2 210 1.4 5.3 124 1.7 0.36
1874A
1147358.2 1190 7.9 9.06 425 2.8 0.39
B 361.5 1190 7.9 5.76 277 4.3 0.63
1930C
1123 361.0 280 1.9 2.5 67 4.2 1.001989 1123 361.0 260 1.7 2.4 63 4.1 1.00
∗ The reference cross-section is the closest one to the historical water height observation and its number is the distance (in metres) from the cross-section to the downstream extremeof the reach: the junction of the Ondara with the Cercavins River.
Table 4. Results of the sensitivity analyses performed by varying historically observed maximum water height and Manning’sn.
Peak flow variation Peak flow variationdue to a variation of 5 cm in due to a variation of
historically observed water height 10 % in Manning’sn
Sensitivity Scenario Peak flow Modified input Results validity Peak flow Peak flow Results validity Peak flow Peak flowanalysis (m3 s−1) magnitude rangea variation variation rangeb variation variation
(cm) (%) (m3 s−1) (%) (%) (m3 s−1)
1 A 1200 Water height −50 to 100 4.5 54 – – –
2 A 1200 Manning’sn – – – −50 to 80 −1.5 −18
3 C 300 Manning’sn – – –−65 to−50 −17 −5.1
−50 to 0 0 00 to 80 −7 −2.1
a Range of historically observed water height in which the relationship between variation of historically observed water height and variation of modelled peak flow is linear.b Range of Manning’sn in which the relationship between variation of Manning’sn and variation of modelled peak flow is linear.
morphological factors’ uncertainties (i.e. longitudinal slope)and of the use of certain hydraulic modelling options (a one-dimensional, steady flow) instead of more realistic ones (atwo-dimensional, unsteady flow). For example, the recon-structed peak flow of the 1874 flood in the neighbouring SioRiver’s catchment decreases 8 % if modelled as an unsteadyinstead of a steady flow, probably due to the former takinginto account floodplain storage (Tuset, 2011).
4.3 Hydrological analysis of the peak flows
Four out of the seven studied floods (1615, 1783, 1842 and1874) are listed in some compilations of historical floodsin the Iberian Peninsula (Barriendos and Rodrigo, 2006;Barnolas and Llasat, 2007), which classify them as LargeCatastrophic Events (LCE), that is, floods that simultane-ously affected two or more large basins.
Oddly enough, and despite its magnitude, the 1644 floodis not collated in these compilations and neither is there arecord of it in neighbouring catchments. Therefore, thisevent was most probably caused by a very local storm overan area of less than 200 km2.
It was indeed a heavy flood, because its modelled specificflow (10.7 m3 s−1 km−2), along with that of the 1874 flood(7.9 m3 s−1 km−2), were much higher than the highest evermeasured in similar-sized catchments within the Ebro Riverbasin: 5.4 m3 s−1 km−2 in the Seco River at Oliete in 1945and 3.3 m3 s−1 km−2 in the Algars River at Horta de SantJoan in 1967 (Lopez-Bustos, 1981).
However, an overestimation of the modelled peak flowsshould be ruled out because these specific flows are con-gruent with the highest modelled in similar-sized Cata-lan catchments, which have an enveloping curve value of10 m3 s−1 km−2 (Gaume et al., 2009). Similarly, Delrieu etal. (2005) and Payrastre et al. (2005) have modelled specificflows of this order in neighbouring Southern France.
4.4 Temporal trends
The reconstructed peak flows are shown on a time scale inFig. 10. The floods temporal distribution is quite regular; theperiods between them are of 30–60 yr, except between 1644and 1783 (139 yr).
Nat. Hazards Earth Syst. Sci., 11, 3359–3371, 2011 www.nat-hazards-earth-syst-sci.net/11/3359/2011/

J. C. Balasch et al.: Historical flash floods retromodelling in the Ondara River 3369
Table 5. Peak flow error intervals due to historically observed water height and Manning’sn. (Precision of the historically observed waterheight was 0.5 cm when obtained from limnimarks (1640, 1783 and 1874 floods) and 5 cm when obtained from other historical sources (1615,1842, 1930 and 1989) and Manning’sn precision was estimated as 25 % in all cases; accordingly to the sensitivity analyses, the relative errorof the peak flow due to a 5 cm error in historically observed water height was 4.5 %, and that due to a 10 % increase in Manning’sn was−1.5 % for high peak flows and−7 % for low peak flows and 1.5 % and 0 %, respectively, for a 10 % decrease in Manning’sn; 1000 m3 s−1
was the limit chosen between high and low peak flows).
Flood Peak flowPeak flow relative Peak flow absolute error
(m3 s−1)error interval extremes (%) interval extremes (m3 s−1)
Negative Positive Negative Positive
1615 790 −18 4.5 −140 401644 1600 −4 4 −60 601783 490 −18 0.45 −90 21842 210 −18 4.5 −40 101874 1190 −4 4 −50 501930 280 −18 4.5 −50 101989 260 −18 4.5 −50 10
All the studied floods that took place within the LittleIce Age (LIA) – that is, between the 15th and 19th cen-turies (Pfister et al., 1996) –, except that of 1644, occurredin periods in which catastrophic flash floods were more fre-quent in Catalonia: 1580–1620, 1760–1800 and 1830–1870(Barriendos and Martin-Vide, 1998; Llasat et al., 2005).
However, this higher frequency does not seem to be re-lated to climate evolution since there are differences betweenthose periods: the first and the last of them were especiallycold and wet, whereas the second one, known as Malda’sanomaly, was very dry (Barriendos and Llasat, 2003). Fur-thermore, during the coldest period within the LIA in Centraland Northern Europe, the Late Maunder Minimum (1675–1715), no floods were recorded in the Ondara’s catchment.Therefore, the extreme weather that caused the five pre-1900flash-floods does not seem to be related to a period’s wetnessor coldness.
Nevertheless, pre- and post-1900 floods might have haddifferent climatic causes. Indeed, the five pre-1900 floods oc-curred between late July and late September and all of them –except again the 1644 flood, which was exceptional in morethan one way – did not last long, a sign of their convectiveorigin. Conversely, post-1900 floods both took place in thesecond half of October and were caused by weather fronts.
5 Conclusions
There is no flow gauging data of the Ondara River; never-theless, the great availability of historical information aboutfloods and urban evolution of the town of Tarrega allowed thehydraulic reconstruction of the major floods occurred sincethe 17th century.
This reconstructed information will probably improveflood prediction in Tarrega, because of the magnitude of the
modelled floods: two of the calculated specific peak flows areamong the highest ever modelled in similar-sized catchmentsin the Western Mediterranean basin.
Besides, archaeological surveys uncovered a great modifi-cation in the channel’s and floodplain’s morphology operatedby 1874 flood: a 3-m-deep sediment layer deposition. Af-terwards, our reconstruction proved that this deposition oc-curred before the peak flow and, thus, had an influence onthe flood’s characteristics: it accelerated the flow and, there-fore, it increased its destruction capacity. At the same time,this morphology change caused the modest flows to be lessprone to flooding than previously.
The sensitivity analyses showed that Manning’sn hadmore influence in the modelled peak flows values than waterheight. Furthermore, a preliminary uncertainty assessmenttaking only into account observed water height and Man-ning’sn estimated the peak flows’ error in 4 % for high flowsand 18 % for low flows.
Acknowledgements.We thank the anonymous people who decidedto keep records of ancient floods, either in the form of limnimarksor written accounts, which allowed the reconstruction of theseevents. We also thank Ruben Remacha (University of Lleida) andFrancesc Marsa (Catalonia Water Agency), who told us aboutTarrega’s limnimarks; Oriol Saula (Urgell County Museum), whotold us a lot about Ondara’s floodplain’s morphology evolution; andMiquel Angel Farre (Urgell County Archive), who helped us to findsome documents. We also thank the two anonymous referees whoreviewed the text and the editor of the volume Aristides Bartzokasfor their work in improving the article. One of the authors belongsto the RIUS Fluvial Dynamics Research Group (UdL) and wasfunded by the Catalonia Water Agency (ACA) (CV08000251).
Edited by: A. BartzokasReviewed by: two anonymous referees
www.nat-hazards-earth-syst-sci.net/11/3359/2011/ Nat. Hazards Earth Syst. Sci., 11, 3359–3371, 2011
3370 J. C. Balasch et al.: Historical flash floods retromodelling in the Ondara River
References
Balasch, J. C., Ruiz-Bellet, J. L., Tuset, J., and Martın de Oliva,J.: Reconstruction of the 1874Santa Tecla’s rainstorm inWestern Catalonia (NE Spain) from flood marks and histori-cal accounts, Nat. Hazards Earth Syst. Sci., 10, 2317–2325,doi:10.5194/nhess-10-2317-2010, 2010a.
Balasch, J. C., Tuset, J., and Ruiz-Bellet, J. L.: Reconstructing the1874 Santa Tecla flash flood in the Ondara River (Ebro Basin,NE Spain), Adv. Geosci., 26, 45–48,doi:10.5194/adgeo-26-45-2010, 2010b.
Barnolas, M. and Llasat, M. C.: Metodologıa para el estudio deinundaciones historicas en Espana e implementacion de un SIGen las cuencas del Ter, Segre y Llobregat. CEH-CEDEX, Mono-grafıas M-90, Ministerio de Fomento, Madrid, 264 pp., 2007.
Barriendos, M. and Llasat, M. C.: The case of the “Malda” anomalyin the Western Mediterranean basin (AD 1760–1800): an exam-ple of a strong climatic variability, Climatic Change, 61, 191–216, 2003
Barriendos, M. and Martın-Vide, J.: Secular climatic oscillationsas indicated by catastrophic floods in the Spanish Mediterraneancoastal area (14th–19th centuries), Climatic Change, 38, 473–491, 1998.
Barriendos, M. and Rodrigo, F. S.: Study of historical flood eventson Spanish rivers using documentary data, Hydrol. Sci. J., 51,765–783, 2006.
Bayliss, A. C. and Reed, D. W.: The use of historical data in floodfrequency estimation, CEH-NERC, Wallingford, UK, 2001.
Benito, G., Dıez-Herrero, A. M., and Fernandez de Villalta, M.:Magnitude and frequency of flooding in the Tagus basin (centralSpain) over the last millennium, Climate Change, 58, 171–192,2003.
Benito, G., Thorndycraft, V. R., Rico, M., Sanchez-Moya, Y.,and Sopena, A.: Paleoflood and floodplain records from Spain:Evidence for long-term climate variability and environmentalchanges, Geomorphology, 101, 68–77, 2008.
Chow, V. T.: Open-channel hydraulics, McGraw-Hill, New York,680 pp., 1959.
Confederacion Hidrografica del Ebro (CHE): Propuesta de PlanHidrologico de la Cuenca del Ebro, Anexo 2: Aportaciones delas estaciones de aforo. Ministerio de Medio Ambiente, MedioRural y Marino, Madrid, 1996.
Delrieu, G., Ducrocq, V., Gaume, E., Nicol, J., Payrastre, O., Yates,E., Kirstetter, P. E., Andrieu, H., Ayral, P. A., Bouvier, C.,Creutin, J. D., Livet, M., Anquetin, S., Lang, M., Neppel, L.,Obled, C., Parent-du-Chatelet, J., Saulnier, G. M., Walpersdorf,A., and Wobrock, W.: The Catastrophic Flash-Flood Event of8–9 Septembre 2002 in the Gard Region, France: A First CaseStudy of the Cevennes-Vivarais Mediterranean Hydrometeoro-logical Observatory, J. Hydrometeorol., 6, 34–52, 2005.
Gaume, E., Livet, M., Desbordes, M., and Villeneuve, J.: Hydro-logical analysis of the river Aude, France, flash flood on 12 and13 November 1999. J. Hydrol., 286, 135–154, 2004.
Gaume, E., Bain, V., Bernardara, P., Newinger, O., Barbuc,M., Bateman, A., Blaskovicova, L., Bloschi, G., Borga, M.,Dumitrescu, A., Daliakopoulos, I., Garcia, J., Irimescu, A.,Kohnova, S., Koutroulis, A., Marchi, L., Matreata, S., Medina,V., Preciso, E., Sempere-Torres, D., Stancalie, G., Szolgay, J.,Tsanis, I., Velasco, D., and Viglione, A.: A compilation of dataon European flash floods, J. Hydrol., 367, 70–78, 2009.
Lang, M., Fernandez-Bono, J. F., Recking, A., Naulet, R., andGrau-Gimeno, P.: Methodological guide for paleoflood and his-torical peak discharge estimation, in: Systematic Paleoflood andHistorical Data for the Improvement of Flood Risk Estimation,edited by: Bernito, G. and Thorndycraft, V. R., MethodologicalGuidelines, Centro de Ciencias Medioambientales, Madrid, 43–53, 2004.
Llasat, M. C., Rigo, T., and Barriendos, M.: The “Montserrat-2000”flash-flood event: a comparison with the floods that have oc-curred in the northeastern Iberian Peninsula since the 14th cen-tury, Int. J. Climatol., 23, 453–469, 2003.
Llasat, M. C., Barriendos, M., Barrera, T., and Rigo, T.: Floods inCatalonia (NE Spain) since the 14th Century, Climatological andmeteorological aspects from historical documentary sources andold instrumental records, J. Hydrol., 313, 32–47, 2005.
Lopez-Bustos, A.: Tomando el pulso a las grandes crecidas de losrıos peninsulares, Revista de Obras Publicas, 3190, 179–192,1981.
Naulet, R., Lang, M., Ouarda, T. B. M. J., Coeur, D., Bobee, B.,Recking, A., and Moussay, D.: Flood frequency analysis on theArdeche river using French documentary sources from the lasttwo centuries, J. Hydrol., 313, 58–78, 2005.
Ortega, J. A. and Garzon, G.: A contribution to improved floodmagnitude estimation in base of palaeoflood record and cli-matic implications – Guadiana River (Iberian Peninsula), Nat.Hazards Earth Syst. Sci., 9, 229–239,doi:10.5194/nhess-9-229-2009, 2009.
Payrastre, O., Gaume, E., and Andrieu, H.: Use of historicaldata to assess the occurrence of floods in small watershedsin the French Mediterranean area, Adv. Geosci., 2, 313–320,doi:10.5194/adgeo-2-313-2005, 2005.
Pfister, C., Swartz-Zanetti, G., and Wegmann, M.: Winter severityin Europe: The Fourteenth Century, Climatic Change, 34, 91–108, 1996.
Remo, J. W. F. and Pinter, N.: Retro-modeling the Middle Missis-sipi River, J. Hydrol., 337, 421–435, 2007.
Thorndycraft, V., Barriendos, M., Benito, G., Rico, M., and Casas,A.: The catastrophic floods of AD 1617 in Catalonia (northeastSpain) and their climatic context, Hydrol. Sci. J., 51, 899–912,2006.
Tuset, J.: Reconstruccio de l’aiguat de Santa Tecla en el riu Ondaraa Tarrega a partir de limnimarques i restes de diposits decantats.Unpublished Master Thesis, ETSEA, University of Lleida, 224pp., 2007.
Tuset, J.: Reconstruccio de l’aiguat de Santa Tecla (23 de setembrede 1874) en el riu Sio a partir de documentacio historica, Un-published Master Thesis, ETSEA, University of Lleida, 40 pp.,2011.
US Army Corps of Engineers (USACE): HEC-RAS River AnalysisSystem: Hydraulic Reference Manual, US Army Corps ofEngineers Hydrologic Engineering Center, Davis, CA, 2008.
Historical sources
Anonymous: La rubina del dissabte passat, Cronica Targarina, 478,(25 October 1930), Tarrega, 1930.
Arxiu Comarcal de l’Urgell (ACUR): Nota de la rubina de l’any1615, ACUR, FMT, Llibre d’Actes i Memories, 1603–1621,p. 1v, 1621.
Nat. Hazards Earth Syst. Sci., 11, 3359–3371, 2011 www.nat-hazards-earth-syst-sci.net/11/3359/2011/

J. C. Balasch et al.: Historical flash floods retromodelling in the Ondara River 3371
Castella, J. and Miranda, C.: Fuertes riadas en varias comarcas deCataluna, Un desaparecido en Tarrega, La Vanguardia, 38.751(29 October 1989), 44, Barcelona, 1989.
Coma, M. T.: Les inundacions en el terme municipal de Tarrega,Urtx, 2, 249–259, 1990.
Espinagosa, J., Gonzalvo, G., and Coma, T.: La rubinada de SantaTecla de 1874 a Tarrega, Ed. facsımil., Natan Estudis, Ajunta-ment de Tarrega, Tarrega, 110 pp., 1996.
Farre, M. A.: Fenomens naturals i religiositat a la Tarrega delssegles XVI–XIX, Urtx, 22, 151–164, 2008.
Iglesies, J.: L’aiguat de Santa Tecla (23 de setembre de 1874),.Episodis de la Historia no 156, R. Dalmau, Barcelona, 62 pp.,1971.
Parets, M.: De los muchos sucesos dignos de memoria que hanocurrido en Barcelona y en otros lugares de Cataluna (1626–1660), in: Memorial Historico Espanol, edited by: Pujol, C.,XXIII, Madrid, 1891.
Salvado, J.: Memoria de la inundacion acaecida en la villa deTarrega en la madrugada del dıa 23 de Setiembre del ano 1874con una resena historico-crıtica de las que tuvieron lugar en lamisma villa en 17 de Setiembre de 1644, en 17 de Setiembre de1783 y en 25 de Agosto de 1842, Establecimiento Tipografico deRamırez y Comp., Barcelona, 1875.
Segarra, J. M.: Historia de Tarrega amb els seus costums i tradi-cions, Museu Comarcal de Tarrega, Tarrega, Espana, Vol. II(Segle XVI–XVIII), 1987.
Vila, M. A.: Catalunya: rius i poblament, Publicacions de l’Abadiade Montserrat, Barcelona (Col. Cavall Bernat, 30), 223 pp., 1998.
www.nat-hazards-earth-syst-sci.net/11/3359/2011/ Nat. Hazards Earth Syst. Sci., 11, 3359–3371, 2011