historical data on australian whale
TRANSCRIPT


SC XX-XXXX
Page 1 of 22
Historical Data on Australian Whale
Vessel Strikes
David Peel1*, Joshua N Smith2 and Simon Childerhouse3
1 CSIRO, Data61, Marine Laboratories, GPO Box 1538, Hobart, TAS, 7001, Australia
2 Murdoch University Cetacean Research Unit, Murdoch University, Perth, Australia
3 Blue Planet Marine, Nelson, New Zealand
* Corresponding author: [email protected]
ABSTRACT
Based on existing data of the occurrence of vessel strike in Australia, Australian records
represent approximately 7% of all worldwide vessel strikes reported to the International
Whaling Commission. However, to date there has not been a dedicated Australian
collation of historical data sources. Therefore we conducted a search of historical
newspapers and other sources to discover reports of vessel strikes in Australian waters.
This updated analysis uncovered a significant number of new and previously unreported
records which means that Australia’s contribution of worldwide reported vessel strike has
now increased to approximately 17%. It is very important to note from the outset that this
does not necessarily reflect the actual proportion of global vessel strikes that have
occurred in Australia, as national and international vessel strike data have inherent
reporting biases and unknown coverage. However, the additional data collected in this
study does challenge the notion that historically Australia has had low numbers of vessel
strikes relative to the rest of the world. This data is yet to be cross-checked and validated
but we present a preliminary summary and exploration of the data. One interesting
finding was a distinct absence of large vessels in modern data but after examination we
believe this is most likely a reflection of under-reporting due to large modern vessels
possibly not detecting collisions.
INTRODUCTION
Collisions with vessels are a significant cause of anthropogenic mortality to baleen
whales and other large marine fauna worldwide. Given the substantial current and
projected increases in coastal/port development along the Australian coastline, and
associated rise in recreational and commercial vessel traffic (Figure 1), there is an
increasing potential for adverse interactions with marine species. Also contributing to
this potential increase in risk are strong population growth rates in some recovering
species in Australian waters, such as humpback whales (Jackson 2015, Noad 2008).
These factors along with improved methods for reporting and potential under-reporting
of vessel strikes in the past, demonstrate the importance of better understanding the
risk of vessel strikes on whales in Australia. Note the use of the word ‘vessel’ rather
than ship in this report. Although we do focus on larger commercial shipping, we are
interested in all interactions with all vessel sizes including small recreational boats.

SC XX-XXXX
Page 2 of 22
Figure 1 Increase in the number of cargo ships involved in coastal or international voyages that
made Australian port calls (BITRE 2015).
Shipping occurs around the whole of the Australian coastline, but with concentrations of
larger commercial shipping around the major ports, inside the Great Barrier Reef, the
East coast and the North-west shelf of Australia (Figure 2).
To help in understanding the issue of vessel strike and its potential impacts, an accurate
record of previous incidents is invaluable. To this end, considerable attention has
already been given to collating records of national and international cetacean vessel
strike incidents. For example: Laist et al. (2001), Jensen et al. (2004), Van Waerebeek et
al. (2007), IWC (2010), Neilson et al. (2012), Ritter (2012) and Félix and Van Waerebeek
(2005). The resulting data has relatively few Australian records (i.e., 35 Australian
records out of 539 worldwide records up until 2010 (IWC 2010). Furthermore, the
majority of the 35 Australian records are from the last 20 years. Australia began
formally reporting vessel strike mortalities to the IWC in National Progress Reports in
1997, which is where 33 of the 35 Australian records appear to originate. So, for the
purposes of this paper, we refer to 1997 onwards as modern data and pre-1997 as
historic data.
Figure 2 2014 shipping (>24m) density (nautical miles travelled in 1x1 nautical mile cell) for the
Australian Economic Zone. Based on AMSA AIS data; credit data Geoff Hosack (CSIRO).
Years
020
0040
00
1998
–99
1999
–00
2000
–01
2001
–02
2002
–03
2003
–04
2004
–05
2005
–06
2006
–07
2007
–08
2008
–09
2009
–10
2010
–11
2011
–12
2012
–13
2013
–14
Num
ber o
f ves
sels
NW Shelf

SC XX-XXXX
Page 3 of 22
This small number of reported incidents has sometimes led to an assumption that,
historically at least, vessel strike in Australian waters was low compared to worldwide
rates. However, there has never been any systematic and comprehensive collation of
historic Australian vessel strike records. As stated in Van Waerebeek et al. (2007) and
Jensen et al. (2004), most of the attention has been given to the Northern Hemisphere.
Van Waerebeek et al. (2007) worked towards addressing this by compiling data from the
Southern Hemisphere. This was mainly from current state databases (e.g., strandings),
so much of the data was modern. The only historic examination related to Australian
vessel strike seems to be Kemper (2008) which examined human related mortality and
injury for Australian Southern right whales, but this was mainly based on stranding
records.
We suggest it is problematic deriving conclusions regarding the rate of vessel strike in
Australia based on incomplete data and potentially biased and non-representative data.
To help in understanding any possible bias of the existing Australian historic data, we
completed a thorough review of vessel strike incidents to date. With the advent of digital
media and digital archives we were able to search historical media for references to
shipping incidents involving whales. This resulted in the discovery of a large number of
previously unreported Australian vessel strikes. In addition to finding new Australian
records, we also found a substantial number of non-Australian reports from around the
world that do not appear to be in any existing databases.
In this paper, we present the new and updated Australian vessel strike data, along with
some simple exploratory analyses, and discuss further the implicit issues with data of
this type, such as reporting biases and the dangers of drawing conclusions based on
limited data.
METHODS
We searched various online archives (see Table 1) for past newspaper reports and other
records containing terms such as whale collision, whale strike and whale struck.
Table 1 Details of online archives searched
Database/Site Dates Address
Australian focus
Australian National Library 1824-1954 trove.nla.gov.au/
ProQuest (paid) 1996-2016 search.proquest.com/
Google Various www.google.com
Google news archive ~2004- news.google.com.au/newspapers
Non-Australian focus
British Newspaper archive (paid) 1710-1959 www.britishnewspaperarchive.co.uk/
US library of Congress 1836-1922 chroniclingamerica.loc.gov/
California Digital Newspaper Collection 1846-2015 cdnc.ucr.edu/
NYS Historic Newspapers 1795-2015 nyshistoricnewspapers.org/
Fulton Historic Newspapers Various www.fultonhistory.com/Fulton.html
Internet Archive Various archive.org
SC XX-XXXX
Page 4 of 22
The definition of what constitutes a vessel strike is not as straight forward as we
initially thought. There have been incidents reported where whales were said to
“attack” ships (see Results section) or collide with stationary vessels at anchor. These
incidents were included in our collation as we are interested in all physical vessel-whale
interactions. Therefore, for our purposes, the definition of a vessel strike is any physical
interaction (both fatal and non-fatal) between a vessel and a cetacean. We excluded
collisions with whaling vessels as these interactions are unlikely to be representative of
typical vessel or typical whale behaviour. Upon finding a reported incident, we recorded
various details (as per Table 2) and saved a pdf file of the article(s). For many records
not all information was reported so there is incomplete details in our data.
Most of the newspaper articles and other online reports provided the name of the vessel
involved. Through further online searches (i.e., Lloyd’s Register of Ships) and general
web searches, we found details such as vessel dimensions and type.
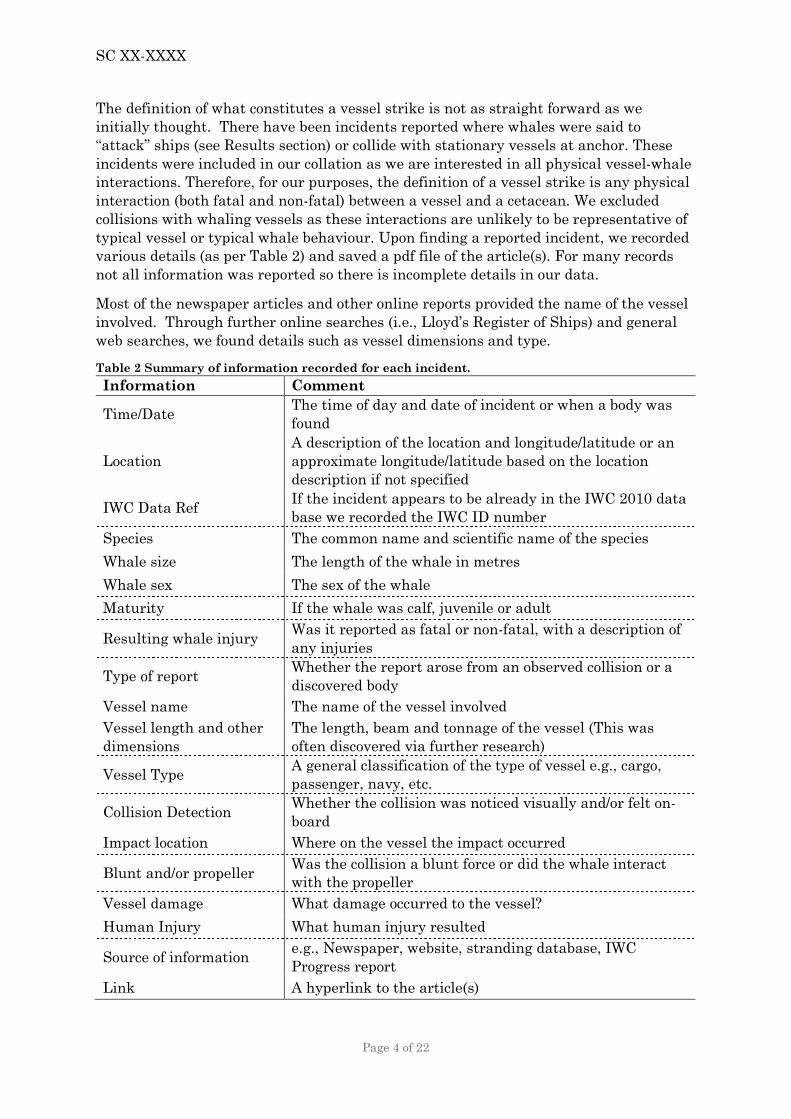
Table 2 Summary of information recorded for each incident.
Information Comment
Time/Date The time of day and date of incident or when a body was
found
Location
A description of the location and longitude/latitude or an
approximate longitude/latitude based on the location
description if not specified
IWC Data Ref If the incident appears to be already in the IWC 2010 data
base we recorded the IWC ID number
Species The common name and scientific name of the species
Whale size The length of the whale in metres
Whale sex The sex of the whale
Maturity If the whale was calf, juvenile or adult
Resulting whale injury Was it reported as fatal or non-fatal, with a description of
any injuries
Type of report Whether the report arose from an observed collision or a
discovered body
Vessel name The name of the vessel involved
Vessel length and other
dimensions
The length, beam and tonnage of the vessel (This was
often discovered via further research)
Vessel Type A general classification of the type of vessel e.g., cargo,
passenger, navy, etc.
Collision Detection Whether the collision was noticed visually and/or felt on-
board
Impact location Where on the vessel the impact occurred
Blunt and/or propeller Was the collision a blunt force or did the whale interact
with the propeller
Vessel damage What damage occurred to the vessel?
Human Injury What human injury resulted
Source of information e.g., Newspaper, website, stranding database, IWC
Progress report
Link A hyperlink to the article(s)

SC XX-XXXX
Page 5 of 22
General issues There are a range of issues with the interpretation of vessel strike data. Most
importantly it is generally accepted that many incidents will go unreported due to not
being detected (Laist et al. 2001; Jensen et al. 2004). As well as this lack of detection,
there are also likely to be reporting biases which relate to the following:
Species – different species may have differing reporting biases in terms of bodies being
found (e.g., right whales float longer than humpback whales). Furthermore, for
data based on witness accounts, there is potential for the eyewitness to report the
most well-known species rather than the real species.
Spatial bias – discovery rates will vary depending on: (a) where the strike occurs;
and/or (b) on where the body washes up (e.g., strikes near the coast are more likely
to wash up and strandings near populated areas are more likely to be discovered).
Vessel bias – a strike is more likely to be noticed and reported on passenger vessels
and smaller vessels and hence these vessels are likely to be better represented in
the data. This is particularly the case for whale-watching vessels where even minor
interactions are frequently noticed and documented.
RESULTS
The search of the sources in Table 1 found reports of numerous Australian vessel strikes
reports between 1840 and 2015 (see Figure 3 and summary in the Appendix).
Specifically, the 2010 ship strike database (IWC 2010) contained a total of 35 distinct
records in Australian waters, roughly 7% of the worldwide records to 2010. As per Table
3, we found potentially 65 additional pre-2010 records (plus 9 records in annual
Progress reports that did not seem to be in the IWC 2010 database). This brings the
total to 109 which corresponds to approximately 23% of the world wide records.
However, as a by-product of our search we also found potentially ~145 additional non-
Australian records that do not appear to be in the existing 2010 IWC database.
Assuming these records are valid, the Australian records would be approximately 17% of
the world wide data to 2010. We collated records from Australian National Progress
Reports post-2010 and identified 32 new potential records that have not been previously
reported.
Figure 3 Existing Australian vessel strike reports and our new data over time polled into 2 year
blocks.
Year
Num
ber o
f rep
orte
d ve
ssel
stri
kes
05
1015
1872 1888 1900 1912 1924 1936 1948 1960 1972 1984 1996 2008
ExistingDiscovered

SC XX-XXXX
Page 6 of 22
Table 3 Summary of number of reports.
Pre-2010 2010-2015
IWC 2010 35 -
Progress Rep. not in IWC 2010 9 16
Potentially newly found 65 16
Total 109 32
Data caveats This paper is a very preliminary examination of the data. Further data
processing/cleaning is required. Therefore, there are a number of caveats associated with
the data collected:
1. The new records have not been thoroughly validated to the same standard criteria
as used in the IWC database (IWC 2010). Furthermore, we only compared the new
data to records within the 2010 version of the IWC database; if any new records have
been added since 2010, they were not considered.
2. There is the possibility that some of our ‘new’ records could have already been
identified and discounted. For example, we found some incidents in the Australian
National Progress Reports that were not in the 2010 IWC database and added these
to our data. We feel it is better to include these in the database, flag them and detail
why they were discounted, so that they are not mistakenly added in future.
3. We found a large number of reports from racing yachts (particularly while
competing in the Sydney to Hobart race held annually in late December). For the
majority of these reports it is unknown exactly what species was hit and it is possible
that rather than a whale, the animal involved could have been something else (e.g.,
ocean sunfish, shark or even shipping container).
4. Since much of our data is based on witness reports rather than officially reported
data, there is always the possibility for incorrect details and information. We did
find one instance of misreporting, where in initial reports witnesses described a
collision with a whale, but later reports investigated the accident further and cast
doubt on the original story suggesting it was a large wave that capsized the vessel.
Again in our opinion, these incidents should be included in the data and flagged, to
avoid the incident being mistakenly added in future.
Vessel strike rate It would not be wise to take the reported vessel strike rate too literally as it is a reporting
rate and, as per the caveats already discussed, it may not reflect the true vessel strike
rate. However, it is a worthwhile exercise to examine the data and investigate any
patterns in reporting rate.
Laist et al. (2001) found pre-1951 reported vessel strike incidents worldwide to be ‘rare’
with only 14 records (Note: Laist et al. (2001) only considers motorised vessels).
Similarly, the 2010 IWC database only lists 18. However, online newspaper archives
provided additional pre-1951 strikes, with 40 Australian and potentially 140 non-
Australian new incidents discovered (Figure 4). Therefore, the historic incidence of
vessel strike may not be as rare as previously thought. Furthermore, Laist et al. (2001)
found a large increase in vessel strike data post-1951, which they attribute to increased
vessel numbers, size and speed. However, this was not seen in the Australian data,
where we found a lull in reports for this period, with only 17 records up until 1999
(Figure 4). We expected to see some decrease in vessel strikes due to the extreme
sequential depletion of whales stocks in Australian waters, leading up to the early
1960’s. To illustrate this potential interaction, we can look at the Australian humpback

SC XX-XXXX
Page 7 of 22
whales estimated historical population trajectory (Jackson 2015) and shipping fleet size
(we only have worldwide data for this) together (Figure 5). From these figures, we would
expect the rate of humpback-vessel strikes to increase after approximately 1960 due to
recovering whale stocks and increasing vessel traffic and speed. The most likely reason
that this was not seen in our data is the temporal coverage of the main online data bases
(Table 1) that were available. The online databases mainly cover up until 1954 and from
1996 onwards (see Figure 6). Although, we did find some data between 1950 and 1996
with general web searches and within the diminished coverage of TROVE. So therefore,
there is a distinct gap in data coverage between 1954 and 1996 meaning that reporting
rate from this period is likely to be even more negatively biased.
In the more recent data there was an obvious increase in vessel strike reports around
1998 (Figure 3). As outlined previously, this is most likely an artefact of the instigation
of a formal vessel strike reporting regime to the IWC via National Progress Reports, but
also highlights that reporting rates prior to this time were likely to be negatively biased.
Figure 4 Comparison of Australian and non-Australian records over time, as discovered in this
study (based on IWC 2010 data and our additional new worldwide records). Note that extra non-
Australia records were not the focus of this study but were discovered incidentally when
searching for Australian records.
Figure 5 General shape of estimated population trajectory for Australian humpback whales (i.e.,
a summation of Breeding Stocks D and E; (Jackson 2015) as the blue line, compared to worldwide
ship numbers, given as pink areas, based on Lloyd’s Register of Ships (Endresen et al. 2007).
1850 1900 1950 2000
010
2030
4050
60
Year
Num
ber o
f rep
orte
d ve
ssel
stri
kes
AustralianNon-Australian
1900 1920 1940 1960 1980 2000 2020
010
000
2000
030
000
4000
050
000
Year
Aus
. Hum
pbac
k po
pula
tion
size
010
000
2000
030
000
4000
050
000
Num
ber o
f shi
ps (1
000)
Aus. humpbackShipsSail

SC XX-XXXX
Page 8 of 22
Figure 6 A comparison of search effort in terms of the number of digitised newspaper articles
searched in data bases and IWC National Progress Report timing relative (coloured blocks) to the
number of Australian vessel strike data points per 2 years (green line).
Australian vessel strike data In essence, the Australian data series consists of two disparate data sets: a historic (pre-
1997) and a modern (post-1997) data set. The historic series primarily arises from
newspaper reports and the modern series, predominantly from IWC data collection via
National Progress Reports (i.e., more direct reporting of incidents from Government
agencies and researchers).
One complication of having these two underlying data sources, is that historical
newspaper reports mainly dealt with actual witnessed collisions whereas strandings
were infrequently reported. If a stranding was reported, there was often little or no
information included on the likely cause of death. In contrast, modern data has a
significant proportion of data arising from strandings (Figure 7). Furthermore, the data
available from a stranding is quite different from a report of a collision. As an example,
for strandings we generally have a known species but unknown vessel, whereas collision
reports generally provide the opposite. This is reflected in the modern data, with a
higher proportion of known species (Figure 8) and a decreasing proportion with known
vessel (Figure 9).
Figure 7 Proportion of Australian reported vessel strikes that came from observed collisions
(light green) or discovered bodies (dark green) in each 5-year block, with hatched grey
indicating no recorded reports.
Year
Pro
porti
on o
f rep
orts
0.0
0.2
0.4
0.6
0.8
1.0
1870 1890 1910 1930 1950 1970 1990 2010
CollsionStranding

SC XX-XXXX
Page 9 of 22
Figure 8 Proportion of Australian vessel strike reports with known species.
Figure 9 Proportion of Australian vessel strike reports with known vessel.
Species Jensen et al. (2004) found world-wide reported vessel strikes predominantly involved
fin, followed by humpback, Northern right, gray, minke, sperm, Southern right and blue
whales. For the Southern Hemisphere, Van Waerebeek et al. (2007) describes reports for
mainly Southern right (56 reports), humpback (15) and Bryde’s whales (13), sperm (8),
blue (5), sei (4) and fin whales (2). In the majority of vessel strike records for our
Australian data, the species was unknown. In the records with known species, the
majority involved humpback, Southern right and sperm whale (in descending order of
occurrence). As mentioned in the data caveats section, there is likely to be bias in the
reporting rates (e.g., witnesses may simply report the most commonly known whale viz.
humpbacks). When the historic and modern data are considered separately (Figure 10),
we can clearly see the disparity between the types of species recorded; specifically, the
large number of unknown species in the historic data. For the modern data, comparing
the species reported in Australian waters to the worldwide records, the most common
species and their relative order are similar, with the notable exception of fin whales
(Figure 10). Only one fin whale appears in the modern Australian data set, but they are
the second most commonly recorded species internationally. Van Waerebeek et al. (2007)
also observed this lack of fin whales in their Southern Hemisphere data.
Year
Pro
porti
on o
f rep
orts
0.0
0.2
0.4
0.6
0.8
1.0
1870 1890 1910 1930 1950 1970 1990 2010
Known speciesUnknown species
Year
Pro
porti
on o
f rep
orts
0.0
0.2
0.4
0.6
0.8
1.0
1870 1890 1910 1930 1950 1970 1990 2010
Known vesselUnknown vessel

SC XX-XXXX
Page 10 of 22
Figure 10 Vessel strike records by species for historic (up to 1997) and modern (from 1997) data
for Australian and worldwide reporting (IWC 2010+potential new records).
Spatial and temporal distribution Vessel strikes were reported around the whole Australian coastline, except for the
unpopulated Northern coast (Figure 11). Reports were predominately from Queensland
and New South Wales, but there were reports from all other States (Figure 12). Figure
11 and Figure 12 also clearly demonstrate the increase in modern reporting over time.
Looking at the distribution of reported incidents within the year, the pattern follows the
migratory timing of the main vessel struck species (Figure 13). Specifically, reports for
humpbacks and Southern right whales peak in August, corresponding to the peak time
when whales are migrating and/or have reached their mating/calving grounds near the
Australian coastline.
We found information on the time of day that the incident occurred for 19 records.
However, there did not seem to be any discernible pattern.
Fin
N.
Atla
ntic
rig
htS
perm
Hum
pbac
kS
outh
ern
right
Bow
head
Gra
yB
lue
sper
mbo
ttle
nos
e w
hale
Om
uraâ
€™s
wha
lem
inke
wha
leC
omm
on m
inke Sei
Pyg
my
sper
mH
ecto
r's b
eake
dC
uvie
r's b
eake
dB
ryde
'srig
ht w
hale
Sho
rt-f
inne
d pi
lot
Gra
y's
beak
edD
war
f m
inke
Pyg
my
blue
Sow
erby
's b
eake
dP
ygm
y rig
htU
nide
ntifi
ed
World historic
020406080
100120140
Hum
pbac
kF
inN
. A
tlant
ic r
ight
Spe
rmS
outh
ern
right
Com
mon
min
keG
ray
Bry
de's
Blu
eS
eiO
mur
a’
s w
hale
Pyg
my
sper
mC
uvie
r's b
eake
dP
ygm
y bl
ueH
ecto
r's b
eake
drig
ht w
hale
Sho
rt-f
inne
d pi
lot
Gra
y's
beak
edD
war
f m
inke
Sow
erby
's b
eake
dP
ygm
y rig
htB
owhe
adsp
erm
bott
le n
ose
wha
lem
inke
wha
leU
nide
ntifi
ed
World modern
0
20
40
60
80
100
Hum
pbac
k
Spe
rm
Om
ura'
s
Pilo
t w
hale
Uni
dent
ified
Australian historic
0
10
20
30
40
Hum
pbac
k
Sou
ther
n rig
ht
Spe
rm
Blu
e
Dw
arf
min
ke
Pyg
my
blue
Pyg
my
sper
m
Ant
arct
ic m
inke Fin
Pyg
my
right
Uni
dent
ified
Australian modern
0
10
20
30
40

SC XX-XXXX
Page 11 of 22
Figure 11 Approximate locations of reported vessel strike collisions and strandings where the
cause of death was attributed to vessel strike, by period for Australia.
Figure 12 Total number of reported vessel strikes by Australian state and territory from historic
(<1995) and modern (≥1995) data (NSW/TAS denotes mainly Sydney to Hobart yacht race reports
where exact location is unknown).
QLD
NS
W
WA
SA
TA
S
VIC
NS
W/T
AS
Unk
now
n
Ant
arct
ica
State
0
10
20
30
40
Num
ber o
f inc
iden
ts
ModernHistoric

SC XX-XXXX
Page 12 of 22
Figure 13 Seasonal distribution of Australian vessel strike reports by species: (a) all whales; (b)
humpback whales; (c) Southern right whales; and (d) sperm whales. images:credit: http://phylopic.org/
Vessels Interestingly, if we look at the length of the known vessels involved in collisions through
time, there is a clear increase in vessel length from the beginning of records through to
around 1941 (Figure 14). By contrast, for modern data, lengths of vessels involved in
ship strike incidents are much smaller than historical lengths. The historic data
predominantly contains reports from passenger vessels (Figure 15), which is consistent
with the idea that passenger vessels have an increased likelihood of the collision being
witnessed and reported to the newspapers. However, there were reports from all vessel
types and sizes. Vessel strikes making up the modern records mainly involved small
vessels or (reflecting the stranding data source) unknown vessel type. There does appear
to be a distinct lack of reports involving larger vessels in the modern data.
Figure 14 Distribution of known vessel lengths from Australian vessel strikes by 10-year period
for Australian vessel strike data.
0
5
10
15
20
25
30
Jan
Feb
Mar
Apr
May Jun
Jul
Aug
Sep Oct
Nov
Dec
(a)
0
2
4
6
8
10
12
Jan
Feb
Mar
Apr
May Jun
Jul
Aug
Sep Oct
Nov
Dec
(b)
0
1
2
3
4
5
Jan
Feb
Mar
Apr
May Jun
Jul
Aug
Sep Oct
Nov
Dec
(c)
Month Month
0
1
2
Jan
Feb
Mar
Apr
May Jun
Jul
Aug
Sep Oct
Nov
Dec
(d)
Month
Num
ber o
f rep
orte
d ve
ssel
stri
kes
1881
-189
1
1891
-190
1
1901
-191
1
1911
-192
1
1921
-193
1
1931
-194
1
1941
-195
1
1951
-196
1
1961
-197
1
1971
-198
1
1981
-199
1
1991
-200
1
2001
-201
1
2011
-201
5
0
50
100
150
200
Ves
sel l
engt
h(m
)
n=3 n=3 n=6 n=3 n=6 n=8 n=1 n=3 n=0 n=2 n=1 n=5 n=10 n=9

SC XX-XXXX
Page 13 of 22
Figure 15 Distribution (proportion of total) of vessel types, broken down into sizes1: small (approx.
<25 m), medium (approx. 25- 150 m) and large (> 150 m) for Australian vessel strike data. Historic
pre-1997 (top) and modern post-1997 (bottom).
The proportions of the various vessel types in our data does seem different to other data
sets, e.g., Jensen et al. (2004) found in order of prevalence: navy (17%), container/cargo
(15%), whale-watching (14%) passenger cruise (13%), ferry (12%), US coast guard (7%),
tanker (6%), recreation and steamship (5%), fishing (3%) and dredge (1%). However, as
discussed in Jensen et al. (2004), care must be taken interpreting numbers, as the
reporting rate between types of vessels is likely to be considerably different.
Laist et al. (2001) only considered motorised vessels as they found a lack of evidence
that collisions with non-motorised vessels caused significant injuries to whales. We did
find historical sail vessels could potentially cause injury to whales with the example of
the sailing ship the Barrossa reportedly killing a whale in 1903.
Confirming the point raised by Ritter (2012), we found a significant number of reports
from racing yachts competing in races. In Australia, as discussed in the section on data
caveats, this over-representation is possibly due to the media coverage of yacht races,
such as the Sydney to Hobart race. Furthermore, a limitation of this data is that the
species or taxa involved are often unidentified.
One of the stranger vessels in the data was the submarine HMAS Otway which, on 1
September 1971, damaged its periscope mast in a collision with a whale. This isn’t the
only potential incident involving a submarine: the US Submarine V1 collided with a
whale off New Hampshire coast in 1926; a German U-boat collided with a whale in the
Atlantic in 1940; and a report mentions the HMS Affray (P421) in 1948.
1 At this stage for a quick comparison the size categorisation was very approximate
0.00
0.02
0.04
0.06
0.08
0.10
0.12Size
LargeMediumSmallUnknown
0
His
toric
Sai
l
Rac
ing
Yac
ht
Sm
all
Pas
seng
er
Nav
y
Tug
Fis
hing
Car
go
Wha
le-W
Unk
now
n
0.25
0.20
0.15
0.10
0.05
Mod
ern

SC XX-XXXX
Page 14 of 22
Behaviour Laist et al. (2001) commented that a few of their reports suggest “a last-second flight
response”. We are yet to analyse this aspect of our reports. A preliminary examination
did provide some common witness accounts of whale behaviour. Five incidents had
witnesses refer to the whales being asleep/unmoving prior to the collision (based on
movement and the reaction to the collision, these animals were actually alive and not
simply already dead). As mentioned previously, there were also some accounts (~4) of
whales “attacking” vessels. Given the possible lack of understanding of whale behaviour
in historic times, and overall view of whales (informed by popular literature, such as
Moby-Dick), the veracity of some reports is potentially questionable and also the concept
of intent on the whales’ part is murky. However, it is interesting that a few of these
accounts refer to sperm whales. One incident reports after an initial accidental collision
the whale turned and “retaliated” with a second collision.
Injury If there was ever any question of the potential for injury, this is confirmed by the
descriptive accounts of whale injuries. Many describe the sea turning crimson, which
while dramatic, may be an accurate description in some cases. Based on our assessment
of all the new reports where the fate of the whale could be reliably determined (n=95),
52% were deemed to be fatal or likely to be fatal, 23% were reported as injuries or likely
to be injuries, and 25% were unharmed (i.e., non-fatal/uninjured) (Figure 16). However,
these results have high uncertainty as in all cases the medium to long term effect on the
animal from the collision is unknown.
The Australian data, included 2 human fatalities from vessel collisions with whales, 8
records of vessels sinking, capsizing and/or being abandoned and 20 vessels being badly
damaged.
Figure 16 Outcome of collisions for struck whales from Australian vessel strike data. Lighter
shaded boxes denote probable outcomes (e.g., light red is highly likely to be injured from the
description of the collision).
Fatal Injured Unharmed Unknown
Num
ber o
f rep
orts
010
2030
4050
010
2030
4050
SC XX-XXXX
Page 15 of 22
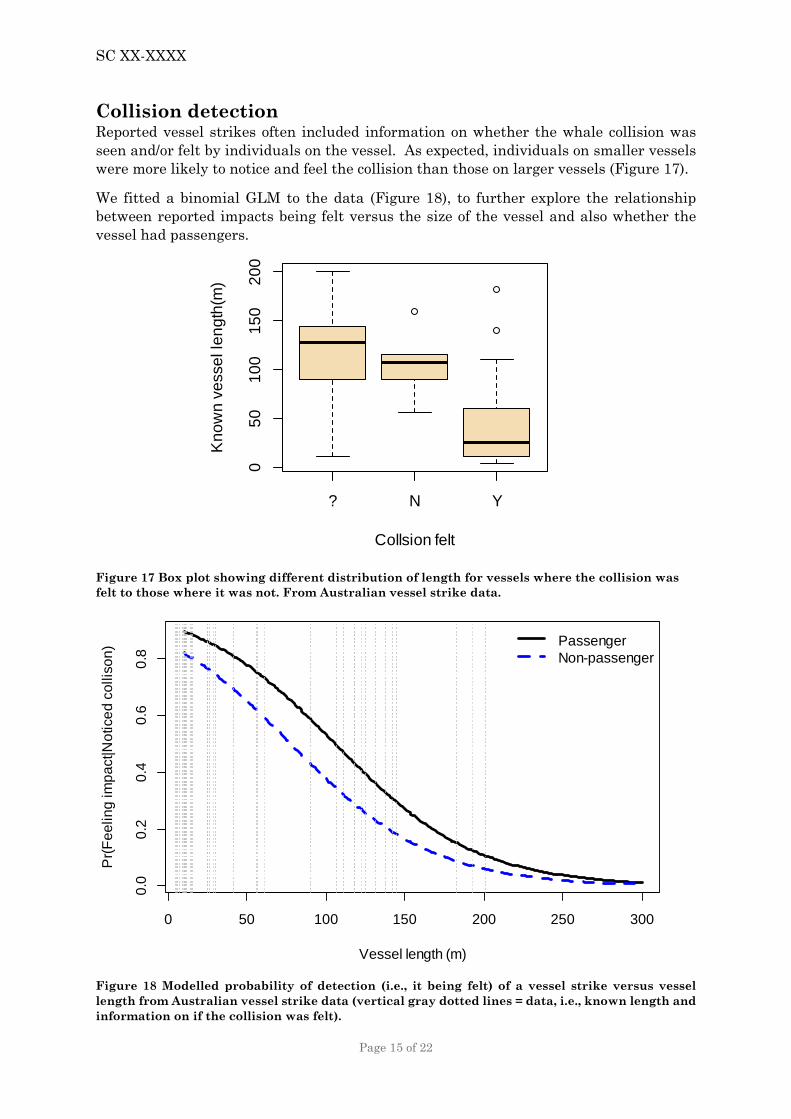
Collision detection Reported vessel strikes often included information on whether the whale collision was
seen and/or felt by individuals on the vessel. As expected, individuals on smaller vessels
were more likely to notice and feel the collision than those on larger vessels (Figure 17).
We fitted a binomial GLM to the data (Figure 18), to further explore the relationship
between reported impacts being felt versus the size of the vessel and also whether the
vessel had passengers.
Figure 17 Box plot showing different distribution of length for vessels where the collision was
felt to those where it was not. From Australian vessel strike data.
Figure 18 Modelled probability of detection (i.e., it being felt) of a vessel strike versus vessel
length from Australian vessel strike data (vertical gray dotted lines = data, i.e., known length and
information on if the collision was felt).
? N Y
050
100
150
200
Collsion felt
Kno
wn
vess
el le
ngth
(m)
0 50 100 150 200 250 300
0.0
0.2
0.4
0.6
0.8
Vessel length (m)
Pr(
Fee
ling
impa
ct|N
otic
ed c
ollis
on) Passenger
Non-passenger

SC XX-XXXX
Page 16 of 22
There are some limitations/issues with this analysis. The main one is that what is being
estimated is not the actual probability of feeling a strike (as we have no data on incidents
that were not felt or seen) but rather relates to how many of the collisions that were
detected in some way, were felt on-board the vessel. So we are estimating the
Pr(Felt|Noticed). The unconditional probability of a collision being felt on a vessel will
obviously be much lower if all unfelt strikes (witness plus un-witnessed) were considered.
What we did find was that there is a large drop in probability of feeling a strike as vessel
size increased, with non-passenger vessels having the lowest relative probability across
all lengths (see Figure 18). This makes sense considering passenger vessels carry
significantly more people and therefore are more likely to detect a strike either visually
or feeling an impact on the vessel.
We did not look any further at this, given the caveats of the data. However, there are
further potential analyses that may give some interesting insights into the issue of under-
detection/reporting.
DISCUSSION
The advent of accessible online newspaper archives has allowed the discovery of a large
number of vessel strike incidents (both Australian and worldwide) that have not been
included in any of the existing vessel strike databases. However, whilst our search was
not exhaustive—and additional records no doubt exist—the search has made a reasonable
attempt to capture most of the publically available records.
As we have discussed, there is a difficulty when considering vessel strike data due to
potential reporting bias and other issues. Consequently, there is the danger that any
conclusions will reflect the biases of the data rather than representing the real world
situation. In this paper, we tried to make some useful inferences about vessel strikes,
while acknowledging the potential biases and their effect on the results.
Incidence/rate of vessel strikes Due to differences in the underlying data collection mechanism between historic and
modern data, we saw a significant increase in the number of reported vessel strikes in
the late 1990’s. Modern data was collected directly from Government agencies (i.e. State
and/or Commonwealth) and/or researchers each year, compared with the uncoordinated
collection of reports prior to this which had no formal reporting mechanism or
centralised collection point. These factors are highly likely to have contributed to the
increase in reporting rate in recent times compared that found in the historic data.
There are two additional factors that may have contributed to this increase: 1) modern
data will include incidents that may not reach the media, due to independent, direct
reporting systems now being in place; and 2) all contemporary reports appearing in the
media are likely to be discovered given their coverage by existing search engines and
formal reporting mechanisms, whereas historically, not all newspapers and articles are
available to search engines.
Laist et al. (2001) found ship strike “remained infrequent until about 1950, and then
increased during the 1950s-1970s as the number and speed of ships increased”. In
contrast, we have a low number of reports from 1950 right up until 1999. Some reduction
in rate was expected given Australian whale populations were so severely depleted around
this time, and the resulting lag time before recovery. However, as populations recovered
we would have expected the reported rate of vessel strike to have increased, especially

SC XX-XXXX
Page 17 of 22
given significant increases in fleet size and average speed. As detailed in the results
section, it was evident this lack of a clear increase was most likely due to a coverage gap
in our newspaper databases rather than a real effect. This demonstrates the problem with
not identifying biases in the reporting rates and not considering the underlying data
collection/collation issues when formulating conclusions from the data. While research of
non-digitised media could help fill the coverage gap, this would be a considerably lengthy
process.
Species Since we only really have substantial species identification in the modern data series,
we are unable to reliably comment on species struck in the historic data. Given the
sequential depletion of whale species due to commercial and illegal whaling in the 20th
century, we would expect in the late 19th/early 20th Century there to be more diversity in
species but unfortunately the data are insufficient to provide much insight into this.
Humpback whales are the most common species reported in the modern datasets, for
both the world and Australia. This is likely to be representative of the fact that
humpback whales are reasonably abundant and rapidly recovering in many parts of the
world. They also are very coastal during periods of their migration and are the primary
target of whale watching operations across the world due to their conspicuous aerial
behaviour. These three factors mean that they are highly visible and interactions (of all
types) with humans are common.
The other commonly struck species in Australian waters is the Southern right whale. In
general, the species most commonly reported in Australia correspond to the most
common species struck internationally. However, there is one exception in that though
fin whales are the second most commonly struck species internationally, they are
ranked eighth for Australia. Fin whales also did not feature highly in Van Waerebeek et
al. (2007) data series for the Southern Hemisphere.
Vessels involved Figure 3 indicates a pattern in the data, where the length of vessels involved gradually
increased from 1840-1940, most likely reflecting the increase in length of the typical
vessel in the international shipping fleet. By contrast, most modern (post-1997)
Australian vessel strike reports involve much smaller vessels. This may in part be due
to the different sources of data, considering historical data was from newspapers where
large ships were bigger news and therefore more likely to be reported. Furthermore,
there would have been few small-but-fast vessels around during this historic period, so
it is likely that these types of vessel comprised a very small part of the overall shipping
levels. This does seem to be reflected in an increase in smaller vessel strikes reported in
the modern data, as the increase in the number of recreational vessels in Australian
waters may also contribute to this rise.
Overall, we are seeing an absence of reports in modern data of vessel strike from large
vessels, particularly cargo vessels, in modern data. This may reflect the natural
progression of ship size and type over the last 150 years, with modern vessels reaching a
size and a level of automation/crew size where collisions simply go un-noticed. As we
saw from our exploratory analysis of the probability of feeling a strike given a known
strike occurred, individuals on large non-passenger vessels have an acutely lower
probability feeling any impact from a strike. Furthermore, historically, before air travel

SC XX-XXXX
Page 18 of 22
was commonplace, many of the larger vessels were passenger ships, and hence had a
higher likelihood of collisions being seen.
This idea of large modern vessels just not noticing collisions has already been proposed
by Félix and Van Waerebeek (2005) and given the size and level of automation in
modern vessels this seems both reasonable and plausible. Worldwide, there have been
numerous cases (as well as in Australia) of whales being stuck on bulbous bows of ships
and only being detected by people on the wharf upon docking. Finally, there has been at
least 11 incidents in Australian waters since 1990 of large commercial vessels colliding
with smaller yachts and fishing vessels (ATSB), and the large vessels not seeing,
hearing or feeling the collision. Admittedly, potentially there may be a subterfuge to
avoid liability. However, we would argue if this is the case, then a similar motivation
would also hinder reporting of whale collisions. Therefore, overall, it would seem quite
reasonable that the majority of whale collisions with large vessels would go unnoticed
and/or unreported, if noticed.
Despite the lack of reported incidents with these larger vessels, there is some indication
that collisions with larger vessels are still occurring. As seen in Figure 7 there were a
reasonable number of strandings in modern times where it is not possible to attribute
the strike to vessel of known size. Given the size of vessel required to fatally injure a
large whale, we would posit that the incidents most likely involved large vessels. Given
the issue of detection, together with the general increases and the sudden drop in vessel
lengths over time (Figure 14), we would argue that despite the lack of witnessed
incidents, large vessels are in fact still colliding with whales in Australian waters.
CONCLUSION
As stated at the beginning of the paper, this work is only a preliminary exploration of
the Australian data. Next the data will be further cleaned, validated and then uploaded
to the Australian Government vessel strike database. Further cross checking for
duplication of existing IWC data needs to be done and then the data can be added to the
existing IWC data base.
ACKNOWLEDGMENTS
This work was undertaken for the Marine Biodiversity Hub, a collaborative partnership
supported through funding from the Australian Government's National Environmental
Science Programme. AMMC for their support and advice. This work would not have been
possible without the national library TROVE system which provided easy access to a large
database of historical Australian newspapers. We would like to thank Mike Double for
presenting the paper to the IWC; Natalie Kelly, Jessica Ford and Nic Bax for suggestions
and comments on the paper; and Geoff Hosack (CSIRO) for providing the draft AIS density
maps.
REFERENCES
ATSB Australian Transport Safety Bureau Transport Safety Reports; Marine Occurance
Investigation. Reports: mair25, mair44, mair54, mair104, mair116, mair125,
mair151, mair177, mair240, mo2008001, mo2014006.
BITRE (2015). Yearbook 2015: Australian Infrastructure Statistical Report. Bureau of
Infrastructure, Transport and Regional Economics.

SC XX-XXXX
Page 19 of 22
Endresen, Ø., E. Sørgård, H. L. Behrens, P. O. Brett and I. S. Isaksen (2007). A
historical reconstruction of ships' fuel consumption and emissions. Journal of
Geophysical Research: Atmospheres 112 (D12).
Félix, F. and K. Van Waerebeek (2005). Whale mortality from ship strikes in Ecuador
and West Africa. Latin American Journal of Aquatic Mammals 4(1): 55-60.
IWC (2010). 2010 Ship strike summary data. International Whaling Commision.
Jackson, J. A., Ross-Gillespie, A., Butterworth, D., Findlay, K., Holloway, S., Robbins,
J., Rosenbaum, H., Weinrich, M., Baker, C.S., and Zerbini, A. (2015). Southern
Hemisphere Humpback Whale Comprehensive Assessment A synthesis and
summary: 2005-2015. Rep. int. Whal. Commn SC/66a/SH3, 38pp.
Jensen, A. S., G. K. Silber and J. Calambokidis (2004). Large whale ship strike database,
US Department of Commerce, National Oceanic and Atmospheric Administration
Washington, DC.
Kemper, C. (2008). Analysis of South Australian Museum's cetacean data: distribution,
seasonal trends and circumstance of'death, South Australian Museum.
Laist, D. W., A. R. Knowlton, J. G. Mead, A. S. Collet and M. Podesta (2001). Collisions
between ships and whales. Marine Mammal Science 17(1): 35-75.
Neilson, J. L., C. M. Gabriele, A. S. Jensen, K. Jackson and J. M. Straley (2012).
Summary of reported whale-vessel collisions in Alaskan waters. Journal of Marine
Biology 2012.
Noad, M. J., Dunlop, R.A., Paton, D., and Cato, D.H. (2008). An update of the east
Australian humpback whale population (E1) rate of increase. Rep. int. Whal.
Commn. SC/60/SH31.
Ritter, F. (2012). Collisions of sailing vessels with cetaceans worldwide: First insights
into a seemingly growing problem. Journal of Cetacean Research and Management
12(1): 119-127.
Van Waerebeek, K., A. N. Baker, F. Félix, J. Gedamke, M. Iñiguez, G. P. Sanino, E.
Secchi, D. Sutaria, A. van Helden and Y. Wang (2007). Vessel collisions with small
cetaceans worldwide and with large whales in the Southern Hemisphere, an initial
assessment. Latin American Journal of Aquatic Mammals 6(1): 43-69.
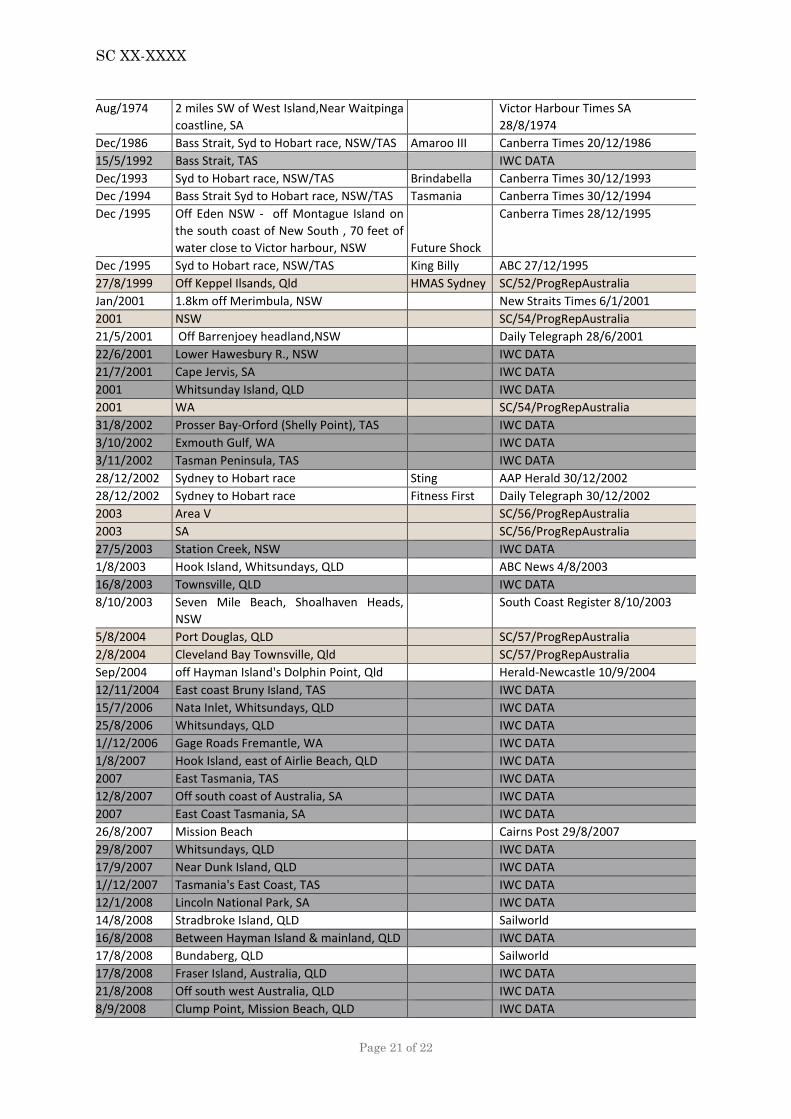
APPENDIX: AUSTRALIAN DATA
Apx Table 1 Draft summary of preliminary Australian data 1872-2016. Dark shading indicates
already in IWC 2010 database. Light shading indicates in an Australian IWC progress report.
Date Location Vessel Source*
15/12/1872 30 miles East of Cape Howe, NSW King Oscar The Age 6/1/1872
4/3/1882 50 miles south of Cape Leeuwin, WA Pet Walaroo Times 8/3/1882
1888 Australian waters HMS
Myrmidon
Yorkshire Gazette 17/3/1888
1889 Between Cape Jarvis and Yankalilla, SA
James Comrie
Port Pirie Standard & Barrier
Advertiser 31/5/1889
Dec/1891 10 miles North of Wollongong, NSW
Titus
Richmond River Herald & Northern
Districts Advertiser 4/12/1891
1894 Two fold Bay, Sydney, NSW
Tea Tephi
The Evening Telegraph
13/10/1894
Sep/1897 Outside the heads, Perth, WA
Stormcock
Inquirer & Commercial News
1/10/1897
1//12/1900 Off Maria Island, TAS Warrentinna The Week/Brisbane 17/Dec/1900
Jan/1903 Lord Horne Island, (NSW?)
Barossa
Zeehan & Dundas Herald Tas.
24/1/1903

SC XX-XXXX
Page 20 of 22
17/9/1903 Geraldton, WA Viking Kalgoorlie Miner WA 18/9/1903
Jul/1904 8 miles North East of Smoky Cape, NSW
Kyogle
North Western Advocate & the
Emu Bay Times, Tas 23/7/1904
3/8/1904 Wollongong, NSW Darling Downs Gazette 3/8/1904
Jan/1905 17 miles off Dongarra, WA The Brisbane Courier 17/1/1905
Jan/1905 West of Olive Island, and off Streaky Bay,
SA
Governor
Musgrave
The Register, Adelaide 17/1/1905
26/10/1905 Off Southport Island, TAS Houn Pine TASMANIAN SHIPWRECKS
Oct/1907 South Solitary Island, NSW Yongala The Brisbane Courier 8/10/1907
Jun/1911 Between Gabo Island and Wilson Prom (off
90 mile beach), VIC Grantala
Globe, Sydney 21/6/1911
Nov/1913 Between Sydney and Byron Bay, NSW s.s.
Wollongbar
Northern Star, Lismore 7/11/1913
14/1/1915 Cape Bridgewater-Point Danger, VIC
Nancy
Portland Observer & Normanby
Advertiser 18/1/1915
1923 Few miles from Port Adelaide, SA Treverbyn News, Adelaide 29/10/1923
1926 500 miles from WA coast, WA
Nardana
Sydney Morning Herald
16/Jan/1926
1927 50miles South of Gabo Island, VIC Zealandia Sydney Morning Herald 18/1/1927
1927 30 miles at sea
Lamson
Bunbury Herald & Blackwood
Express, WA 26/9/1927
Aug/1928 North of Yeppoon, QLD Nellie The Argus, Vic, 3/8/1928
Aug/1928 Between Fremantle and Adelaide, WA/SA Ozarda Examiner, Tas 11/8/1928
Jul/1929 150 miles west Neptune Is Lighthouse, SA Kooliga Sydney Morning Herald 26/7/1929
Jun/1930 Off Qld coast, QLD Taiping Advocate, Burnie 9/6/1930
28/8/1934 Sydney Harbour, NSW Baragoola The Mercury, Tas, 29/8/1934
Nov/1934 300 miles off Sydney Heads, NSW Mariposa Barrier Miner, NSW 8/11/1934
Nov/1934 Near Montague Island, NSW Wanganella
Goulburn Evening Penny Post,
NSW 2/11/1934
Oct/1935 Off Coffs Harbour, NSW Ormonde The Courier/Mail, Qld 1/10/1935
May/1936 Off Albany, WA Imperial Star Advocate, Tas 4/5/1936
Nov/1936 Mouth of Moyne river, VIC Seaflower Border Watch, SA 24/11/1936
Nov/1936 Mouth of Moyne river, VIC Victory Border Watch, SA 24/11/1936
Apr/1937 Mooloolaba, QLD The Telegraph, QLD 26/4/1937
Aug/1937 Bight, about 350 miles east of Eclipse
Island, WA Almkerk
The Advertiser, SA 21/8/1937
Dec/1938 200 miles off Aus Coast Brisbane to
Auckland, QLD Orford
The West Australian 24/12/1938
1940 A mile off Currumbin Beach, QLD Wonderbelle The Courier/Mail, Qld 25/9/1940
Sep/1946 30 miles W of Lady Hamiliton Island, QLD Canberra Times 5/9/1946
Nov/1948 Sydney to Broken Bay, NSW Aloha Canberra Times 15/11/1948
Jun/1952 Great Australian Bight, WA/SA La Estancia The Argus 5/6/1952
Aug/1952 2 miles to sea off Cape Moreton, QLD Omar Daily Mercury Mackay 25/8/1952
29/1/1953 Cape Douglas, SA Border Watch Mt Gambier 29/1/1953
27/9/1954 Woolgoolga, NSW The Courier/Mail, Qld 28/9/1954
28/9/1954 Coffs Harbour, NSW Northern Star Lismore 28/9/1954
31/12/1958 Frederick Henry Bay-Slopen Island, TAS IWC DATA
1963 Close off South Molle Island, QLD Website - Anecdotal
25/1/1964 180 miles NW of Freemantle, WA Iberia Canberra Times 25/1/1964
8/8/1970 off the WA coast,WA Alma Mary Shipwreck website
1/9/1971 Off Sydney,NSW Otway The Age 2/9/1971
SC XX-XXXX
Page 21 of 22
Aug/1974 2 miles SW of West Island,Near Waitpinga
coastline, SA
Victor Harbour Times SA
28/8/1974
Dec/1986 Bass Strait, Syd to Hobart race, NSW/TAS Amaroo III Canberra Times 20/12/1986
15/5/1992 Bass Strait, TAS IWC DATA
Dec/1993 Syd to Hobart race, NSW/TAS Brindabella Canberra Times 30/12/1993
Dec /1994 Bass Strait Syd to Hobart race, NSW/TAS Tasmania Canberra Times 30/12/1994
Dec /1995 Off Eden NSW - off Montague Island on
the south coast of New South , 70 feet of
water close to Victor harbour, NSW Future Shock
Canberra Times 28/12/1995
Dec /1995 Syd to Hobart race, NSW/TAS King Billy ABC 27/12/1995
27/8/1999 Off Keppel Ilsands, Qld HMAS Sydney SC/52/ProgRepAustralia
Jan/2001 1.8km off Merimbula, NSW New Straits Times 6/1/2001
2001 NSW SC/54/ProgRepAustralia
21/5/2001 Off Barrenjoey headland,NSW Daily Telegraph 28/6/2001
22/6/2001 Lower Hawesbury R., NSW IWC DATA
21/7/2001 Cape Jervis, SA IWC DATA
2001 Whitsunday Island, QLD IWC DATA
2001 WA SC/54/ProgRepAustralia
31/8/2002 Prosser Bay-Orford (Shelly Point), TAS IWC DATA
3/10/2002 Exmouth Gulf, WA IWC DATA
3/11/2002 Tasman Peninsula, TAS IWC DATA
28/12/2002 Sydney to Hobart race Sting AAP Herald 30/12/2002
28/12/2002 Sydney to Hobart race Fitness First Daily Telegraph 30/12/2002
2003 Area V SC/56/ProgRepAustralia
2003 SA SC/56/ProgRepAustralia
27/5/2003 Station Creek, NSW IWC DATA
1/8/2003 Hook Island, Whitsundays, QLD ABC News 4/8/2003
16/8/2003 Townsville, QLD IWC DATA
8/10/2003 Seven Mile Beach, Shoalhaven Heads,
NSW
South Coast Register 8/10/2003
5/8/2004 Port Douglas, QLD SC/57/ProgRepAustralia
2/8/2004 Cleveland Bay Townsville, Qld SC/57/ProgRepAustralia
Sep/2004 off Hayman Island's Dolphin Point, Qld Herald-Newcastle 10/9/2004
12/11/2004 East coast Bruny Island, TAS IWC DATA
15/7/2006 Nata Inlet, Whitsundays, QLD IWC DATA
25/8/2006 Whitsundays, QLD IWC DATA
1//12/2006 Gage Roads Fremantle, WA IWC DATA
1/8/2007 Hook Island, east of Airlie Beach, QLD IWC DATA
2007 East Tasmania, TAS IWC DATA
12/8/2007 Off south coast of Australia, SA IWC DATA
2007 East Coast Tasmania, SA IWC DATA
26/8/2007 Mission Beach Cairns Post 29/8/2007
29/8/2007 Whitsundays, QLD IWC DATA
17/9/2007 Near Dunk Island, QLD IWC DATA
1//12/2007 Tasmania's East Coast, TAS IWC DATA
12/1/2008 Lincoln National Park, SA IWC DATA
14/8/2008 Stradbroke Island, QLD Sailworld
16/8/2008 Between Hayman Island & mainland, QLD IWC DATA
17/8/2008 Bundaberg, QLD Sailworld
17/8/2008 Fraser Island, Australia, QLD IWC DATA
21/8/2008 Off south west Australia, QLD IWC DATA
8/9/2008 Clump Point, Mission Beach, QLD IWC DATA

SC XX-XXXX
Page 22 of 22
20/9/2008 20nm East Coffs Harbour, NSW IWC DATA
6/10/2008 Twelve Apostles, VIC SC/61/ProgRepAustralia
7/10/2008 Off Gladstone, QLD IWC DATA
26/10/2008 Byron Coast, NSW IWC DATA
26/10/2008 Richard River, NSW IWC DATA
8/4/2009 Rye Ocean Beach, VIC SC/62/ProgRepAustralia
28/7/2009 Hervey Bay, QLD IWC DATA
2/9/2009 Exmouth Gulf, WA IWC DATA
12/9/2009 Uladulla, NSW SC/62/ProgRepAustralia
12/9/2009 Batemans Bay, NSW IWC DATA
2/10/2009 NSW IWC DATA
26/10/2009 Fremantle, WA HMAS Perth IWC DATA
- End of IWC 2010 Data -
5/4/2010 Cyrlis Beach, Flinders, VIC SC/63/ProgRepAustralia
17/7/2010 Broome, WA SC/63/ProgRepAustralia
22/9/2010 Sandon Point, Illawara, NSW SC/63/ProgRepAustralia
5/10/2010 Exmouth, WA Express 6/10/2010
22/11/2010 Port Wakefield, SA SC/63/ProgRepAustralia
19/6/2011 Moreton Bay, QLD SC/64/ProgRepAustralia
24/6/2011 Sydney Harbour, NSW Daily Telegraph 24/6/2011
26/6/2011 Red Cliff, Brooms Head NSW Central Qld News 28/6/2011
28/6/2011 Blue Pearl Bay, Hayman Island,
Whitsundays, QLD
SC/64/ProgRepAustralia
5/08/2011 Hervey Bay bar, QLD Ally Jay Fraser Coast Chronicle 6/7/2011
27/08/2011 10km ESE Border Village SA SC/64/ProgRepAustralia
9/10/2011 Moreton Bay, QLD SC/64/ProgRepAustralia
10/11/2011 Fremantle, WA SC/64/ProgRepAustralia
24/7/2012 Hungry Beach, NSW Bellingen Courier Sun 24/7/2012
25/7/2012 Brisbane/Moreton Bay, QLD SC/65/ProgRepAustralia
6/8/2012 Sydney Harbour, NSW ferry Sydney Morning Herald 6/8/2012
20/8/2012 Bribie Island, 25 nm NE, QLD news.com.au 20/8/2012
25/9/2012 Yamba, NSW Kathmandu Daily Examiner 27/9/2012
15/10/2012 32 km north of Streaky Bay, SA SC/65/ProgRepAustralia
12/11/2012 Laura Bay, Great Australian Bight, SA. SC/65/ProgRepAustralia
31/12/2012 Sydney to Hobart Secret Men's
Business
Australian 31/12/2012
3/8/2013 Hervey Bay, QLD Yacht Central Qld news 10/8/2013
2013 2.7km NNE Point Bolingbroke, SA SC/66/ProgRepAustralia
14/8/2014 Gladstone, Lady Musgrave Island, QLD Morning Bulletin 15/8/2014
15/8/2014 Moreton Bay, QLD SC/67/ProgRepAustralia
16/8/2014 Moreton Bay, QLD SC/67/ProgRepAustralia
8/12/2014 Ardrossan, SA Mlssa website 10/12/2014
2014 Off Cape Moreton, QLD SC/67/ProgRepAustralia
28/7/2015 Broome, WA ABS News 4/8/2015
14/8/2015 Stradbroke Island, QLD Redland City Bulletin 14/8/2015
21/8/2015 Port Hedland, WA Facebook posting
8/9/2015 Hay Point, QLD Tug Sydney Morning Herald 10/9/2015