history of the salt, brine and paper …€¦ · stroemel's assistance, the morton salt...
TRANSCRIPT

HISTORY OF THE SALT, BRINE AND PAPER INDUSTRIES AND THEIR PROBABLE EFFECT ON THE GROUND WATER QUALITY IN THE
MANISTEE LAKE AREA OF MICHIGAN
by
K. E. Childs
Hydrological Survey Division
Water Resources Commission Bureau of Water Management
Michigan Department of Natural Resources
June 1970
CONTENTS ABSTRACT ....................................................................... 1 INTRODUCTION............................................................... 2
Purpose and Scope of Investigation.............................. 2 Well - Numbering System.............................................. 3 Method of Investigation ................................................. 3 Acknowledgements ....................................................... 3
THE IMPACT OF INDUSTRY ON THE GEOLOGICAL ENVIRONMENT................................................................ 3
Lumber Industry............................................................. 3 Historical Sketch of the Lumber Industry .................3
Manufacturing Process & Waste Discharges .......... 4 Salt Industry ...................................................................4
Historical Sketch of the Salt Industry....................... 4 Construction Practices from 1881 until 1954........... 5 Construction Practices from 1954 until 1970........... 5 Contemporary Operating and Monitoring Practices 5
Practices of the Morton Salt Company.........................5 Practices of the Hardy Salt Company ..........................6 Evaluation of Operating and Monitoring Practices .......6
Chemical Brine Industry .................................................7 Historical Sketch of the Chemical Brine Industry .... 7 Construction Practices from 1927 unti1 1970 ......... 8 Contemporary Operating and Monitoring Practices 8
Practices of the Morton Chemical Company ................8 Practices of the Standard Lime and Refractories .........8 Evaluation of Operating and Monitoring Practices .......9
Location of Salt and Chemical Brine Wells ....................9 GROUND WATER AND CONTAMINANTS ......................9
Domestic Water Supply..................................................9 Ground Water and Aquifer Characteristics ..................10
General Geology of the Manistee Lake Area ........ 10 Definition of Aquifer Characteristics ...................... 11 Definition of Ground Water Quality........................ 11
Contaminants ...............................................................11 Impact on the Ground Water ................................. 11 Salt and Brine Industries ....................................... 12 Identification of Ground Water Contaminants Using a Mathematical Analysis........................................ 12 Identification and Evaluation of Major Areas of Contamination ....................................................... 13 City of Manistee's Well Field ................................. 15 Conclusions and Recommendations..................... 17
City’s Well Field..........................................................17 Chloride Using Industries ...........................................17 The Paper Industry.....................................................19
SUMMARY.......................................................................19 BIBLIOGRAPHY ..............................................................19
ILLUSTRATIONS
SKETCHES 1. Typical schematic of Manistee salt well about 1900..........20
2. Typical schematic of a contemporary Manistee fractured salt gallery ......................................................................20
3. Typical schematic of Manistee chemical brine well ...........20
4. Typical movement of a heavy polluted fluid in a ground water aquifer ..................................................................21
5. The hydrologic cycle .........................................................21
6. Schematic showing relationship of chloride slug and the City of Manistee’s well field ............................................21
7. Schematic showing relationship of chemical brine well and the City of Manistee’s well field ......................................21
K. E. Childs– Page 1 of 26

K. E. Childs– Page 2 of 26
DIAGRAMS 1. Schematic diagram of the Morton Salt Company’s well
system ............................................................................21
2. Schematic diagram of the Hardy Salt Company’s well system ............................................................................22
3. Schematic diagram of the Morton Chemical Company’s well system ............................................................................22
4. Schematic diagram of the Standard Lime and Refractories well system.....................................................................22
DATA SHEETS 1. Ground water uncontaminated ..........................................22
2. Salt well analysis ...............................................................23
3. Brine well analysis--4c-5c-6c.............................................23
4. Brine well analysis--3c.......................................................23
5. Water wells contaminated by salt ......................................23
6. Water wells contaminated by salt ......................................23
7. Water wells contaminated by salt ......................................23
8. Water wells contaminated by brine....................................24
9. Water wells contaminated by brine....................................24
10. Water wells contaminated by brine..................................24
11. Water wells contaminated by brine..................................24
12. Water wells contaminated by brine..................................24
13. Contamination in city well 7A...........................................25
14. Contamination in city well 7A...........................................25
15. Contamination in city well 7A...........................................25
CROSS SECTIONS 1. Cross section from Grant Highway Mason County and north
up Hill Street to Section 30, T 22 N, R 16 W ..................26
2. Cross section from Butcher Lake northeast to Manistee County dog pound in Section 16 ....................................26
3. Cross section from Spruce and 8th Street in Manistee east to Manistee Blacker Airport ............................................26
ABSTRACT Paper and chemical industries of the Manistee Lake area have produced large volumes of chloride and sulfite-sulfate waste products. Their operational and waste disposal practices have resulted in the degradation of local ground waters, including those utilized by the Manistee City's water well system.
INTRODUCTION
Purpose and Scope of Investigation Every homeowner needs a supply of safe drinking water and a means of disposing of contaminated waste waters. In most high population density areas the homeowner uses municipal water and sewage systems, whose safety and reliability is a municipal responsibility. In many low population density areas the homeowners design and develop their own water supply and sewage disposal systems. Their criteria for a good system might be drinking water that looks clean and tastes good and septic tanks that operate for a few years without plugging. These criteria are important but they are poor indicators as to the relationship between the individual and his environment. The drinking water may meet the two previously mentioned criteria but be chemically and/or bacterically unfit for use. Septic tanks may be extremely efficient but be providing recharge for water wells and ground water aquifers. One septic tank in the wrong place could temporarily pollute a large area of a potable water supply.
In 1964, the City of Manistee asked the Michigan Department of Natural Resources, formerly the Department of Conservation, to conduct a ground water investigation in the Manistee area. This request by the City was prompted by its concern regarding contamination of the potable water supply in the area. This concern received special impetus in 1964 when the city developed a new well field, where, of the three wells drilled, one provided water of good quality, one slightly contaminated water, and the third water of very poor quality with a chloride level around 2000 ppm. The city officials were gravely concerned because they were uncertain as to the cause of contamination, and consequently, uncertain as to the course of action to prevent additional contamination. Also they were concerned as to the adequacy of ground water resources for future use. The present report is designed to make data collected during investigations and interpretations readily available to the public.
Investigations of limited scale were conducted by the Departments of Conservation and Public Health. These investigations provided valuable data but because of their limited nature no firm conclusions were reached and consequently no action was taken. In 1968 a ground water investigation in the Manistee Lake area was initiated by the Bureau of Water Management. This survey was to encompass a review of the major industries of the area and ascertain their relationship to the geological environment. This report was initiated in part by a request from the Michigan Department of Public Health, acting on behalf of the City of Manistee.
The objectives of this investigation were to:
(1) Review paper and chemical industries and define their relationship to the geological environment.

K. E. Childs– Page 3 of 26
(2) Define the nature and status of ground water contamination in the Manistee Lake area.
(3) Describe and define the areal ground water resource.
(4) Develop recommendations that would aid in maximum utilization of the areal ground water resources.
Well - Numbering System The well-numbering system used in this report indicates the location of the wells within the rectangular subdivision of the public lands, with reference to the Michigan meridian and base line. The first two segments of the well number designate the township and range; the third segment designates both the section in the township and serial number of the well, the serial number being assigned arbitrarily. Thus, well 21N-17W-14-1 is well No. 1 in Section 14, T. 21N., R. 17W. It is therefore necessary to give only the serial numbers of wells on maps that show sections, as the location of the well is evident from its number. Wells outside the city limits are located to the nearest 10-acre tract within the section or by footage from the corner of the section. An attempt has been made to verify the location of wells with the use of topographical maps.
Method of Investigation The investigation included an intensive bibliographic review of the geology and hydrology of the area. Records of Federal, State, and local agencies were examined for well logs, foundation borings, chemical analyses of water, water-use data, and other pertinent information. The files of industries, well drillers, and water-supply consultants were reviewed for similar data. A field check of the geologic and hydrologic data transcribed from these sources was conducted, and observations of trends in water level, pumpage and water quality were made.
Chemical analyses of water from the area were made by the Michigan Department of Public Health and by the Quality of Water Laboratory of the U. S. Geological Survey at Columbus, Ohio.
Acknowledgements Many of the data used in this report were obtained from the files of the Michigan Geological Survey, the Michigan Department of Public Health, and the U. S. Geological Survey. Additional data were obtained also from the files of the well drilling firms of Cameron Brothers of Freesoil and the Layne Northern, Inc. of Lansing, the Manistee County Historical Society with Mrs. V. Stroemel's assistance, the Morton Salt Company, the Morton Chemical Company, the Standard Lime and Refractories Company, the Packaging Corporation of America, the Michigan Chemical Company, the Hardy Salt Company, and from the City of Manistee files by
Chester Glocheski, City Manager, and Douglas Garry, City Water Superintendent, who furnished physical and technical assistance.
THE IMPACT OF INDUSTRY ON THE GEOLOGICAL ENVIRONMENT
Lumber Industry
Historical Sketch of the Lumber Industry (1) The following, quoted from The Lumberman’s Legacy recounts the beginning of a new industrial activity.
Abundance of standing timber and the availability of water for domestic and industrial use were the ingredients that forged the destiny of Manistee.
It is known that missionaries and fur traders visited the Manistee section of Michigan in the 1800's. A Jesuit mission house stood at the extreme northwest angle of Manistee Lake in 1826. In 1832 a party of men from Massachusetts landed. They proceeded up the Big Manistee River for a distance and built a log house, but were driven off by Indians. One Captain Humphrey came in 1833, bringing machinery for a sawmill, but the water at the mouth of the river was too shallow for his boat and he abandoned the project.
In the fall of 1840, John and Joseph Stronach coasted along the Lake Michigan shore from the south in search of a mill site. The indians were very friendly and considerable exploring was done. The outlook was encouraging, so they decided to locate at Manistee and selected a place to erect a mill.
They returned to the southern part of the state for the winter, and in the following spring, John Stronach and his son Adam chartered a small schooner, loaded it with machinery, supplies, horses, cattle and about 15 men. The schooner reached the mouth of the Manistee River April 16, 1841. The date marks the first permanent white settlement of Manistee.
The Stronach's first mill, known as the "muley” mill, on account of the type of saw used, was built at the north end of Manistee Lake. It was sold to Joseph Humble in 1845, and the Stronach's erected a new mill at Old Stronach in that same year. The construction of Stronach's first muley mill was the beginning of a lumber era that lasted approximately 80 years and witnessed the operation of 35 saw mills with single-purpose exploitation and abandonment of the land. The saw mills have since disappeared but before they passed away they gave birth to other more enduring industries. Waste products from the saw mills were wood, which could be disposed of by burning with the energy used to provide heat and steam for the processing of other products. Some of the saw mills were expanded to include tannery and salt products plants.

K. E. Childs– Page 4 of 26
The tannery industry sprang up in conjunction with the lumber industry because of the availability of conifer tree bark and slab wood. The bark, after cooking was the source of tannic acid, a basic ingredient for the curing of hides. The slab wood was used for fuel. One example of a saw mill with an associated tannery was the mill in Filer City owned by E. G. Filer and Sons.
In 1915, a marine contractor from Muskegon made a business trip to Manistee. His business took him to the site of the old E. G. Filer and Sons’ mill at Filer City, which was then vacant. He thought, ”Just the place for a large industrial plant of some kind— but what kind?” That was the question. He sat himself down on a piece of old pipe and thought the matter over. Here was Manistee Lake -- that meant water for transportation and plant use. The Manistee and Northeastern Railroad would take care of transportation by railroad. As he pondered, he happened to glance over toward Stronach across the little lake. There he saw a stand of second growth pine, and he had the answer; a pulp mill.
The man was P. P. Schnorback. He contacted E. G. Filer at once. If Mr. Filer would furnish sufficient financial support, he himself would organize a company, Mr. Filer would and did. The Filer Fiber Company was the result. The pulp mill began operations in 1917. It was soon expanded to include the making of Kraft paper. Conifer woods were used exclusively. (end of quote)
Later the Continental Can Company acquired the plant. The American Box Company took it over in 1947 and on July 31, 1959, merged with the Packaging Corporation of America.
Manufacturing Process and Waste Discharges The production of paper from wood to the finished product is accomplished at this mill by two separate processes. The neutral sulfite process, referred to as NSSC operation, and sulfate process, referred to as the Kraft operation.
Originally large quantities of waste from the paper mill were dumped into Manistee Lake. Through time, concern and cooperation, significant changes have been made in the waste-discharge program. In 1951 American Box Board Company laid a pipeline that extends from their plant east under Manistee Lake to its terminus in Section 17, north of Stronach. Lagoons Were constructed in this area to hold the sludge from the clarifiers and the condensate from the black-liquor recovery process for infiltration. The quantity discharged to these lagoons varies from 15 to 60 million gallons per month (based on a May 1967 Survey by the Water Resources Commission).
Salt Industry
Historical Sketch of the Salt Industry (1 through 18) Successful saw mill owners had capital to make investments in other ventures. Lumberman Charles Rietz believed that salt (mostly Nad) existed in paying quantities under Manistee. He convinced thirteen other men, and together they pooled $8,300 of their resources and hired a well driller from Saginaw named Mason to sink the well. After he had drilled to a depth of 500 feet, he ran into a bed of solid rock and gave up in disgust, expressing the opinion that salt would never be found. All of the subscribers, except one, agreed with him. The subscription money had been spent and no salt. They refused to pour more money into a hold in the ground. Mr. Rietz, alone, was undaunted and undiscouraged. He hired Mans and Miller of Chicago to take over and continue drilling. The piping of the old well was raised and work went on. On November 27, 1880, the well was down 1640 feet - no salt; on January 22, 1881, down 1860 - no salt; and on January 29, 1881, down 1903 -still no salt. On February 7, 1881, they reached a depth of 1936 feet and they struck it! There it was - a 32-foot bed of solid salt. Mr. Rietz had spent $19,000 of his own money, but he found what he was after. Map No. 4 gives locations of Salt Company Plant site at Manistee.
Eleven other lumbering companies followed Charles Rietz's example like a flock of sheep. In 1898 the combined production of salt is given as 1,555,006 barrels. One barrel contained 280 pounds, which makes the amount in pounds 435,401,680.
* * *
The salt industry that began at Manistee with Charlie Rietz's well is still very active today. All of the original lumber mill-salt companies have passed away. The following will briefly trace the evoluation of some of the early predecessors of the present industry. The State Lumber Company drilled and produced three wells along the west side of Manistee Lake. The date of initial production is unknown, but 1901 records(5) list the State Lumber Company as owning and operating three wells. They were incorporated on April 18, 1907, and were sold to the Buckley and Douglas Lumber Company in the fall of 1910(7) becoming the Buckley and Douglas Plant No. 2. Buckley and Douglas Lumber Company's No. 1 plant was located north of the No. 2 plant. The No. 1 plant produced salt from five wells. Production began August, 1897. By 1913, Buckley and Douglas Lumber Company No. 1 plant still owned five wells, four operational and one abandoned.(9) The Buckley and Douglas plants were purchased by the Morton Salt Company in 1931. The north part of the property is occupied by the Morton Salt Company and the south part by the Morton Chemical Company.
The two wells drilled by Charlie Rietz were purchased and operated by Louis Sands. This became the Louis Sands No. 2 plant. In 1913 the Louis Sands No. 2 plant had four salt wells, two of them operational and two

K. E. Childs– Page 5 of 26
abandoned.(9) This property was purchased by the Hardy Salt Company in 1932.(14) Also, operational at this location prior to its purchase by the Hardy Salt; Company was the Michigan Tanning and Extract Company.(14)
Construction Practices from 1881 until 1954 The early salt wells drilled at Manistee from the time when Charlie Rietz drilled his first well until 1954, were essentially identical. Typical wells were drilled with a cable-tool rigs to the salt beds in the top of the Detroit River Group. The wells were completed between 1900 feet and 2050 feet total depth. Tubing was hung inside the casing. Salt beds were dissolved by formation waters that flowed to the well bore. The saturated brine filled the tubing to a level several hundred feet below ground surface. Production of the brine generally was done by an air lift. This consisted of a one-inch air line extended from an air compressor down into the well inside of the tubing approximately nine hundred feet. (See Sketch No. 1) (9) The early salt wells had two major shortcomings -- quality and quantity, the brine contained sulfur which had to be removed prior to evaporation. This sulfur created an environmental nuisance. The salinity of brine changed with the life of the well. As the cavern around the well increased in size, the salinity decreased. Also, the salt producer could not control the quality or quantity of the foremation waters that flowed into the salt cavern. Daily production was limited by the mechanics of the air lift used. It became necessary to pump lake water into some of the salt wells in order to maintain production. The Morton Salt Company laid a pipeline from Manistee Lake to its well field in Section 13 of 21N-17W for this purpose.(13) Because of the low salinity of the produced brine, crystallization inside of the tubing was not a major problem and it was not necessary to backwash the wells.
Construction Practices from 1954 until 1970 In 1954, the Hardy Salt Company introduced a new technique for development of salt wells. This technique, which became the standard at Manistee, is commonly referred to as a salt gallery (see Sketch No. 2). (14) (13) A typical gallery consisted of two wells a few hundred feet apart, drilled to the Salina group about 3,800 feet deep. Each well is drilled to the bottom of the salt bed. Fluid is injected into one well under high pressure, by which the salt is hydraulically fractured. The fracture system usually extends to the second well and permits communication of fluid. Ground water is injected into one well, washes through the fracture system, and flows from the other well as saturated brine. This system is easy to control, and the brine is generally low in impurities. A major disadvantage of this system is that salt crystals are constantly forming on the inside of the production well casing. After a short period of time, usually one to six weeks, flow has to be reversed within the gallery to flush out the salt crystals and prevent the production well from plugging off completely.
Presently, there are four galleries in operation. The Norton Salt Company and the Hardy Salt Company operate two galleries each. In addition, the Hardy Salt Company owns a third gallery which is not operational as such due to the inability to maintain communication between the injection and production wells. None of the shallow Detroit River formation wells at Manistee are in operation. At present, nine Salina salt wells are operational and two Salina salt wells are not completed for production, because of inadequate communication between them.
Contemporary Operating and Monitoring Practices Salt wells are drilled, developed, and operated for economic purposes. The margin of profit is partially contingent on well construction cost and salt brine production cost. Both of these factors have an important cost-reliability relationship. It is essential that the system be capable of operating with a high degree of reliability for long periods of time. System reliability is importantly contingent on design and construction. The salt wells exist for the prime function of maintaining production. An unscheduled stoppage of brine production is an added production cost for the salt company.
Practices of the Morton Salt Company
It is suggested that the reader refer to diagram No. 1 for a pictorial schematic portrayal of the Morton Salt Company's well system. The Company's well field is located in the center of Section 24 (T 21N - R 17W). Ground water from two shallow wells is drawn through two pumps in tandem. The injection water flows with a pressure of 350 to 550 PSIG into the two injection wells, normally Number 7 and Number 10. The injection pressure is monitored and recorded by a continuous type pressure print-out recorder and the volume is recorded by -a mechanical accumulative-type recorder. This equipment is located in a common line and all data that are recorded are indicative of both operating galleries. Salt brine flows from production wells Numbers 8 and 9 to the suction side of the two booster pumps that are in tandem. These pumps force the brine to flow approximately two miles to a set of wooden holding tanks located at the north end of Norton's plant property. A continuous-type pressure print-out recorder and a mechanical accumulative recorder are used to monitor the daily volumes and pressures on the discharge side of the salt brine pumps. The fluid levels in the holding tanks are observed daily and prevention of overflow is dependent on the reliability of the inspector. The salt galleries are back-flushed weekly by reversing the flow of water through the galleries.
It is necessary to maintain a continuous flow of salt brine to the plant holding tanks. This is accomplished by regulating the flow of water from the ground water wells to the injection wells. The flow meter allows observation and subsequent regulation of injection rates. The pressure recorder shows system injection pressures and therefore indicates any major system change, including

a pressure build-up which would usually be an indication of salt crystallization occurring in the producing wells. The pressure and volume equipment located on the discharge side of the salt brine pumps reflect total daily salt brine production and discharge pressure. All monitoring equipment has the prime function of providing total system data that can be used in direct support of maintaining reliable brine production.
Practices of the Hardy Salt Company
It is suggested that the reader refer to diagram No. 2 for a pictorial schematic of the Hardy Salt Company's well system. The Hardy Salt Company operates two salt galleries. One is located on its plant property on the west side of Manistee Lake and the other due east of the plant on the east side of Manistee Lake. Salt well injection water, stored in a series of large wooden tanks behind the plant, is derived from two sources; (a) ground water from a well located at the west end of their large warehouse, and (b) condenser water from their manufacturing processes. The well has become an unreliable source of ground water because of sand plugging. Thus during the fall of 1969, another water well was drilled on the east side of the property near salt well No. 7. This well, not presently completed, will reduce by several hundred feet the footage of water transmission lines required. Presently the water is pumped from the wash water tank through a common line to injection wells Numbers 5 and 9. Brine flows from production wells Numbers 8 and 7 into a brine storage tank. This tank provides the brine necessary for daily salt production. The total valume of wash water is recorded by a mechanical accumulative meter located near the wash water tanks. The volume of brine produced through well No. 8 is recorded by a continuous-type chart recorder located in the well house near well No. 7. Also located near well head No. 7, are pressure gages that display wash water injection pressure and salt brine return pressure from the gallery located on the east side of Manistee Lake. They monitor the daily volume of brine that is used by the plant for production with a meter located inside of the plant. This daily volume meter was not in use during an inspection made November 20, 1969. The plant records indicate that the meter had not been in use for at least thirty days. The fittings for the meter were in place and temporarily plugged off. The operating and monitoring procedures and practices are designed for the purpose of maintaining daily production. The monitoring procedures give data almost entirely indicative of total system performance but very little data regarding individual well performance.
Evaluation of Operating and Monitoring Practices
Salt is a very abundant resource and is economical to produce in large quantities. Between 600,000 and 800,000 gallons per day of salt brine is required to maintain the desired production quotas at each plant. Because of the cheapness of the salt brine, leaks or spillage involving several thousand gallons are economically unimportant. Brine wastage is only significant when it interferes with daily production or generates a cost problem. Management is handicapped by a lack of information about the ground water, that could be incorporated into construction, operating and monitoring practices.
The ground water in and around the salt plants is contaminated with chlorides and is not presently a source of potable water. This fact has resulted in a general lack of public concern about ground water pollution in these areas, which are presently served by municipal water produced from wells outside of the contaminated area. Available evidence indicates that the general flow of ground water in the area is toward Manistee Lake. This minimizes the effect of the migration of chlorides introduced into the ground water near Manistee Lake. The development and utilization of the salt gallery in place of the single salt well has greatly contributed to pollution of ground water. Fortunately, the single well salt development was utilized from 1881 until 1954. The year 1954 was the end of one era and the beginning of another, namely the salt gallery. The salt gallery, because of advantages of improved quality, is backwashed to prevent plugging. The monitoring practices utilizes by the salt companies provide only general system data. Any type of system failure that is not major could go undetected for years. For example, a leak up around or through a production well casing that involved 1 percent (8,000 GPD) of total production would be undetectable as long as it did not generates visible surface problem. The operating salt companies do not, to author's knowledge, employ any regular program of verifying the accuracy of their monitoring equipment. Even with very expensive meters, that are checked periodically, considerable error is involved. In salt water operations, metering is a major technological problem. For the salt companies to obtain individual well data that can be used to pinpoint and locate all leaks, even small
K. E. Childs– Page 6 of 26

K. E. Childs– Page 7 of 26
ones, will require expenditures of money and additional man hours.
Chemical Brine Industry
Historical Sketch of the Chemical Brine Industry (1) Chemical brine is defined, for the sake of this report, to mean a natural formation fluid that is pumped and processed for certain chemicals that are present. At Manistee, these chemicals are bromine and magnesium.
In the 1850’s chemical brines were pumped as a source of salt. Later, with the discovery of massive salt beds, brines became uneconomical as a source of salt. The significance of the previous statements is: (1) the chemistry of several Michigan brines was well defined by 1860, and (2) the presence and the chemistry of Filer brine was established by Mr. John Canfield at Manistee between 1883 and 1900. Mr. Canfield drilled and operated two salt wells on his saw mill property located on the south bank of the intersection of the Manistee Lake outlet and Lake Michigan. The Canfield and Wheeler Salt Block operated from 1883 until abandonment in 1901. During this interval, Mr. Canfield had his number one well, which was originally 1947 feet deep, drilled 500 feet deeper. The well was deepened by Mr. T. Percy for the purpose of prospecting for oil. No oil was found, but they discovered a chemical brine containing bromine. Samples were sent to several laboratories for analysis, but there didn't seem to be enough of a market for bromine to make its manufacture profitable, so the well was capped and left. The sawmill ceased operations about 1900. The mill and the salt block were wrecked about 1901.
The salt industry, as far as number of companies is concerned (136), climaxed in Michigan prior to 1900. In 1916, there were, according to Michigan Geological Survey historical documents, three operating salt companies at Manistee; namely Filer and Sons Vacuum Pan Salt Works at Filer City, Buckley and Douglas Lumber Company, and Louis Sands Salt and Lumber Company. In 1926, there were only two; Louis Sands Salt and Lumber Company, and Ruggels and Rademaker Salt Company. The Filer and Sons Vacuum Pan Salt Works was transformed into the Filer Fiber Company, a producer of paper.
In 1927, the Ruggels and Rademaker Salt Company management decided to have one of its salt wells cleaned out and a driller was hired to do the job. The well, already drilled, had shown a trace of gas. The driller was not being paid much more than enough to keep him in food and drink, so he decided to drill deeper. Perhaps they were looking for oil or gas, or maybe Mr. John Rademaker knew of the chemical brine that had been discovered and tested in Mr. Canfield's salt well.
Early one morning, while on a business trip to California, John Rademaker received a message from his partner, Charles Ruggels which read: "We have found what you
were after." The message was sent in this form to prevent the knowledge from leaking out as to just what had been found. John hurried home. The "what you were after" was a brine containing valuable chemicals related to, but differing from, those in the bed of salt 400 feet above. One of these was bromine which had been used in limited quantities in photography and the color industry, and in medicine in combination with other drugs for relieving human aches and pains.
The use of bromine in the manufacture of gasoline had caused the demand to grow by leaps and bounds. Later, the market and the technology developed such that magnesium and calcium were removed from the brine and sold. Presently, chemical brine is produced at Manistee for magnesium and bromine; all other constituents are disposed of as waste products. The primary use of the magnesium (Mg) compound is for the manufacture of refractory brick and cement for use in furnace linings (blast, open-hearth, etc.)
Let us digress a moment and trace the development of the chemical brine industry. In 1927, John Rademaker drilled his (immortal) brine well. The giant of the salt industry, the R. G. Peters Salt and Lumber Company at East Lake was, figuratively speaking, dead. Mr. Rademaker purchased this abandoned property and formed the Rademaker Chemical Company. Records state that eight salt wells were owned and operated by the R. 6. Peters Salt and Lumber Company (11) (12) The 1913 status lists seven wells operational and one well abandoned. (9) Mr. Rademaker drilled one of these wells deeper and completed it as a chemical brine well.
In about 1940, the Rademaker Chemical Company was sold to the Michigan Chemical Company. (16) At this time, six chemical wells and one abandoned salt well were a part of the property. Between 1950 and 1960 Michigan Chemical Company sold five of these six chemical wells to the Standard Lime and Refractories Company. Presently, four of these wells are operational.
On the west side of Manistee Lake, two chemical brine companies were in operation. The Great Lakes Chemical Corporation probably went into operation between 1930 and 1940. The Company owned and operated at least nine wells. Seven of these wells were sold to the Standard Lime and Refractories Company December 31, 1960. (15) The status of the other two wells is unknown. One of the unknown wells is located on the old Great Lakes Chemical Plant property. (17) The other operating company is the Morton Chemical Company. The Morton Chemical Company has drilled at least six chemical wells, dating from about 1938. Of these wells, four are operational and two have been plugged. (14)
Today, (1970) there are only two companies at Manistee operating chemical brine wells. The Morton Chemical Company owns and operates four chemical brine wells. Standard Lime and Refractories Company has 22 operational wells. (17) The Michigan Chemical Company still operates at Manistee, even though it has

K. E. Childs– Page 8 of 26
no wells. It receives brine from the Standard Lime and Refractories Company and from this brine extracts bromine. The brine is then pumped to Standard's plant and processed for magnesium.
Construction Practices from 1927 unti1 1970 All brine wells in operation at Manistee are drilled and completed using standard oil field techniques. Sketch No. 3 (17) shows a typical brine well profile. Brine wells are completed in the following manner:
1. A hole is drilled through the glacial drift, which is generally about 600 feet thick, and then surface casing is set.
2. The hole is drilled to about 2500 feet and a long string of casing is set to total depth. Next, the well is drilled to the bottom of the brine formation (about 2700 feet). The hole is open from the bottom of the long string to the bottom of the brine formation.
3. Tubing is hunt inside of the long string with a submersible pump attached to the bottom. The static fluid level of the brine is several hundred feet above the bottom of the well.
4. A well house is constructed and a shallow ground water well completed. The water well provides a small continuous flow of ground water which falls down the well between the long string and the tubing for brine dilution. Dilution is necessary so that crystallization does not occur. An electrical cable runs from the well house down the well between the long string and tubing and attaches to the submersible pump at the bottom of the well.
Contemporary Operating and Monitoring Practices Located at the well house is an ampere meter and a transformer. The ampere meter is observed daily and this gives an indication of the operating status of the downhole equipment. The rate of production for each well is determined by a technique called a barrel check. A barrel check consists of filling a barrel of a known size with brine and timing the fill up. Volume divided by time gives an approximate rate which is then extrapolated to give daily, weekly or monthly well production volumes. The contents of the barrel are usually dumped on the ground.
Following is a review of the operating and monitoring practices utilized by the two operating chemical companies at Manistee.
Practices of the Morton Chemical Company
The Morton Chemical Company operates four chemical brine wells at Manistee. It is suggested that the reader refer to diagram No. 3 for a pictorial schematic portrayal of their well system. (13) The four wells are practically identical, and the wells can be discussed as a group rather than individually. The total weekly and monthly production for the well field is obtained by performing a
weekly barrel check on each well. These brine wells, in the past, utilized a holding tank near the well head for their barrel checks. This tank also served as a holding container for brine prior to being pumped to the large cement holding tank at the plant. The level of brine in the well holding tank was regulated by a float and a level. It has been recorded by personnel of the Water Resources Commission and the City of Manistee that occasionally these level controls failed and unknown quantities of brine flowed onto the ground. Periodically samples of brine are collected and chemically checked. The frequency of this practice is unknown to the writer.
The monitoring procedures utilized by the Morton Chemical Company consist of:
1. Daily inspection of each operating well and well house.
2. Weekly barrel check at each well.
3. Observation of ampere meters daily at each operating well.
4. Daily recording of the volume of brine pumped from the cement holding tank to the plant.
Practices of the Standard Lime and Refractories
Standard (Standard Lime and Refractories Company) operates 22 chemical brine wells at Manistee. Diagram No. 4 (17) Standard wells numbers 15, 16, 17, 18, 19, 20 and 21 are connected by one transmission line. This transmission line carries the brine down past Great Lakes’ abandoned plant, under Manistee Lake, and over to Standard's plant. Depending on bromine demand, the brine is either diverted into a large holding tank or allowed to bypass the plant and piped north to East Lake where it is stored in a series of large holding tanks located on the bluff above the Michigan Chemical Company's plant. Standard wells number 2 thru 14 and wells with numbers greater than 21 are connected by transmission lines. This line carries the brine to the set of holding tanks located in East Lake. The brine flows on demand down the hill to the plant of the Michigan Chemical Company, where the bromine is removed and the brine is pumped south to the large holding tank behind Standard's plant.
The monitoring procedures utilized by the Standard Lime and Refractories Company consist of: (17)
1. Daily inspection of all operating wells.
2. Daily driving inspection of most visible pipelines.
3. Reading and recording of charts that monitor pump amperage.
4. Reading and recording of well pressure output gages.
5. Daily volume is recorded and determined by barrel checks.

6. A daily ledger book is maintained for each well. Ledgers are divided as follows:
Significant facts about Standard's brine well operations are as follows:
1. Wells are drilled and completed using standard oil field techniques. Basically all wells are identical.
2. Wells, when initially completed, are pumped at a rate of 50,000 GPD. Later the rate is lowered to 40,000 GPD (about 30 6PM).
3. The volume of brine that flows to the Michigan Chemical Company is monitored.
4. There is no scheduled maintenance for transmission lines.
5. All wells have a well house or some type of shelter for electrical equipment. Most of these are clean and in good condition.
Evaluation of Operating and Monitoring Practices
Theoretically, a chemical brine well that is drilled and completed using the best technology that is available and operated properly generally should not result in any ground water degradation. However, the operation of most chemical brine wells at Manistee has resulted in the wastage of brine and consequently, contamination of the ground water. The contamination, in most cases, is believed to be restricted to an area around the well head.
Location of Salt and Chemical Brine Wells at Manistee Salt wells have been drilled at Manistee since 1881; chemical brine wells since 1927. The drilling, completion, operation and abandonment programs for these wells have been designed and implemented solely by the owners. Consequently, in many cases, the exact location of wells is unknown, and the status of wells as to condition at abandonment is unknown. In short, only limited data about old wells are available. Research of material available at the Manistee County Historical Society Museum, (18) Manistee City Library and the Michigan State Geological Survey provided most of the information used to locate old wells and plant sites. Map No. 4 Sawmills were built on glacial beaches adjacent to Manistee Lake and Manistee Lake Outlet. The old sawmill sites were flat and very accessible for the movement of drilling equipment to and from other sites. The sawmills had large piles of slab wood and sawdust which were usable as fuel for the salt blocks. The mill sites also had buildings which, in many cases, were converted and used to support the production of salt. In general, all wells drilled before 1927 were salt wells drilled on the site of the owner's sawmill operation. The first chemical brine well was drilled in 1927. (1) Salt and
brine wells drilled after 1930 are not, in most cases, located on plant sites. The location of these wells is given on Map No. 1. In some cases, the exact location of wells drilled prior to 1930 is known. All collected well data are contained in an attachment to this report. (23) See the section entitled "Salt and Brine Wells.”
It is strongly recommended that all old wells be plugged in accordance with existing plugging regulations, and their locations be determined by survey and reported to the Michigan Department of Natural Resources. This is an important step toward prevention of ground water pollution even is some such wells escape detection, for one well can easily provide millions of gallons of chlorides producing widespread ground water degradation.
GROUND WATER AND CONTAMINANTS
Domestic Water Supply (19)
The first municipal water supply system for the City of Manistee was purchased October 1, 1899, from a private water company for $125,155.81. The original water supply system was located in the vicinity of the First Street south of the Manistee Lake outlet. Water was pumped from a large excavated well thirty feet in diameter and forty feet deep. The main well was connected to three, eight-inch supply wells that were sixty feet deeper than the main well and about seventy-five feet below Manistee Lake outlet water level.
The population of Manistee around the turn of the century was about 8,500 and of these sixty percent used municipal water. Superintendent Stephen Cahill reported that the average daily consumption of water was 819,344 gallons. Shallow dug or bored wells supplied homes not connected to the municipal system. As the demands for water increased, new wells and well fields were developed. City wells numbers 4 and 59 located on the south side of First Street, were drilled and later redrilled (see Map No. 1). In 1935 well number 3 was drilled on Spruce Street. Shallow wells were also drilled and developed at the end of Fifth Avenue. The ground water quality was good and, initially, treatment was unnecessary. The rash of typhoid fever, climaxing at a high of 41.6 deaths per 100,000 in the years 1907-08, (19) and a series of public health complaints, made it necessary to add protective chemicals to the water. The chloride level in the water supply, when purchased in 1899, was 5 ppm (parts per million) or less. In 1963 (20) the chloride level jumped to 355 ppm in the wells located near Fifth Avenue. At this time the water supply system on Fifth Avenue was abandoned and the wells were plugged; source of chloride was not determined. At the time, the contamination of these wells probably was not considered a threat to the general ground water supply because the wells were shallow and were isolated from the City's other wells, vertically and horizontally.
K. E. Childs– Page 9 of 26

K. E. Childs– Page 10 of 26
However, the chloride level in the city wells had been increasing and chlorides in water from wells, those wells located along First Street, had increased from a "trace" in 1921 to 22 to 27 ppm in 1969. (20) City well number 3 on Spruce Street reflected a chloride level of 2 to 6 ppm in 1959; (20) whereas the replacement well for number 3, drilled less than 20 feet away, recorded a chloride level of 27 ppm in 1969. (20) All of these chloride levels, other than the 355 ppm, were well below the maximum that had been established for public health and they were generally below the taste threshold.
The abandonment of the wells along Fifth Avenue and increased demand placed a burden on the City's other water wells. In 1963, with the encouragement of a prospective government grant, it was decided that a new water supply would be developed. A grant was obtained and in the spring of 1963 a test well was drilled in a new well field south of Manistee and about fifteen hundred to two thousand feet northeast of the intersection of Cherry and Merkey Roads. This first test well (No. 6) penetrated a groundwater aquifer approximately two hundred feet thick. The well was pumped and a sample taken and analyzed. Chemically, the water was fit for human usage without any treatment and after pump testing the well for fifty-six hours, another water sample was taken and the quality of the water had not changed. However, Well No. 6 has increased from a zero level in 1964 to a level of about 60 ppm chlorides in 1969. Two more test wells were drilled. The second test well (No. 7a) produced water that was unuseable. Specifically, the water had a chloride level that ranged from 1,000 to 2,000 ppm. An attempt was made to pump the contaminant out of the ground water aquifer. The well was pumped for seventy-four hours at a rate of 190 gpm. At the end of this period, a sample indicated that the chloride level had dropped to 770 ppm. The pump test was terminated and the well abandoned.
Next, the City moved in a northeasterly direction and drilled the third test well (7b). The well was pumped for two hours after which a water sample was taken from the bottom of the aquifer. The sample contained chlorides at concentrations of 1400 ppm. Eventually, this well was completed by setting a screen forty-seven feet above the bottom of the aquifer. The chloride level at the completed pump depth has increased from a level of 14 to 25 ppm in 1964 to about 85 ppm in 1969.
The chlorides in these wells pose some very important questions.
1. Why does the aquifer in this area contain a high concentration of chlorides (1000-2000 ppm)?
2. If the chlorides in this aquifer are not a natural condition then,
a. what preventative policies should be implemented to prevent recurrence?
b. what future significance will these contaminants have on municipal water supplies?
During the winter of 1969-70, a well field testing program was initiated southeast of the Manistee Blacker Airport (22N-16W-33). Presently (April, 1970) this well testing program is still being conducted. Also, during the winter of 1969-70, gas was discovered in city well No. 3A. A crude analysis indicates that the gas is 60% N., 7% O2 and 33% CH4 and that it has no odor. The gas presents a major hazard to public safety because of its explosive nature. Presently, this well is being pumped to wastage in an attempt to purge the gas, but indications are that this procedure has not produced a marked decrease in gas content.
Presently, the City of Manistee is seeking a Federal grant that will provide funds for it to expand its sewage treatment plant. In addition, it would like to expand its water supply system to provide service for the nearby small villages that still utilize individual shallow wells as a source of potable water.
Ground Water and Aquifer Characteristics
General Geology of the Manistee Lake Area Available well records were collected, cataloged and reviewed. Three geological cross-sections of the area (see index entitled cross-sections) have been drawn to give the reader a general perspective of subsurface geology and ground water availability in the area.
Cross Section No. 1
A south-to-north section that starts at the Mason-Manistee County line and goes north up Grant Highway and Hill Street. This area has a thin covering of permeable glacial sand that except for low-lying areas near Manistee Lake, is situated above ground water table and consequently has very limited usage as a ground water aquifer.
In the cross-sectional area only one well (21N-16W-18-2) has demonstrated high capacity. All other wells produced only limited quantities of water, generally less than 20 gpm.
Data from this area indicate that ground water is readily available, in limited quantities, for domestic usage.
Cross Section No. 2
This section extends from Butcher Lake northeast to the Manistee County dog pound located in 21N-16W-16.
Data from wells (24-12 and 19-4) west of Manistee Lake indicate two thick permeable top aquifer zones. Chemical analyses indicate that both zones are contaminated with chlorides. (20) Well No. 17-2 has been deepened to 517' because the top water zone was contaminated with paper mill waste. On the basis of the well record, it appears that this well contains at least 55 feet of paper mill contaminated water in the bottom of the top aquifer. (23)
This cross section includes an extensive bed of low permeability glacial material overlain by a thick bed of

K. E. Childs– Page 11 of 26
glacial sand. There are four wells on this cross section. In three the top zone is locally contaminated. Only well 24-12 had demonstrated it is capable of producing large volumes of uncontaminated ground water and this is from the bottom zone.
Cross Section No. 3
This cross section is drawn from Spruce Street east to the Blacker Airport, on the trough of a large glacial flow way. The wells in this area have thick beds of water bearing permeable material that are suitable for large scale well development. The ability of an area or an aquifer to produce a given volume of water can be established only be test drilling and pumping. It is suggested that the reader study the available chemical anaylsis and well records that are a part of this report. Many areas contain concentrated slugs of contaminated ground water and consequently are not suitable for domestic needs unless treated. Comments here are restricted to interpretation of available data and are not meant to imply that there are no other areas locally that would yield large volumes of uncontaminated ground water. The definition of a ground water aquifer can be ascertained by drilling test wells and studying the well data.
Definition of Aquifer Characteristics The ground water aquifer characteristics at Manistee were determined by field work, personal research and the assemblage of well data. Map No. 1
shows a delineation of the area included in this study. The ground water in this area (Map No. 2) is contained in one aquifer. In some areas this aquifer has layers of fine sands and clays that give it the appearance of being two aquifers instead of one. Data indicate that the ground water producing horizons within this area are hydraulically connected.
The general directions of ground water movement are indicated on Map No. 2. Locally, ground water near Manistee Lake flows into the lake. There is a ground water divide parallel to the west shore of Manistee Lake, west of which flow is toward Lake Michigan. The ground water on both sides of the outlet of Manistee Lake flows into the outlet. The exception to this is when the drawdown cones produced by the City wells change, locally, the gradient of the ground water and then the water present in the Manistee Lake outlet flows into the ground water aquifer. The importance of this flow pattern is that the ground water flushes the chlorides dumped near the shores of Lake Manistee into the lake.
Definition of Ground Water Quality A map (Map No. 3.) is attached to this report showing where the water samples were collected and the concentration of chlorides present. A line is drawn across all circles in which the chloride level is 10 ppm or higher.
During 1969, an extensive water sampling program was conducted. (See supplement) The purpose of this sampling program was to determine the chemical quality of uncontaminated ground water and also to identify and delineate area that contains contaminated ground water. Approximately 500 samples were collected and analyzed. All samples were analyzed for chlorides because chlorides were invariably present as a contaminant in most polluted ground water samples. Chlorides were selected also because it was necessary to have a chemical which was common, fairly stable, and could be used as a reference for ground water contamination.
The samples were analyzed for sulphates to determine if certain areas would reflect sulphate contamination. Nitrates were checked as a contaminant of public health significance and to give an indication of the adequacy of private sewer-water well systems. Within the survey area the residents of Stronach, Parkdale, and East Lake and the residents living outside of the city limits of Manistee and Filer City have always utilized individual sewers and water supply systems. There are a few private water wells within the city limits of Manistee. An attempt was made to locate all of these wells and collect samples. The analyses from the sampling program were studied and several conclusions were reached, namely:
1. Natural ground water has concentration of chlorides that are 2 parts per million or less.
2. Natural ground water has average concentrations of nitrates and sulphate are less than 0.1 ppm and 0.5 ppm, respectively.
Within the survey area a number of complete chemical analyses have been made of ground water samples. Analyses in which the chloride level was less than 2 ppm were studied and it was apparent that for all practical purposes these samples were identical. This fact provides additional support for stating that these samples represent chemically uncontaminated ground water. A typical chemical analysis for uncontaminated ground water within the survey area is shown on data sheet No. 1.
Contaminants
Impact on the Ground Water It is essential that the reader of this report understand a few basic ground water principles.
1. Ground water is in a dynamic state. It is constantly moving from place to place. In the same way that surface water flows downhill, ground water is ever-moving from a higher elevation to a lower one. Movement is both vertical and horizontal.
2. Ground water is an integral part of our total environment. Rain water falls on the land surface. Some of the rain water flows off as surface water and some of it percolates into the ground and becomes

K. E. Childs– Page 12 of 26
ground water. Surface water may flow into a stream or lake and infiltrate into the ground and become ground water. Such infiltration from permanent lakes and streams is very unusual in Michigan except where heavily pumped wells produce reverse flow. The ground water can move downhill and become surface water again. The general difference between surface water and ground water is location. Water that is readily visible on the land generally is called surface water. Water in the saturated rocks beneath the land is called ground water. Surface and ground water move toward the seas. In route, some of the waters are used by nature and man, some are evaporated. Eventually all waters return to the atmosphere to fall as precipitation and begin the cycle all over again. Polluted surface water, such as lakes, can pollute ground water, where wells produce reverse flow, and polluted ground water can pollute surface water. A pictorial sketch of the hydrologic cycle is attached. See sketch No. 5.
Pure water has a specific gravity of one gram per cubic centimeter at 4°C. The specific gravity of high chloride water is higher than pure water. Therefore, high-chloride water will tend to sink when dumped into non-polluted bodies of water such as a lake or into the ground water. In a lake this movement could occur in a short period of time such as a few days or less. In a thick ground water aquifer complete fluid balance may take years. Because of the time required for fluid movement and integration, it is easy to take a few samples from a well and make assumptions of quality that are erroneous. A polluted fluid body that is dumped into the ground water moves in a direction that is a result of two forces. Density differences and recharge waters causes the heavier body to move vertically down toward the bottom of the aquifer and the ground water gradient moves the polluted body horizontally in the direction of ground water movement. Eventually the pollutant, after sufficient dilution and filtration will become an integral part of the ground water. A water sample taken at any one place at any one time may have little significance, thus it is essential that water sampling programs be extensive in area and time.
Sketch No. 4 illustrates a model displaying the possible movement of a heavy polluted body that has been dumped into the ground water aquifer. A water sample collected from a well is only indicative of the water that flows into the pumping cone, up the tubing and out through the pump. It is easy to understand why a well can initially pump uncontaminated water and some period of time later, produce water unfit for human consumption without treatment.
Salt and Brine Industries Previous parts of this report have established several very important facts. These facts and their significance are as follows:
1. The uncontaminated ground water in this area contains a very low concentration of chloride, specifically
2 ppm or less. The presence of chlorides above a few parts per million indicates contamination.
2. The salt industry has produced (NaCl) salt from two separate horizons. One at about two thousand feet and the other at about thirty-seven hundred feet. In both cases the salt is present as a solid bed and not as a connate fluid. The shallower salt wells were utilized from 1881 until 1954. In 1954 the Manistee salt companies started, and have continued to utilize, the two-well system referred to as a gallery. Fluid present in an abandoned salt well can come from any formation above the production zone, depending on the well's casing and abandonment program. The fluid level in an abandoned salt well located on the Hardy Salt Company, property was checked during the summer of 1969. The fluid level was about 110 feet below ground level and 100 feet below the top of the ground water table. The chloride concentration was 83,000 ppm. This well probably reflected a fluid column that is being charged by the ground water. The difference in elevation being due to the difference in fluid density. The newer salt wells, galleries, have a fluid pressure in the production well that is usually 25 to 40 psig at the surface. This is due to the energy being supplied by man and not by nature. The significance is that salt brines (NaCl) produced through salt wells will not result in ground water pollution unless the salt wells fail mechanically or the brine is spilled by operational practices. Chemical brine cannot pollute the ground water aquifer unless spilled because of mechanical failure or operational practices.
3. The fluid level in the salt wells is several hundred feet below the base of the glacial drift and the only way that brine can get to the surface of the ground is to be pumped.
Identification of Ground Water Contaminants Using a Mathematical Analysis Samples were collected from operating salt and chemical brine wells (data sheets 2, 3, and 4). The chemical analyses from these wells were averaged and representative samples are shown at the bottom of each sheet. The common chemicals present in all the chloride solutions are chlorides of calcium, magnesium and sodium.
Water well samples from wells contaminated by salt (NaCl) brines were collected and analyzed (see data sheet No. 5). These samples were taken from water wells that supply water for salt well injection. These wells are generally located in isolated areas, so the chance of contamination from other sources is slight. These samples represent a known condition. It was desirable to approximate, mathematically, the chemical solution that had resulted in ground water pollution giving the following data:
1. Chemical definition of uncontaminated ground water. (data sheet No. 1)

2. Chemical definition of salt brine solution. (data sheet No. 2)
3. Chemical analysis of ground water contamination by salt brine. (data sheet No. 5)
Uncontaminated ground water contains a certain concentration of calcium, magnesium, sodium and chlorides. Increases in these chemicals can be attributed to a contaminate. The amount of these chemicals present in ground water as a contaminant can be arrived at by subtracting the concentrations that are present in normal ground water. Ground water sample 2676 was collected from a water well that is contaminated by salt brine. Analysis is represented in ppm.
In this case it is apparent that the contaminant was a salt solution. The average chloride concentration for this salt field is 178,000 ppm. Ground water sample 2676 displays salt brine in the following dilution:
3948 ÷ 178000 = .02220
Call .02220 dilution constant D.C.
Ca = 58 ÷ DC = 2613 = calculated original concentration
Mg = 5 ÷ DC = 135 = calculated original concentration
Na = 2453 ÷ DC = 110,500 = calculated original concentration
A mixed solution that is 97.780% ground water and 2.220% salt brine would be very similar to sample 2676.
From these approximations two conclusions are offered:
1. The chemical analysis for the mathematical model is very simlar to the average chemical analysis obtained for salt brine samples.
2. The mineral content of a salt brine is composed almost entirely of sodium chloride, with other chemicals present in minor amounts.
Samples were collected from water wells that are contaminated by chemical brine. These wells are used to supply dilution water for chemical brine. Reliability was established using the same mathematical method of used for salt wells. See data sheets 8, 9, 10, 11 and 12. It is suggested that this method of mathematical approximation is a tool that can be used to indicate the source of contaminants in polluted ground water samples.
Identification and Evaluation of Major Areas of Contamination Winter conditions in the survey area necessitate the use of salt for highway ice control. Manistee City and Manistee County use about 400 tons and 750 tons respectively of NaCl each winter for ice control. Also dust control is maintained on many miles of dirt roads and on the shoulders of paved roads by spraying them with waste brine. (22) The NaCl used by Manistee City is applied in a pure form without the use of sand, because sand plugs the storm drains. The county applies sand and salt as a mixture for ice control. This practice of using chlorides for ice and dust control is resulting in some ground water contamination in certain areas; specifically, areas that are heavily salted and lack storm sewers, which would facilitate runoff to Manistee Lake. Areas in which these conditions exist are Stronach, Parkdale, East Lake, and south of Manistee on Maple Street and U.S. 31.
Sources of Contamination at Manistee
Virtually all contamination at Manistee present in ground water, surface water and the soil can be attributed to artificial causes. The sources can be grouped as follows:
1. The salt industries
2. The chemical brine industries
3. The paper industry
4. Salt and brines used for ice and dust control
5. Individual homeowner septic tanks
Evaluation of Areas of Contamination at Manistee. Refer to map No. 2
1. Contamination - Butcher Lake 21N-17W-24
The ground water in this vicinity around the Morton Salt Company's well house is contaminated with salt (NaCl) brine which had infiltrated into the ground water from a pit near the well house into which the backflush from the salt galleries is dumped. Whether or not salt is dumped on the surface of the ground in connection with practices other than backflushing is not well documented. It has been suggested that all salt brine that infiltrates into the ground water is intercepted by the two water wells and does not progress beyond their pumping cones. This assumes that all salt brine that flows from the backflushed dumping pits also flows into the well pumping cones. However, some chlorides are undoubtedly passing outside of the well cone and probably beneath it. Also, the natural movement of the ground water carries the chloride northwesterly away from the water wells. Presently, the only known water wells being affected by the chlorides are the wash water wells owned by the Morton Salt Company. Eventually the contaminated ground water is likely to reach private water wells.
K. E. Childs– Page 13 of 26

K. E. Childs– Page 14 of 26
2. Contamination - Manistee City - 21N-16W-18
The ground water surrounding the Hardy Salt Company is contaminated with chlorides. This area has been the site of salt production since 1881. It has been the practice of past and present salt companies to dump waste brines in pits, trenches, and into Manistee Lake. Even though the ground water flows normally toward Manistee Lake, the volume of brine discharged causes contaminated water to move at least some distance in all directions. Also, a salt gallery is owned and presently operated on the plant property. This salt gallery is backflushed and the contaminated salt water is dumped into a shallow pit. All of these practices have contributed to the degradation of ground water in this area. Presently, almost all residents in this area utilize municipal water. It is doubtful that they could use the local ground water as a domestic untreated water supply. The effect of present operating practices will be to increase the total areas that are contaminated by chlorides.
3. Contamination - Manistee City 21N-17W-12
The ground water surrounding the Morton Salt and Chemical Company is contaminated with chlorides. This area is located on a high area in the ground water table and contaminated water is flowing in all directions away from the source. This area has been the site of salt and brine companies since the 1880's. The practice of dumping production waste in the lake and on the ground has been quite common in this area. The residents of Manistee who live near this area all utilize municipal water. Spillage of brine and the general dumping of waste products on the ground and in the lake will continue to provide chlorides for ground water recharge and subsequent spreading of chloride contamination.
4. Contamination - Manistee City - 21N-17W-1
The land areas both south and north of the outlet of Manistee Lake bordering Manistee Lake contain chloride contaminated ground water. Both of these areas were sites of large salt companies and there were at least 8 salt wells drilled and operated in these areas. Natural ground water movement in these areas should eventually carry away all chlorides except those continuing to enter from road salt application.
5. Contamination - Manistee City - 21N-17W-11 22N-17W-36
The land area around city wells No. 1, 2, 4 and 5 is contaminated with chlorides. Contaminated water has flowed from Manistee Lake outlet and provided recharge for city wells. This recharge resulted in the abandonment of city wells No. 1 and 2 located in Fifth Avenue Park. It is believed that most of this contamination took place before 1964. For an explanation see "Contamination - Manistee Lake." (No. 6) Located at the east end of Manistee Lake outlet is a discharge used by the Morton Company and occasionally Standard Lime and Refractories for discharging waste chlorides from their plants. The
purpose of this discharge is to reduce the concentration of chlorides in Manistee Lake.
6. Contamination - Manistee Lake
Manistee Lake is in intimate hydraulic connection with the ground water in the survey area. The lake is a low area in the ground water table into which large volumes of ground-surface water flow with eventual discharge into Lake Michigan.
7. Contamination - Villages of Stronach, East Lake and Parkdale
Stronach: Samples collected in Stronach indicate frequent chloride levels in the 30 to 60 ppm range. Most samples indicating higher chlorides are on the west side of town bordering Manistee Lake. Samples collected from domestic wells in the villages also indicate higher than normal concentration of nitrates. It is felt that these nitrates and some of the chlorides present in the water wells are the reflection of not having proper isolation between their septic tanks and water wells.
East Lake: The ground water beneath East Lake, especially on the Manistee Lake side, is slightly contaminated with chlorides. Also, several ground water samples indicate an abundance of nitrates. The ground water on the east side of East Lake is generally less contaminated than that on the west side. It is noteworthy that the east side of town is an area of fairly recent expansion and that the west side of town is at least 70 years old. It is felt that generally the chloride contamination in East Lake water wells represents septic tank effluent recharging the ground water. Of minor significance are road chlorides. Manistee Lake is too far from East Lake to provide local recharge. Between East Lake and Manistee Lake is a glacial beach. This beach has been the site of a chloride-using industry since the 1880's. Presently, it is not not possible to ascertain the effect that these industries have had on the local ground water.
The southwest corner of East Lake is contaminated with chemical brine probably from a nearby chemical brine well (No. 5). A water well located at 457 W. Main indicated a chloride level of 950 ppm when tested during the summer of 1969. (20) The ratio of calcium-magnesium and sodium and the high chloride concentration strongly implies that the source is the nearby chemical brine well. Whether the chlorides resulted from spillage at the wellhead or from a ruptured pipeline has no significance to this report. Residents living in this area of East Lake should maintain a regular water well sampling program so they can document the occurence of contamination in their wells. This is important because it would provide advance warning to the well owner and he could then implement plans to develop other sources of potable water. The chemical company that owns the above mentioned chemical well is presently developing a deeper water well for the people living at 457 W. Main Street.

K. E. Childs– Page 15 of 26
Parkdale: A fairly extensive well sampling program was conducted during the summer of 1969 in Parkdale. (20) The chloride concentration in almost all wells is considerably higher than uncontaminated ground water. It is felt that the majority of the chlorides are derived from one source:
a. Poor septic tank - water well isolation.
It is doubtful if the ground water beneath Parkdale received any recharge water from Manistee Lake.
8. Contamination - 21N-16W-7 21N-16W-19
The plant areas presently occupied by P.C.A., Great Lakes, and Michigan Chemical are probably underlain by contaminated ground water. These areas have been the sites of chloride-using industries. There are very few ground water samples available in these areas. Presently there are no available data to verify this assumption.
9. Contamination - 21N-16W-17
The paper mill located in Filer City has pumped sludge from its clarifiers, and the condensate from the black liquor process to infiltration lagoons. The quantity discharged to these lagoons varies from 15 to 60 million gallons per month (based on WRC May 1967 Survey.) (15)
Using a minimum value of 15 million gallons per month the company has pumped 3,420,000,000 gallons of waste to infiltration lagoons in Section 17 since 1951. The quantity of liquid that evaporates is considered of little importance to its disposal program. Some of these lagoons are reported to be as much as forty feet deep. In the lagoon area there is generally 70 feet of sand above the ground water table. In 1956, waste from these lagoons contaminated Standard Lime and Cement Company's water well located in the southwest corner of Section 17. This water well provided supply water for dilution of brine produced in Standard's No. 2 brine well. The tubing in this well was raised 26 feet and temporarily it was above the contaminated water, but the eventual solution was drilling the well deeper to 517 feet. (23) This well log indicates 55 feet of back water sand which appears to be simply the aquifer contaminated with 55 feet of paper mill waste. A well was drilled during 1954-1956 on the west side of East Lake Road, south of the entrance to the Standard Lime plant road. This well, which was on the bluff above Manistee Lake is reported by Dale W. Granger of the Water Resources Commission staff to have pumped black contaminated water, which probably migrated from the lagoons. It is the opinion of the writer based on available data that the paper mill lagoons in Section 17 are recharging into the ground water and the waste is migrating into Manistee Lake. The pollution of Standard Lime's No. 2 well documents the presence and migration of waste. (20) It is felt that the wastes are sinking in the ground water aquifer and occupying a horizontal layer beneath the shallow wells in the area. It is likely that the wastes are flowing in all directions away from the discharge area.
The dumping of paper mill waste in Section 17 has eliminated the possibility of large ground water supply development in certain areas east of Manistee Lake around Section 17. A series of test wells could document the extent of waste migration.
10. Contamination - City of Manistee's Well Field
A discussion of the development of the City of Manistee's well field located in Section 14 and a definition of its contamination problems has already been presented in another section of this report. See the section entitled "Historical Sketch of Water Supply Development at Manistee.” There has been considerable effort by other technical people to determine the source or sources of contamination of the city's well field. The difficulty has been that these people were unable to spend the time necessary to fully evaluate all possible sources. Consequently, their papers and reports did not have the technical depth necessary to identify and substantiate the source and/or sources of contamination.
This report will evaluate all possible sources that have been suggested by past investigators.
In retrospect, regarding the City of Manistee's contaminated well field (21N-17W-14) and after reviewing geological data and chemical analyses the following premises are offered:
1st The well water in wells (6, 7a, 6b) has been contaminated by a chloride solution. This chloride solution is present as calcium chloride, magnesium chloride and sodium chloride. Other chemicals are present in minor amounts. The ratios of calcium magnesium and sodium clearly establishes the source as a chemical brine.
2nd Uncontaminated ground water has a chloride level that is equal to or less than 2 ppm.
3rd Chloride levels of 2000 ppm have been recorded in City Well No. 7a. The source of contamination must have a chloride level greater than the level reported in the contaminated sample.
4th The ground water aquifer is essentially 200 feet thick in the area of the well field. The volume of ground water available for dilution is large. This implies that the source of contamination is close to the contaminated well field.
5th There have been a series of water samples collected in contaminated wells from the top of the water table to the bottom of the well. These samples establish, as fact, that the level of chloride contamination increases with aquifer depth. This means, assuming surface contamination, that the chloride solution has had sufficient time to pass through the entire 200 feet of the aquifer. This passage could take several years.
6th Assuming that dilution occurs with distance from the source then the source of contamination for

K. E. Childs– Page 16 of 26
wells is in a direction between due west and due south.
A review of all sources of chlorides that could have contaminated city wells numbers 6, 7b and 7a follows:
1. Plugged salt wells located in Section 21N-17W-13
It is assumed these wells have not resulted in chloride contamination in the city's well field because:
A. Salt brine contains very small amounts of calcium and magnesium even when pumped as a saturated solution. Recent analyses of salt brines indicates an average chloride concentration of 178,000 ppm and calcium and magnesium are concentrations of 1700 ppm and 45 ppm, respectively. This analysis is for a deep salt well, whereas the above wells are shallow salt wells. The salt brine from shallow salt wells would be chemically very similar to the brine from a present operating salt well. Chemically, a salt brine source cannot produce a contaminated water sample comparable to the samples collected from city well No. 7a. Well samples indicated that the direction of contamination is not from the east. The physical distance from this salt well field to the water well field is in excess of one mile. It would take a tremendous volume of spillage at the salt field to provide a chloride solution to 2,000 ppm at the water well field. Chemically and physically, it is not probable that this salt field has contaminated the city's well field.
2. Abandoned Chemical Wells Located in Section 13 of 21N-17W
There are two abandoned chemical wells located in Section 13 approximately one and a half miles east of the city well field. Chemically the brine produced from these wells could be the source of contaminants present in the city wells. It is extremely doubtful though that a large enough quantity of brine could be dumped on the ground one and a half miles from a well and be able to contaminate the well water at a level of 2000 ppm chlorides. It is not likely that these wells are resulting in contamination to the city's new well field.
3. Salt Wells Located in Section 24 21-N-17W
Starting in 1958, two salt galleries were developed in the center of Section 24, adjacent to Butcher Lake. It has been standard operating practice to backflush these wells into a pit located about 100 feet from the well house. There are two shallow water wells near the well house used as a source of salt well wash water. The two wells are located approximately 100 and 1000 feet west and south of the backflush dump pit. The chloride concentrations in these two wells are 3900 ppm and 100 ppm respectively. The presence of chlorides in these wells demonstrates that the pit is recharging into the ground water aquifer and that the well pumping cones are intercepting some of the chloride contaminated water. The quantity of chlorides that bypass the wells and flows northwestward with the ground water is not
predictable with the data presently available. Because this area is about one-half mile from water wells, there has been no delineation of the chlorides movement. These salt galleries have not contaminated, in any way, the city's well field located in Section 14. There are several very good reasons why these salt galleries could not pollute the city's well field.
These reasons are:
a. The salt wells produce a NaCl brine. The contaminate in the city's well field is chemically like a chemical brine solution, i.e., high in calcium not sodium.
b. The salt water wash wells located at Butcher Lake, even though they are adjacent to the dump pit, do not indicate a very high concentration of salt. If a well, 100’ from the dump pit, has a chloride level of only 3900 ppm then it is very difficult to envision that a well two miles away could have a level of 2000 ppm.
4. Manistee Lake
It has been suggested that the practice of dumping chlorides into Manistee Lake has resulted in the city's well field being polluted. The reasoning being that the chlorides concentrated on the lake bottom and through time migrated westward.
a. A chloride solution of this level could probably not travel through two miles of aquifer, undergo dilution, and still have a concentration level of 2000 ppm.
b. Chemically, the lake water should contain a chloride solution that is like a diluted chemical brine but high in sodium. The reasons for this being the production practices of the chloride-using industries. From 1881 until 1927 the wastes dumped into the lake were from the production of salt. The brine industry started in 1927, but until 1954 they extracted only bromines and bromide from the brine. After 1954 magnesium was extracted and this changed the quality of the waste product.
5. Chemical brine well located at the intersection of Cherry and Merkey
Chemical brine samples were collected from the above brine well. See data sheet No. 4. Data sheets No. 13, 14, and 15 show mathematically that the ratio of calcium, magnesium and sodium are such that the source of pollution is very likely a chemical brine and not a salt brine. Well No. 7a has always been the well with the highest concentration of chlorides. If one accepts that dilution increases with distance then it is logical to state that well No. 7a is closest of the three wells to the source. The middle well No. 6b has produced samples that indicate that the level of chlorides is lower than in well 7a or the well to the east, No. 6b. It is believed that this slight irregularity could be due to a number of things such as:
a. Permeability differences of production areas around wells,

K. E. Childs– Page 17 of 26
b. Variation of pumping demands for wells,
c. Lithological variations around wells.
A review of the well samples indicates that the chloride front was pulled eastward as the wells were pumped until all three wells were contaminated.
The ground water aquifer is 200’ thick in this area and the ground water movement is locally northeastward. The high concentrations of chlorides in the city's well imply that the source of contamination must be very close to the well field. It has been repeatedly pointed out that the water samples from the brine well ground water well contains a very low level of chlorides. This is a fact, but it only means that the contaminated body has sunk down through the aquifer and is below the small pumping cone of the well. The samples from the well field indicate that the contaminated mass has had time to concentrate at the bottom of the aquifer.
There are a number of possible ways in which large quantities of chlorides could reach the ground water aquifer from the surface of the ground. The following is a partial list of some of the possible ways that the aquifer could be locally polluted.
a. Chloride spillage during the drilling, testing and completion phase of the brine well.
b. Chemical brine well work-over practices.
c. Brine holding tank operational malfunction. It is documented that in the past well owners used a brine holding tank, at the wellhead, to collect the brine prior to pumping it to the main plant. It is reported that occasionally brine from this tank flowed onto the ground.
d. Chloride spillage resulting from dumping after the weekly barrel checks were performed.
e. Pipeline leaks along Merkey Road. The occurrence of leaks along Merkey Road is documented.
See attached sketches, No. 6 and 7 for a pictorial presentation of the profile of contamination that are believed to exist in the vicinity of the city's well field.
Conclusion The city's well field located in Section 14, Filer Township, of Manistee County is believed to have become contaminated as a result of brine spillage associated with production of chemical brine from a well located at the intersection of Cherry and Merkey Road.
Recommendations - City of Manistee's new well field
a. Continue to pump wells No. 6 and 7b at a rate not in excess of the present rate. Increasing the pumping rate will result in changing locally the direction of ground water movement and this will cause the chloride slug to move closer to the production wells and consequently result in additional well water degradation.
b. Review current operating practices with brine well owners and develop practices that will prevent future occurrence of brine spillage.
c. Do not pump well 7a in an attempt to purge the aquifer.
d. Maintain a well sampling program on all wells. This will provide data that can be used to better evaluate the size and movement of the chloride slug.
It is the opinion of the writer that there are no practical or inexpensive methods by which this aquifer can be decontaminated. It is felt that the contamination level in the city's wells is not likely to increase appreciably with time above the present level and that if the pumping rate is not increased, the chloride level will decrease as the waste slug moves northwestwardly away from the well field.
Chloride Using Industries
The most effective way to prevent chloride wastage is to construct well and transmission systems that do not fail. The systems must be designed, developed, and operated to accommodate quantities and pressures that are never, in actuality, reached. They should be over-designed for ground water preservation.
The life of a well from the planning stage until it is abandoned and plugged can be divided into phases.
1. Drilling phase. Many deep wells in Michigan are drilled using a salt-base drilling mud. This mud serves several functions. It lubricates the bit, protects the wellbore, and helps circulate cuttings out of the hole. Generally, the mud pits are shallow, dug pits located beside the drilling rig. The drilling fluid infiltrates downward from the mud pit into the ground water. When drilling is completed, the remaining drilling fluid is pumped into the pit and left to infiltrate into the ground. If this contamination is to be prevented, the drilling company must use a metal tank for its mud and must be required to dispose of its drilling fluid in a designated area on completion.
2. Completion phase. During completion, it is common practice to treat the well and then pump this fluid out into the ground. Also, it is common practice to test-pump the well prior to production. These fluids are normally disposed of by dumping them out onto the ground and letting them infiltrate into the ground water. This practice must be terminated. All transmission lines and well casings should be cathodically protected.
3. All wells should be thoroughly tested prior to completion. These tests should define wellbore and reservoir characteristics. These data are necessary to establish the original conditions that exist for an individual well. Future data from additional tests can be compared with these basic data to determine and define changes that have occurred. Presently, it would be difficult, if not impossible to ascertain if a

K. E. Childs– Page 18 of 26
leak existed in a well below the surface of the ground.
4a. Operational phase - chemical brine wells. It is important to remember that the fluid level in a brine well is below the bottom of the lowest fresh water aquifer. Stated another way, this means that the ground water contamination resulting from a brine well is almost always the result of the operator's practices. Determining production rate by the barrel check method and then dumping the fluid on the ground results in ground water contamination. Production rates can be ascertained by an in-line flow meter or by a portable flow meter if the wells have the proper plumbing. It is possible to run the fluid from the barrel check back into the well. Almost all water wells checked indicated chloride contamination. It is occasionally suggested that all chlorides that are dumped, as a result of a barrel check, are pumped out by the nearby ground water well. Before commenting on that statement, it is essential to consider a few facts. Most of these water wells are of low capacity and quite shallow. They are located from 30 to 200 feet away from the wellhead. The ground water gradient may be such that the ground water carries the waste brine away from the water well. The water wells would seldom, if ever, penetrate the full aquifer and consequently have little, if any, influence on the section of the aquifer below the well point. The wells would have a very limited cone of influence and consequently practically no effect on the prevention of chloride migration and contamination.
4b. Operational phase - salt brine wells. Salt wells are potentially a greater source of chloride wastage than are chemical brine wells. The reason is that in a salt gallery, the production well contains a saturated salt solution that is always, during operation, at a pressure that will cause it to flow through any casing leak below ground level. Small leaks would be very difficult to detect. All backflushing of salt wells onto the ground should be stopped immediately. This practice is a major cause of ground water contamination. Instead, the salt water from backflushing could be:
1. Pumped into a tank and then reintroduced into the system as wash water,
2. recirculated in the well gallery by means of additional plumbing,
3. pumped into the storage tank at the plant.
4. Eliminated by the following method:
Backflushing can be eliminated by merely installing a small diameter string of tubing with a check valve, inside the production casing and extending it to a depth of about twenty or thirty feet below the point where mineral incrustation inside the casing begins. A caliper log can be run to establish this point. Also a temperature
survey of the well may show a change in gradient at this depth which could be used in future wells to pick the setting depth of the one inch string. Fresh water would be injected down the well through the one inch tubing and this would dilute the upward moving saturated brine to a point just below saturation. With care in regulating the volume of fresh water injected, a brine can be produced at a surface which is at or just below 100 degree salometer.
This method has worked with considerable success in other salt company brine fields.
It is recommended that the tubing be hung through a hanger equipped with wipers so that it may be pulled and installed under pressure thus eliminating the necessity of having to bleed pressure whenever a well work over project is initiated.
5. Monitoring phase. The wells are presently monitored only to maintain a reliable source of brine for production. A monitoring program also must be oriented toward prevention of ground water contamination, no matter how slight. The practices of barrel checking and pumping backflushings on the ground should be terminated.
Recommendations for all operating salt and brine wells are as follows:
a. Waste chlorides should be disposed of to suitable underground formations as feasible and as acceptable to the Geological Survey Division.
b. All dumping of chlorides into ground waters should be terminated. Eliminate backflushing.
c. Verify reliability of monitoring equipment on a scheduled basis.
d. Establish quality control standards.
e. Drill observation wells around all production areas and define ground water quality and gradient. Use this data to verify that ground water contamination is not occurring because of poor housekeeping practices.
f. Collect ground-water samples from production water wells to verify that contamination is not occurring locally.
g. Maintain and submit monthly, all operating and monitoring data obtained from wells, also include all maintenance performed.
h. Periodically, run electrical logs to ascertain the integrity of the well system.
i. Inspect wells and pipelines regularly.
j. All wells should be equipped with a continuous pressure and integrated rate recorder.
k. Pressure test all transmission lines on a periodic schedule at a pressure of at least 30 per
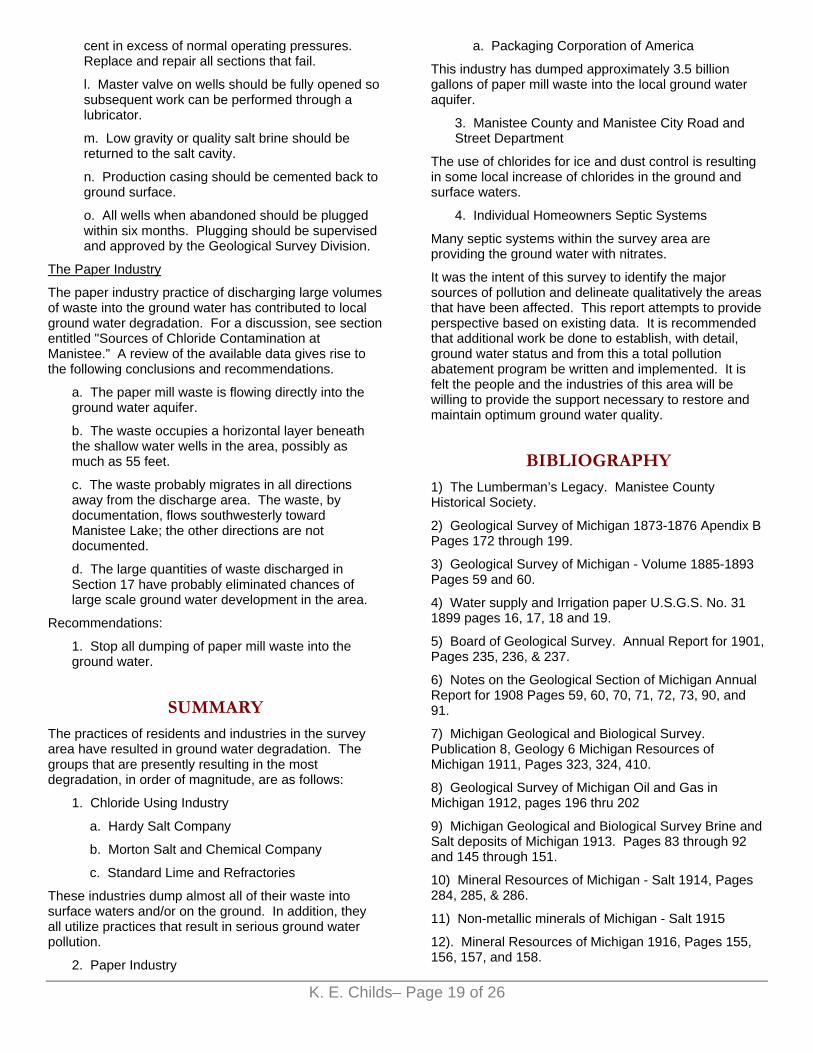
K. E. Childs– Page 19 of 26
cent in excess of normal operating pressures. Replace and repair all sections that fail.
l. Master valve on wells should be fully opened so subsequent work can be performed through a lubricator.
m. Low gravity or quality salt brine should be returned to the salt cavity.
n. Production casing should be cemented back to ground surface.
o. All wells when abandoned should be plugged within six months. Plugging should be supervised and approved by the Geological Survey Division.
The Paper Industry
The paper industry practice of discharging large volumes of waste into the ground water has contributed to local ground water degradation. For a discussion, see section entitled "Sources of Chloride Contamination at Manistee.” A review of the available data gives rise to the following conclusions and recommendations.
a. The paper mill waste is flowing directly into the ground water aquifer.
b. The waste occupies a horizontal layer beneath the shallow water wells in the area, possibly as much as 55 feet.
c. The waste probably migrates in all directions away from the discharge area. The waste, by documentation, flows southwesterly toward Manistee Lake; the other directions are not documented.
d. The large quantities of waste discharged in Section 17 have probably eliminated chances of large scale ground water development in the area.
Recommendations:
1. Stop all dumping of paper mill waste into the ground water.
SUMMARY The practices of residents and industries in the survey area have resulted in ground water degradation. The groups that are presently resulting in the most degradation, in order of magnitude, are as follows:
1. Chloride Using Industry
a. Hardy Salt Company
b. Morton Salt and Chemical Company
c. Standard Lime and Refractories
These industries dump almost all of their waste into surface waters and/or on the ground. In addition, they all utilize practices that result in serious ground water pollution.
2. Paper Industry
a. Packaging Corporation of America
This industry has dumped approximately 3.5 billion gallons of paper mill waste into the local ground water aquifer.
3. Manistee County and Manistee City Road and Street Department
The use of chlorides for ice and dust control is resulting in some local increase of chlorides in the ground and surface waters.
4. Individual Homeowners Septic Systems
Many septic systems within the survey area are providing the ground water with nitrates.
It was the intent of this survey to identify the major sources of pollution and delineate qualitatively the areas that have been affected. This report attempts to provide perspective based on existing data. It is recommended that additional work be done to establish, with detail, ground water status and from this a total pollution abatement program be written and implemented. It is felt the people and the industries of this area will be willing to provide the support necessary to restore and maintain optimum ground water quality.
BIBLIOGRAPHY 1) The Lumberman’s Legacy. Manistee County Historical Society.
2) Geological Survey of Michigan 1873-1876 Apendix B Pages 172 through 199.
3) Geological Survey of Michigan - Volume 1885-1893 Pages 59 and 60.
4) Water supply and Irrigation paper U.S.G.S. No. 31 1899 pages 16, 17, 18 and 19.
5) Board of Geological Survey. Annual Report for 1901, Pages 235, 236, & 237.
6) Notes on the Geological Section of Michigan Annual Report for 1908 Pages 59, 60, 70, 71, 72, 73, 90, and 91.
7) Michigan Geological and Biological Survey. Publication 8, Geology 6 Michigan Resources of Michigan 1911, Pages 323, 324, 410.
8) Geological Survey of Michigan Oil and Gas in Michigan 1912, pages 196 thru 202
9) Michigan Geological and Biological Survey Brine and Salt deposits of Michigan 1913. Pages 83 through 92 and 145 through 151.
10) Mineral Resources of Michigan - Salt 1914, Pages 284, 285, & 286.
11) Non-metallic minerals of Michigan - Salt 1915
12). Mineral Resources of Michigan 1916, Pages 155, 156, 157, and 158.

13) Communication with Larry Carlson, Don Morgan and Paul Wright of the Morton Salt and Chemical Company.
14) Communication with Don Carmondy and A.L. Winfield of the Hardy Salt Company.
15) The files of the Water Resources Commission
16) Communication with Mr. George Rademaker, Main Street Onekama, Michigan Phone 889-4329.
17) Communication with Archer Houser and Ted Stenberg of the Standard Lime & Refractories Company
18) The Salt industry of Manistee 1879-1890. Author James K. Hansen property of Manistee County Historical Society.
19) Michigan Department of Public Health files-Logan Street-Lansing, Michigan.
20) Chemical analysis of Manistee area water samples. Attachment to this report.
21) Communication with Manistee County Highway Department Office Located at the intersection of U.S. 31 & 55.
22) Communication with Manistee City Officials.
23) Sample logs from the Manistee Area. Attachment to this report.
SKETCHES
[1. Typical schematic of Manistee salt well about 1900]
[2. Typical schematic of a contemporary Manistee fractured salt gallery]
[3. Typical schematic of Manistee chemical brine well]
K. E. Childs– Page 20 of 26
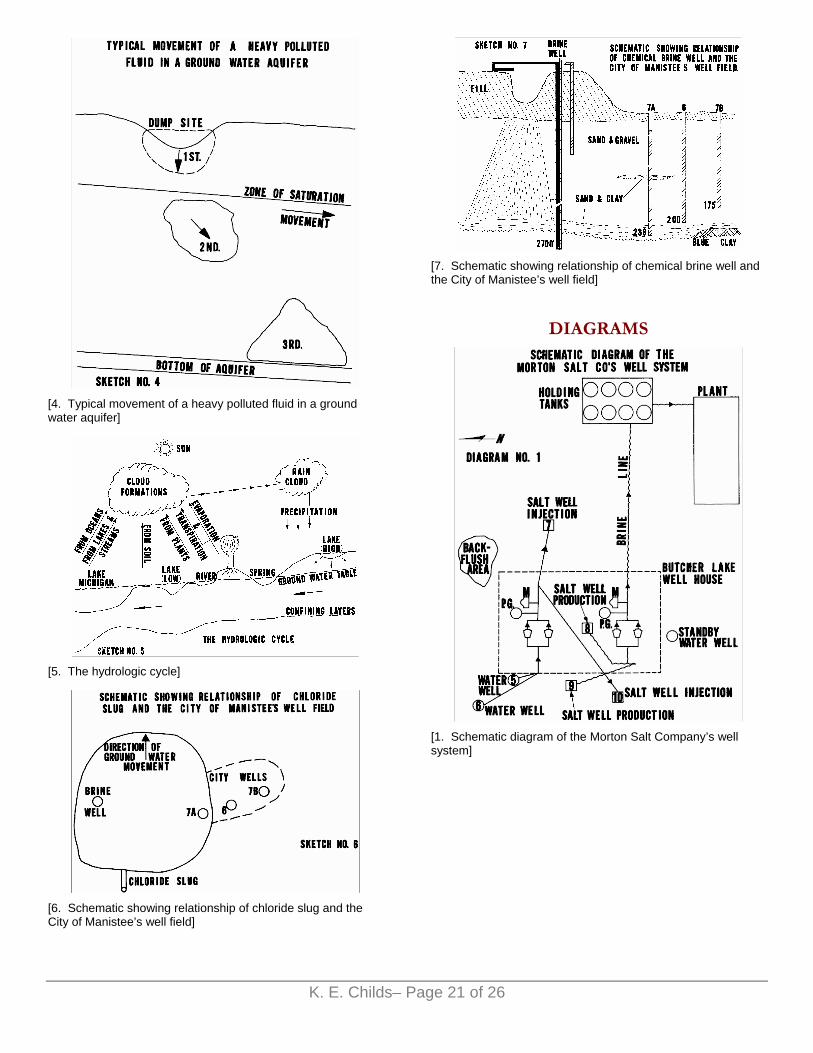
[4. Typical movement of a heavy polluted fluid in a ground water aquifer]
[5. The hydrologic cycle]
[6. Schematic showing relationship of chloride slug and the City of Manistee’s well field]
[7. Schematic showing relationship of chemical brine well and the City of Manistee’s well field]
DIAGRAMS
[1. Schematic diagram of the Morton Salt Company’s well system]
K. E. Childs– Page 21 of 26

[2. Schematic diagram of the Hardy Salt Company’s well system]
[3. Schematic diagram of the Morton Chemical Company’s well system]
[4. Schematic diagram of the Standard Lime and Refractories well system]
DATA SHEETS
[1. Ground water uncontaminated]
K. E. Childs– Page 22 of 26

[2. Salt well analysis]
[3. Brine well analysis--4c-5c-6c]
[4. Brine well analysis--3c]
[5. Water wells contaminated by salt]
[6. Water wells contaminated by salt]
[7. Water wells contaminated by salt]
K. E. Childs– Page 23 of 26

[8. Water wells contaminated by brine]
[9. Water wells contaminated by brine]
[10. Water wells contaminated by brine]
[11. Water wells contaminated by brine]
[12. Water wells contaminated by brine]
K. E. Childs– Page 24 of 26

[13. Contamination in city well 7A]
[14. Contamination in city well 7A]
[15. Contamination in city well 7A]
K. E. Childs– Page 25 of 26

CROSS SECTIONS
[1. Cross section from Grant Highway Mason County and north up Hill Street to Section 30, T 22 N, R 16 W]
[2. Cross section from Butcher Lake northeast to Manistee County dog pound in Section 16]
[3. Cross section from Spruce and 8th Street in Manistee east to Manistee Blacker Airport]
K. E. Childs– Page 26 of 26