history of weather observations - mrcc.illinois.edu · now, 144 years later, observations are still...
TRANSCRIPT

HISTORY OF WEATHER OBSERVATIONS INDIANAPOLIS, INDIANA
1861—1948
August 2005
Prepared By Glen Conner
9216 Holland Road Scottsville, Kentucky
This report was prepared for the Midwestern Regional Climate Center under the auspices of the Climate Database Modernization Program, NOAA's National Climatic Data Center, Asheville, North Carolina

ACKNOWLEDGEMENTS
There is a long list of people who contributed to the long record of climate in Indianapolis. The tireless and dedicated observers are the most important and most direct contributors. Hundreds of others must be recognized for preserving those records and for having a sense of their historical importance. To all those people, thanks.
To Dev Nygogi, the State Climatologist for Indiana, and his Assistant Ken Scheeringa,
special thanks for sharing their knowledge. Likewise, Mike Shartran of the National Weather Service Office in Indianapolis provided valuable assistance.
To those who will read this, thanks for continuing to be interested in the history of weather
observations
ii

CONTENTS
Acknowledgements ii List of Illustrations v Introduction 1 The Location 1 The Record 2 Goal of the Study 2 Location of Observations 4 Latitude, Longitude, and Elevation 5 Instrumentation 18 Instrument Shelter 18 Instruments 20 Thermometer 21 Barometer 22 Rain Gage 23 Triple Register 26 Wind Instruments 26 Sunshine Recorder 28 Rain Gage 29 Elevation of Instruments 29 The Observers The Smithsonian Observers 31 The Signal Service Observers 35 The Weather Bureau Observers 36 Meteorologists in Charge 38 The Observations 1861-1864 40 The Smithsonian Years 1864-1971 41 The Signal Service Years 1871-1892 42 The Weather Bureau and Weather Service Years Post 1892 45 Other Early Observations In Indiana Rapin Andrews 47 Dr. R. G. Gradon 47 Thomas B. Helm 47 Dr. Asahel Clapp 48 William Scudder 49
iii

Bibliography 50 Appendices Appendix 1, Precipitation in Indianapolis 1861-1930 53 Appendix 2, Rapin Andrews’ Maximum Temperature 1839-1874 54 Appendix 3, Dr. Asahel Clapp Weather Diary 55 Appendix 4, Elevations from 1931 56 Appendix 5, Survey Notes 1931 57 Appendix 6, Barometer Heights 58 Appendix 7, Methodology 59
iv

ILLUSTRATIONS Figures
1. Downtown Indianapolis Observation Stations 4 2. Dr. Butterfield’s Address 5 3. Old City Hospital 1865 6 4. Office Layout 1871 7 5. Roof Layout 1871 7 6. Saks Building 8 7. Office Layout 1881 9 8. Majestic Building 10 9. Consolidated Building 11 10. Roof Layout 1932 12 11. Federal Building 13 12. Office Layout 1939 14 13. Roof Layout 1944 15 14. Weir Cook Administration Building 16 15. Window Shelter Location 1871 18 16. Inside of Window Shelter 1871 19 17. Standard and Ornamental Shelters 20 18. Weather Bureau Office and Instruments 1926 21 19. Green Maximum and Minimum Thermometers 22 20. Mercury Barometers in Wall Case 23 21. Standard Rain Gage 24 22. Tipping Bucket Rain Gage 25 23. Weighing Rain Gage 25 24. Triple Register 26 25. Roof Layout 1881 27 26. Wind Vane and Anemometer 27 27. Miles Run Dial 28 28. Sunshine Recorder 29 29. Instrument Elevations 1871—1941 30 30. Royal Mayhew 31 31. First Observations from Indianapolis 1864 32 32. W. W. Butterfield 33 33. March Rainfall 1861—1864 40 34. First Leaf Fall Indianapolis 1867 42 35. Weather in Newspaper 1895 44 36. Excerpt from Inspection Report 1906 45 37. Weather Map from 31 March 1938 46
v
HISTORY OF WEATHER OBSERVATIONS Indianapolis, Indiana
1861—1948
Glen Conner Kentucky State Climatologist Emeritus
INTRODUCTION
The motivation for the earliest weather observations in Indianapolis is unknown. It seems certain to have been a scientific interest in meteorology. It may have been a natural curiosity about the environment or a desire to be part of the Smithsonian Institution’s climate network that served the public. Or, perhaps, it was to understand a recent severe weather event such as the one that the Indianapolis Sentinel reported that caused roosting chickens to freeze hanging upside down. They reported that on New Year’s Eve 1863, the temperature was about 50˚F and raining when the chickens flew up to roost in some orchard trees. On the following morning, New Year’s Day of 1864, the chickens were found, “upside down, hanging by their claws to the twigs, frozen hard and stiff.” During the previous twelve hours, the temperature had fallen seventy degrees to a morning low of twenty degrees below zero. It was reported that fifteen Confederate soldiers being held prisoner at Camp Morton froze to death that same night and twelve others were found frozen on a train that was delivering them to the Camp.
Royal Mayhew submitted his observations of the March 1864 weather in Indianapolis to the
Smithsonian Institution. Now, 144 years later, observations are still being made. The rich history of weather observations in Indianapolis is the subject of this paper.
The Location
The first settlers arrived at an area called the Old Northwest. It was the area north of the Ohio
River, south of the Great Lakes and east of the Mississippi River. From that Old Northwest, Ohio became a state in 1803. The Michigan Territory was formed in 1805 and the Indiana Territory in 1809. Indiana was admitted as a state in 1816,
Settlement of Indianapolis began in 1820 according to Dr. Daniel Drake, a prolific writer about
early climate and related diseases. The plain on which the city stands was heavily forested in that year. The trees in the spring of 1821 were “extensively cut down and immigrants crowded upon the spot until by midsummer, they numbered about six hundred.” The population grew until in 1860 it was the 48th largest city in the United States, with a population of 18,611.
Royal Mayhew described the area in his second weather report that he submitted in April 1864.
The country surrounding the Centre of the State is mostly of a flat formation, and Indianapolis lies in the most depressed portion, the ground rising almost imperceptibly as we proceed in any direction —
1

Blue River 26 miles S.E at Shelbyville, on rail road to Cincinnati, is 64 feet higher that this city — and this elevation is probably more than gained in the first 15 miles. This last fact I mention as it may account somewhat for the character of the clouds. We are not much subject to fogs at this place, probably not one tenth so much as on the borders of the Ohio River.
He made a comparison with his previous hometown of Shelbyville but references to
urbanization were notably missing. Eighty-five years later, the National Weather Service Office in Indianapolis described the area with a comparison to the airport. Their description was decidedly urban. It had become a city.
Indianapolis is mostly level or slightly rolling. The only hill of consequence is Crown Hill. The elevation above sea level is generally 700 to 800 feet. At the Federal Building the ground elevation is 718 feet. At the Airport the elevation is 793 feet. At West Tenth Street, the surface of White River is about 677 feet during low water. The northern sections of the City are somewhat higher than downtown, reaching 784 feet in Holliday Park. There is also a rise to the east, with an elevation of 791 feet in Brightwood and 824 feet in Irvington.
The Record
The first official observations in Indianapolis were forwarded to the Smithsonian Institution in 1864. However, the first observer had begun rainfall measurements in 1861 and his monthly totals exist from that time until for March 1865. The second observer recorded only temperature and there was a break in the precipitation data until September 1867 (See Appendix 1). The Smithsonian Institution network collected data until the new Signal Corps’ Weather Service began observations in Indianapolis on 4 February 1871. They continued until the Weather Bureau was transferred to the U. S. Department of Agriculture in 1891. They in turn were transferred to the National Weather Service under the Department of Commerce in 1947.
Goal of the Study
The goal of this study is to document the primary weather observational history in Indianapolis that was part of the path that led to the current National Weather Service’s observing program. Climatic data from stations in Indianapolis that made weather observations throughout the period of record are readily available from the National Climatic Data Center in Asheville, North Carolina; the Midwestern Regional Climate Center in Champaign, Illinois; and the State Climatologist of Indiana at Purdue University in Lafayette. The station’s history in recent years is well documented and also available through easily obtainable climatic records. The challenge of this study was to identify Indianapolis’ role in the development of the formal weather observational program and where it fit in the route from the Army surgeons, through the Smithsonian Observers, the Signal Service
2

Observer Sergeants, the Weather Bureau meteorologists, to the National Weather Service modern observational network of today. Therefore, the focus of this study was on the period before 1948, the generally accepted start of the modern era of the documentation of weather observations.
3

LOCATION OF OBSERVATIONS
1865
1938
1915
1881 1871
1896
Figure 1. Downtown Indianapolis Observation Stations
Source: Author, Plotted on 1870 Map by Luther R. Martin
4
Latitude, Longitude, and Elevation The first observations in January 1864 listed the location as 39˚ 55' N and 85˚ W at an
elevation of 698 feet above tide water, that is, above mean sea level (MSL). The observer lived on the west side of Michigan Road north of North Street in 1857. In the April 1864 report, he stated that the elevation was from the Owen Geological Report. The reference is to Richard Owen who became the State Geologist for Indiana in 1860. He subsequently became a professor at the University of Indiana.
In August, the observer revised the geographic grid to 39˚ 45' N and 86˚ 20' W. That location
was unchanged even when there was a change in observer in March 1865. The second location was at Number 382 Kant Street North (Figure 2) according to the report of
April 1865. The Weather Bureau Form 500-1 dated 23 March 1954 listed the address as 382 North East Street at the same latitude, longitude, and elevation.
Figure 2. Stationary Address of Dr. W. W. Butterfield as of April 1865. Source: National Climatic Data Center original record. With a change of observer in October 1867, the longitude was reported as not yet ascertained.
In November, the reported longitude was 86˚ 06' W and the latitude was changed to 39˚ 47' N. The elevation was 698 feet MSL. In December, the latitude was reported as 39˚ 71' N, an obvious error. That error was repeated until the observer change was made. The observations were being made at the medical office of the observer, Dr. W. J. Elstun.
Several outbreaks of smallpox prompted the city to buy land for a City Hospital. According to
Sulgrove, the land was not used as a hospital until the Civil War. The federal government used it to care for sick and wounded soldiers until 1 July 1865. After the War’s end, the City Hospital (now known as Wishard Memorial Hospital) served as “soldiers home” until April of the following year. It opened as City Hospital with 75 beds on 1 July 1866 caring for the poor. The first superintendent was Dr. G. V. Woolen. He began weather observations there on 1 January 1869. The observation site was at the office in the City Hospital (Figure 3) that was located at Locke and Margaret Streets.
5

Figure 3. Old City Hospital 1865 Source: Indiana Historical Society, C5747 The Weather Bureau, Form 500-1 of March 1954 referred to that location as the Indianapolis
Academy of Medicine1 from September 1867 through December 1868. The new location was listed as 39˚ 47' N and 87˚ 06' W. The elevation remained at 698 feet MSL but with a note that the observations were made at 15 feet above ground level (AGL). The next month saw a return to the erroneous latitude used by the previous observer and that would continue until February 1871 when it was changed to 39˚ 51' N.
Beginning on 4 February 1871, the Signal Service Office rented Room 31 of the Blackford’s
Block at number 1 Washington Street at the corner of Washington West and South Meridian Streets. The location was 39˚ 46' N and 86˚10' W. The office was located on the floor above the First National Bank and in the same building as the Western Union Telegraph Office. Although the office was convenient, it had occasional problems. In May 1876, an inspector wrote of the stove (#7 in Figure 4) “The smoke from the stove is evenly divided between the office and the chimney.” Considering that, the monthly rent of seven dollars may have been too high.
The observer actually lived at the office. A bed (a “lounge” identified as #8 in Figure 4) was
provided and the unmarried observer worked and lived in the same room. One suspects that there were few claims made of overtime work.
1 It was also known at the Indiana College of Medicine
6

Figure 4. Signal Service Office Layout in 1871 Source: National Archives and Records Administration
Figure 5. Roof Layout 1871 Source: National Archives and Records Administration
7

The Signal Service Office moved to the Fletcher and Sharp’s Block in rooms 52 and 72. This was later called Ingall’s Block and eventually became known as the Saks Building (Figure 6). It was located on the southeast corner of Washington and Pennsylvania Streets and was at 39˚ 46'N and 86˚ 10' W.
Instrument Shelter was mounted in
this window
Figure 6. Saks Building 1906 Source: Indiana Historical Society, C5747 The window shelter was mounted in a north-facing window overlooking East Washington
Street.
8

Now the office had a fireplace (F in the layout in Figure 7), steam heaters (H in the layout) a telephone (T in the layout), a vane indicator mounted on the ceiling in the middle of the room, and The anemometer and the vane were mounted on the roof. The window shelter was K in the layout.
Figure 7. Office Layout 1881 Source: National Archives and Records Administration The first move after the office had been incorporated into the Weather Bureau occurred on 1
September 1896. It placed the Weather Bureau Office observations in the twelve-story Majestic Building (Figure 8) on the northeast corner of Maryland and Pennsylvania Streets. That was at 39˚ 46' N and 86˚ 10' W at a reported elevation of 710 feet MSL. The office occupied rooms 905, 906, and 907 on the south side of the ninth floor.
By 1909 the office had expanded to include two additional rooms in that building.
9

Figure 8. Majestic Building, ca 1900 Source: Indiana Historical Society, C5747
10

On 1 July 1915 the Weather Bureau Office moved again, this time to the Lemcke Annex that
was later called the Consolidated Building (Figure 9) at 115 North Pennsylvania Street. There were no reported changes in its latitude or longitude. The elevation of the ground was 715 feet MSL. The office was on the 10th floor and occupied seven rooms.
Figure 9. Consolidated Building, 1928 Source: Indiana Historical Society, C5747
11

The roof was the location of the rain gages and the anemometer (Figure 10)
Figure 10. Roof Layout 1932 Source: NWS Forecast Office, Indianapolis
12

The Weather Bureau Office moved for a third time on 28 October 1938. This was to be its final move in the downtown area. Its new home was Room 502 of the Federal Building (Figure 11). That building occupied the block bounded by New York, Pennsylvania, Ohio, and Meridian streets.
Figure 11. Federal Building, 1939 Source: Indiana Historical Society, C5747 The Post Office was in the same building. The move was prompted by the lure of free rent.
Again, there was no reported change in its latitude or longitude but the ground elevation was 718 feet MSL. The instruments were on the roof directly above the office. The World War Memorial Plaza, about six blocks long, fills the area between Meridian and Pennsylvania Streets. The first block of that plaza is University Park. The Weather Bureau Office used that area for snow depth measurements for many years.
The office rooms were on the top floor—the 5th floor—of the Federal Building. The layout in
1939 was as shown in Figure 12.
13

Figure 12. Office Layout, 1939 Source: NWS Forecast Office, Indianapolis
14

Figure 13. Roof Layout, Federal Building, 1944 Source: NWS Forecast Office, Indianapolis The observations from the Federal Building downtown continued to be taken even after the
“official” observations had been moved to the airport. Most instruments were on the roof (Figure 13) according to the Weather Bureau Form 4055 dated 31 January 1944. The roof of the building was gravel over concrete. There were taller buildings to the southeast clockwise to the northwest. The barometer and some other instruments were in the Weather Bureau Office below.
Heat was imported from a commercial heating plant. The old furnace in the building was used
to burn waste. The building was connected as a new wing to the old U.S. Court House and Post Office
Building
15

A major change came on 1 January 1943. Observations at the Weir Cook Airport were designated as the official ones for Indianapolis. Continual observations had begun there back on 1 April 1931. On 1 May 1941, the Weather Bureau Office at the airport moved to the Roscoe Turner Aeronautical Building (Figure 14). That is where the official observations at the airport began. Note the instrument shelter on the roof of the building. The location was 39˚ 44' N and 86˚ 16' W.
Instrument Shelter
Anemometer
Figure 14. Weir Cook, Municipal Airport, 1945 Source: Indiana Historical Society, C5747 The Weather Office downtown was closed in June 1954. Temperature and the Standard Rain
Gage observations were moved to the roof of the Power and Light Company Building effective on 1 October 1954. On the same day, the weighing rain gage was moved to the Indianapolis Water Works Pumping Station. All observational activities ended on 30 September 1954 and all State Climatological and other activities were thereafter consolidated with the Weir Cook Airport Office.
On 14 June 1965, the Weather Bureau Office was moved into Building #1 at the Weir Cook
Airport. The new location was reported to be at 39˚ 44' N and 86˚ 17' W.
16

On 19 June 1970, internal restructuring within the National Weather Service changed the
Indianapolis office to a Weather Service Forecast Office. On 23 July 1976, the Weir Cook Airport name was changed to the Indianapolis International
Airport. On 28 September 1977, the National Weather Service office was relocated to the
Administration Building at the Indianapolis International Airport (39˚ 44' N and 86˚16' W). This area is now part of the main terminal ticketing area.
On 24 August 1993, the National Weather Service office in Indianapolis moved to its new
office on 6900 West Hanna Avenue. On 1 January 1996, manual observations were replaced with an Automated Surface
Observations Station (ASOS).
17

INSTRUMENTATION Instrumentation was limited prior to September 1867. First were precipitation measurements
only, then temperature only. After 1867, a full complement of instruments provided data for each of the columns on the Smithsonian Institution form. Few instrumentation details are known prior to the time the Signal Service began observations in 1871.
Instrument Shelter
From 4 February 1871 to 30 April 1881, a window shelter mounted in a north-facing window was used. The instruments were in a Smithsonian Plan Window Shelter that housed the Glaisher’s hygrometer, Mason’s Hygrometer and the exposed thermometers (Figure 15).
Wet Bulb Glaisher’s
Hygrometer
Exposed Thermometer
Mason’s Hygrometer
Dry Bulb Glaisher’s
Hygrometer
Figure 15. Position of Window Shelter Instruments 1871 Source: National Archives and Records Administration
18

The shelter was 4’ 6” high, 3’ 5” wide, and 1’ 9” deep. The roof of the shelter sloped 9 inches. The instruments were attached to a traverse board mounted to keep them 10 inches from the window and 2 feet from the roof (Figure 16).
Figure 16. Location of Instruments inside the Window Instrument Shelter, 1871 Source: National Archives and Records Administration The first inspection of the station in 1871, recommended that the shelter be moved from the
westernmost window to the easternmost window on the north side of the office. The inspector stated that the relocation would add six weeks to the annual period that the shelter would be in the building’s shadow. The shelter had been moved to the easternmost window before the inspection was made in December 1873.
On 30 April 1881, the instruments were moved to the Saks Building. A window shelter was
still used and was mounted on the north side of the office (Figure 6). The shelter was in need of painting in a November 1887 report.
Two shelters (Figure 17) were in common use by the Weather Bureau. A standard shelter was in use on 2 September 1896 on the Majestic Building roof. Its interior was described as 3.2 feet long,
19

2.7 feet wide, 2.6 feet high, and 10 feet about the roof. The shelter in use in 1944 was an ornamental top wood shelter and erected on a 5 foot steel support mounted on a platform on the roof at the center of the roof. Platforms were constructed on the roof for the shelter and the rain gages.
Ornamental Shelter
Standard Shelter
Figure 17. Standard and Ornamental Instrument Shelters Source: National Archives and Records Administration Photograph Collection At the Weir Cook Airport, the instrument shelter was mounted on the roof of the
Administration Building until 20 October 1937. Afterward, it was mounted on the ground.
Instruments
The Weather Bureau Office was a place that received many visitors to see the instruments that were used to measure weather elements. The variety and appearance of them surely impressed the visitors. A collection of instruments would be posed on a table for the visitor to see. One photograph (Figure 18) of such a pose was published in the Washington Daily News on 13 August 1926. It shows many of the instruments in use at that time.
20

Maximum and
Minimum Thermometer
Anemometer Cups
Sling Psychrometer
Aneroid Barometer
Whirling Psychrometer
Wind Miles Run
Dial
Sunshine Recorder
Thermograph
Barograph
Figure 18. Weather Bureau Instruments 1926 Source: National Archives and Records Administration Photograph Collection
Thermometer The Casual Phenomena comments made for April 1864 included one about the thermometer.
The thermometer was said to have been examined yearly using pounded ice and it was found to read the proper 32˚ just as it had two years before.
The thermometer was stolen on 13 October 1867 and had not been replaced before a new
observer began on 1 September 1867. The new observer noted that the reports were made using Smithsonian Instruments made by James Green. The instruments were placed, as directed in the instructions, on the north side of a frame building about eight feet above the ground. The observer noted that there was a change in the attached thermometer.
Thermometers made by H. H. Green (Figure 19) were in common use. The Green Maximum
Thermometer had a small constriction just above the bulb that broke the column of mercury as it
21

contracted from cooling. The column remained at its highest point until it was forced through the constriction by spinning the thermometer. The Green Minimum Thermometer had alcohol instead of mercury. Within the column of alcohol was a glass index. As the column shrank with cooling, it dragged the index downward with it. When the temperature rose, the alcohol flowed around the index leaving it at its lowest point. It was reset each day by tilting the thermometer downward toward its top, until the index slid to the top of the column.
Figure 19. Green Maximum and Minimum Thermometers on a Townsend Mount Source: National Archives and Records Administration Photography Collection On 4 February 1871, the thermometer was in a window shelter 47 feet above ground level
(AGL).
In March 1884, it was discovered that the window sash was not fitting properly and that allowed heat from the office to enter the window shelter. The previous temperature readings may have been too high. The thermometer was moved to the roof 75 feet AGL on 9 January 1885, about 129 feet AGL. On 1 September 1896 they were located at 154 feet AGL on the roof of the Majestic Building.
In March 1886, an inspector questioned the mounting of the minimum thermometer. He
thought that it may not have been tilted enough and that the readings may have been incorrect.
Barometer The barometer on 4 February 1871 was at 760.8 feet MSL. On 30 April 1881, it was at 765.6
feet MSL. On 1 July 1896, it was at 822.7 feet MSL. It was at 829.8 feet MSL on 1 July 1915, 829.8 feet MSL on 1 January 1936, and at 793.9 feet MSL on 28 October 1938. In 1944, it was mounted on the north wall of Room 503. The inspection in 1971 found it to read just 0.0041 inch lower that the inspector’s barometer.
The first barometer was found to have an air bubble and was replaced in December 1873. A
note in May 1876 listed the barometer as number 1837. In February 1881, barometer number 1837
22
had a crack in the cistern and was replaced by number 209. In November 1881, the barometer elevation was listed as 753.295 feet MSL.
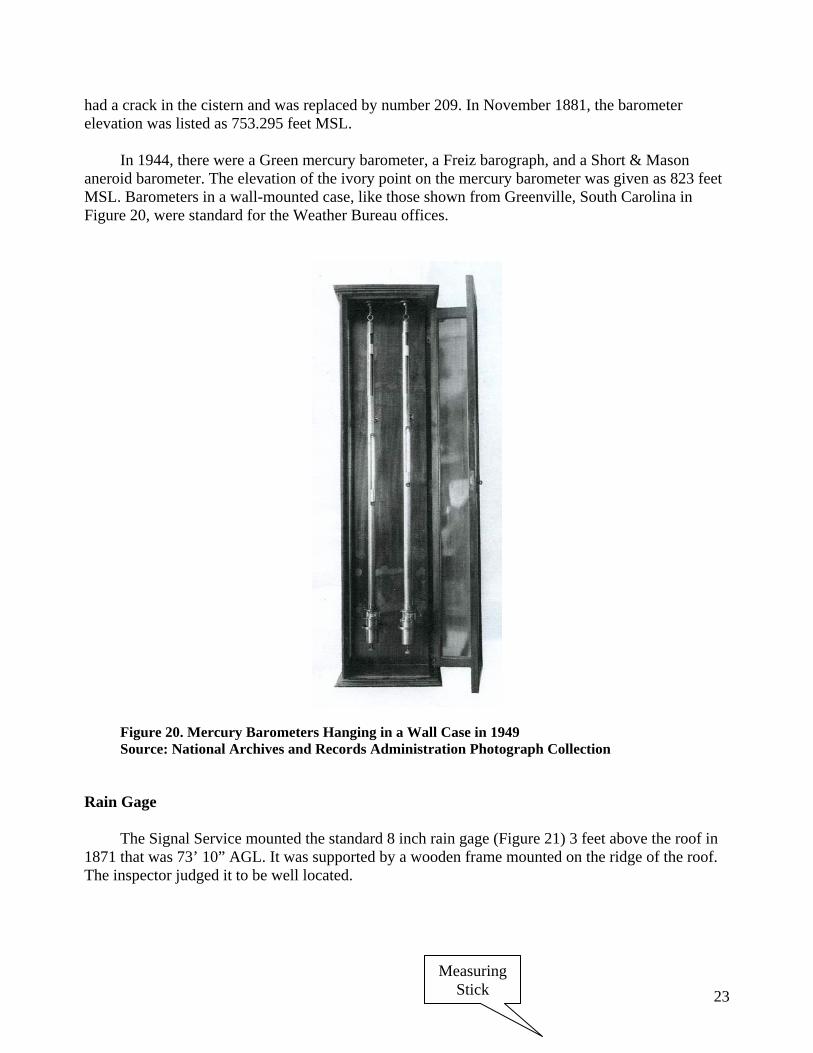
In 1944, there were a Green mercury barometer, a Freiz barograph, and a Short & Mason
aneroid barometer. The elevation of the ivory point on the mercury barometer was given as 823 feet MSL. Barometers in a wall-mounted case, like those shown from Greenville, South Carolina in Figure 20, were standard for the Weather Bureau offices.
Figure 20. Mercury Barometers Hanging in a Wall Case in 1949 Source: National Archives and Records Administration Photograph Collection
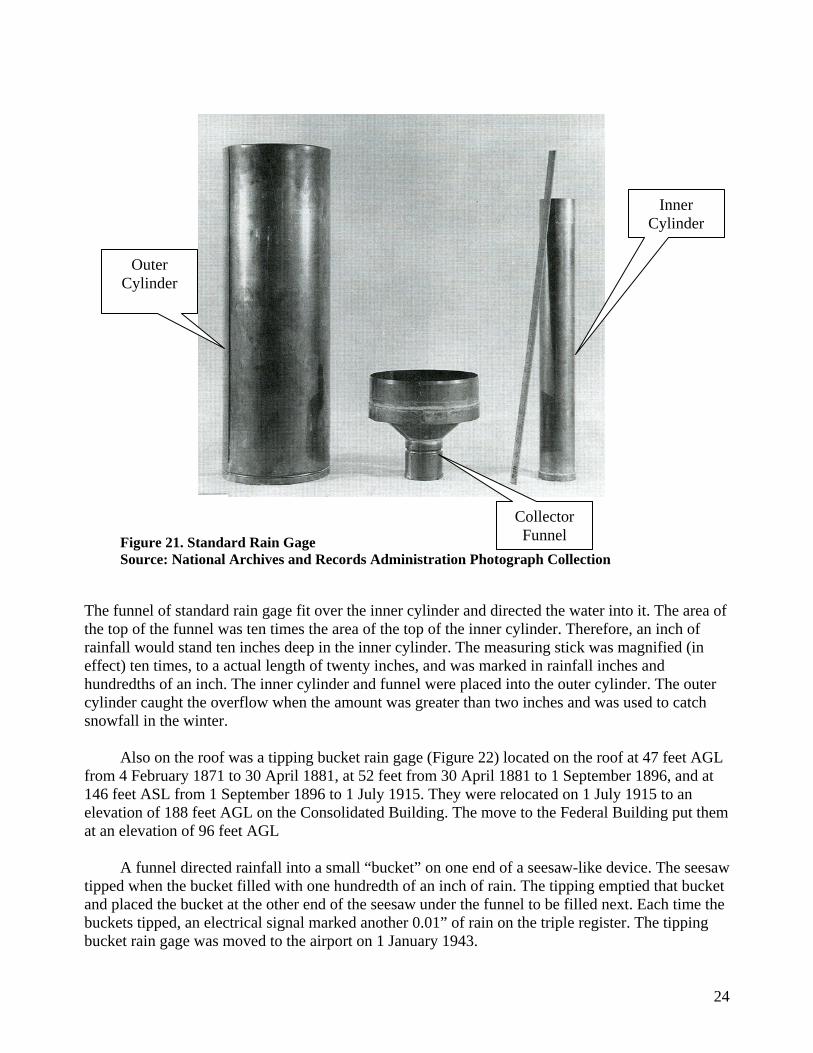
Rain Gage The Signal Service mounted the standard 8 inch rain gage (Figure 21) 3 feet above the roof in
1871 that was 73’ 10” AGL. It was supported by a wooden frame mounted on the ridge of the roof. The inspector judged it to be well located.
23Measuring
Stick
Inner Cylinder
Outer Cylinder
Figure 21. Standard Rain Gage Source: National Archives and Records Administration Photograph Collection
Collector Funnel
The funnel of standard rain gage fit over the inner cylinder and directed the water into it. The area of the top of the funnel was ten times the area of the top of the inner cylinder. Therefore, an inch of rainfall would stand ten inches deep in the inner cylinder. The measuring stick was magnified (in effect) ten times, to a actual length of twenty inches, and was marked in rainfall inches and hundredths of an inch. The inner cylinder and funnel were placed into the outer cylinder. The outer cylinder caught the overflow when the amount was greater than two inches and was used to catch snowfall in the winter.
Also on the roof was a tipping bucket rain gage (Figure 22) located on the roof at 47 feet AGL from 4 February 1871 to 30 April 1881, at 52 feet from 30 April 1881 to 1 September 1896, and at 146 feet ASL from 1 September 1896 to 1 July 1915. They were relocated on 1 July 1915 to an elevation of 188 feet AGL on the Consolidated Building. The move to the Federal Building put them at an elevation of 96 feet AGL
A funnel directed rainfall into a small “bucket” on one end of a seesaw-like device. The seesaw
tipped when the bucket filled with one hundredth of an inch of rain. The tipping emptied that bucket and placed the bucket at the other end of the seesaw under the funnel to be filled next. Each time the buckets tipped, an electrical signal marked another 0.01” of rain on the triple register. The tipping bucket rain gage was moved to the airport on 1 January 1943.
24

The Tipping Bucket
Figure 22. Tipping Bucket Rain Gage Source: National Archives and Records Administration Photograph Collection A weighing rain gage (Figure 23) was added on 23 February 1943
Figure 23. Weighing Rain Gage Source: National Archives and Records Administration Photograph Collection In January 1944, the rain gages were mounted on a 6 X 8 feet platform near the center of the
roof. It was reported that the catch was practically the same as that at the former location.
Triple Register
25
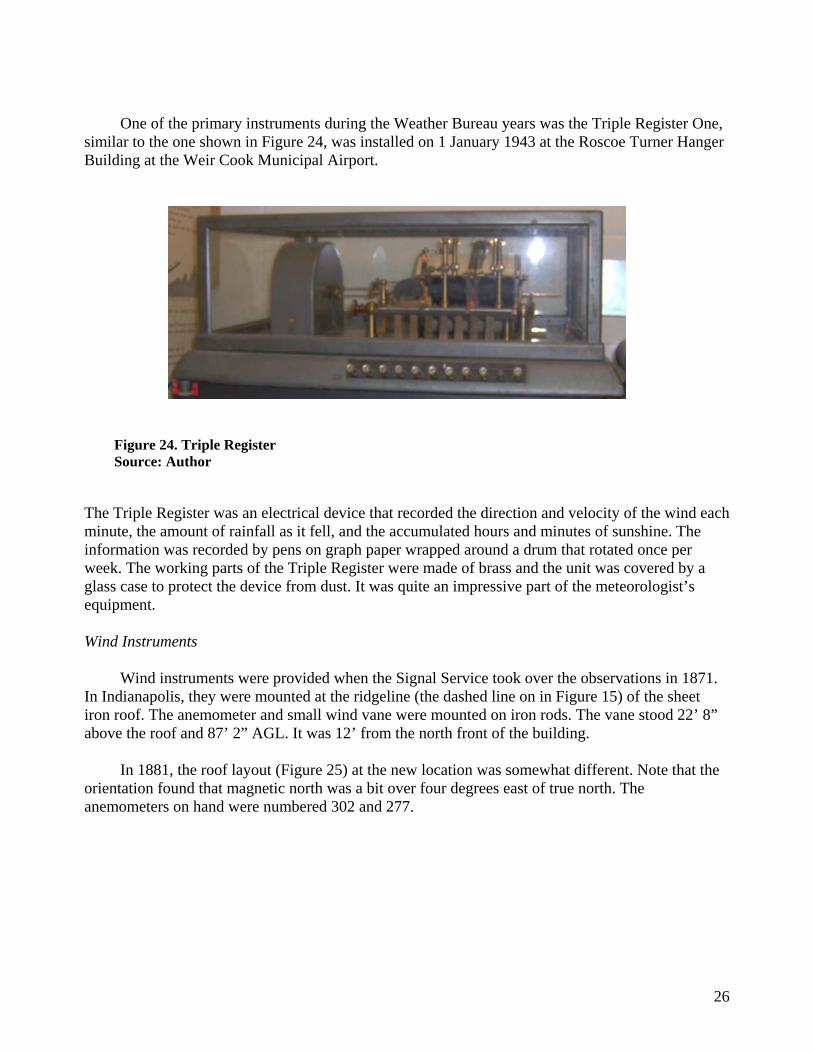
One of the primary instruments during the Weather Bureau years was the Triple Register One,
similar to the one shown in Figure 24, was installed on 1 January 1943 at the Roscoe Turner Hanger Building at the Weir Cook Municipal Airport.
Figure 24. Triple Register Source: Author
The Triple Register was an electrical device that recorded the direction and velocity of the wind each minute, the amount of rainfall as it fell, and the accumulated hours and minutes of sunshine. The information was recorded by pens on graph paper wrapped around a drum that rotated once per week. The working parts of the Triple Register were made of brass and the unit was covered by a glass case to protect the device from dust. It was quite an impressive part of the meteorologist’s equipment.
Wind Instruments
Wind instruments were provided when the Signal Service took over the observations in 1871.
In Indianapolis, they were mounted at the ridgeline (the dashed line on in Figure 15) of the sheet iron roof. The anemometer and small wind vane were mounted on iron rods. The vane stood 22’ 8” above the roof and 87’ 2” AGL. It was 12’ from the north front of the building.
In 1881, the roof layout (Figure 25) at the new location was somewhat different. Note that the
orientation found that magnetic north was a bit over four degrees east of true north. The anemometers on hand were numbered 302 and 277.
26

Figure 25. Roof Layout 1881 Source: National Archives and Records Administration Wind was measured in two ways. A wind vane that was mounted on the roof determined the
wind direction. It swiveled toward the direction from which the wind came. It may have looked like the one in Figure 26.
Vane
Anemometer Cups
Miles Run Dial
Tower
Figure 26. Wind Vane and Anemometer Source: National Archives and Records Administration Photograph Collection
27

Also mounted on the roof were the anemometer cups. The wind rotated those cups that in turn rotated the shaft to which they were attached. Each time the shaft rotated 500 times, one mile was added and displayed on the miles run dial. That is to say, the dial displayed the total number of miles of air that had passed since the miles run dial (Figure 27) was reset.
Figure 27. Miles Run Dial Source: Author Both the wind direction and the wind speed were electrically connected to the triple register
were they were registered on the Triple Register’s graph. The difference between the miles run dial and its earlier reading could be divided by the elapsed hours to determine the average wind speed for the period.
The anemometer was mounted on a 26 foot tower in 1941 making it 54 feet above ground level. It was in the symmetrical center of the east penthouse. A velocity and four light wind direction indicator were mounted on an instrument stand. However, data from it were not collected because of the inadequate exposure and because better data were collected at the airport site.
Sunshine Recorder
The triple register also recorded sunshine. The sensor was a glass tube with a large bulb at either end (Figure 28). It was normally located on the roof. One end was clear, the other coated with lampblack. The tube was partially filled with mercury. In the middle of the tube were two wires. When exposed to sunshine, the lampblack would absorb solar radiation causing the mercury to expand and cover the ends of the two wires. The electrical circuit between the two wires would be completed. That connection would be recorded on the triple register until cooling (as the sunshine ended) caused the mercury to contract and uncover the two wire ends thus breaking the connection.
28

Figure 28. Sunshine Recorder Used with Triple Register Source: Author
Rain Gage
The triple register also recorded rainfall. A tipping bucket rain gage was connected to it. Each time the buckets tipped, an electrical signal marked another 0.01” of rain on the triple register’s graph.
Elevation of Instruments The elevations of instruments were of concern. In the earliest days, the ability to ascertain the
elevation was limited. The Coast and Geodetic Survey eliminated that difficulty when their survey was completed.
Elevation of the ground surface, the ivory point of the barometer, the rain gages, and
anemometer were determined using the nearest and best available surveyed point. The summarized data for elevations for the downtown and airport locations are shown in
Figure 29. That summary was attached to a station history prepared in 1949. It appears to be an accurate account of the changes.
29

Figure 29. Instrument Elevations 1871—1941 Source: NWS Forecast Office, Indianapolis Additional information is contained in Appendix 4, Elevations from 1931; Appendix 5, Survey
Notes from 1931; and Appendix 6, Barometer Heights,
30

THE OBSERVERS
Throughout the history of weather observations in Indianapolis, the observers stand out as consistently being exceptionally qualified, dedicated, and reliable people. A weather instrument is only as good as the observer using it. In Indianapolis, the observers were very good indeed.
The Smithsonian Observers
Congress created the Smithsonian Institution in 1846 to increase and diffuse knowledge. It
would eventually supplant the existing U.S. Army as the primary collector of climate data. The U.S. Army’s Office of the Surgeon General had established the first climate network at its Army Posts beginning in 1818. One of the primary interests of the Army was to search for cause and effect relationships between climate and disease. The Smithsonian’s focus was for a dense network like that proposed by Thomas Jefferson in 1797 that would have placed observation equipment in each Virginia County. The Smithsonian Network under the leadership of Joseph Henry grew rapidly. In two years, it had over 150 observers providing monthly report containing daily data. By 1860, there were over 500 stations reporting. It grew rapidly because Henry obtained a list of people who were already observing weather from Professor James H. Coffin at Lafayette College in Pennsylvania. He had been collecting weather reports from a large number of those observers. The Smithsonian sent circulars to those on Professor Coffin’s list to solicit them to become members for their new network. As an observer of weather, it seems likely that Royal Mayhew would have known about those invitations. In any case, he submitted reports to the Smithsonian.
Royal Mayhew 1864
Royal Mayhew (Figure 30) was the first “official” observer in Indianapolis.
Figure 30. Royal Mayhew. Indianapolis Observer 1864—1865 Source: By Permission of the Indiana State Library Royal Mayhew was born in Penobscot County, Maine 18 January 1805 and moved with his
family to Shelby County, Indiana in 1819. He later became Justice of the Peace and practiced law there. He moved to Indianapolis in 1844 after he was elected to be the State Treasurer. He served on
31

the City Common Council of Indianapolis from 1848 to 1849. The 1850 U.S. Census listed him as an Attorney there. He was a member of Governor’s Wright’s Board of Agriculture that was organized in 1851. From 1858 to 1860, he was the Marion County Surveyor. He was said by the Indiana Historical Bulletin to have owned valuable property on the southeast side of circle on Circle Street and owned West Mills in Indianapolis.
Mayhew entered his earliest extant daily observations in January 1864 on a form that he drew
(Figure 31). The form was submitted to the Smithsonian Institution.
Figure 31. First Observations from Indianapolis, January 1864 Source: Original Record, National Climatic Data Center Mayhew’s last observations were on 28 February 1865. He died a week and a half later on 11
March 1865. He was buried in the Crown Hill Cemetery in Indianapolis.
32

William Webster Butterfield 1864—1866
W. W. Butterfield (Figure 32) was the second Smithsonian observer in Indianapolis. Both he and Mayhew submitted reports beginning in October 1864 but Butterfield reported only temperature.
Figure 32. W. W. Butterfield, Source: Ruth Lilly Medical Library, Indiana University School of Medicine The June 1865 submission contained a hand drawn graph of temperature data. The image is so
faded that it is not readable. Nevertheless, its existence is evidence that Butterfield’s interest in weather went beyond the observations themselves to an analysis of them.
The 1870 U.S. Census listed him as a 25 years old Physician with his wife Zula B. age 24.
Zula B. Butterfield 1866—1865 Zula B. Butterfield was the wife of W. W. Butterfield. She signed the February 1866 report as
“Mrs. W. W. Butterfield, M.A. and W. W. Butterfield, M.D.” They lived at 413 East Street in the 1880 Census.
William J. Elstun 1867
William J. Elstun was a Physician whose first observations were in September 1867. In the Casual Phenomena part of that report, he stated. “This series of observations is made under the charge of the Indianapolis Academy of Medicine and should be so credited.” He signed it, “W. J. Elstun, Meteorological Committee for the Indianapolis Acad. Of Med.” His last observation was in February 1869 but he apparently stayed in Indianapolis. The 1880 Census listed him as a 40 years old Physician living at number 11 North Meridian. He was a member of the Board of Health from 1848 to 1849. The 1954 Station History Form 500-1 misspelled his name as Elsterne.
33

Greenly V. Woolen, 1869 Greenly V. Woolen was a 19 years old medical student living in the village of Lawrence in
Marion County in the 1860 Census. He was an Assistant Surgeon with the 27th Indiana Infantry during the Civil War. On 1 July 1866, he was appointed Superintendent of the City Hospital in Indianapolis. He served in that capacity for four years. He lived in the Hospital for some time but the 1870 U.S. Census had him living at 20 West Ohio in Indianapolis. He was listed in the 1874-1875 College of Physicians and Surgeons of Indiana faculty as a lecturer on Minor Surgery.
In 1869, he was the observer for the Smithsonian Institution. His observations were made at
the office in the City Hospital. In August 1869, his student, Evan Hadley, began making the entries.
Evan Hadley 1869-1870
Evan Hadley was a 25 years old Physician in Charge living at 205 City Hospital in 1870. His first observations were made in September 1869 while he was still a medical student working with Dr. Woolen. Both of their names were on the observation form. The two were part of the Indianapolis Academy of Medicine that submitted a Meteorological Report for the quarter ending March 1871 that was attached to the May 1871 Smithsonian Form. The Indiana Medical College existed from 1869 through 1878. In July 1870, he signed as E. Hadley, M.D. and had a student, Robert D. Craighead making the entries. Dr. Hadley was the Superintendent of the City Hospital from 1870 to 1871.
Dr. Hadley lived at 187 Virginia Street in 1880 and at 512 North Delaware in 1900.
Robert D. Craighead, 1870 Robert D. Craighead submitted the reports with Dr. Hadley until March 1871. He apparently
had completed his degree because in April he added the M.D. after his name. He was listed as a 23 years old Assistant Physician in Charge living at 205 City Hospital in the 1870 Census. In the 1880 he lived at in Spiceland Township in Henry County. Evan Hadley 1871
The March 1871 report was submitted by Dr. Hadley alone. He continued the observations
until his last submission of the October 1871 data. At that time, the Smithsonian Institution Observers were replaced by the newly formed Signal Service.
The Signal Service Observers
Congressman Halbert E. Paine from Wisconsin adopted the idea of Professor Increase A.
Lapham of Milwaukee for a national service to collect and distribute weather information. He gained the support of Colonel Albert J. Myer, Chief of the Signal Service and introduced a resolution that required the Secretary of War to “to provide for taking meteorological observations at the military
34

stations in the interior of the continent and at other points in the States and Territories…and for giving notice on the northern (Great) lakes and on the seacoast by magnetic telegraph and marine signals, of the approach and force of storms.” The resolution passed and President Ulysses S. Grant signed it into law on February 9, 1870. Because of the Signal Corps’ telegraph network, the new function was given to it and the head of than unit, the newly promoted Brevet Brigadier General Albert J. Myer. The weather network of twenty-four stations telegraphically transmitted their first reports at 7:35 a.m. on November 1, 1870 to the central office in Washington. That was the network that would evolve into the Weather Bureau and the National Weather Service. The Observer Sergeants were the essence of that network. Sgt Charles F. R. Wappenhans 1871-1879
Sgt Charles F. R. Wappenhans opened the first Signal Service Office in Indianapolis and it became operational on 4 February 1870. The first paper copies of the observational record date from December 1871. He worked alone for almost a year, living in the office.
By August 1872, he had been provided Pvt. H.E. Schneider as an assistant. The work hours
were still long. Wappenhans worked from 7 a.m. to 6 p.m. and alternated with the assistant from 6 p.m. to midnight. The assistant worked from 6 a.m. to 6 p.m. and alternated with Wappenhans from 6 p.m. to midnight.
He became ill and was temporarily replaced by Pvt Schneider during that period of illness and
eventually was permanently replaced by Sgt Lloyd. Sgt Wappenhans2 would return as a civilian a few years later.
Pvt. H. E. Schneider
Pvt. H. E. Schneider had been Sgt Wappenhans’ assistant for several years when he was temporarily placed in charge of the station. Sgt Edward Lloyd 1879-1880
Sgt Edward Lloyd was assigned as the Official in Charge on 20 January 1879 with Pvt Schneider remaining as his assistant. Sgt Otto Schutze 1880-1883
Sgt Otto Schutze was made Official in Charge on 21 September 1880. Sgt Charles F. R. Wappenhanx 1883-1891
2 The Annual Meteorological Summary for Indianapolis in 1940 listed Wappenhans as the Official in Charge from 1871 to 1901 but that was not continuous.
35

Sgt Charles F. R. Wappenhans returned to Indianapolis as Official in Charge on 20 February 1883. This time he had two assistants, Pvt Henry R. Patrick and Pvt Richard H. Sullivan. Sgt Wappenhans had been educated at the Polytechnic School of Berlin. He was highly regarded by the local citizens. An Inspector wrote in December 1889 that he was a “gentleman and a scholar.” He also wrote, “He could be elected May of Indianapolis if he wanted to be.”
In an Inspector’s Report of April 1891, his age was listed as 57 and it was noted that he was
one of the oldest men in the service. The Inspector added that the Chairman of the Meteorological Committee of Indianapolis spoke highly of him and of his contributions to the city. The Inspector also noted that the messenger assigned to the office was Jules R. Frederick, a 39 years old civilian, had been one of the 25 member Greely Arctic Expedition. That expedition broke a 300 years old record for reaching the farthest north point toward the North Pole. It is best remembered for the eight months wait for rescue during which time all but seven men died.3
The Weather Bureau Observers Not everyone shared the Observer Sergeants’ enthusiasm for the weather mission. The famous
Civil War General William Tecumseh Sherman was one of those detractors. According to Goodwin’s study, he thought that the Observer Sergeants were different that other soldiers.
…. No more soldiers than the men of the Smithsonian Institute. They are making scientific observations of the weather, of great interest to navigators and the country at large. But what does a soldier care about the weather? Whether good or bad, he must take it as it comes.
It isn’t surprising that the Army’s responsibility for weather observations was transferred. On 1
October 1890, Congress passed an act that transferred the weather service from the Army’s Signal Service to the new Weather Bureau that was created within the Department of Agriculture.
According to NOAA history, the new law prescribed that:
… the enlisted force of the Signal Service, excepting those hereinafter provided for, shall be honorably discharged from the Army on June 30, 1891, and such portion of this entire force, including civilian employees of the Weather Bureau shall, if they so elect be transferred to the Department of Agriculture…
Mr. Charles F. R. Wappenhans 1892-1901
Charles F. R. Wappenshans was one of those Observer Sergeants who became chose to continue their work as a civilian employee. Just as he was the first Signal Service Official in Charge in Indianapolis, he became the first Weather Bureau Official in Charge there too. According to the City Directory 1889, he lived at 52 Ingalls Block in Indianapolis.
3 Their story is told in Ghosts of Cape Sabine: The Harrowing True Story of the Greely Expedition written by Leonard F. Guttridge.
36

He continued to be very active with the community until he retired in 1901.
Richard H. Sullivan 1901
Richard H. Sullivan was the Official in Charge from for the month of August 1901. William T. Blythe 1901-1909
William T. Blythe replaced Sullivan on 1 September 1901 and served until 1909. Like Wappenhans, he had retired from the Signal Service where he was a telegraph operator by trade. He had once attended a business college but was described as having limited educational qualifications. He did have experience in Climate and Crop work.
Three observers, one printer, and one messenger were his office staff in 1906. That staff was
busy and in May 1906 was printing and distributing of 647 forecast maps, 183 forecast cards locally, and 1.467 forecast cards for other places in the State. Three years later the climate network that he supervised grew to 58 cooperative observers.
The first female employee of the Weather Bureau in Indianapolis was Laura M. Dey who
began work in 1909 as a messenger. She continued to work in that capacity until 1915. Blythe had been described by an Inspector in October 1901 as being a “man of imposing
appearance.” An Inspector in 1909 described him as quite heavy and slow.
Alfred H. Thiessen 1909
Alfred H. Thiessen was the Official in Charge from 28 August 1909 until 6 September 1909 during an absence of Blythe.
William T. Blythe
Blythe resumed the duties on 6 September 1909 for two weeks until replaced.
Verne H. Church 1909-1914
Verne H. Church was the Official in Charge of the Indianapolis office from 20 September
1909 to 3 July 1914. Blythe continued to work there as a forecaster. Church was the pro bono secretary of the Building and Loan Association.
Clinton E. Norquest 1914
37

Clinton E. Norquest became the Official in Charge on 3 July 1914 and served for just over two months until the new Official in Charge arrived. Norquest had been an observer in the station for about three years. He had attended Wabash College in Indiana for two years. John H. Arrington 1914-1943 John H. Arrington assumed the duties of Official in Charge on 8 September 1914. Norquest remained as his assistant. By 1918, he had a staff consisting of two assistants, a half-time assistant, an apprentice observer, a printer, and a messenger.
Arrington did course work at Valparaiso University and had been a principal at two different Indiana high schools for about eleven years before joining the Weather Bureau. R. M. Williamson 1943-1947
R. M. Williamson was in charge from 1943 to 1947. G. DeMots 1947
G. DeMots served in May 1947 as a substitute. G. F. Brewster 1947
G. F. Brewster served in June 1947 as a substitute. Meteorologists in Charge at Indianapolis After 1947
From the observation forms and later the Climatological Data document, the Weather Bureau and Weather Service Officials in Charge at Indianapolis appear to have been:
1947-1950 John J. Davis (Acting) 1950-1954 W. A. Bertrand The trail becomes murky after Bertrand because the Climatological Data documents were
signed by someone other that the Official in Charge (the Climatologist for the Weather Records Processing Center in Kansas City for example in October 1954 and Lawrence A. Schaal the State Climatologist for Indiana in February 1958).
John T. Curran became the MIC on 1 May 1978 and served until 3 January 2002. According to
him, his predecessor for about ten years was Glen Sackse whose predecessor was Escal Bennett.
38

THE OBSERVATIONS
1861—1864
The first observations were submitted on a hand drawn form. It was submitted in March but the data were from January 1864. There were notes on that observation form that was submitted to the Smithsonian Institution. For example, Royal Mayhew noted that the data in the rain column included melted snow and he explained the way other data were to be interpreted. Those notes were not the type that would be on any form other than the first report.
0 0_Figures placed thus 20 14 etc, will be understood as below zero - 20 deg F The letters f – fair c – cloudy, r rain, s snow, v variable I have stated the weather as fair– high fleecy clouds may be abundant – when there are no indications of rain etc. Variable – when indications of rain alternate with clear sky. Cloudy – when the sky is entirely obscured.
There were the usual remarks on the form that amplified the data in the expected way. He noted that the temperature was below zero for thirty-seven consecutive hours, from 10 p.m. on 31 December until noon on 2 January.
The March 1964 form had the total precipitation for the month of March in 1861 through 1864
(Figure 33). That indicated that Mayhew had been observing the weather for sometime prior to his submissions to the Smithsonian Institution.
Figure 33. March Rainfall 1861—1864 Source: Original Record, National Climatic Data Center The hand drawn form was used until April 1864 when he began using the Smithsonian
Institution Form. The open air temperature, cloud types and directions of movement, and wind
39

direction and force observations were taken at 7 a.m., 2 p.m., and 9 p.m. The precipitation total was recorded for each precipitation day with its beginning and ending times.
In May, he added a column for temperature at sunrise. He noted that he kept that reading
because it was about the coolest of the 24 hours. He also entered remarks about the weather in tiny script above the precipitation entries.
Temperature observations for October 1864 were made by W. W. Butterfield but he did not
make entries in the other columns. Some of his observations were published weekly in the Indianapolis Daily Journal, 5 January
1864 for example.
The Smithsonian Years 1864—1871 The Smithsonian Institution’s instructions for completing the Casual Phenomena section on the
back of the observation form required that the temperature of well water was to be measured at least once per year. In April 1864, Mayhew found that temperature to be 49.5˚F at a depth of 26 feet in a well 1 ¼ miles northwest of the center of the City and the same temperature at another well near the center. Both places were the same temperature as was measured two years earlier. Because well water temperature generally mimics the mean annual temperature, it is interesting that it was somewhat cooler than the City’s current normal mean annual temperature of 52.5˚F.
Mayhew, like many Smithsonian observers made extensive comments of the back of the
observation form. Most were related to the local weather observations, but not all. For example, on 26 August 1864, he reported that a “a violent hurricane or tornado raised the two rear cars of passenger train off the railroad track…” It struck in Dearborn County, Indiana about 75 miles southeast of Indianapolis. The words “violent hurricane” was the official Smithsonian term for wind speeds of 100 miles per hour or greater, rather than being a reference to a tropical storm.
The observations submitted by Dr. W. W. Butterfield and his Wife Zula in 1865 through
September 1867 contained only temperatures. Those stopped on 13 July 1867 when she reported that her thermometer was stolen. In October, she still had not received a replacement. She continued to send reports through December 1867 with comments but with no temperature or other data.
When Dr. Elstun began observations in September 1867, he was making entries in all the
columns of the Smithsonian Form (48 entries each day) and making comments on the back of the form too. In October, he made reported on the first frost and then included a phenological report (Figure 34) that the Smithsonian had once required.
40

Figure 34. The First Leaf Fall in Indianapolis, 1867 Source: National Climatic Data Center In November 1867, Dr. Elstun filled the page with climatological summaries for the month.
Subsequent months had similar summaries. The observations at the City Hospital continued in both the quantity of observations and in the
lengthy summation each month. As if the 48 entries per day were not enough, Dr. Woolen in March 1869 added another column, the “Oscillation of Temperature between 7 a.m. and 2 p.m. He continued the lengthy monthly summaries initiated by Dr. Elstun.
The Signal Service Years 1871—1892
The Signal Service took over the weather observation role from the Smithsonian Institution in 1870 with twenty-four reporting stations. Indianapolis was one of those stations. By 1878, the total number of Signal Service reporting locations had increased to seventy-eight nationwide. Three times each day (usually 7:35 a.m., 4:35 p.m., and 11:35 p.m.), each station telegraphed their observations to Washington, D.C. Those observations consisted of:
Barometric pressure and its change since the last report. Temperature and its 24-hour change. Relative humidity. Wind velocity. Pressure of the wind in pounds per square foot.
Sgt. C. F. R. Wappenhans, who opened the first Signal Service Office in Indianapolis, sent the first observations by telegraph on 10 February 1870.
41

By May of 1876, Wappenhans was also providing daily weather information to the Sentinel,
the German Telegraph, and the Daily Journal. There is a reference in Goodwin’s study to a “school of instruction” located at Fort Whipple
(later renamed Fort Myer) in Virginia. General Myer, Chief Signal Officer after the Civil War created that weather school in 1870. The school trained observers in both weather observation and in telegraphy. The simultaneous transmission of weather observations from the observers to Fort Whipple permitted the evolution of daily weather maps.
The Observer Sergeants as they were called, were required to improve themselves and were
liable at any time after one year’s service to be called before a board for their second regular examination. To facilitate the study toward that end, the office was provided with Guyot’s Meteorological Tables, Buchan’s Handy-book of Meteorology, Loomis Treatise on Meteorology, Manual of Signals, and Observations.
In the 1874 version of that Annual Report, it was noted that the equipment included two
standard barometers, two standard thermometers, one standard maximum thermometer, one standard minimum thermometer, one standard hygrometer, one standard anemometer, one self register for the anemometer, one standard rain gauge, and one standard wind vane. According to Grice, The Report of the Chief Signal Officer in 1877-1878 described the duties of the enlisted men at the weather offices manned by Signal Service personnel:
… they are required to take, put in cipher, and furnish, to be telegraphed tri-daily on each day, at different fixed times, the results of observations made at those times, and embracing, in each case, the readings of the barometer, the thermometer, the wind velocity and direction, the rain-gauge, the relative humidity, the character, quantity and movement of upper and lower clouds, and the condition of the weather. These observations are taken at such hours, at the different stations, as to provide the three simultaneous observations, taken daily at three fixed moments of physical time (7:35 a.m., 4:35 p.m., and 11 p.m. Washington mean time) throughout the whole extent of the territory of the United States… Three other observations to be taken at the local times, 7 a.m., 2 p.m., and 9 p.m., are also taken and recorded at each station. A seventh and especial observation is taken and recorded at noon on each day. If at this observation such instrumental changes are noted as to cause anxiety, the fact is to be telegraphed to the central office at Washington. An eighth observation is required to be taken at the exact hour of sunset at each location. This observation, embracing the appearance of the western sky, the direction of the wind, the amount of cloudiness, the readings of the barometer, thermometer, and hydrometer, and amount of rainfall since last preceding report, is reported with the midnight report…
From the beginning of the Signal Service’s presence in Indianapolis, they provided weather information to the newspapers. They were supplying information to three of the City’s paper in 1876: Sentinel, the Daily Journal, and the German Telegraph. Most of the early submissions were
42

printed without attribution to the Observer Sergeant who was the author. In 1895, they were providing information to those and two others as well; the Sun and the News. They included the Official in Charge’s name in those releases as seen in the clipping from 27 October 1895 issue of the German language paper The Telegraph (Figure 35).
Figure 35. Weather Printed in the Telegraph, Indianapolis, October 1895 Source: National Archives
Indianapolis weather observations since 1871 consisted of daily readings of maximum and
minimum temperatures, humidity, wind speed and direction, precipitation, atmospheric pressure and descriptions of weather conditions. The Snowfall and snow depth readings began in March of 1884.4
Henry Augustus Huston was Professor of Physics and Electricity at Purdue University
beginning in 1883. He later served as Professor of Agricultural Chemistry and head of the Indiana Weather Service that was formed in August 1888. The Weather Bureau and Weather Service Years Post 1892
The quantity of products was staggering, even in the early days of the station under the Weather Bureau. There were the crop bulletins, the information provided to the railroads, the rainfall data to the Indiana Farmer, the updates to the large map in the Board of Trade, and the releases to
4 The first block of the World War Memorial Plaza, known as University Park, was for many
years the official area for the Weather Bureau to measure snow depth.
43

the newspapers. The telephone service with its convenience for making requests was expanding. The use of daily forecasts was increasing too, as seen in this accounting from an inspection report in 1906 (Figure 36).
Figure 36. Excerpt from Inspection Report, May 1906 Source: National Archives and Records Administration
The number of telephones in the State was of particular interest and clearly the potential number of requests from that new technology was a matter of concern.
The products of the Weather Bureau improved in both quality and variety. Some of the most popular were the Daily Weather Maps. The station plots were displayed in the same manner as Cleveland Abbe had used in his first published Signal Service maps in 1871. The printing process was described by in the Washington D.C. section of the 1871 Annual Report.
An ordinary “proof press” is used, with a bed plate, in which square holes are made, coinciding with the stations on the map, in which are placed the symbol type to designate the weather and direction of the wind. The arrows for showing the direction of the wind are diagonal on some of the type and cross-wise on the rest, making them available for pointing in eight different directions, and fitting so closely in the holes as to prevent their pulling out by the ink-roller.
The addition of isotherms and isobars made the maps more interesting and more useful. The
base map, like that of 1938 shown in Figure 37, was used for many years.
44

Figure 37. Weather Bureau Daily Weather Map 31 March 1938 Source: National Archives and Records Administration
The current National Weather Service was formed under the Department of Commerce and replaced the Weather Bureau that had existed under the Department of Agriculture for decades. That move reflected the alteration of primary national focus of the weather agencies from agricultural to aviation. The move of the office from the City to the airport was another indication of that change in emphasis. Forecasts that addressed safety became a high priority and technologies developed to improve that capability. Automated observations, weather radar, weather satellites, computer weather models, and many other advances were made during the “modern” period. All those changes increased our understanding of weather and its influences and impacts on society.
One thing has not changed over the 144 years since Royal Mayhew began recording the
weather. The motivations of the individuals who collect, analyze, and distribute weather data and information is the same as that of the original observers. That scientific curiosity and the desire to provide an important service to the public remains—and will remain for the next 144 years.
45

OTHER EARLY OBSERVERS IN INDIANA
Several individuals made observations but were not part of an organized climate network. Some of these are included here to call attention to their potential value for climatological research. Rapin Andrews
The State Library in Indianapolis has several diaries that contain climate data. The most important one is the typewritten transcript of the Weather Diary of Rapin Andrews. The diary begins in January1837 in Corham, Ontario County, NY. He moved to Perry Township in Allen County, Indiana in July 1839. The weather diary was continued until April 1874 (by family members after his death). The information recorded was three times per day temperatures, once per day wind direction, and remarks about sky condition, precipitation events, etc. The transcript was prepared in 1934 from the original manuscript under the supervision of B. B. Whittier who was the National Weather Service’s Meteorologist in Charge at Fort Wayne. The original was held a family member, Mrs J. G. Garman, 543 Nuttman Avenue, Fort Wayne. These data were considered accurate according to a note written by Whittier at that time.
Nothing is known of the instrument used or of its exposure; but as the records obtained agree closely with conditions known to prevail in this region, there is no reason to doubt the reasonable accuracy of the figures. Neither are the hours at which the readings were taken known; but it appears that they must agree quite closely with the morning, noon, and evening meals. A notation on the July 1848 record strongly indicates the one reading as of 12 o’clock noon.”
An example of the dataset is at Appendix 2. The collection is identified in the Manuscript
Section at the Indiana State Library as “Per-Andrews, Rapin, L 4, 1837-1874, 1 ms box”
Dr. R. G. Gradon
The Indiana State Library holds the weather diaries of Dr. R. G. Gradon of Southport, Indiana. He made temperature entries at 7 a.m., 2 p.m., and 9 p.m. for the years, 1855-1863, 1863-1866, 1866-1868, 1868-1871, 1871-1880, 1881-1890, and 1890-1898. He made remarks about wind direction, sky condition, or precipitation events. The collection of his diaries is original and fragile, but readable. The collection is identified as “Per-Gradon, Dr. R.G., 1855-1892, S 536, 1 ms box.”
Thomas B. Helm
The Indiana State Library holds the weather diaries of Thomas B. Helm of Logansport, in Cass County, Indiana. These are annual diaries that cover the period from 1862-1888. His entries were in narrative form but contain temperatures for 7 a.m., 2. p.m., and 9 p.m., and commentary about the general weather conditions.
For example, consider this example from Tuesday, 13 October 1864.
46

“Heavy frost-dense fog this morning. Some ice. At 7 a.m. cum 4 W 2 Mer 32˚ wind W 1. Air cool and bracing- Prospect of pleasant day – fog passing off – the sun shone out briefly today. Air very cool. At 2 p.m., cum 2 W 2 Mer 57˚ wnd W 2. A few clouds were visible this afternoon some wind astir –air cold and raw yet pleasant overhead. Toward evening clouds - passed off. Clear tonight numerous stats shine bright. At 9 p.m. clear mer 38˚wind W 1 air cold.”
That entry was typical of the type information available from this diary. After his weather entries, there were sometime comments about other things, the results of a County election in this case.
The collection is identified in the Manuscript Section at the Indiana State Library as “Per-Helm, Thomas B. 1862-1888, L 66, 1 ms box” Dr. Asahel Clapp
Another weather diary in the Indiana State Library is the Dr. Asahel Clapp diaries. He recorded comments about temperature and precipitation from 1819 through 1862 at New Albany, Indiana. His diary contains reports of his medical practice but he often gives detailed observations of the weather. For example 1 January 1823, he wrote:
It has rained moderately nearly all day; two or three inches of snow and hail fell last night. The rain has not melted all the snow, but makes it wet and disagreeable walking. Thermometer 34; barometer 29.30. The barometer stood above 30 the 30th of December, but had not risen higher than 29.87 for four or five weeks before, or fallen below 29.20. The months of November and December have been uncommonly rainy. The Ohio River was higher the first week of December than it has been for five years. There was another high fresh about the 20th though it did not rise so high as the other fresh by seven or eight feet. At 7 a.m. on the third of December, when the river was at nearly its greatest height, the thermometer stood 2 degrees below zero. It was also very cold some days of the last fresh the thermometer stood at 10 degrees. The river has not been known to be so high in December for many years - perhaps not so high in that month since the country has been settled.
After 1833, his weather reports were separated from his other activities. See Appendix 3.
William Scudder
The William Scudder diaries are from 1856 to 1868 and are held by the Indianapolis Historical
Society Library, SC2228, Scudder was born 20 January 1832 in Cincinnati. He moved to Indianapolis. He was a teacher in Wayne Township, Indianapolis. Book I was written in 1857 in Indianapolis at Center Lodge # 23. It contains daily comments about the sky condition, temperature,
47

or precipitation but does not contain actual measurements. Book II was written in Indianapolis and Cincinnati. It says that 1868 had “the hottest summer in 40 years.” The 1856-1858 diary also has verbal descriptions of daily weather but very abbreviated comments.
48

BIBLIOGRAPHY Archeological and Historical Survey of the IUPUI Campus http://www.iupui.edu/~anthpm/survey.htmlLast visited 14 July 2005 Army Meteorological Register for Twelve Years, from 1843-1854 Inclusive. 1855. A.O.P Nicholson,
Public Printer. Washington 1855 Atlas Reprinted from Map of Marion County, Indiana. Knightstown, Indiana Barnhart, John, 1854. Indian from Frontier to Industrial Commonwealth. 4 Vol. Indiana Historical
Bureau, Indianapolis Bodenhamer, David J. and Robert G Barrows, 1994. The Encyclopedia of Indianapolis. Indiana
University Press, Indianapolis Indiana Bonsett, C. A., 1983. Medical Museum Notes: Indianapolis City Hospital. Journal of Indiana State
Medical Association 1983 Oct: 76 (10): 657 Brown, Ignatius, 1857. Historical Sketch of Indianapolis. Indianapolis Historical Society, A. C.
Howard, Indianapolis Brown, Ralph H.,1940. The First Century of Meteorological Data in America. Monthly Weather
Review, vol. 68, No. 5. 131 Buley, R. Carlyle, 1950. The Old Northwest: Pioneer Period 1815—1840, Vol. 1. Indiana Historical
Society, Indianapolis, Indiana Chief Signal Officer, 1872. Annual Report of the Chief Signal Officer to the Secretary of War for
the Year 1871. Department of War, Government Printing Office, Washington Drake, Daniel, 1850. A Systemic Treatise, Historical, Etiological and Practical Diseases of the
Interior Valley of North America.. W. B. Smith & Company, New York Dunn, Jacob P., 1912. Memorial Record of Distinguished Men of Indianapolis and Indiana. Lewis
Publishing Company, Chicago Ellsworth, Henry W., 1838. Valley of the Upper Wabash, Indiana. New York ESSA. January 1970. Centennial of the U.S. Weather Service. U.S. Department of Commerce,
Environmental Science Services Administration. Washington, D. C. Goodspeed Brothers, 1893. Pictorial and Biographical Memoirs of the Old Northwest. Goodspeed
Brothers Publishers, Chicago
49

Grooms, A. C. and W. T. Smith, 1855. Indianapolis Directory, City Guide, and Business Mirror: Or Indianapolis as it was in 1855. A. C. Grooms & W. T. Smith, Indianapolis
Guide to the National Archives of the United States. 1974 Supt. Of Docs. No: GS 4.6/2N21. U.S.
Government Printing Office. 565 Hall & Hutchinson, 1865. The Indianapolis City Directory for 1865. Hall & Hutchinson Printers and
Binders, Indianapolis Holloway, William Robeson, 1870. Indianapolis. A Historical And Statistical Sketch Of The
Railroad City, A Chronicle Of Its Social, Municipal, Commercial And Manufacturing Progress, With Full Statistical Tables. Indianapolis Journal Print, Indianapolis
Howard, A. C., 1857. Directory for the City of Indianapolis. A. C. Howard Publisher, Indianapolis
Indiana Hughes, Patrick A., 1970. Century of Weather Service, A History of the Birth and Growth of the
National Weather Service 1870-1970. Gordon and Breach, Science Publishers, Inc., New York.
Indiana History Bulletin, Vol 51 # 3, march 1974, p 38, Indiana Historical Bureau, Indianapolis
News 4 Feb 1877, Roosting Chickens Froze Upside Down by Wayne Guthrie
IUPUI University Library http://in-ulib-brayton.ads.iu.edu/climatedata/print/articles.htmlLast visited on 19 July 2005 McDonell, Katherine M., 1983. The Indianapolis City Hospital 1833—186l. Indiana Medical
History Quarterly, 1983 Jun: 9 (2): 3-23 Myers, Burton D, 1956. The History of Medical Education in Indiana. Indiana University Press,
Bloomington Indiana National Weather Service Forecast Office http://www.crh.noaa.gov/ind/office_history.phpLast visited 19 July 2005 National Weather Service, 1949. Station History. Three page manuscript chronology of the
Indianapolis from 1871 to 1949 with four attachments. Held by the National Weather Service Forecast Office in Indianapolis
Notes by the Editor. 1895. Monthly Weather Review. 457 Nowland, John, 1870. Early Reminiscences of Indianapolis 1820—1876. Sentinel Book and Job
Printing House, Indianapolis
50

Purdue University and the Indianapolis Board of Trade, and the United States Signal Service, 1887. The Indiana Signal Service. February 1887 through July 1896
Rives, Frank 1998. Joseph Henry, Father of the Weather Service. The Joseph Henry Papers Project,
History Division, Smithsonian Institution Ruth Lilly Medical Library Biography of Butterworth http://www.medlib.iupui.edu/hom/butterwo.html#biographical Smithsonian Institution Annual Report. 1848 Mis. No. 48. Smithsonian Institution Archives,
Washington, D.C. Sulgrove, Berry R., 1884. History of Indianapolis and Marion County Indiana. L.H. Everts &
Company, Philadelphia Visher, Stephen S., 1944. Climate of Indiana. Indiana University Publications, Science Series No.
13, Bloomingon, Indiana Whitnah, Donald R. 1961. A History of the United States Weather Bureau. University of Illinois
Press, Urbana Illinois Wishard, William Niles, 1966. The Genesis of Marion County General Hospital and Its Training
School for Nurses. Indiana State Medical Association, V. 59, No. 3, Mar 1966
51

APPENDIX 1
Precipitation in Indianapolis 1861-1930
Source: State Climatologist for Indiana
52

APPENDIX 2
Rapin Andrew’s Maximum Temperatures Perry Township, Allen County, Indiana
1839—1874 JAN FEB MAR APR MAY JUN JUL AUG SEP OCT NOV DEC YEAR 1839 96 89 87 83 50 41 96 1840 46 62 70 80 87 88 93 88 78 75 68 46 93 1841 47 49 79 81 90 92 93 94 91 76 67 55 94 1842 60 59 82 84 85 87 94 87 90 77 73 45 94 1843 63 43 49 79 88 90 93 93 89 71 55 52 93 1844 45 51 72 87 85 93 90 91 85 72 70 53 93 1845 52 65 78 86 87 92 96 92 87 70 60 46 96 1846 55 46 66 87 89 92 102 100 89 81 65 58 102 1847 58 50 65 79 89 88 94 86 84 77 72 60 94 1848 55 50 74 76 86 89 89 91 83 71 50 57 91 1849 52 66 65 74 80 93 92 89 84 69 72 46 93 1850 1851 1852 46 53 66 65 83 90 94 90 84 80 81 54 94 1853 56 52 73 79 83 95 92 96 87 67 69 50 96 1854 50 53 68 78 87 92 96 96 96 73 58 48 96 1855 62 47 55 86 89 91 93 88 89 70 67 54 93 1856 34 47 51 81 89 98 98 90 88 81 61 48 98 1857 40 65 57 70 84 91 92 92 87 72 63 53 92 1858 55 54 66 78 81 98 92 95 88 82 58 52 98 1859 46 56 66 77 89 91 100 91 81 76 71 62 100 1860 52 60 68 80 91 92 92 92 84 72 60 45 92 1861 43 64 68 76 81 88 91 93 84 74 58 63 93 1862 44 48 59 84 90 91 90 86 80 68 58 91 1863 1864 62 51 60 59 84 92 92 93 80 63 66 55 93 1865 38 45 68 72 80 89 94 86 86 73 62 51 94 1866 50 54 58 75 82 92 95 82 82 73 52 46 95 1867 42 54 50 70 70 88 92 87 86 75 63 55 92 1868 38 45 68 71 81 87 95 83 79 70 60 40 95 1869 52 62 65 74 80 86 91 88 85 71 62 42 91 1870 45 46 52 78 84 95 94 90 87 72 68 52 95 1871 58 60 66 80 89 90 93 92 85 79 54 52 93 1872 42 50 56 84 84 92 94 90 86 80 53 38 94 1873 49 49 57 78 82 94 91 88 83 73 50 55 94 1874 60 50 64 66 Source: Indiana State Library
53
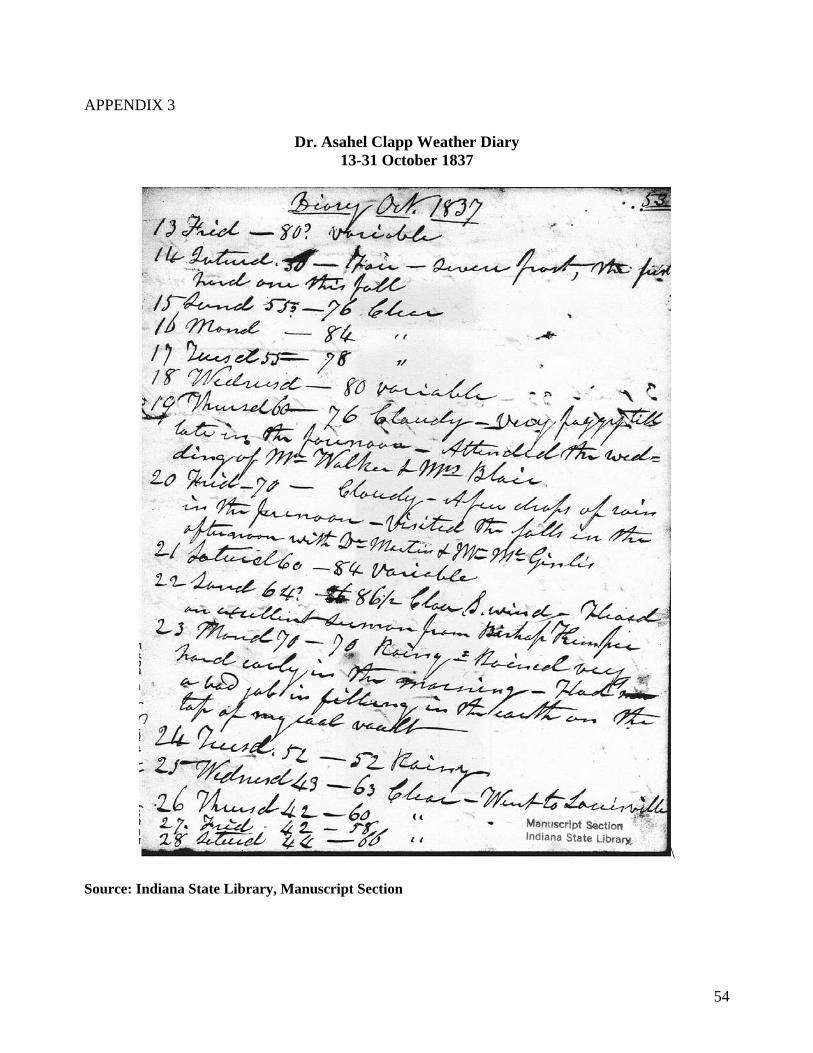
APPENDIX 3
Dr. Asahel Clapp Weather Diary 13-31 October 1837
\
Source: Indiana State Library, Manuscript Section
54

APPENDIX 4
Elevations 1931
Source: National Weather Service Forecast Office, Indianapolis
55

APPENDIX 5
Survey Notes 1931
Source: National Weather Service Forecast Office, Indianapolis
56

APPENDIX 6
Barometer Heights
Source: National Weather Service Forecast Office, Indianapolis
57

APPENDIX 7
METHODOLOGY
The primary sources of information for this study were the Indianapolis and Marion County observers’ daily weather records themselves. Copies of their monthly reports and the data digitized from those reports were available from the Midwestern Regional Climate Center in Champaign, Illinois, or the National Climatic Data Center in Asheville, North Carolina. The monthly reports can be considered original sources because they were written by the observers and not altered by subsequent readers.
There were a variety of secondary sources that held information about Indianapolis, its
history, and its people. The author visited and collected information from the holdings of the National Climatic Data Center at Asheville, North Carolina; the Indianapolis Public Library, the Indiana Historical Society Library, and Indiana State Library in Indianapolis; the Smithsonian Institution Archives in Washington, D.C.; the National Archives and Records Administration in College Park, Maryland; and the State Climatologist for Indiana at Purdue University in Lafayette. The State Climatologist for Indiana, Dev Niyogi and his Assistant Ken Scheeringa shared their knowledge. The National Weather Service Office in Indianapolis and especially Mike Shartran, were most helpful too and provided several of the materials used in this study.
The tertiary sources were reference materials that are available on-line. Among those were
the metadata and station histories prepared by the Office of the State Climatologist of Indiana, Midwestern Regional Climate Center, and National Climatic Data Center. Two genealogical research sources, Ancestry.com and Genealogy.com were used to provide some of the personal information about the observers. For location analysis, the interactive maps available from TopoZone.com were used.
There was an attempt to glean information from all these sources that would allow a
glimpse into the lives of the observers, the location of the observation site, and the historical environment that produced the climatic history of Indianapolis. Maps, drawings, and photographs were included when appropriate to illustrate the information.
Throughout the research for and preparation of this study, the objective was to produce a
document that future studies can use to evaluate the validity of the data that were collected here, judge the trustworthiness of the observers who collected them, and determine the climatological significance of the whatever variability may be discerned.
58