hitachi data systems partner day
TRANSCRIPT

Hitachi Data Systems Partner Day Thursday 9th July 2009

Michael VäthSenior Vice President & General Manager EMEA

Agenda - morning

Agenda - lunch
– Marquee:• Zycko• Bell• Quantum• Cisco • Brocade
– Sefton Room:• HDS Finance Offerings• HDS HITOA• HDS Training• PR Consultation• Marketing Consultation
• BBQ lunch• “Passport” system:
- visit all sponsors and get stamped for your chance to win an Xbox
• Ingram sponsored Wii competition
– win a pocket surfer!
• Bell sponsored golf tournament – in support of charity Clic Sargent
– win a bottle of champagne!
• HDS Playstation “Stig” competition
- Win a Wii console!

Agenda - afternoon

Giving our UK partners more opportunity!Philippe Fosse - EMEA Channels Director

FY08 highlights
FY08 Channel (Indirect +Sun) :102% of goal and 12% Y/Y growthFY08 Channel (Indirect +Sun) :102% of goal and 12% Y/Y growth
FY 08 Americas Channel 105%EMEA Channel 104% APAC Channel 96%
FY 08 Americas Channel 105%EMEA Channel 104% APAC Channel 96%
•7
Growth: Americas 17%EMEA 10% APAC 8%
Growth: Americas 17%EMEA 10% APAC 8%
Enhanced Hitachi TrueNorth Channel Partner Program Launched GloballyEnhanced Hitachi TrueNorth Channel Partner Program Launched Globally
Programs, programs, programs…Programs, programs, programs…
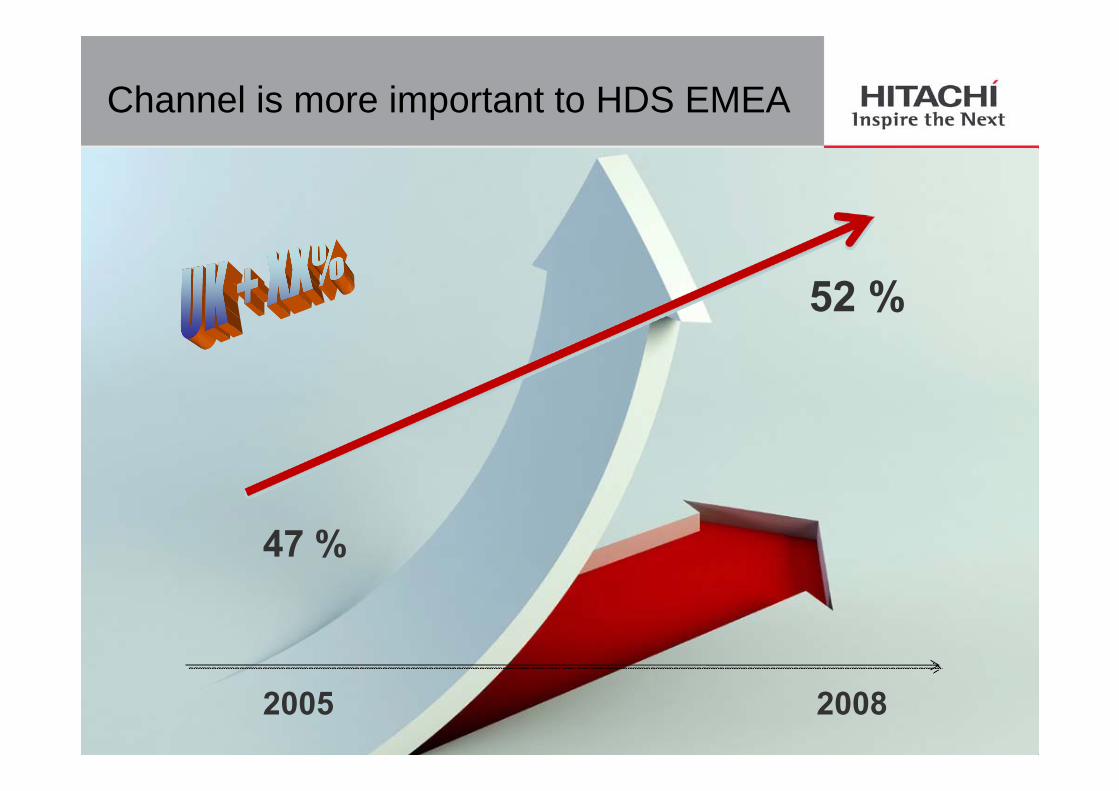
Channel is more important to HDS EMEA
2005
47 %
2008
52 %

2009 – The Year to Prevail!
1. Grow Market Share through Channel Partners Expand our footprint / portfolio Improve our partnerships Drive growth in software and services
2. Deliver Global Best in Class Solutions Design, develop and deliver additional
application solutions Extend alliances with ISV’s Position and sell based on ROI/ROA, and
TCO
3. Improve Operational Efficiency Deliver enhanced IT solutions Be even easier to do business with!
•9
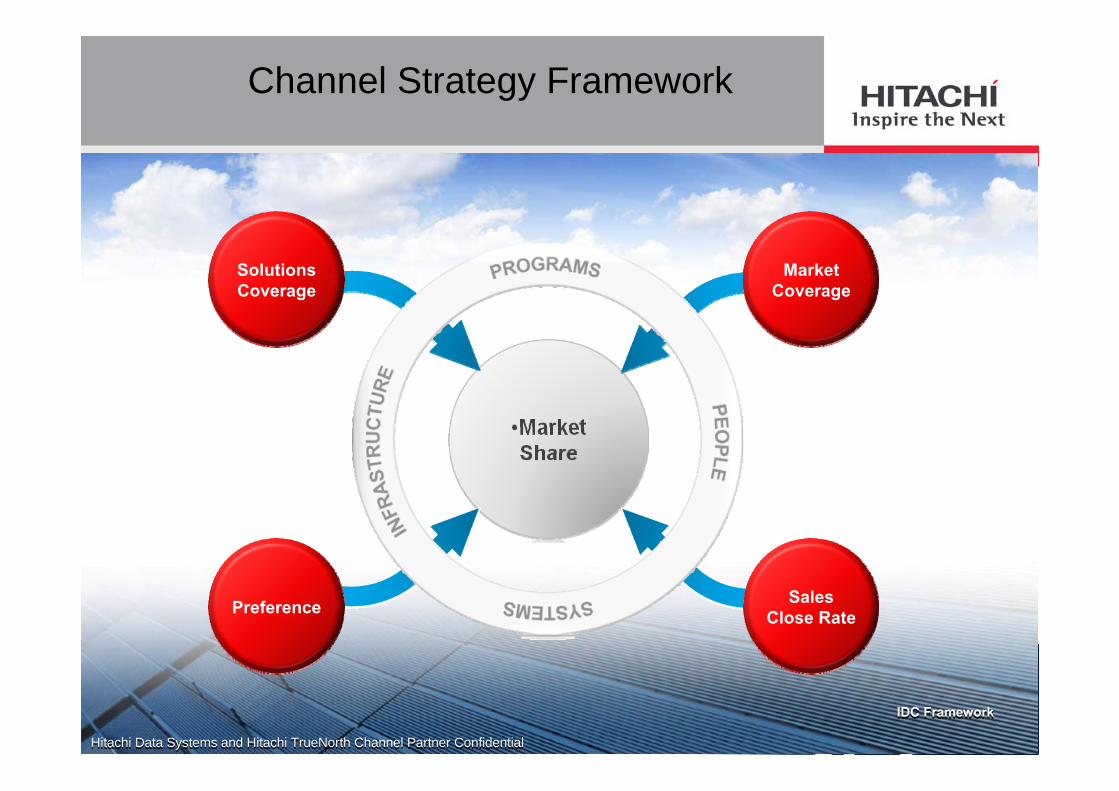
Channel Strategy Framework
•Preference
•Market•Coverage
•Sales Close•Rate
Market Coverage
SolutionsCoverage
Preference Sales Close Rate
IDC FrameworkIDC Framework
Hitachi Data Systems and Hitachi TrueNorth Channel Partner ConfidentialHitachi Data Systems and Hitachi TrueNorth Channel Partner Confidential

Paths to the Customer
GoldGoldPlatinumPlatinum
Hitachi Data SystemsHitachi Data Systems Hitachi LtdHitachi Ltd
SilverSilver BronzeBronze
DistributorsDistributors DistribDistrib
VARVARDirectDirect
DistribDistrib
VARDirect
DistribDistrib
VARVARDirectDirect
OEMPrivate LabelCo-brandedHitachi Data Systems Brand
Enterprise, Large, Medium and Small Business End-users Enterprise, Large, Medium and Small Business End-users
LargeSystem
Integrators
LargeSystem
Integrators
DirectDirect
Direct
TrueNorth Partner NetworkTrueNorth Partner Network
Hitachi Data Systems and Hitachi TrueNorth Channel Partner ConfidentialHitachi Data Systems and Hitachi TrueNorth Channel Partner Confidential 11
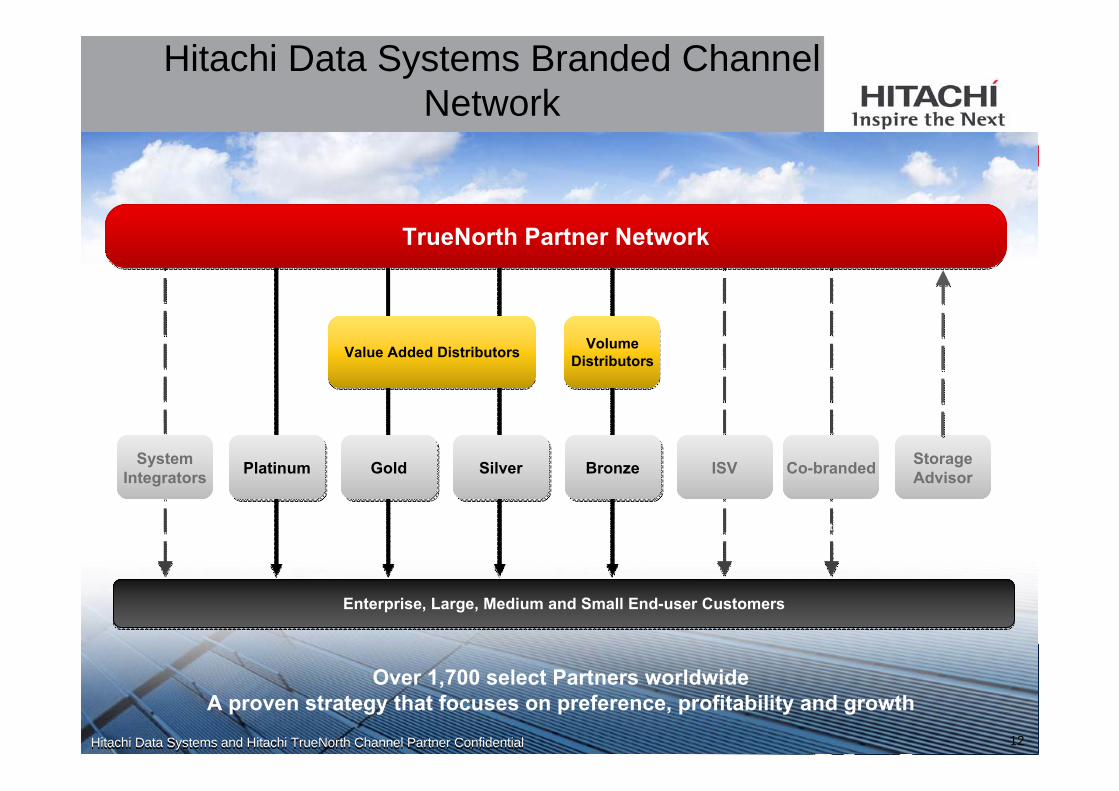
Co-branded
Hitachi Data Systems Branded Channel Network
BronzeBronze
Enterprise, Large, Medium and Small End-user CustomersEnterprise, Large, Medium and Small End-user Customers
SilverSilverGoldGoldPlatinumPlatinum
Volume Distributors
Volume Distributors
Over 1,700 select Partners worldwideA proven strategy that focuses on preference, profitability and growth
ISV
Value Added DistributorsValue Added Distributors
Planned AdditionsQ4 ‘08 – Q1 ‘09
StorageAdvisor
System Integrators
TrueNorth Partner NetworkTrueNorth Partner Network
Hitachi Data Systems and Hitachi TrueNorth Channel Partner ConfidentialHitachi Data Systems and Hitachi TrueNorth Channel Partner Confidential 12

MarketCoverage
PartnerProgram
PartnerEnablement
GTMSolutions
Enablement
ChannelCentric
BusinessModel
• Attract/maintain partners with flexible, lucrative program
• Drive efficiency & effectiveness of Co-op, MDF & BER funding
• Expand to support SIs, ISVs, SAs, OEMs
• Focus on channel friendly training and certification
• Enhance partner promotions
• Reward incremental business to HDS
• Increase channel communications
• Provide improved business planning tools
• Deliver ‘relevant’solutions
• Focus on partner deliverable solutions
• Leverage 3rd party solutions
• Drive file services solutions
• Streamline quote to order process
• Enhance portal usability
• Simplify service entitlement model
• Implement rules based pricing models
• Maximize opportunity registration
• Focus on top Partners
• Increase Partner capacity
• Enable new partnerships in key verticals
Hitachi Data SystemsChannel Strategy Foundations

Market Coverage Across All Segments
ENTERPRISECustom enterprise solutions
LARGE BUSINESSIndustry and horizontal IT solutions
MEDIUM BUSINESSIndustry and simplified solution
bundles
SMALL BUSINESSSimplified bundles
Solutions Coverage x Market Coverage x Preference x Close Rate = Market ShareSolutions Coverage x Market Coverage x Preference x Close Rate = Market Share
78% of all Direct and Indirect revenue sold to enterprise & large business
22% of all Direct and Indirect revenue sold to small and medium business
Geo variance22% of all Americas revenue is sold to
small / medium business25% of all EMEA revenue is sold to
small / medium businessChannel variance34% of all Indirect revenue is sold to
small / medium business13% of all Direct revenue is sold to small
/ medium business
Large System Integrators, Direct Sales, Enterprise System Solution Providers
System Solution Providers, Consultants, Value Added Distributors, VARs, ISVs, Network Integrators
Mid-size System , Solution Providers, System Consultants, VARs, ISVs, Network Integrators
Server Partners Volume Distribution Reseller Network
Hitachi Data Systems and Hitachi TrueNorth Channel Partner ConfidentialHitachi Data Systems and Hitachi TrueNorth Channel Partner Confidential •14
•Market Coverage

Market Coverage
Focusing on PartnersFocusing on Partners
Increased Focus and Investment on EMEA TOP PARTNERS
• Increase engagement and investment model
• Focused enablement strategy
• Ability to measure enablement and partner contribution
• Increase capacity of partners
• Enable select new partnerships in key verticals- Database Management- Data Warehousing,- Telco- Healthcare •Market
Coverage

Solutions Enablement : One Platform For All Data
NAS – Two Key Segments
• High-performance NAS: Focused on high throughput environments
• Standard NAS: Focused on file sharingand backup environments
Archiving/Object/Content Level Awareness/Web 2.0
• Foundation for open, scalable and integrated content solutions
Midrange ApplicationDB Enablement
• Midrange hardwareplatforms
• Common storage management• Common Protection Solutions
Structured Data/RDB, Apps Unstructured Data (Files, Metadata, Content)
COMMONStorage and Security,
Data Protectionand Search
COMMONStorage and Security,
Data Protectionand Search
INTEGRATED STRATEGY
INTEGRATED STRATEGY
•Solutions•Coverage
High End Enterprise Application/DB• Tiered Storage and
Virtualization via enterprise hardware platforms
• Common Protection Solutions
• Common storage management
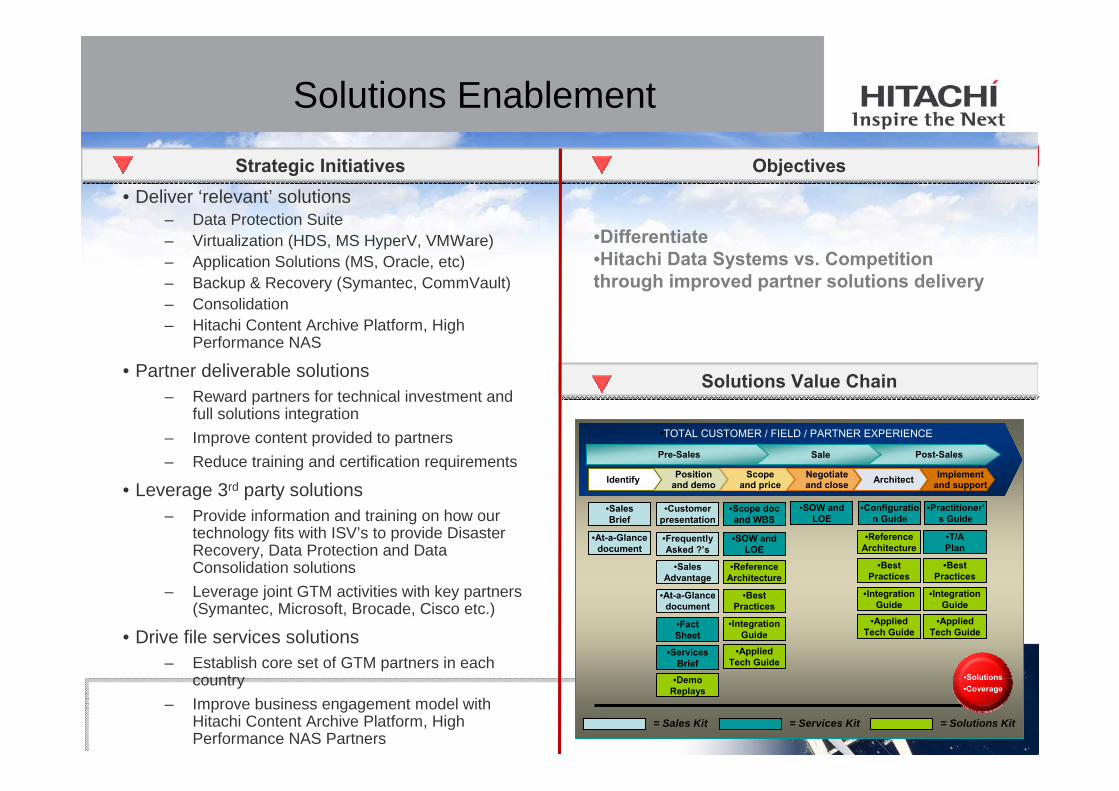
Solutions Enablement
Strategic InitiativesStrategic Initiatives ObjectivesObjectives
Solutions Value ChainSolutions Value Chain
•TOTAL CUSTOMER / FIELD / PARTNER EXPERIENCE
Pre-Sales Post-Sales Sale
Position and demo
Scope and price
Implementand support
Negotiate and closeIdentify Architect
•Sales Brief
•At-a-Glance document
= Services Kit = Solutions Kit
•Customer presentation
•Frequently Asked ?’s
•Sales Advantage
•Fact Sheet
•Services Brief
= Sales Kit
•Demo Replays
•Scope doc and WBS
•SOW and LOE
•Reference Architecture
•Best Practices
•Integration Guide
•Applied Tech Guide
•SOW and LOE
•Configuration Guide
•Reference Architecture
•Best Practices
•Integration Guide
•Applied Tech Guide
•Practitioner’s Guide
•T/A Plan
•Best Practices
•Integration Guide
•Applied Tech Guide
•At-a-Glance document
• Deliver ‘relevant’ solutions– Data Protection Suite– Virtualization (HDS, MS HyperV, VMWare)– Application Solutions (MS, Oracle, etc)– Backup & Recovery (Symantec, CommVault)– Consolidation – Hitachi Content Archive Platform, High
Performance NAS
• Partner deliverable solutions– Reward partners for technical investment and
full solutions integration – Improve content provided to partners– Reduce training and certification requirements
• Leverage 3rd party solutions– Provide information and training on how our
technology fits with ISV’s to provide Disaster Recovery, Data Protection and Data Consolidation solutions
– Leverage joint GTM activities with key partners (Symantec, Microsoft, Brocade, Cisco etc.)
• Drive file services solutions– Establish core set of GTM partners in each
country– Improve business engagement model with
Hitachi Content Archive Platform, High Performance NAS Partners
•Differentiate •Hitachi Data Systems vs. Competition through improved partner solutions delivery
•Solutions•Coverage

•18
••
Solutions Delivery Program
•18
Hitachi TrueNorth Channel Partner Program
Product / Solutions Certification
Solutions DeliveryProgram Platinum
Gold
Silver
Platinum
Gold
Silver
Focus on enabling Partner solutions delivery
•Solutions•Coverage
ASP
Services
Delivery Programmes
ASP
Services
Delivery Programmes
Install and ConfigureInstall and Configure
•Preference

More opportunities for our partners…within our core strategic initiatives
Business Analytics and Channel GTM
IT Operations Management Software
Partner Services Delivery Enablement
Hitachi TrueNorth Channel Partner Program 2.0
SUN Business
Modular
Improve Partner Profitability
File Services GTM Expand addressable market for partners
Gro
wth
Expand addressable market, enable managed services model
Grow and protect base
Maximize product benefits
Targeted and customized to maximize investments
Aligned business plans and ROI
•19
•Preference

Service opportunity
Spares ProvisionSpares Provision
Level 2 & 3 SupportLevel 2 & 3 Support
Level 1 Service/SupportLevel 1 Service/Support
Call HandlingCall Handling
Hold Maintenance ContractHold Maintenance Contract
Implementation ServicesImplementation Services
InstallationInstallation
Sell ProductSell Product
Spares ProvisionSpares Provision
Level 1 Service/SupportLevel 1 Service/Support
Call HandlingCall Handling
Hold Maintenance ContractHold Maintenance Contract
Implementation ServicesImplementation Services
InstallationInstallation
Sell ProductSell Product
Spares ProvisionSpares Provision
Level 1 Service/SupportLevel 1 Service/Support
Call HandlingCall Handling
Hold Maintenance ContractHold Maintenance Contract
Implementation ServicesImplementation Services
InstallationInstallation
Sell ProductSell Product
Spares ProvisionSpares Provision
Level 1 Service/SupportLevel 1 Service/Support
Call HandlingCall Handling
Hold Maintenance ContractHold Maintenance Contract
Implementation ServicesImplementation Services
InstallationInstallation
Sell ProductSell Product
Resellers ASP PartnersI & C Partners CSP Partners
Solutions Coverage x Market Coverage x Preference x Close Rate = Market ShareSolutions Coverage x Market Coverage x Preference x Close Rate = Market Share
Hitachi Data SystemsHitachi Data Systems
PartnerPartner
I & C Partner(Installation and Configuration)Sells HDS products and sells their own installation services
CSP(Certified Solution Provider)Sells HDS products and sells their own solution deployment services
ASP (Authorized Service Provider)sells HDS products and sells their own installation andmaintenance services
Hitachi Data Systems and Hitachi TrueNorth Channel Partner ConfidentialHitachi Data Systems and Hitachi TrueNorth Channel Partner Confidential 20
•Preference

Home Grown Application
PACS
File services opportunity: Hitachi Content Archive Platform (HCAP)
• Single platform supporting multiple applications simultaneously
• Common archive functions across content types
– Data and metadata ingest– Authentication and policies
• Embedded full-text indexing and search
– All content in the archive– Retrieve content produced
by different applications• High performance,
scalable and secure storage
File SystemDocument management
E-mail ArchiveSoftware
Result Set
Application Layer(ISV Partners)

WM
100% 100% 100% 100% 100% 100% 100% 100%$0K - $4.99K
$5K - $9.99K
$10K - $14.99K
$15K - $49.99K
$50K - $149.99K
$150K - $299.99K
$300K - $499.99
Band 8/9 >$500K
Country 2009 BAND1 BAND2 BAND3 BAND4 BAND5 BAND6 BAND7 BAND8/9Germany $1,222.8 24 88 86 427 266 100 102 129
UK $1,083.4 21 78 77 378 235 88 90 115France $608.8 12 44 43 213 132 50 51 64Italy $438.0 9 32 31 153 95 36 37 46Netherlands $321.8 6 23 23 112 70 26 27 34Switzerland $316.1 6 23 22 110 69 26 26 33Spain $299.7 6 22 21 105 65 24 25 32Belgium $232.5 5 17 16 81 50 19 19 25Sweden $182.5 4 13 13 64 40 15 15 19Denmark $127.5 2 9 9 45 28 10 11 14Austria $119.6 2 9 8 42 26 10 10 13Norway $107.7 2 8 8 38 23 9 9 11Finland $90.1 2 7 6 31 20 7 8 10Ireland $63.5 1 5 4 22 14 5 5 7Greece $40.1 1 3 3 14 9 3 3 4Portugal $39.3 1 3 3 14 9 3 3 4Total External Mkt. $5,293.33 103 382 374 1849 1150 432 442 561
% by Price band 2% 7% 7% 35% 22% 8% 8% 11%CAGR 2% -3% 11% 0% 4% -5% -9% -10%
EnterpriseMediumSmall
Modular opportunity: UK Market size!

UK Storage Hardware (2009)Estimated: Product Type by Customer Segment
based on % from HDS Corp analysis
$224M
$133M
$448M
Enterprise / Very Large Customers (10,000+ employees)
$116M
$141M
$50M
$307M
Large Customers(1,000-9,999)
$125M
Medium (100-999)
$37M
$29M
$4M
$257M
$108M
$71M
Small (0-99)
Entry Level(incl. DAS)
MidrangeProducts
High EndProducts
$25M
$91M
> 70% of Midrange Products are sold to Enterprise and Large Customers
> 70% of Midrange Products are sold to Enterprise and Large Customers

$0
$50
$100
$150
$200
$250
$300
1996 1997 1998 1999 2000 2001 2002 2003 2004 2005 2006 2007 2008 2009 2010
Installed Base(M Units)
Spending(US$B)
New Hardware spending
Worldwide IT Spending on Hardware, Power and Cooling, and Management/Administration
HW mgmt. and admin costsPower and cooling costs
0
5
10
15
20
25
30
35
40
45
50
Lots of unused capacity, low utilization
Better Utilization: Reduce Capital Costs
Better Management: Reduce Operational Costs
How can we help our partners sell more...in this complex solution environment?
What a customer wants to know when signing a PO….

The answer to 3 questions….
• In any type of economic justification, investment decisions boil down to three key questions:
How much is it going to cost?– How much investment is required for the
proposed solution and alternatives?What will be the return?– What is the net improvement and
savings in the future with this investment?
How fast?– What is the payback
term, NPV and IRR of the proposals?

How Much is it Going to Cost?
The buy price of a product says nothing about the costs to own the product!
Price ≠ Cost
• Storage purchase price is 1/3to 1/5 the total cost of ownership
– Capital expense (CAPEX) isnot under pressure
– Reducing operating expense(OPEX) is paramount
$0
$50
$100
$150
$200
$250
$300
$0
$50
$100
$150
$200
$250
$300
1996 1997 1998 1999 2000 2001 2002 2003 2004 2005 2006 2007 2008 2009 20101996 1997 1998 1999 2000 2001 2002 2003 2004 2005 2006 2007 2008 2009 2010
Installed Base(M Units)
New Hardware spendingNew Hardware spending
Worldwide IT Spending on Hardware, Power and Cooling, and Management/Administration
HW mgmt. and admin costsHW mgmt. and admin costsHW mgmt. and admin costsPower and cooling costsPower and cooling costsPower and cooling costsPower and cooling costs
0
5
10
15
20
25
30
35
40
45
50
IDC 2008Vernon Turner

HDS MethodologyStep 1: Understanding all Types of Costs
• 33 different types of costs!
• Defined and characterized from global customers and engagements since 2001
• Document to be sent to the customer ahead of the Workshop to give an indication of cost categories and from which to select 8-12 cost categories to work on in the workshop.

The HDS Methodology
Storage Economics, from HDS, is a series ofmethodologies, tools, solutions and planning
practicesthat enables the application of financial and
economicprinciples to storage technologies.
• Total cost of acquisition is just a fraction of total ownership costs• There are a variety of cost types that define storage TCO (and total cost of data
ownership)
• There are cost reduction opportunities in every storage environment, but one has to first define and baseline current costs before proceeding.
You cannot improve what you cannot measure
4Q 20083Q 20082Q 20081Q 20084Q 20073Q 2007 4Q 20083Q 20082Q 20081Q 20084Q 20073Q 2007
Bus
ines
s T
echn
olog
y
P
roce
ss
Peo
ple
Basic CM
Develop OLA Metrics and KPIMeasurement Systems
ITIL Audit
Define SLA
Dev Service Catalog App Alignment
Capacity Plan
Skill Assess
Tool Training
Roles and Responsibility
Storage Team Transformation
CMDB
Tool Training Tool Training
Storage ITIL
Event Mgmt
Adv. Provisioning
New fabric
Data Migrate
NAS Consolidate Std. Arch
Storage Mgmt Tools
DR Plans, Test
Backup, VTL
New DC Migration
Thin Provision
Unified Storage Mgmt
TCO/TB/Year
-
2,000
4,000
6,000
8,000
10,000
12,000
14,000
16,000
18,000
Baseline
Tier 1
0
50
100
150
200
250
300
350
400
2008 2009 2010 2011 2012
TCO
/TB/
Yea
r
Console, OpsWasteProvisioningEnvironmentNetworkDisaster ProtectSecurityData ProtectMigrationMgmt LaborSW MaintHW MaintSW LicenseHW Deprec
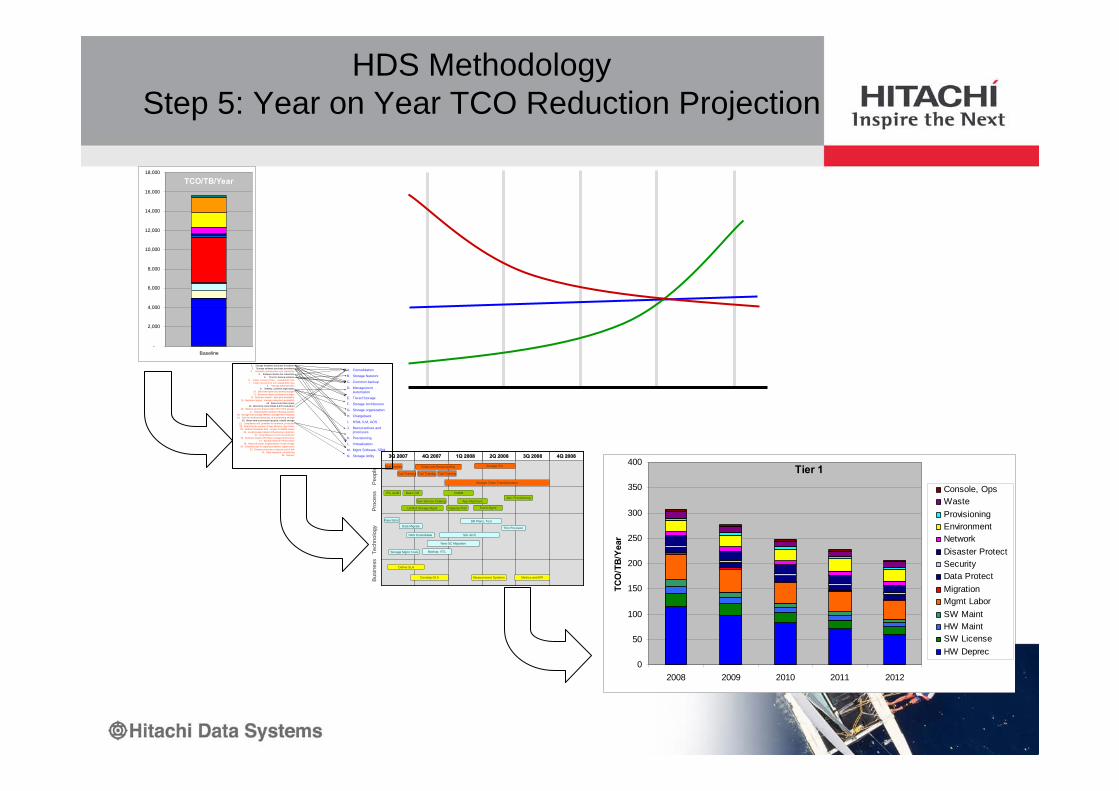
HDS MethodologyStep 5: Year on Year TCO Reduction Projection
1. Storage hardware purchase avoidance2. Storage software purchase avoidance
3. Hardware maintenance cost reductions4. Software license fee reductions
5. Time for backup windows6. Faster recovery times - catastrophic loss7. Faster recovery for non-catastrophic loss
8. Storage Administration9. Weekly, common mgmt tasks
10. Staff time spent for planned outages11. Business impact of planned outages
12. Business impact - data path availability13. Business impact - storage subsystem availability
14. Data center floor space15. Electricity costs (kWatt & BTU reduction)
16. Reduce servers that provide CIFS / NFS storage17. Reducing the number of backup servers
18. Storage and storage network management simplicity19. Time for workload balancing, re-provisioning storage
20. Mean-time to provision (acquire, install) storage21. Compliance risk, penalties for retention, protection22. Reducing the number of tape libraries, tape drives23. Reduce developer time - access to DBMS copies
24. Local storage network infrastructure reduction25. Long distance circuit cost reduction
26. Business impact with faster storage performance27. Storage Network Performance
28. Reduced waste, fragmentation of disk storage29. Downtime due to capacity problems, mgmt errors
30. Disaster protection, reduced cost of risk31. Data migration, remastering
32. Security
A. Consolidation
B. Storage Network
C. Common backup
D. Management Automation
E. Tiered Storage
F. Storage Architecture
G. Storage organization
H. Chargeback
I. HSM, ILM, AOS
J. Best practices and processes
K. Provisioning
L. Virtualization
M. Mgmt Software, SRM
N. Storage Utility

What will be the return?
• Total savings are broken down into the pre-defined categories– Labor, Migration
• Storage Management efficiencies• Potential reduction in migration/ re-mastering labor costs
– CAPEX Avoidance• Reclaimed storage saves CAPEX• Reduced cost of growth with tiers
– Environmental• Change in floor space• Change in power, cooling
– Maintenance Fees• Hardware• Software
Graphical representation of investment, payback and total savings
How fast?

Summary
1. Continue precise key Channel Partner prioritization – global 1502. Comprehensive sales enablement – sales & Services3. Tailored promotional programs – emphasis on modular4. Aggressive push programs to drive competitive displacement5. Intense focus on end to end solutions to maximize revenue & margins6. Drive YOUR preference!
Hitachi Data Systems and Hitachi TrueNorth Channel Partner ConfidentialHitachi Data Systems and Hitachi TrueNorth Channel Partner Confidential 32

Thank you

Channel Development & EnablementRichard Grabinger, Director Partner Development & Enablement
Tara Foster, EMEA Channel Marketing Manager

Partner Enablement Priorities: FY 09
• Focus on Roll out of TNCPP II
• Mid Market Demo Programme
• Major Focus on PX Performance
• Modular Focus
• Channel Services Programme
• Pre-launch Channel Readiness
• Strong Solution-focus Promotions
• Channel Communications
• Drive Preference for Channel Partners
• Channel Marketing Bureau
• EMEA TOP 50 Partners

Hitachi TrueNorth Channel Partner Program EMEA Program Benefits Table
Benefits Summary & Qualifications PLATINUM GOLD SILVER BRONZEDistributor Type
VAD Volume
Co-op Funding Provided Provided --- --- Provided ---
MDF - Market Development Fund Available Available Available --- Available Available
Back End Rebates Available Available --- --- Available ---
Opportunity Registration 2, 3 Provided Provided Available 6 Available 6 Provided 6 ---
Product Portfolio Access All All All 7 Up to AMS 200 All Up to AMS
200
TNCPP 2008 Qualifiers:
Approved Business Plan Required Required --- --- Required ---
Meet Sales Training Qualifications Required Required --- --- Required ---
Meet Technical Training Certifications Required Required --- --- Required ---
Meet or Exceed Sales Requirements Required Required --- --- Required ---
“Provided” means that a given benefit is granted and guaranteed. “Available” means that a benefit isavailable, discretionary and not guaranteed.

True North Financial Incentives
• Full portfolio of available benefits– Generous Co-op & Back End Rebates– Market Development Funding (MDF) availability*
• Simplified payout structure– Benefits paid out based on Partners total purchase
dollars; no complex formulas• Easy to understand performance metrics
– Partners are measured on total growth achievement versus plan
• Profit and growth protection benefits– Deal registration– Meet-competition pricing
• TrueNorth is consistent with prior program
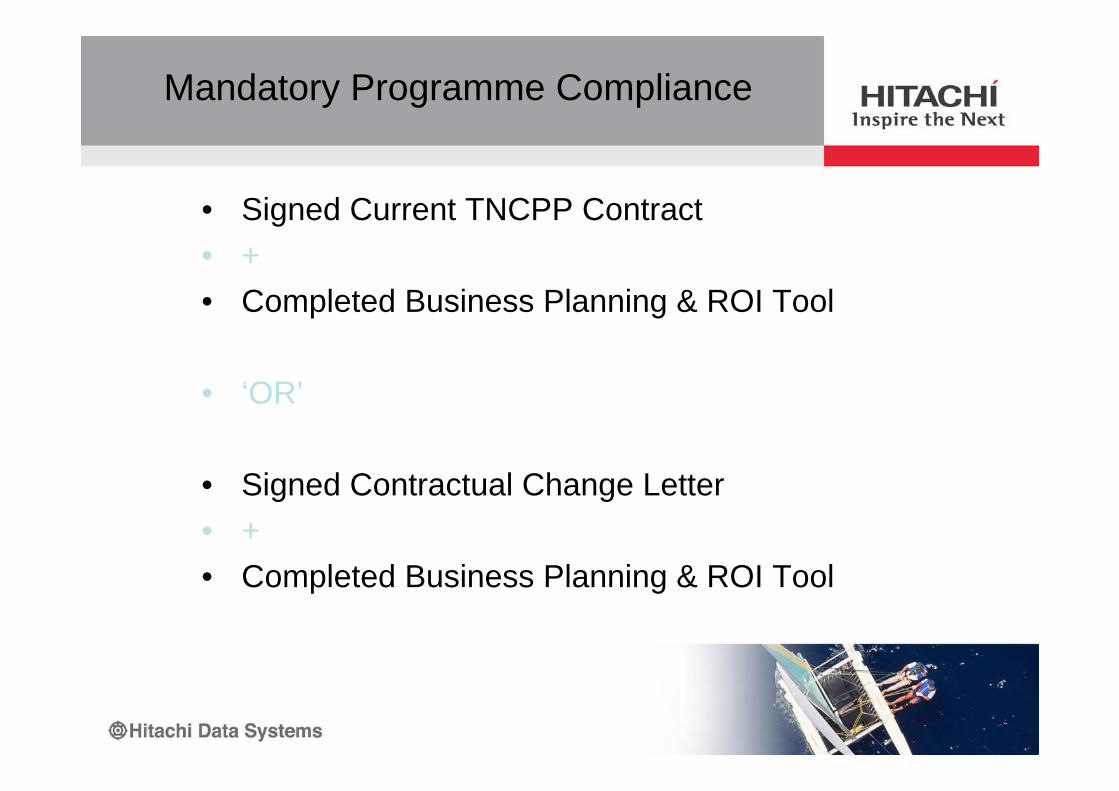
• Signed Current TNCPP Contract• +• Completed Business Planning & ROI Tool
• ‘OR’
• Signed Contractual Change Letter• +• Completed Business Planning & ROI Tool
Mandatory Programme Compliance

EMEA MID MARKET DEMOUNIT PROGRAMME
The following are available as Demo products:
• AMS 2100 8.500,-- Euro
• Essential NAS 1100 c 13.000,-- Euro
• Rack 1.500,-- Euro
• Brocade 310 Switch 1.500,-- Euro
• HCAP 300 4 TB 14.000,-- Euro

EMEA –Reward ProgrammeAMS 2000 & HCAP 300 – JULY 2009
Apple i-Touch
Sony Playstation 3

AMS2500 and HCAP300 Rewards
PS3 80Gig Nintendo Wii and Wii Fit
Apple Jukebox (16G I-Touch and Bose Docking Station and Music System)
TomTom SatNav
Hitachi Digital Camcorder

Provide a complete Competitive Displacement solution
Expand coverage and growth via our partners
Protect our existing installed base by maximising customer relationships
Provide an ‘easy’ way to replace competitive equipment and solution
Displace our competitors by identifying key competitors and building attack offers
Increase HDS market share in mid-market
Business ObjectivesStrategic Objectives
Storage Buyback Programme

• Targets competitor’s installed modular storage systems
• Offers a trade-in value to end users for purchasing new HDS modular storage systems (AMS2100, 2300, 2500)
• Trade-in value passed to the customer by the partner
• Old equipment will be physically removed and destroyed
• After the removal process has been completed, Partner will receive trade-in value from our external supplier.
Storage Buyback Programme -Overview

Storage Buyback Programme
£5,500Hitachi AMS2500
£4,500Hitachi AMS2300
£3,500Hitachi AMS2100
Trade-in valueAMS Range Technology purchased
The table below demonstrates the amount of incentive to be awarded per HDS AMS technology purchased (providing that the competitor product is displaced)

The Partner Marketing Bureau

Hitachi Data Systems Bureau Overview
• The Hitachi Data Systems Bureau offers a range of fully managed,co-branded campaigns available to Hitachi Data Systems channel partners across EMEA
• Each campaign will be tailored to the partner’s needs and budgets
• The campaigns are fully managed and are designed to ensure the partner gets the maximum return on their marketing spend, with the minimum of effort
• The bureau is Easy, Simple, Fast and Effective

Benefits
• Partner can implement an effective lead generation campaign regardless of budget and resource
• Generates real, actionable sales leads
• Flexibility is key and partners will have access to experienced marketers, who understand technology & channels
• Hitachi Data Systems can support those partners who have previously had no or little support

What is on offer?
• A fully managed lead generation campaign co-branded with the partner's company logo, value proposition & local call to action
• Range of campaigns elements are available that can be moulded towork within the specific budget
• Dedicated marketing resource & project management expertise
• Secure password-protected project reporting, metrics & status updates

The Bureau

Campaign Examples

In Conclusion
At the end of any campaign, each reseller should have achieved the following key markers:
• A greater database of prospects – either their own being cleaned, or greater numbers through purchase of robust data
• A significant number of confirmed leads
• A list of known opportunities arising within the next 18 months – providing a ready made and accessible pipeline for future business
• Option to extend telemarketing and other campaign elements,in order to expand reach of campaign and message
• A fully robust campaign model, with full ROI and metrics, against which future work can be assessed.

Thank you

Copyright 2009 IDC. Reproduction is forbidden unless authorized. All rights reserved.
New Economic Reality
Responding to Today’s Storage & IT Challenges
Eric Sheppard, Program Director, IDC EMEA Storage Research

© 2009 IDC
AgendaAgenda
New economic reality– Likely ways companies will deal with current conditions
Changing economic conditions hasn’t reduced data growth and infrastructre managment burdens
Three responses to today’s challenges
Conclusions & recommendations

© 2009 IDC
New Economic RealitiesNew Economic Realities
Current situation for UK & EU:
Moved fast from Phase 2 to Phase 3Business Cycle Clock (Eurostat)
Companies impacted by economic conditions appear to lean towards quick fixes
But there are a couple of things to consider… Storage is less impacted than other
technologies…
…This doesn’t mean storage is immune to economic down turns

© 2009 IDC
Spendingfreeze related
to newprojects
Sw itching tolow er-costtechnologyproducts
Moreapprovals
needed for ITspendingdecisions
Using few er ITsuppliers,
consolidatingon largervendors
Major reviewof IT
procurementprocesses and
policies
Exploringalternative
models for IT,e.g. softw areas a service
Exploringalternative
models for IT,e.g. open
source storage
Signingshorterservice
contracts
Increasedoutsourcing
None/Other
Likely Way of Addressing Economic DownturnLikely Way of Addressing Economic DownturnQ. Which of the following are likely to occur in your organisation as a direct result of current economic conditions?
N: 1,805 Multiple responses permittedSource: IDC’s 2009 European Storage Survey

© 2009 IDC
Likely Spending Cuts – Hardware OnlyLikely Spending Cuts – Hardware Only
New PCs Printers Server and serversprojects such as
virtualization
Mobile devices Networkingequipment
Storage and storageprojects such as
consolidation
Voice over IP (VoIP)
Q. In which of the following HARDWARE areas do you currently anticipate your company would make spending cuts in the event of an economic slowdown over the next 12 months?
N: 872 Multiple responses permittedSource: IDC’s 2009 European Storage Survey

© 2009 IDC
We Aren’t Saying Storage Is Recession Proof
We Aren’t Saying Storage Is Recession Proof
In Fact, Growth From New
Investments is Down
In Fact, Growth From New
Investments is Down

© 2009 IDC
UK External Disk Systems TB GrowthUK External Disk Systems TB Growth
0%
20%
40%
60%
80%
100%
2006
Q120
06Q2
2006
Q320
06Q4
2007
Q120
07Q2
2007
Q320
07Q4
2008
Q120
08Q2
2008
Q320
08Q4
2009
Q120
09Q2
2009
Q320
09Q4
TB Y/Y Growth
2006 2007 2008 2009
(35.5%)(55.1%)(62.2%)

© 2009 IDC
Future European Storage PrioritiesFuture European Storage Priorities
Optimize diskutilization
Consolidate storageonto fewer storage
systems
Improve storageperformance
Enhance disasterrecovery plans
Expand storagecapacity
2008 Survey2009 Survey
Q. Which THREE of the following are your company's top priorities relating to storage for the next 12 months?
N: 1,367 Source: IDC, 2009

© 2009 IDC
New Capacity Installations May Have Eased…
New Capacity Installations May Have Eased…
…But Critical Challenges Haven’t
Gone Away
…But Critical Challenges Haven’t
Gone Away

© 2009 IDC
The First Critical Challenge – The Growing Value & Volume Associated With DataThe First Critical Challenge – The Growing Value & Volume Associated With Data
Consumption of EnterpriseDisk Capacity by Type
CAGR
26.9%
58.5%
(EB)
33.2%
83.8%
Structured, transaction-oriented data accounts for declining portion of storage needs
Compliance and analysis drive surge in replication
Disk-based recovery
Business analytics
Explosion in fixed content data
Secondary storage is the new primary storage
– Capacity over performance
Content Depots & cloud change the rules for data
Petabyte scale storage
05
101520253035404550
2007 2008 2009 2010 2011 2012
Content Depots & CloudTraditional Unstructured dataReplicated dataTraditional Structured data

© 2009 IDC
WW Spending on Servers, Power and Cooling, and Management/Administration
The Second Critical Challenge – The Continued Failure to Control Administration CostThe Second Critical Challenge – The Continued Failure to Control Administration Cost
Source: IDC Worldwide Server Research, 2009
$0
$25,000
$50,000
$75,000
$100,000
$125,000
$150,000
$175,000
$200,000
'96 '97 '98 '99 '00 '01 '02 '03 '04 '05 '06 '07 '08 '09 '10 '11 '12
0
5,000,000
10,000,000
15,000,000
20,000,000
25,000,000
30,000,000
35,000,000
40,000,000
45,000,000
Installed BaseSpending ($M)
Power & Cooling
Mgmt & AdministrationNew Server Spending

© 2009 IDC
Today’s Critical Challenges:Three ResponsesToday’s Critical Challenges:Three Responses
Storage Optimization
• Storage mgrs. are buckling under the weight of storage growth
• SATA: Yesterday’s solution has become today’s problem
• Secondary storage has become the new primary

© 2009 IDC
Future European Storage SpendingFuture European Storage Spending
Q. Which THREE of the follow applications will future storage spending support?
~1,500 responses
Apps that typically drive high data growth on low
performance storage
Source: IDC Europe, 1Q2009
0%
10%
20%
30%
EmailFile
shari
ngData
Archivin
g
ERP
Data Prot
ection
/D.R
.
Web site
/eCom
merce
CRM
Data w
arehou
sing/B.I.
Digital
Imagin
gCon
tent M
gt.
Analog
reco
rds to
digita
l
Supply
Cha
in Man
agemen
t
Regulat
ory m
anda
tes
Other

© 2009 IDC
>50%27%
A Fundamental IssueA Fundamental Issue

© 2009 IDC
Datacenter terabyte requirements growing >50%/year
Enterprise HDD capacities growing 27%/yr
Companies are trying to deal with space, power, and capacity issues – it is a challenging environment
0%
10%
20%
30%
40%
50%
60%
70%
80%
90%
1998 1999 2000 2001 2002 2003 2004 2005 2006 2007 2008 2009 2010 2011 2012
Enterprise External Storage Growth (TBs)Enterprise HDD Capacity Growth (TBs)
A Fundamental IssueA Fundamental Issue

© 2009 IDC
Datacenter terabyte requirements growing >50%/year
Enterprise HDD capacities growing 27%/yr
Companies are trying to deal with space, power, and capacity issues – it is a challenging environment
0%
10%
20%
30%
40%
50%
60%
70%
80%
90%
1998 1999 2000 2001 2002 2003 2004 2005 2006 2007 2008 2009 2010 2011 2012
Enterprise External Storage Growth (TBs)Enterprise HDD Capacity Growth (TBs)Mix of S/ATA in External Storage (TBs)
A Fundamental IssueA Fundamental Issue

© 2009 IDC
Ratio of WE External Capacity Shipped to Retired Capacity Ratio of WE External Capacity Shipped to Retired Capacity
-1,000PBs
-500PBs
0PBs
500PBs
1,000PBs
1,500PBs
2,000PBs
2,500PBs
3,000PBs
2007 2008 2009
1
2
3
4
5
PB Shipments Retired PBs Shipments:Retired Ratio

© 2009 IDC
Secondary is the New PrimarySecondary is the New Primary
Benefits of secondary storage have proven greater than early fears associated with moving data to a lower tier of storage
– >80% of European storage managers surveyed said they use disk for backup somewhere in their organization
– SATA accounts for 45%-50% of new array capacity shipped
But secondary storage is now the primary disk storage asset in terms of:– Capacity– Spending– Management burden
It’s time to focus on storage optimization– Thin provisioning– Deduplication– Virtualization– Automation

© 2009 IDC
Today’s Critical Challenges:Three ResponsesToday’s Critical Challenges:Three Responses
Virtualization Build Out
• Sever virtualization is: Now considered mainstream Accelerating adoption of networked storage Changing the way storage is deployed
Storage Optimization
• Storage mgrs. are buckling under the weight of storage growth
• SATA: Yesterday’s solution has become today’s problem
• Secondary storage has become the new primary

© 2009 IDC
European Server Virtualization AdoptionEuropean Server Virtualization Adoption
Survey Samples: ~520 Number of Servers Installed
Server virtualization now considered a mainstream technology among IT buyers
Cost saving from server consolidation
Rapid provisioning of new servers
IT professionals are very bullish on future use
Core assumptions about infra. and data center strategies are being turned upside down
0%
25%
50%
75%
100%
1 to 5 5 to 9 10 to 24 25 to 49 50+ Total
2007 2008
Q. Is your company currently using server virtualization products such as VMware, Xen, or
Microsoft Hyper-V?
0%
25%
50%
75%
100%
2007 2008
Yes No

© 2009 IDC
Use of Server Virtualization Over TimeUse of Server Virtualization Over Time
N: 240
Rate of Virtual Server Sprawl?Rate of Further Deployment?
0%
20%
40%
60%
80%
100%
Within Last 2 Yrs >2 Yrs Ago
First Use of Server Virtualization
20+ Virtualized Servers11-20 Virtualized Servers5-10 Virtualized Servers
0%
20%
40%
60%
80%
100%
Within Last 2 Yrs. >2 Yrs Ago
First Use of Server Virtualization
>20 VMs/Partitions11-20 VMs/Partitions6-10 VMs/Partitions5 or fewer VMs/Partitions

© 2009 IDC
Impact of Server Virtualization? Impact of Server Virtualization?
Stg. mangers now providing centralized/shared storage support for servers that were previously off your radar (distributed DAS)
No longer 1 server = 1 application (more like 1:4 or 1:8 or more)
– This changes the dynamic for SAN connectivity
– Move from 4Gbs to 8Gb important but alone is not enough
– QoS must also be a focus
Creating a need for storage solutions that support low costs and automated operations
– Server virtualization is the killer app for iSCSI
– Block-level virtualization solutions that deliver automated and “thin provisioning” services

© 2009 IDC
Block-level Storage Virtualization:Three Numbers to RememberBlock-level Storage Virtualization:Three Numbers to Remember
>40% = Improvement in effective capacity use (not including any improvements from thin provisioning)
“I used server virtualization to improve utilization rates, I’ll use storage virtualization to improve storage utilization rates.”
>30% = Reduction in migration, replication, back-up times
“I used server virtualization for server migration (e.g., vmotion), I’ll use storage Virtualization to improve storage migration times.”
>50% = Decrease in server/storage administration times– High end arrays and applications were always tightly controlled, but the
new virtualized servers are the wild west
– It’s these midrange arrays that are now benefiting the most here

© 2009 IDC
Today’s Critical Challenges:Three ResponsesToday’s Critical Challenges:Three Responses
Virtualization Build Out
• Sever virtualization is: Now considered mainstream Accelerating adoption of networked storage Changing the way storage is deployed
Storage Optimization
• Storage mgrs. are buckling under the weight of storage growth
• SATA: Yesterday’s solution has become today’s problem
• Secondary storage has become the new primary
De-Capitalization of IT
• Current economy driving capital conservation• Credit crunch reduces the number of acquisition
choices• This is driving a need for variable capital mgmt Will also drives interest in SaaS/Cloud

© 2009 IDC
IT Leasing
Software as a Service
Cloud Computing
Managed Services
Manifestations Of A Broader Theme:The CFO Wants to Decapitalize IT . . .Manifestations Of A Broader Theme:The CFO Wants to Decapitalize IT . . .
What Is Driving IT to Adopt These Technologies / Business Models . . .
Capacity on Demand Virtualization
Variable Capital ManagementVariable Capital Management

© 2009 IDC
Closing Thoughts on Cloud ComputingClosing Thoughts on Cloud Computing
Source: IDC Cloud Computing Usage Study, 2009
Of the following benefits commonly ascribed to the cloud/on-demand model, how do you rate their importance to your organisation?
N=244
32.8%
28.3%
28.3%
25.4%
22.1%
20.5%
17.2%
12.3%
31.1%
33.2%
28.7%
27.9%
27.9%
25.8%
26.2%
16.8%
19.7%
23.0%
20.5%
24.6%
27.0%
27.0%
23.8%
27.0%
8.20%
13.10%
13.90%
13.10%
15.60%
16.80%
22.50%
9.40%
7.40%
9.40%
8.20%
9.80%
11.10%
16.00%
21.30%
7.00%
0% 10% 20% 30% 40% 50% 60% 70% 80% 90% 100%
Easy/fast to deploy to end-users
Pay only for what you use (no need to over-provision)
Requires less in-house IT staff, skills, costs
Low monthly payments (i.e., no big up-front license payment)
Always offers the latest functionality
Encourages more standard (less heavily-customised) ITsystems
Cloud services makes sharing systems/information withbusiness partners simpler
Seems like the way of the future
% Respondents
Top Priority Rating 4 Rating 3 Rating 2 No interest
© 2009 IDC
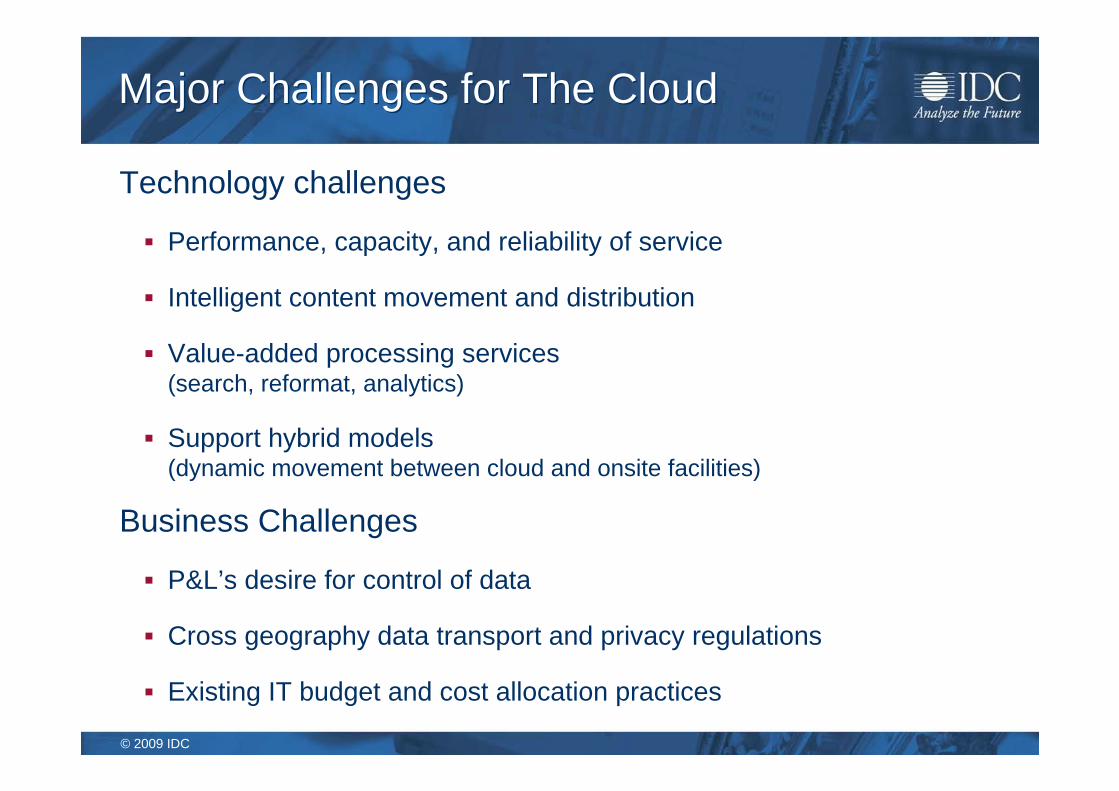
Major Challenges for The CloudMajor Challenges for The Cloud
Technology challenges
Performance, capacity, and reliability of service
Intelligent content movement and distribution
Value-added processing services(search, reformat, analytics)
Support hybrid models(dynamic movement between cloud and onsite facilities)
Business Challenges
P&L’s desire for control of data
Cross geography data transport and privacy regulations
Existing IT budget and cost allocation practices

© 2009 IDC
Hybrid Approach Becomes Best PracticeHybrid Approach Becomes Best Practice
Hybrid approach to storage (on-premise plus on-network) will become an industry best practice

© 2009 IDC
Summary Summary Use new technology to boost efficiency
Thin provisioning, de-dupe, automation
Server virtualization is changing the way storage is designed & deployed
Remember that virtualization isn’t just for servers!
Make Better Use of Capital Expenditure
There are you “CFO Friendly”?

© 2009 IDC
Questions?Questions?
British Standard House389 Chiswick High RoadLondon: W4 4AEPhone: +44 (0) 20 8987 7100
www.idc.com
Eric SheppardDirect : +44 (0)208 987 [email protected]
Program Director,European Storage Systems

Lunch!
– Marquee:• Zycko• Bell• Quantum• Cisco • Brocade
– Sefton Room:• HDS Finance Offerings• HDS HITOA• HDS Training• PR Consultation• Marketing Consultation
• BBQ lunch• “Passport” system:
- visit all sponsors and get stamped for your chance to win an Xbox
• Ingram sponsored Wii competition
– win a pocket surfer!
• Bell sponsored golf tournament – in support of charity Clic Sargent
– win a bottle of champagne!
• HDS Playstation “Stig” competition
- Win a Wii console!