hiv-1 dna levels after antiretroviral therapy in primary infection predict disease progression: the...
TRANSCRIPT
HIV-1 DNA levels after antiretroviral therapy in primary infection predict disease
progression: the SPARTAC Trial
James Williams1,2,3, Jacob Hurst1,2,3, Nicola Robinson1,2,3, Sarah Fidler4, Jonathan Weber4, Abdel Babiker5, Rodney Phillips1,2,3, Kersten Koelsch6*, Tony Kelleher6*, John Frater1,2,3*
On behalf of the SPARTAC Trial Investigators
*contributed equally
1Peter Medawar Building for Pathogen Research, Nuffield Department of Clinical Medicine, John Radcliffe Hospital, Oxford; 2Institute for Emerging Infections, The Oxford Martin School, Oxford, UK; 3Oxford National Institute of Health Research Biomedical Research
Centre, Oxford, UK; 4Division of Medicine, Wright Fleming Institute, Imperial College, London, UK; 5Medical Research Council Clinical Trials Unit, London, UK; 6The Kirby Institute, UNSW, Sydney, Australia.

The SPARTAC Trial
Fidler et al, NEJM, 2013
Definition of PHI
Lab evidence of infection within 6 months since seroconversion Randomisation to 3 arms:
◦ 48-week short course ART (ART-48)
◦ 12-week short course ART (ART-12)
◦ No therapy (Standard of Care, SOC) Composite primary end point
◦ time to CD4 <350 cells/mm3 or long-term ART initiation
• Design: Largest randomised clinical trial investigating the effect of short-course ART compared with no ART in Primary HIV infection.
• Findings: 48 weeks of ART:– Significantly delayed disease progression, although not for longer than the
period of treatment – Delayed viral rebound
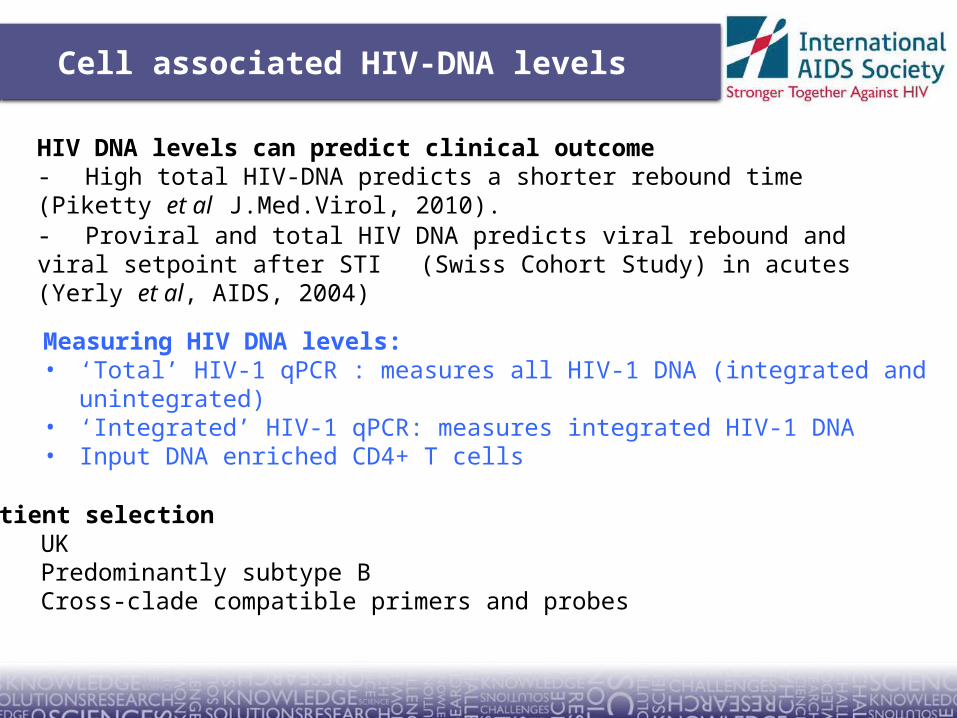
Cell associated HIV-DNA levels
HIV DNA levels can predict clinical outcome- High total HIV-DNA predicts a shorter rebound time (Piketty et al J.Med.Virol, 2010).- Proviral and total HIV DNA predicts viral rebound and viral setpoint after STI (Swiss Cohort Study) in acutes (Yerly et al, AIDS, 2004)
Measuring HIV DNA levels:• ‘Total’ HIV-1 qPCR : measures all HIV-1 DNA (integrated and unintegrated)• ‘Integrated’ HIV-1 qPCR: measures integrated HIV-1 DNA• Input DNA enriched CD4+ T cells
Patient selection• UK • Predominantly subtype B• Cross-clade compatible primers and probes

Results of Proviral Analysis
Associations of HIV cell associated DNA levels with: Baseline plasma VL Estimated time since seroconversion Time to plasma VL rebound on stopping
ART Clinical progression (Trial primary
endpoint)
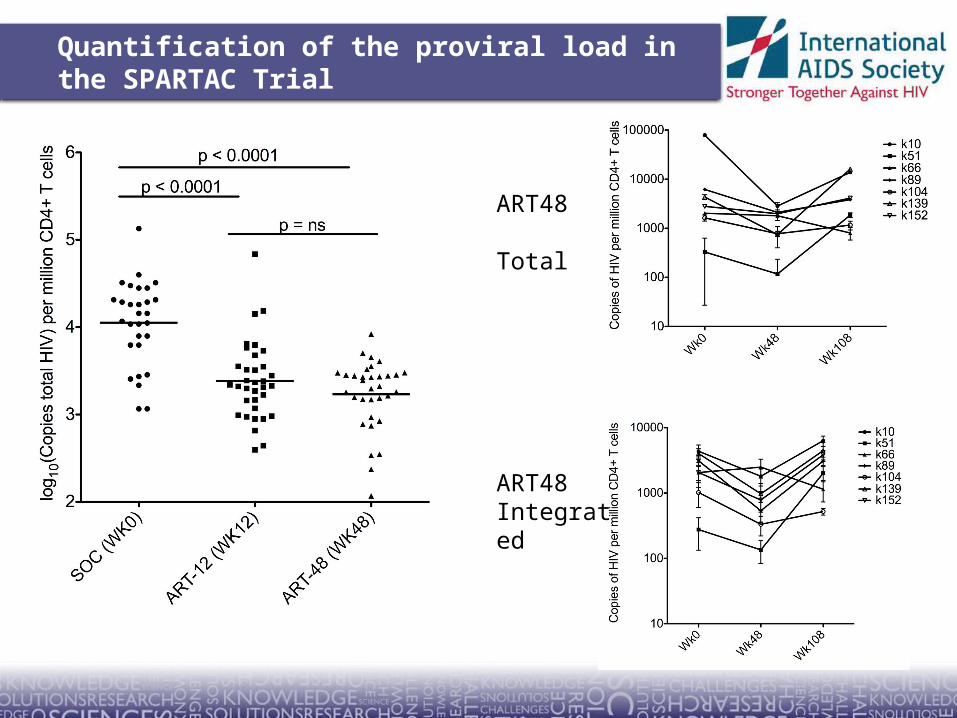
Quantification of the proviral load in the SPARTAC Trial
ART48 Total
ART48Integrated

Correlation of HIV-1 DNA with plasma viral load
Baseline VL vs Baseline cell-associated HIV-1 DNA(Total Assay) ART12
(wk12)
ART48 (wk48)
r2 = 0.30r2 = 0.23
r2 = 0.18r2 = 0.34
r2 = 0.34
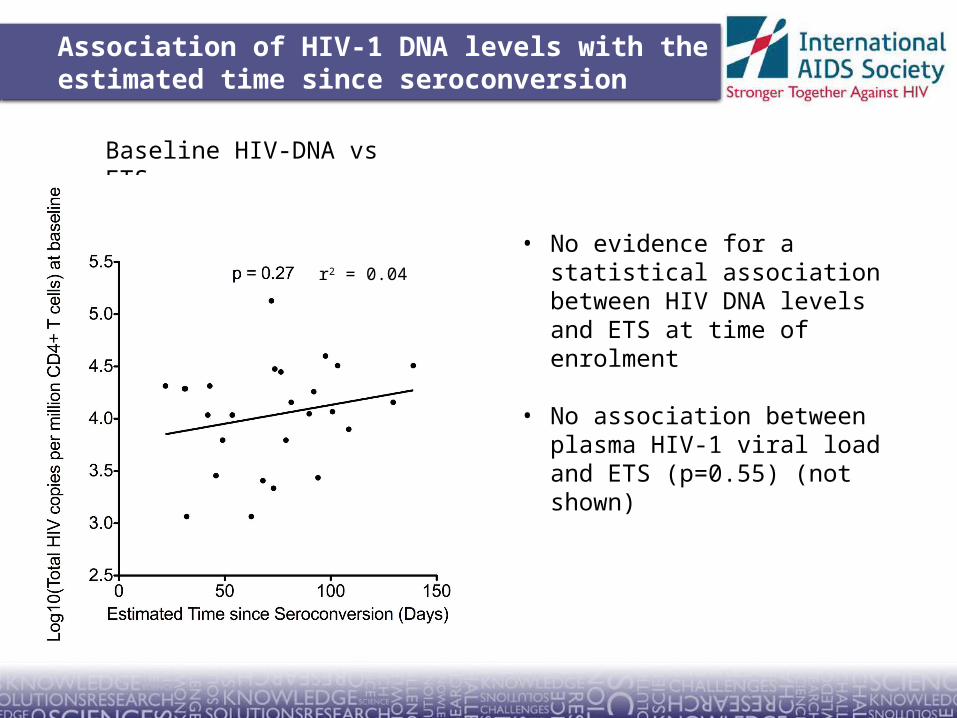
Association of HIV-1 DNA levels with the estimated time since seroconversion
Baseline HIV-DNA vs ETS
• No evidence for a statistical association between HIV DNA levels and ETS at time of enrolment
• No association between plasma HIV-1 viral load and ETS (p=0.55) (not shown)
r2 = 0.04

No evidence to associate HIV-1 DNA levels with time to viral rebound at wk48.
Stohr et al; unpublished
Time on ART is associated with time to VL rebound on stopping
Integrated
P = 0.74, r2 = 0.003
But, no evidence for an association between proviral load and time to rebound
Total
P = 0.31, r2 = 0.03

Association of proviral load with primary endpoint after STI.
TOTAL (Wk48) INTEGRATED (Wk48)
Univariate Cox Regression Analyses(log total) vs survival: P = 0.017; Hazard Ratio:
7.22 (1.42-36.84)(log integrated) vs survival: P = 0.041; Hazard Ratio: 2.68 (1.04-6.90)(log baseline VL) vs survival: P = 0.022; Hazard Ratio: 1.81 (1.09-3.00)(wk48 CD4 count) vs survival: P = 0.684; Hazard Ratio: 0.97 (0.83-1.13)

Conclusions
• 12 or 48 weeks of ART significantly decreases the cell associated HIV-DNA.
• Viral Load at ‘baseline’ associates with HIV DNA levels at baseline and after therapy.
• Viral load and HIV DNA levels are not determined by estimated time since seroconversion.
• No evidence to suggest proviral load is associated with time to viral rebound.
• Total and Integrated proviral levels both predict primary endpoint of the clinical trial.
Acknowledgements
PETER MEDAWAR BUILDING FOR PATHOGEN RESEARCH, OXFORD, UK• John Frater• Rodney Phillips• Jacob Hurst• Nicola Robinson
MRC CTU, LONDON, UK• Wolfgang Stöhr• Abdel Babiker
UNSW, SYDNEY, AUSTRALIA• Tony Kelleher• Kersten Koelsch
IMPERIAL COLLEGE, LONDON, UK• Jonathan Weber• Sarah Fidler
UNIVERSITY OF PENNSYLVANIA, PHILADELPHIA, USA• Una O’Doherty
• The SPARTAC trial Investigators
• Participants of SPARTAC