hiv and aids data through december 2016 … surveillance supplemental report 2 vol. 23, no. 7 this...
TRANSCRIPT

Volume 23, Number 7
HIV and AIDS Data through December 2016
Provided for the Ryan White HIV/AIDS Program, for
Fiscal Year 2018

This issue of the HIV Surveillance Supplemental Report is published by the Division of HIV/AIDS Prevention, National Center for HIV/AIDS, Viral Hepatitis, STD, and TB Prevention, Centers for Disease Control and Prevention (CDC), Atlanta, Georgia, and the HIV/AIDS Bureau, Health Resources and Services Administration, U.S. Department of Health and Human Services, Rockville, Maryland.
The HIV Surveillance Supplemental Report is not copyrighted and may be used and copied without permission. Citation of the source is, however, appreciated.
Suggested citation
Centers for Disease Control and Prevention. HIV and AIDS data through December 2016 provided for the Ryan White HIV/AIDS Program, for fiscal year 2018. HIV Surveillance Supplemental Report 2018;23(No. 7):[inclusive page numbers]. http://www.cdc.gov/hiv/library/reports/hiv-surveillance.html. Published November 2018. Accessed [date].
Centers for Disease Control and Prevention . . . . . . . . . . . . . . . . . . . . . . . . . . . . . Robert R. Redfield, MDDirector
National Center for HIV/AIDS, Viral Hepatitis, STD, and TB Prevention . . .Jonathan H. Mermin, MD, MPHDirector
Division of HIV/AIDS Prevention. . . . . . . . . . . . . . . . . . . . . . . . . . . . . Eugene McCray, MD, MPHDirector
HIV Incidence and Case Surveillance Branch . . . . . . . . . . . . . . . Angela Hernandez, MD, MPHChief
Data Analysis and Dissemination Team . . . . . . . . . . . . . . . . . . Anna Satcher Johnson, MPHTeam Supervisor
Quantitative Sciences and Data Management Branch . . . . . . . . . . . . . . Timothy A. Green, PhDChief
Health Resources and Services Administration . . . . . . . . . . . . . . . . . . . . . . . . George Sigounas, PhD, MS Administrator
Health Resources and Services Administration, HIV/AIDS Bureau . . . . . . . . . . . . . Laura Cheever, MD, ScMAssociate Administrator
Health Resources and Services Administration, HIV/AIDS Bureau . . . . . . . . . Heather Hauck, MSW, LICSWDeputy Associate Administrator
Health Resources and Services Administration, HIV/AIDS Bureau . . . . . . . . . . . . . Antigone Dempsey, MEdDirector, Division of Policy and Data
Health Resources and Services Administration, HIV/AIDS Bureau . . . . . . . . . . . Tracy Matthews, MHA, RNDeputy Director, Division of Policy and Data
Health Resources and Services Administration, HIV/AIDS Bureau . . . . . . . . . . . . . . Steven R. Young, MSPHDirector, Division of Metropolitan HIV/AIDS Programs
Health Resources and Services Administration, HIV/AIDS Bureau . . . . . . . . . . . . . . Steven R. Young, MSPHActing Director, Division of State HIV/AIDS Programs
HIV Surveillance Supplemental Report 2 Vol. 23, No. 7
On the Web: http://www.cdc.gov/hiv/library/reports/hiv-surveillance.html.
Confidential information, referrals, and educational material on HIV infectionCDC-INFO1-800-232-4636 (in English, en Español)1-888-232-6348 (TTY)http://wwwn.cdc.gov/dcs/ContactUs/Form
Acknowledgments
Publication of this report was made possible by the contributions of the state and territorial health departments and the HIV surveillance programs that provided surveillance data to CDC.
HIV Surveillance Supplemental Report 3 Vol. 23, No. 7

Contents
Commentary 5
Technical Notes 8
References 9
Tables
1 Reported AIDS cases and persons reported living with diagnosed HIV infection ever classified as AIDS, by area of residence, 2012–2016 and as of December 2016—eligible metropolitan areas and transitional grant areas for the Ryan White HIV/AIDS Program
10
2 Reported AIDS cases and persons reported living with diagnosed HIV infection ever classified as AIDS, by area of residence, 2012–2016 and as of December 2016—emerging communities for the Ryan White HIV/AIDS Program
12
3 Reported number of persons living with diagnosed HIV infection non-AIDS, infection ever classified as AIDS, and total, by area of residence, as of December 2016—United States and dependent areas for the Ryan White HIV/AIDS Program
13
4 Reported number of persons living with diagnosed HIV infection non-AIDS, infection ever classified as AIDS, and total, by area of residence, as of December 2016—eligible metropolitan areas and transitional grant areas for the Ryan White HIV/AIDS Program
15
5 Reported number of persons living with diagnosed HIV infection non-AIDS, infection ever classified as AIDS, and total, by area of residence, as of December 2016—emerging communities for the Ryan White HIV/AIDS Program
17
HIV Surveillance Supplemental Report 4 Vol. 23, No. 7

Commentary
The Ryan White HIV/AIDS Program (RWHAP) is administered by the U.S. Department of Health and Human Services (HHS), Health Resources and Ser-vices Administration (HRSA), HIV/AIDS Bureau (HAB). The Ryan White Comprehensive AIDS Resources Emergency (CARE) Act was passed by Congress in 1990 to address the crisis of the HIV epi-demic in the United States. This legislation has been amended and reauthorized 4 times: in 1996, 2000, 2006, and most recently in 2009 as the Ryan White HIV/AIDS Treatment Extension Act of 2009. More information about the legislation and its history is available from HRSA HAB at https://hab.hrsa.gov/about-ryan-white-hivaids-program/.
For the implementation of the RWHAP Metropoli-tan (Part A) and State (Part B) programs, HRSA HAB and the Centers for Disease Control and Prevention (CDC) collaborate to ensure the appropriate HIV and AIDS surveillance data are used in determining eligi-bility and funding allocation amounts. In FY 2018, HRSA used total counts of persons living with diag-nosed HIV infection non-AIDS and persons living with infection ever classified as AIDS to calculate funding allocation amounts for eligible jurisdictions. For FY 2018, CDC provided HRSA with data files containing this information through calendar year 2016 for all jurisdictions. The number of persons liv-ing with diagnosed HIV infection non-AIDS and the number of persons living with infection ever classified as AIDS were added together to arrive at the total num-ber of persons living with diagnosed HIV infection non-AIDS and infection ever classified as AIDS for each eligible area: eligible metropolitan area (EMA), transitional grant area (TGA), emerging community (EC), state, and territory. These totals were used in the RWHAP Parts A and B funding formula calculations.
RWHAP PART A FUNDING
For the RWHAP Part A funding formula, HRSA con-tinues to use cumulative cases of AIDS reported to and confirmed by the Director of CDC for the most recent 5 calendar years for which such data are available to determine eligibility, as instructed by the RWHAP statute. RWHAP Part A has 2 categories of grantees:
HIV Surveillance Supplemental Report 5
EMAs and TGAs. EMAs are defined as jurisdictions that have a cumulative total of more than 2,000 AIDS cases reported to and confirmed by the Director of CDC during the most recent 5 calendar years for which such data are available and a minimum population of 50,000 persons. An area will continue to be an EMA unless it fails to meet both of the following require-ments for 3 consecutive fiscal years: (a) a cumulative total of more than 2,000 AIDS cases reported to and confirmed by the Director of CDC during the most recent period of 5 calendar years for which such data are available, and (b) a cumulative total of 3,000 or more persons living with HIV infection ever classified as AIDS reported to and confirmed by the Director of CDC as of December 31 of the most recent calendar year for which such data are available. In FY 2018, there were 24 EMAs.
The other category of Part A grantees, TGAs, are defined as those jurisdictions that have a cumulative total of at least 1,000 but fewer than 2,000 AIDS cases reported to and confirmed by the Director of CDC during the most recent 5 calendar years for which such data are available and a minimum population of 50,000 persons. An area will remain a TGA unless it fails to meet both of the following requirements for 3 consecutive fiscal years: (a) a cumulative total of at least 1,000 but fewer than 2,000 cases of AIDS reported to and confirmed by the Director of CDC during the most recent period of 5 calendar years for which such data are available, and (b) a cumulative total of 1,500 or more persons living with HIV infec-tion ever classified as AIDS reported to and confirmed by the Director of CDC as of December 31 of the most recent calendar year for which such data are available. Provisions in the RWHAP statute provided for a mod-ification beginning in FY 2009: in the case where a metropolitan area has a cumulative total of at least 1,400 but fewer than 1,500 persons living with HIV infection ever classified as AIDS as of December 31 of the most recent calendar year for which such data are available, such area shall be treated as having met criterion (b) as long as the area did not have more than 5% unobligated balance as of the most recent fiscal year for which such data are available. Areas that have fallen below either or both of the required TGA thresh-
Vol. 23, No. 7

olds, but that continue to be eligible per the RWHAP statute because they must fail both criteria for three consecutive years remain designated as TGAs and are presented in the TGA tables. For FY 2018, there were 28 TGAs.
The geographic boundaries for all jurisdictions that received Part A funding in FY 2018—both EMAs and TGAs—are those metropolitan statistical area (MSA) boundaries determined by the Office of Management and Budget (OMB) for use in federal statistical activi-ties that were in effect when they were initially funded under Part A [1–3]. For all newly eligible areas, of which there were none in FY 2018, the boundaries are based on current MSA boundary definitions deter-mined by OMB [1–3].
Minority AIDS Initiative (MAI) formula funds for Part A are awarded based on the reported number of minority persons living with diagnosed HIV infection non-AIDS and infection ever classified as AIDS reported through the end of the most recent calendar year as confirmed by the Director of CDC. Data for MAI formula funds are not included in this report.
RWHAP PART B FUNDING
RWHAP Part B and AIDS Drug Assistance Program (ADAP) funds are awarded via 3 separate grant award processes: the RWHAP Part B Formula award, the RWHAP Part B Supplemental award, and the RWHAP Part B ADAP Emergency Relief Fund (ERF) award. The RWHAP Part B HIV Care Pro-gram grant award has a five-year project period and is determined by a legislatively mandated funding formula process. The award includes the following 5 components: Base award, ADAP Base award, MAI award (for eligible states), Emerging Commu-nities award (for eligible states), and ADAP Supple-mental award (for those states that HRSA deems eligible and that choose to apply). The RWHAP Part B Supplemental grant is a one-year competitive award for states that demonstrate the need for addi-tional RWHAP Part B funds. The ADAP ERF grant is also a one-year competitive award. These funds are used to help states prevent, reduce, or eliminate ADAP waiting lists and/or to implement ADAP-related cost-containment measures.
RWHAP Part B HIV Care Program Grant
For the RWHAP Part B Base, ADAP Base, MAI, ADAP Supplemental, and Emerging Communities
HIV Surveillance Supplemental Report 6
funding formula, HRSA continues to use cumulative cases of persons living with diagnosed HIV infection non-AIDS and infection ever classified as AIDS in the state or territory through the end of the most recent cal-endar year as confirmed by the Director of CDC, as instructed by the RWHAP statute. The RWHAP Part B Base formula is a weighted relative distribution that also takes into account RWHAP Part A funding. Simi-larly, for recipients applying for MAI formula funds, awards are based on the reported number of racial/ethnic minorities living with diagnosed HIV infection non-AIDS and infection ever classified as AIDS reported through the end of the most recent calendar year as confirmed by the Director of CDC. Data for MAI formula funds are not included in this report. ADAP Supplemental grants are awarded by the same formula as ADAP Base to states that meet any of the criteria listed in that section of the Notice of Funding Opportunity Announcement for the purpose of provid-ing medications or insurance assistance for persons liv-ing with HIV infection.
RWHAP Part B Emerging Communities eligibility is determined based on the number of persons living with HIV infection ever classified as AIDS in that jurisdiction. ECs are defined as metropolitan areas for which there have been at least 500 but fewer than 1,000 AIDS cases reported to and confirmed by the Director of CDC during the most recent 5 calendar years for which such data are available. An area will remain an EC unless it fails to meet both of the follow-ing requirements for 3 consecutive fiscal years: (a) a cumulative total of at least 500 but fewer than 1,000 cases of AIDS reported to and confirmed by the Direc-tor of CDC during the most recent period of 5 calendar years for which such data are available, and (b) a cumulative total of 750 or more persons living with HIV infection ever classified as AIDS reported to and confirmed by the Director of CDC as of December 31st of the most recent year for which such data are available. As with EMAs and TGAs, the geographic boundaries for ECs are those that were determined by OMB and that were in effect when initially funded.
RWHAP Part B Supplemental and ADAP ERF Grants
RWHAP Part B Supplemental and ADAP ERF grants are awarded to states demonstrating the severity of the burden of HIV infection and the need for additional federal assistance. The funds are intended to supple-
Vol. 23, No. 7

ment the services otherwise provided by the state. All submitted applications for RWHAP Part B Supple-mental and ADAP ERF competitive grants are reviewed and ranked by an external objective review committee (ORC); the highest-ranked applications receive consideration for award within available fund-ing ranges. States and territories applying for RWHAP Part B Supplemental funds must provide quantifiable data on HIV epidemiology, comorbidities, cost of care, the service needs of emerging populations, unmet need for core medical services, and unique service delivery challenges.
HIV Surveillance Supplemental Report 7
Vol. 23, No. 7
Technical Notes
In October 2009, Congress enacted amendments to the Ryan White HIV/AIDS Program (RWHAP) legis-lation. The RWHAP legislation specifies the use of surveillance data on persons living with diagnosed HIV infection non-AIDS and infection ever classified as AIDS to determine formula funding for RWHAP Parts A and B HIV care and services programs. RWHAP authorizes the Centers for Disease Control and Prevention (CDC) to provide HIV infection non-AIDS and AIDS case surveillance data to the Health Resources and Services Administration (HRSA) for use in their funding formula for all jurisdictions.
As of December 2016, CDC was not accepting HIV case data from the Marshall Islands and the Federated States of Micronesia as their surveillance systems had not yet been certified. However, in the event that another jurisdiction reported cases that were diag-nosed in either the Marshall Islands or the Federated States of Micronesia, the cases would be reflected in the data that CDC sends to HRSA annually.
DATA REQUIREMENTS AND DEFINITIONS
Case counts in all tables are presented by residence at earliest HIV diagnosis for persons with diagnosed HIV infection non-AIDS and residence at earliest AIDS diagnosis for persons with infection ever classi-fied as AIDS. Data are presented by date of report rather than date of diagnosis (e.g., reported AIDS cases in the last 5 years). Boundaries for eligible met-ropolitan areas (EMAs) and transitional grant areas (TGAs) that became eligible prior to FY 2007 are based on the Office of Management and Budget (OMB) metropolitan statistical area (MSA) delinea-tions that were in effect for such areas for FY 1994 (additional information on historical delineations is available at http://www.census.gov/geographies/reference-files/time-series/demo/metro-micro/historical-delineation-files.html). Boundaries for EMAs, TGAs, and emerging communities (ECs) that became eligible after 2006 are determined using applicable OMB definitions based on the year of first eligibility.
HIV Surveillance Supplemental Report 8
Reported persons living with diagnosed HIV infec-tion non-AIDS or infection ever classified as AIDS are defined as persons reported as “alive” at last update.
HIV infection non-AIDS cases and AIDS case data reported from CDC met the CDC surveillance case definitions published in the 2008 revised sur-veillance case definitions for HIV infection among adults, adolescents, and children <18 months and for HIV infection and AIDS among children aged 18 months to <13 years [4].
Vol. 23, No. 7

References
1. Office of Management and Budget. Standards for defining metropolitan and micropolitan statistical areas. Federal Register 2000;65(249):82228–82238. http://www.gpo.gov/fdsys/pkg/FR-2000-12-27/pdf/00-32997.pdf. Published December 27, 2000. Accessed October 30, 2018.
2. Office of Management and Budget. Revised definitions of metropolitan statistical areas, new definitions of micropolitan statistical areas and combined statistical areas, and guidance on uses of the statistical definitions of these areas. OMB Bulletin 03-04. http://www.whitehouse.gov/wp-content/uploads/2017/11/bulletins_b03-04.pdf. Published June 6, 2003. Accessed October 30, 2018.
3. Office of Management and Budget. Update of statisti-cal area definitions and guidance on their uses. OMB Bulletin 10-02. http://www.whitehouse.gov/sites/whitehouse.gov/files/omb/bulletins/2010/b10-02.pdf. Published December 1, 2009. Accessed October 30, 2018.
4. CDC [Schneider E, Whitmore S, Glynn MK, Domin-guez K, Mitsch A, McKenna MT]. Revised surveil-lance case definitions for HIV infection among adults, adolescents, and children aged <18 months and for HIV infection and AIDS among children aged 18 months to <13 years—United States 2008. MMWR 2008;57(RR-10):1–12.
HIV Surveillance Supplemental Report 9
Vol. 23, No. 7
Table 1. Reported AIDS cases and persons reported living with diagnosed HIV infection ever classified as AIDS, by area of residence, 2012–2016 and as of December 2016—eligible metropolitan areas and transitional grant areas for the Ryan White HIV/AIDS Program
Reported AIDS cases2012–2016
Persons reported living with diagnosed HIV infection ever
classified as AIDS (as of December 2016)
Area of residence No. No.
Eligible metropolitan areas (EMAs)
Atlanta–Sandy Springs–Marietta, Georgia 7,257 16,336
Baltimore, Maryland 2,363 10,262
Boston–Brockton–Nashua, Massachusetts–New Hampshire 1,990 9,910
Chicago, Illinois 3,709 16,250
Dallas, Texas 2,942 10,769
Detroit, Michigan 1,490 5,720
Fort Lauderdale, Florida 1,832 9,405
Houston, Texas 3,814 14,592
Los Angeles–Long Beach, California 5,148 28,014
Miami, Florida 2,893 14,645
Nassau–Suffolk, New York 687 3,647
New Haven–Bridgeport–Danbury–Waterbury, Connecticut 537 4,039
New Orleans, Louisiana 1,124 4,586
New York, New York 8,105 62,929
Newark, New Jersey 1,442 7,145
Orlando, Florida 1,544 5,931
Philadelphia, Pennsylvania–New Jersey 2,552 13,928
Phoenix–Mesa, Arizona 1,202 5,109
San Diego, California 1,229 7,410
San Francisco, California 1,128 10,905
San Juan–Bayamon, Puerto Rico 1,265 6,421
Tampa–St. Petersburg–Clearwater, Florida 1,694 6,486
Washington, DC–Maryland–Virginia–West Virginia 4,142 19,094
West Palm Beach–Boca Raton, Florida 948 4,985
Transitional grant areas (TGAs)
Austin–San Marcos, Texas 698 3,113
Baton Rouge, Louisiana 864 2,706
Bergen–Passaic, New Jersey 514 2,488
Charlotte–Gastonia–Concord, North Carolina–South Carolina 1,224 2,981
Cleveland–Lorain–Elyria, Ohio 510 2,550
Columbus, Ohio 740 2,425
Denver, Colorado 679 3,955
Fort Worth–Arlington, Texas 868 2,746
Hartford, Connecticut 350 2,337
Indianapolis, Indiana 621 2,584
Jacksonville, Florida 1,037 3,836
Jersey City, New Jersey 580 2,929
HIV Surveillance Supplemental Report 10 Vol. 23, No. 7
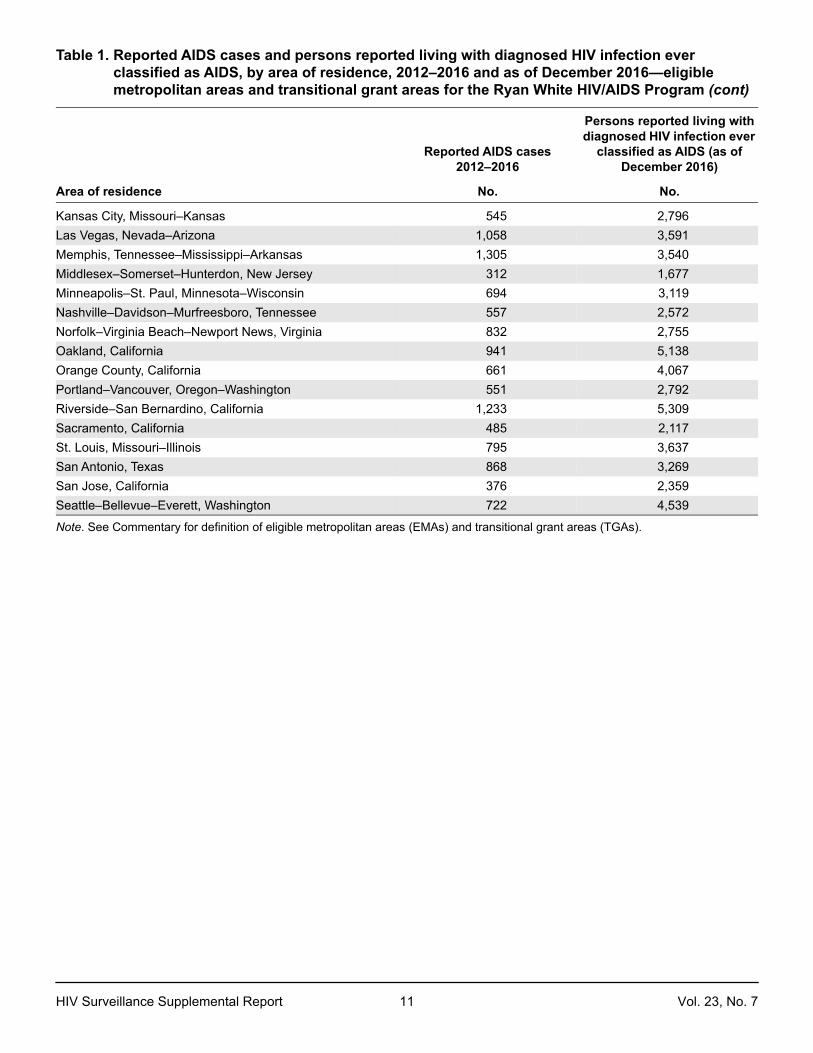
Note. See Commentary for definition of eligible metropolitan areas (EMAs) and transitional grant areas (TGAs).
Kansas City, Missouri–Kansas 545 2,796
Las Vegas, Nevada–Arizona 1,058 3,591
Memphis, Tennessee–Mississippi–Arkansas 1,305 3,540
Middlesex–Somerset–Hunterdon, New Jersey 312 1,677
Minneapolis–St. Paul, Minnesota–Wisconsin 694 3,119
Nashville–Davidson–Murfreesboro, Tennessee 557 2,572
Norfolk–Virginia Beach–Newport News, Virginia 832 2,755
Oakland, California 941 5,138
Orange County, California 661 4,067
Portland–Vancouver, Oregon–Washington 551 2,792
Riverside–San Bernardino, California 1,233 5,309
Sacramento, California 485 2,117
St. Louis, Missouri–Illinois 795 3,637
San Antonio, Texas 868 3,269
San Jose, California 376 2,359
Seattle–Bellevue–Everett, Washington 722 4,539
Table 1. Reported AIDS cases and persons reported living with diagnosed HIV infection ever classified as AIDS, by area of residence, 2012–2016 and as of December 2016—eligible metropolitan areas and transitional grant areas for the Ryan White HIV/AIDS Program (cont)
Reported AIDS cases2012–2016
Persons reported living with diagnosed HIV infection ever
classified as AIDS (as of December 2016)
Area of residence No. No.
HIV Surveillance Supplemental Report 11 Vol. 23, No. 7
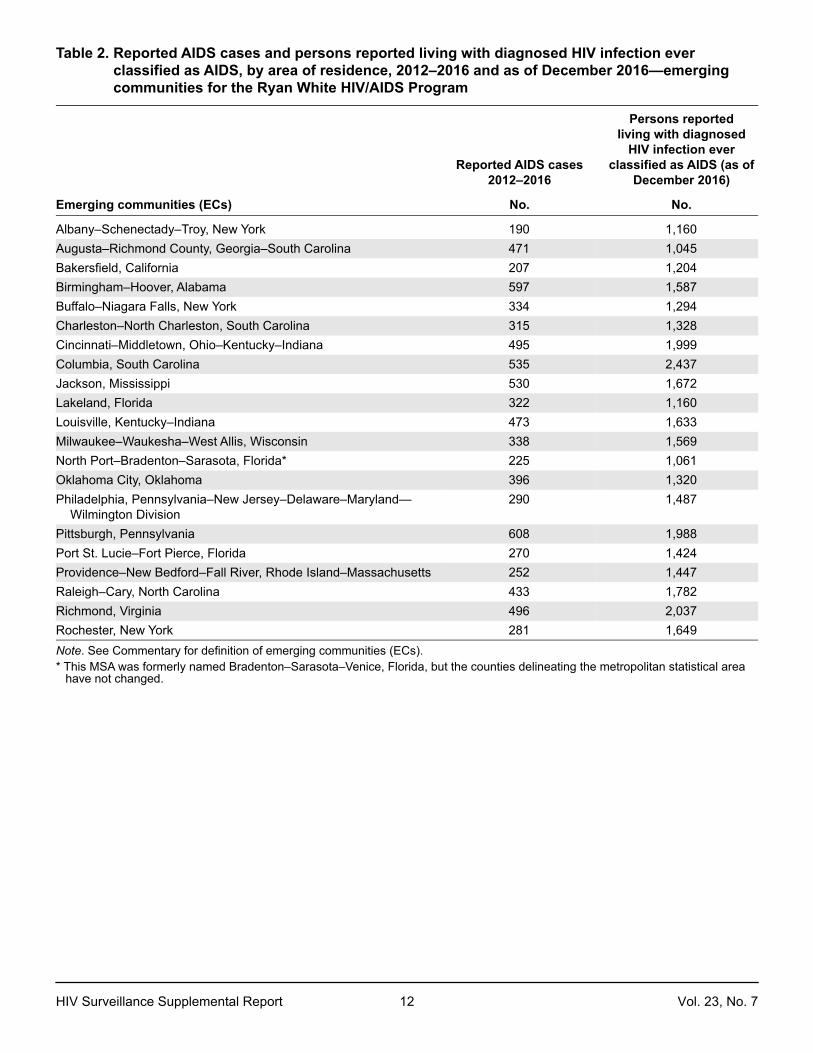
Note. See Commentary for definition of emerging communities (ECs).* This MSA was formerly named Bradenton–Sarasota–Venice, Florida, but the counties delineating the metropolitan statistical area
have not changed.
Table 2. Reported AIDS cases and persons reported living with diagnosed HIV infection ever classified as AIDS, by area of residence, 2012–2016 and as of December 2016—emerging communities for the Ryan White HIV/AIDS Program
Reported AIDS cases2012–2016
Persons reported living with diagnosed
HIV infection ever classified as AIDS (as of
December 2016)
Emerging communities (ECs) No. No.
Albany–Schenectady–Troy, New York 190 1,160
Augusta–Richmond County, Georgia–South Carolina 471 1,045
Bakersfield, California 207 1,204
Birmingham–Hoover, Alabama 597 1,587
Buffalo–Niagara Falls, New York 334 1,294
Charleston–North Charleston, South Carolina 315 1,328
Cincinnati–Middletown, Ohio–Kentucky–Indiana 495 1,999
Columbia, South Carolina 535 2,437
Jackson, Mississippi 530 1,672
Lakeland, Florida 322 1,160
Louisville, Kentucky–Indiana 473 1,633
Milwaukee–Waukesha–West Allis, Wisconsin 338 1,569
North Port–Bradenton–Sarasota, Florida* 225 1,061
Oklahoma City, Oklahoma 396 1,320
Philadelphia, Pennsylvania–New Jersey–Delaware–Maryland—Wilmington Division
290 1,487
Pittsburgh, Pennsylvania 608 1,988
Port St. Lucie–Fort Pierce, Florida 270 1,424
Providence–New Bedford–Fall River, Rhode Island–Massachusetts 252 1,447
Raleigh–Cary, North Carolina 433 1,782
Richmond, Virginia 496 2,037
Rochester, New York 281 1,649
HIV Surveillance Supplemental Report 12 Vol. 23, No. 7
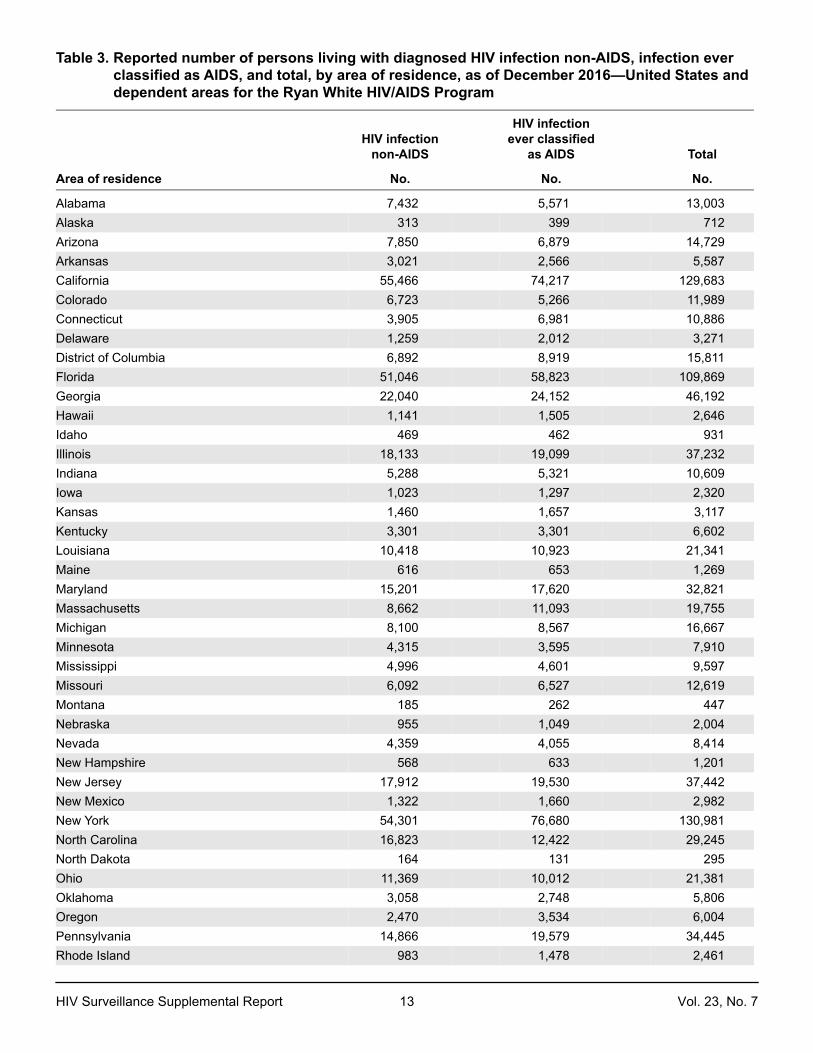
Table 3. Reported number of persons living with diagnosed HIV infection non-AIDS, infection ever classified as AIDS, and total, by area of residence, as of December 2016—United States and dependent areas for the Ryan White HIV/AIDS Program
HIV infection non-AIDS
HIV infection ever classified
as AIDS Total
Area of residence No. No. No.
Alabama 7,432 5,571 13,003
Alaska 313 399 712
Arizona 7,850 6,879 14,729
Arkansas 3,021 2,566 5,587
California 55,466 74,217 129,683
Colorado 6,723 5,266 11,989
Connecticut 3,905 6,981 10,886
Delaware 1,259 2,012 3,271
District of Columbia 6,892 8,919 15,811
Florida 51,046 58,823 109,869
Georgia 22,040 24,152 46,192
Hawaii 1,141 1,505 2,646
Idaho 469 462 931
Illinois 18,133 19,099 37,232
Indiana 5,288 5,321 10,609
Iowa 1,023 1,297 2,320
Kansas 1,460 1,657 3,117
Kentucky 3,301 3,301 6,602
Louisiana 10,418 10,923 21,341
Maine 616 653 1,269
Maryland 15,201 17,620 32,821
Massachusetts 8,662 11,093 19,755
Michigan 8,100 8,567 16,667
Minnesota 4,315 3,595 7,910
Mississippi 4,996 4,601 9,597
Missouri 6,092 6,527 12,619
Montana 185 262 447
Nebraska 955 1,049 2,004
Nevada 4,359 4,055 8,414
New Hampshire 568 633 1,201
New Jersey 17,912 19,530 37,442
New Mexico 1,322 1,660 2,982
New York 54,301 76,680 130,981
North Carolina 16,823 12,422 29,245
North Dakota 164 131 295
Ohio 11,369 10,012 21,381
Oklahoma 3,058 2,748 5,806
Oregon 2,470 3,534 6,004
Pennsylvania 14,866 19,579 34,445
Rhode Island 983 1,478 2,461
HIV Surveillance Supplemental Report 13 Vol. 23, No. 7

Note. The number of cases shown in the Total column was used by the Health Resources and Services Administration in FY 2018 funding calculations.* See Technical Notes regarding data reported for these jurisdictions.
South Carolina 7,726 8,987 16,713
South Dakota 307 233 540
Tennessee 8,794 8,440 17,234
Texas 40,012 44,460 84,472
Utah 1,273 1,502 2,775
Vermont 221 279 500
Virginia 12,431 10,455 22,886
Washington 5,733 6,762 12,495
West Virginia 820 950 1,770
Wisconsin 2,990 2,830 5,820
Wyoming 146 165 311
American Samoa 0 1 1
Federated States of Micronesia* 1 0 1
Guam 46 34 80
Marshall Islands* 0 1 1
Northern Mariana Islands 1 4 5
Palau 5 4 9
Puerto Rico 8,349 10,381 18,730
U.S. Virgin Islands 280 355 635
Table 3. Reported number of persons living with diagnosed HIV infection non-AIDS, infection ever classified as AIDS, and total, by area of residence, as of December 2016—United States and dependent areas for the Ryan White HIV/AIDS Program (cont)
HIV infection non-AIDS
HIV infection ever classified
as AIDS Total
Area of residence No. No. No.
HIV Surveillance Supplemental Report 14 Vol. 23, No. 7
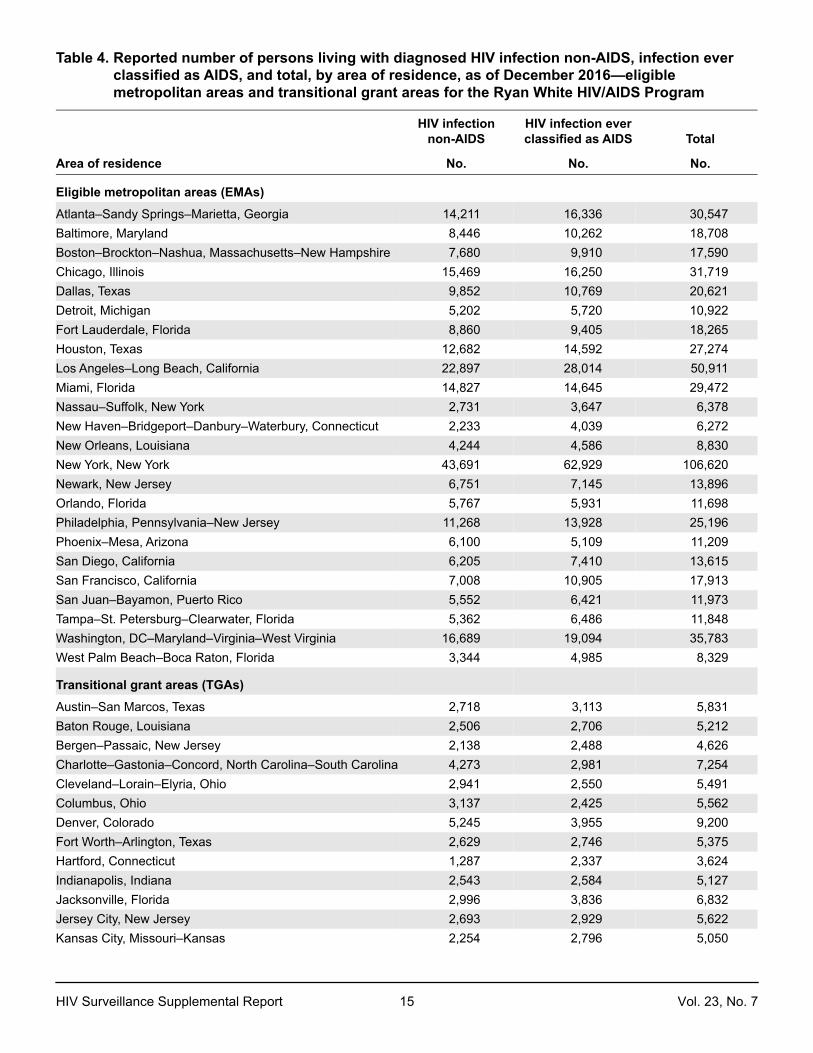
Table 4. Reported number of persons living with diagnosed HIV infection non-AIDS, infection ever classified as AIDS, and total, by area of residence, as of December 2016—eligible metropolitan areas and transitional grant areas for the Ryan White HIV/AIDS Program
HIV infection non-AIDS
HIV infection ever classified as AIDS Total
Area of residence No. No. No.
Eligible metropolitan areas (EMAs)
Atlanta–Sandy Springs–Marietta, Georgia 14,211 16,336 30,547
Baltimore, Maryland 8,446 10,262 18,708
Boston–Brockton–Nashua, Massachusetts–New Hampshire 7,680 9,910 17,590
Chicago, Illinois 15,469 16,250 31,719
Dallas, Texas 9,852 10,769 20,621
Detroit, Michigan 5,202 5,720 10,922
Fort Lauderdale, Florida 8,860 9,405 18,265
Houston, Texas 12,682 14,592 27,274
Los Angeles–Long Beach, California 22,897 28,014 50,911
Miami, Florida 14,827 14,645 29,472
Nassau–Suffolk, New York 2,731 3,647 6,378
New Haven–Bridgeport–Danbury–Waterbury, Connecticut 2,233 4,039 6,272
New Orleans, Louisiana 4,244 4,586 8,830
New York, New York 43,691 62,929 106,620
Newark, New Jersey 6,751 7,145 13,896
Orlando, Florida 5,767 5,931 11,698
Philadelphia, Pennsylvania–New Jersey 11,268 13,928 25,196
Phoenix–Mesa, Arizona 6,100 5,109 11,209
San Diego, California 6,205 7,410 13,615
San Francisco, California 7,008 10,905 17,913
San Juan–Bayamon, Puerto Rico 5,552 6,421 11,973
Tampa–St. Petersburg–Clearwater, Florida 5,362 6,486 11,848
Washington, DC–Maryland–Virginia–West Virginia 16,689 19,094 35,783
West Palm Beach–Boca Raton, Florida 3,344 4,985 8,329
Transitional grant areas (TGAs)
Austin–San Marcos, Texas 2,718 3,113 5,831
Baton Rouge, Louisiana 2,506 2,706 5,212
Bergen–Passaic, New Jersey 2,138 2,488 4,626
Charlotte–Gastonia–Concord, North Carolina–South Carolina 4,273 2,981 7,254
Cleveland–Lorain–Elyria, Ohio 2,941 2,550 5,491
Columbus, Ohio 3,137 2,425 5,562
Denver, Colorado 5,245 3,955 9,200
Fort Worth–Arlington, Texas 2,629 2,746 5,375
Hartford, Connecticut 1,287 2,337 3,624
Indianapolis, Indiana 2,543 2,584 5,127
Jacksonville, Florida 2,996 3,836 6,832
Jersey City, New Jersey 2,693 2,929 5,622
Kansas City, Missouri–Kansas 2,254 2,796 5,050
HIV Surveillance Supplemental Report 15 Vol. 23, No. 7
Note. See Commentary for definition of eligible metropolitan areas (EMAs) and transitional grant areas (TGAs).The number of cases shown in the Total column was used by the Health Resources and Services Administration in FY 2018 funding calculations.
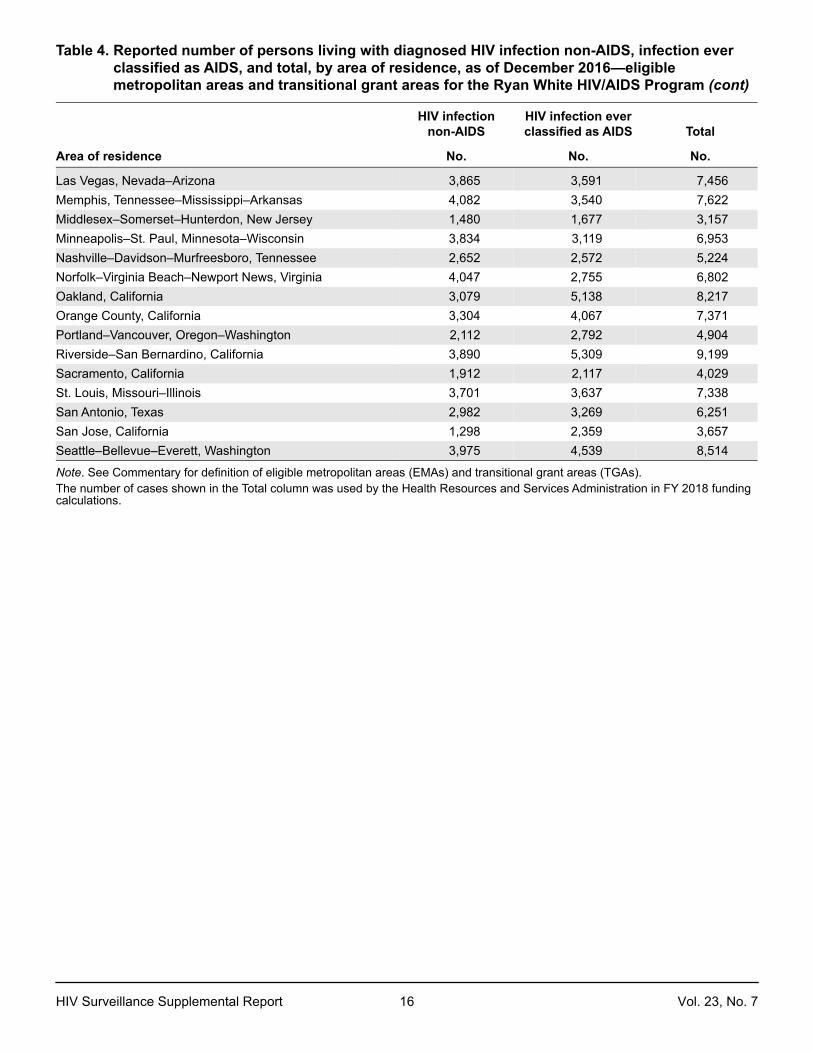
Las Vegas, Nevada–Arizona 3,865 3,591 7,456
Memphis, Tennessee–Mississippi–Arkansas 4,082 3,540 7,622
Middlesex–Somerset–Hunterdon, New Jersey 1,480 1,677 3,157
Minneapolis–St. Paul, Minnesota–Wisconsin 3,834 3,119 6,953
Nashville–Davidson–Murfreesboro, Tennessee 2,652 2,572 5,224
Norfolk–Virginia Beach–Newport News, Virginia 4,047 2,755 6,802
Oakland, California 3,079 5,138 8,217
Orange County, California 3,304 4,067 7,371
Portland–Vancouver, Oregon–Washington 2,112 2,792 4,904
Riverside–San Bernardino, California 3,890 5,309 9,199
Sacramento, California 1,912 2,117 4,029
St. Louis, Missouri–Illinois 3,701 3,637 7,338
San Antonio, Texas 2,982 3,269 6,251
San Jose, California 1,298 2,359 3,657
Seattle–Bellevue–Everett, Washington 3,975 4,539 8,514
Table 4. Reported number of persons living with diagnosed HIV infection non-AIDS, infection ever classified as AIDS, and total, by area of residence, as of December 2016—eligible metropolitan areas and transitional grant areas for the Ryan White HIV/AIDS Program (cont)
HIV infection non-AIDS
HIV infection ever classified as AIDS Total
Area of residence No. No. No.
HIV Surveillance Supplemental Report 16 Vol. 23, No. 7

Note. See Commentary for definition of emerging communities (ECs).The number of cases shown in the Total column was used by the Health Resources and Services Administration in FY 2018 funding calculations.* This MSA was formerly named Bradenton–Sarasota–Venice, Florida, but the counties delineating the metropolitan statistical area
have not changed.
Table 5. Reported number of persons living with diagnosed HIV infection non-AIDS, infection ever classified as AIDS, and total, by area of residence, as of December 2016—emerging communities for the Ryan White HIV/AIDS Program
HIV infection non-AIDS
HIV infection ever classified as AIDS Total
Emerging communities (ECs) No. No. No.
Albany–Schenectady–Troy, New York 935 1,160 2,095
Augusta–Richmond County, Georgia–South Carolina 1,070 1,045 2,115
Bakersfield, California 837 1,204 2,041
Birmingham–Hoover, Alabama 2,373 1,587 3,960
Buffalo–Niagara Falls, New York 1,219 1,294 2,513
Charleston–North Charleston, South Carolina 1,231 1,328 2,559
Cincinnati–Middletown, Ohio–Kentucky–Indiana 2,118 1,999 4,117
Columbia, South Carolina 1,975 2,437 4,412
Jackson, Mississippi 1,811 1,672 3,483
Lakeland, Florida 869 1,160 2,029
Louisville, Kentucky–Indiana 1,794 1,633 3,427
Milwaukee–Waukesha–West Allis, Wisconsin 1,668 1,569 3,237
North Port–Bradenton–Sarasota, Florida* 787 1,061 1,848
Oklahoma City, Oklahoma 1,519 1,320 2,839
Philadelphia, Pennsylvania–New Jersey–Delaware–Maryland—Wilmington Division
935 1,487 2,422
Pittsburgh, Pennsylvania 1,420 1,988 3,408
Port St. Lucie–Fort Pierce, Florida 618 1,424 2,042
Providence–New Bedford–Fall River, Rhode Island–Massachusetts
961 1,447 2,408
Raleigh–Cary, North Carolina 2,028 1,782 3,810
Richmond, Virginia 2,652 2,037 4,689
Rochester, New York 1,356 1,649 3,005
HIV Surveillance Supplemental Report 17 Vol. 23, No. 7