hlib research lotte chemical titan (ipo note)jun 28, 2017 · manufacturing), operating in malaysia...
TRANSCRIPT
Page 1 of 13
28 June 2017
HLIB Research
PP 9484/12/2012 (031413)
Lotte Chemical Titan (IPO Note)
Oil & Gas Industry (NEUTRAL) INITIATION 28 June 2017
28 June 2017
Fair Value: RM7.39
IPO Price: RM8.00
A Titan at its peak
Highlights
Lotte Chemical Titan (LCT) is an integrated producer of olefin and polyolefin (raw material for plastic product manufacturing), operating in Malaysia and Indonesia, using
oil-based naphtha as its feedstock. In addition, it also produces other derivative products including butadiene, TBA, benzene and toluene.
Indonesia Integrated Petrochemical Facility. Out of the total IPO proceeds worth RM5.8bn, RM4.9bn would be spent on an integrated facility in Merak, Indonesia. It would be built
next to its existing Indonesian plants and the new facility would be able to feed all of the existing facilities with ethylene (feedstock for polyethylene). Out of the 1000KTA new
ethylene capacity, 450 KTA would be feed into existing facility (cost savings) and remaining 560KTA would be sold to 3rd party. Earnings impact would only come in 2023.
TE3 and PP3 project. TE3 project involves the extension on its current facilities in Malaysia and it would be completed in 2H17. PP3 (new propylene plant) will be completed in 2H18.
Overall, the group’s capacity would be improved by 15-20% approximately depending on market conditions. That aside, current idling OCU plant (which produces propylene) would
be ramped up to produce feedstock for PP3 plant.
Product spread appears toppish. Post 2017, global polyolefin capacity surplus over demand is expected to widen
further due to US shale-based capacity expansion and methanol-based China capacity additions. Nexant has forecasted cash margin (product spread) for petrochemicals
in Asia to narrow in 2018 (lower petrochemical production profitability). Our argument is further supported by significant expected capacity addition in ASEAN by 2020, with PCHEM
adding 1.4m MT polyolefin capacity while SCG would add another 1.4m MT.
Risks Cyclicality of product spreads resulting in highly volatile
margins.
Cost overrun on incoming expansion plan.
Spike in oil price.
Earnings We expect core net profit CAGR of -4.8% over the period of 2017-2019. This is premised on the assumptions of (i) gradually lower revenue/MT (ii) narrowing EBITDA margin
from 25.6% to 19.1% caused of lower expectation of product spread due to global capacity expansion and (iii) 7% growth in product volume (3-year CAGR) after factoring in TE3 and
PP3 capacity. US shale gas JV earnings are not factored in.
Valuation We believe that LCT should be fairly priced at RM7.39 pegged to 12x FY18 PER. It is valued significantly lower than
its Malaysian peer, PCHEM (NOT RATED), which is currently valued at 16x PER due to (i) smaller size compared to PCHEM (ii) higher volatility in product spread due to its
naphtha-based feedstock (highly correlated to oil price) compared to PCHEM which uses ethane (gas-based feedstock) which is more stable and (iii) lower EBITDA
margin.
Lim Sin Kiat [email protected]
(603) 2176 2656
Share price
Indicative IPO Price RM8.00
Details of IPO Offerings
Offer for Sales (‘000 Shares) 740,483 - Bumiputra institutional 283,852 - Institutional investors 400,848 - Directors, Employees &busi.
associates 6,417 - Public investors 49,366
IPO Timetable
16 June 2017 Issuance of Prospectus/
Opening date of IPO
28 June 2017 Closing date of retail offering
29 June 2017 Closing of institutional offering
3 July 2017 Date of balloting of applications
7 July 2017 Date for allotment of IPO shares
11 July 2017 Listing date
Post IPO Major Shareholders
Lotte Chemical Corporation 70.0%
Summary Earnings Table
FYE Dec (RM m ) FY16A FY17E FY18F FY19F Turnover 8,137 8,182 9,960 9,711 EBITDA 2,086 2,190 2,615 2,334 Pre-tax Profit 1,710 1,639 1,900 1,500 Rpt. net profit 1,315 1,310 1,519 1,200 Norm. net profit 1,391 1,310 1,519 1,200 Rpt. EPS (sen) 53.3 53.1 61.6 48.6 Norm. EPS (sen) 56.4 53.1 61.6 48.6 P/E (x) 14.2 15.1 13.0 16.5 Book Value (RM) 3.2 5.9 6.2 6.4 P/B (x) 2.5 1.4 1.3 1.2 Net Dvd Yield (% ) 0.0 3.3 3.8 3.0 Net Gearing (% ) N.C. N.C. N.C. N.C. ROE (% ) 17.50 9.02 9.94 7.55 ROA (% ) 14.89 8.25 9.05 6.89 HLIB
HLIB Research | Lotte Chemical Titan
www.hlebroking.com
Page 2 of 13
28 June 2017
Lotte Chemical Titan Business
Lotte Chemical Titan Holdings (LCT) is an integrated producer of olefin and polyolefin, predominantly using naphtha as feedstock (oil-based). It has 14 owned-facilities across
Malaysia and Indonesia
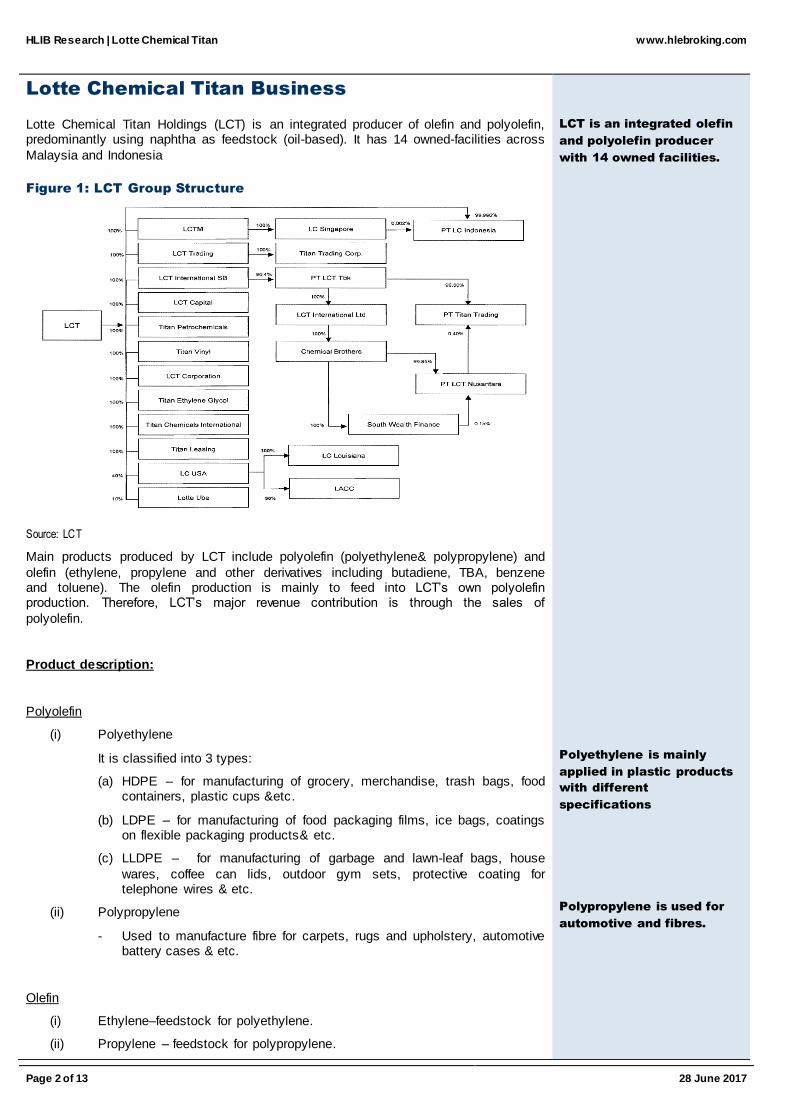
Figure 1: LCT Group Structure
Source: LCT
Main products produced by LCT include polyolefin (polyethylene& polypropylene) and
olefin (ethylene, propylene and other derivatives including butadiene, TBA, benzene and toluene). The olefin production is mainly to feed into LCT’s own polyolefin production. Therefore, LCT’s major revenue contribution is through the sales of
polyolefin.
Product description:
Polyolefin
(i) Polyethylene
It is classified into 3 types:
(a) HDPE – for manufacturing of grocery, merchandise, trash bags, food containers, plastic cups &etc.
(b) LDPE – for manufacturing of food packaging films, ice bags, coatings on flexible packaging products& etc.
(c) LLDPE – for manufacturing of garbage and lawn-leaf bags, house
wares, coffee can lids, outdoor gym sets, protective coating for telephone wires & etc.
(ii) Polypropylene
- Used to manufacture fibre for carpets, rugs and upholstery, automotive battery cases & etc.
Olefin
(i) Ethylene–feedstock for polyethylene.
(ii) Propylene – feedstock for polypropylene.
LCT is an integrated olefin
and polyolefin producer
with 14 owned facilities.
Polyethylene is mainly
applied in plastic products
with different
specifications
Polypropylene is used for
automotive and fibres.
HLIB Research | Lotte Chemical Titan
www.hlebroking.com
Page 3 of 13
28 June 2017
Derivatives
(i) Butadiene –to produce synthetic rubber.
(ii) TBA – solvent for ethanol, paint remover ingredient and octane booster for
gasoline.
(iii) Benzene – used in production of nylon, plastics, rubber and polystyrene.
(iv) Toulene – octane enhancer in gasoline, feedstock for Benzene.
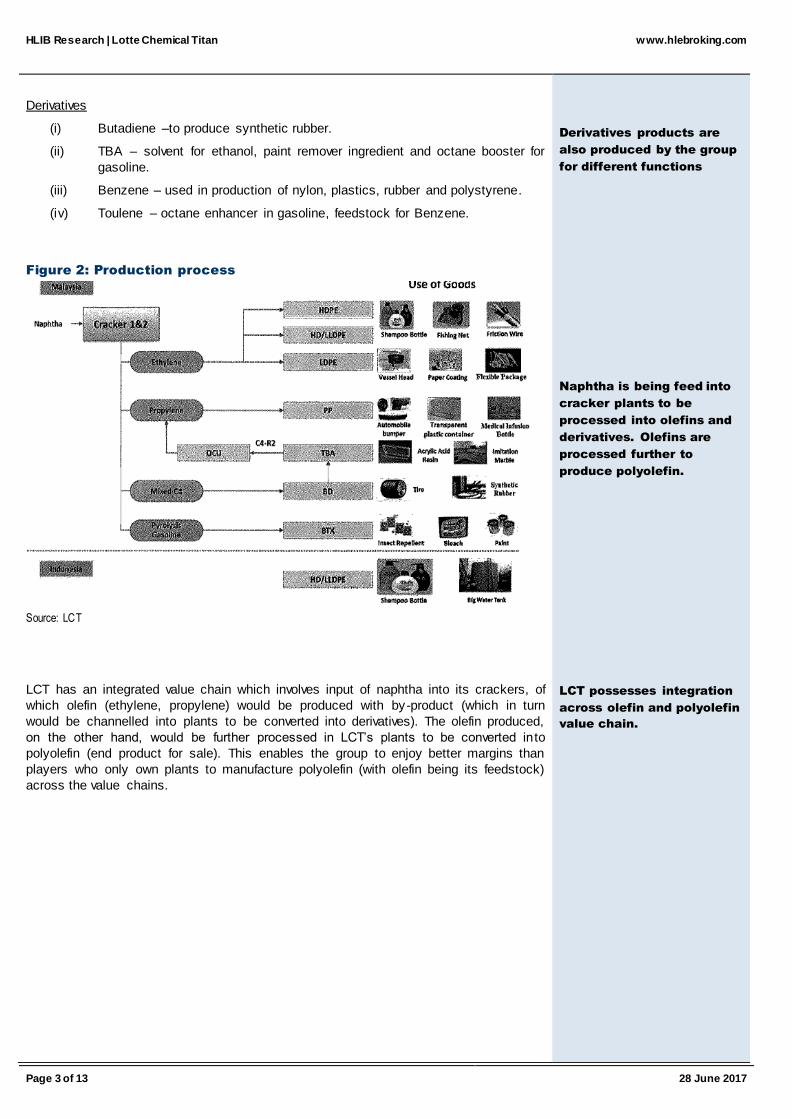
Figure 2: Production process
Source: LCT
LCT has an integrated value chain which involves input of naphtha into its crackers, of
which olefin (ethylene, propylene) would be produced with by-product (which in turn
would be channelled into plants to be converted into derivatives). The olefin produced,
on the other hand, would be further processed in LCT’s plants to be converted in to
polyolefin (end product for sale). This enables the group to enjoy better margins than
players who only own plants to manufacture polyolefin (with olefin being its feedstock)
across the value chains.
Derivatives products are
also produced by the group
for different functions
Naphtha is being feed into
cracker plants to be
processed into olefins and
derivatives. Olefins are
processed further to
produce polyolefin.
LCT possesses integration
across olefin and polyolefin
value chain.
HLIB Research | Lotte Chemical Titan
www.hlebroking.com
Page 4 of 13
28 June 2017
Business drivers
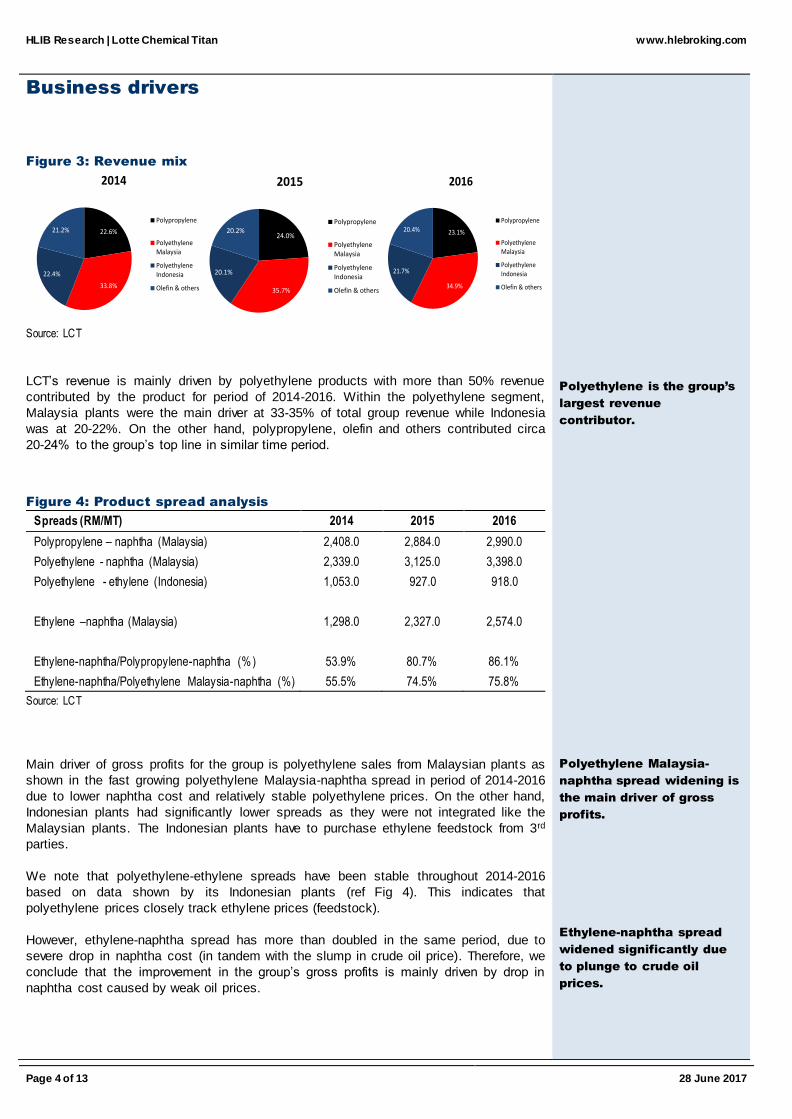
Figure 3: Revenue mix
Source: LCT
LCT’s revenue is mainly driven by polyethylene products with more than 50% revenue
contributed by the product for period of 2014-2016. Within the polyethylene segment,
Malaysia plants were the main driver at 33-35% of total group revenue while Indonesia
was at 20-22%. On the other hand, polypropylene, olefin and others contributed circa
20-24% to the group’s top line in similar time period.
Figure 4: Product spread analysis
Spreads (RM/MT) 2014 2015 2016
Polypropylene – naphtha (Malaysia) 2,408.0 2,884.0 2,990.0
Polyethylene - naphtha (Malaysia) 2,339.0 3,125.0 3,398.0
Polyethylene - ethylene (Indonesia) 1,053.0 927.0 918.0
Ethylene –naphtha (Malaysia) 1,298.0 2,327.0 2,574.0
Ethylene-naphtha/Polypropylene-naphtha (% ) 53.9% 80.7% 86.1%
Ethylene-naphtha/Polyethylene Malaysia-naphtha (%) 55.5% 74.5% 75.8%
Source: LCT
Main driver of gross profits for the group is polyethylene sales from Malaysian plants as
shown in the fast growing polyethylene Malaysia-naphtha spread in period of 2014-2016
due to lower naphtha cost and relatively stable polyethylene prices. On the other hand,
Indonesian plants had significantly lower spreads as they were not integrated like the
Malaysian plants. The Indonesian plants have to purchase ethylene feedstock from 3rd
parties.
We note that polyethylene-ethylene spreads have been stable throughout 2014-2016
based on data shown by its Indonesian plants (ref Fig 4). This indicates that
polyethylene prices closely track ethylene prices (feedstock).
However, ethylene-naphtha spread has more than doubled in the same period, due to
severe drop in naphtha cost (in tandem with the slump in crude oil price). Therefore, we
conclude that the improvement in the group’s gross profits is mainly driven by drop in
naphtha cost caused by weak oil prices.
Polyethylene is the group’s
largest revenue
contributor.
Polyethylene Malaysia-
naphtha spread widening is
the main driver of gross
profits.
Ethylene-naphtha spread
widened significantly due
to plunge to crude oil
prices.
22.6%
33.8%
22.4%
21.2%
2014
Polypropylene
PolyethyleneMalaysia
PolyethyleneIndonesia
Olefin & others
24.0%
35.7%
20.1%
20.2%
2015
Polypropylene
PolyethyleneMalaysia
PolyethyleneIndonesia
Olefin & others
23.1%
34.9%
21.7%
20.4%
2016
Polypropylene
PolyethyleneMalaysia
PolyethyleneIndonesia
Olefin & others
HLIB Research | Lotte Chemical Titan
www.hlebroking.com
Page 5 of 13
28 June 2017
Expansion plans post IPO
Integrated Petrochemical facility
LCT plans into invest RM15.5bn (partially funded by RM4.9bn from IPO proceeds) in an
integrated petrochemical facility in Merak, Indonesia, on a new piece of land located just
next to its existing polyolefin facility in Merak (current capacity of 450KTA). Once
completed, the integrated facility is expected to be able to supply 1000 KTA ethylene to
fully meet the requirements of its existing and also new polyolefin plants in Indonesia.
Upon completion, its existing 450KTA plants in Indonesia would be able to source all of
its ethylene feedstock from the new facility instead of from 3rd party suppliers, which in
turn would further improve its margins in Indonesia. The remaining 550KTA ethylene to
be produced from the new facility could be further sold off to the market, therefore
potentially doubling the group’s once the facility commence operations before new
polyethylene facilities are being set up within the existing site.
We do not anticipate major impact from this project in the next 4 years as the project is
currently still under feasibility studies while the expected commercial commencement is
in 2023. If executed according to stipulated plan, the facility is expected to contribute
significantly to the group’s earnings post 2023 but it would still be subject to long term
trend in product spreads, which are cyclical in nature (much dependant of oil price
movement).
TE3 project
The project in Malaysia (would be attached to existing NC2 plant in Pasir Gudang,
Johor) has already commenced since 2015 with RM1.2bn already funded by the group
itself. The remaining CAPEX of RM108.2m would be funded from the IPO proceeds.
The project would be completed in 2H17 and it would increase the group’s
ethylene/propylene/derivative capacity by 93/170/134 KTA. The expansion would allow
the group to restart its currently idle OCU plant (capable of producing propylene) with
additional selling volume dependent on market prices of propylene.
PP3 project
This project has commenced since March 2017 which involved construction of a new
polypropylene with an estimated cost of RM603.5m (to be funded entirely by IPO
proceeds). This project would complement TE3 project , of which its feedstock
(propylene) would be sourced from the idle OCU plant. This would increase the group’s
polypropylene capacity by 200KTA with commencement scheduled to be in 2H18.
RM4.9bn from IPO proceeds
would be utilised to fund
Indonesia Integrated
Petrochemical project.
The project would make
feedstock for its current
plants significantly
cheaper.
No impact in the near term
with commencement
scheduled in 2023
TE3 would allow more
ethylene and derivatives to
be produced in house,
allowing for cost savings in
polyolefin production.
PP3 would increase volume
of propylene sold and
utilised extra capacity from
TE3.
HLIB Research | Lotte Chemical Titan
www.hlebroking.com
Page 6 of 13
28 June 2017
CAPEX schedule
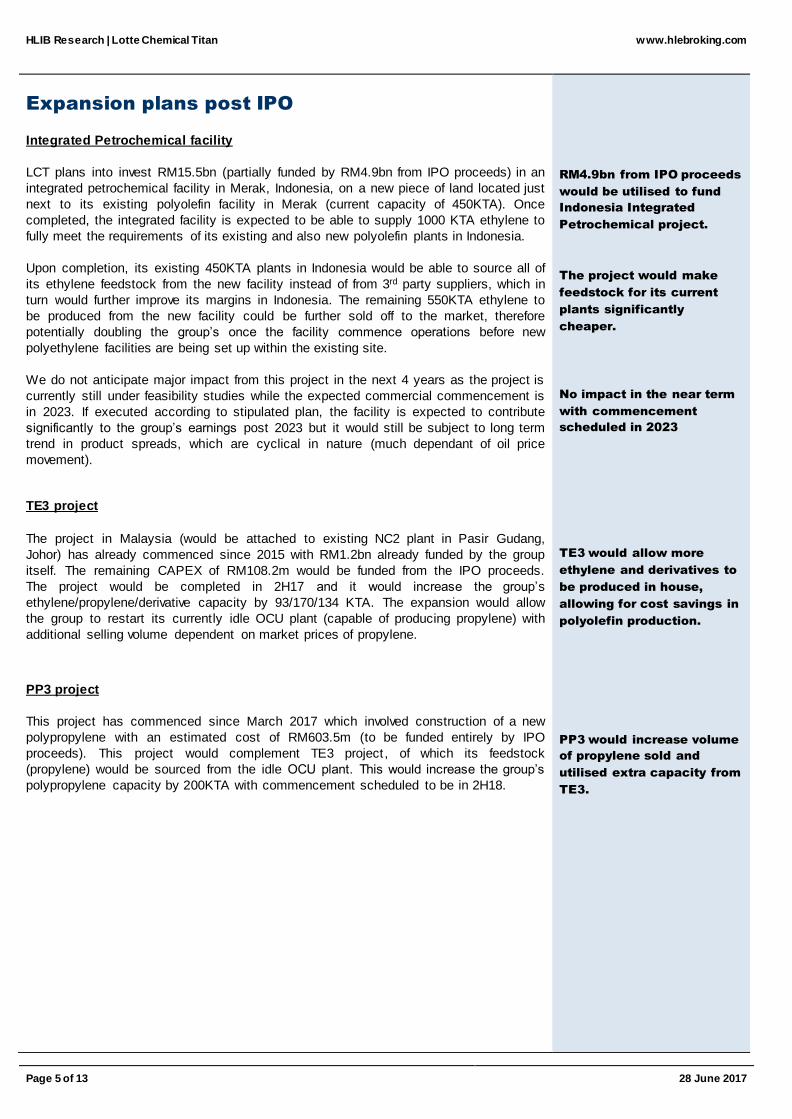
Figure 5: Projected CAPEX (RMm)
Source: LCT
CAPEX for the next 5 years (2017-2021) are expected to be RM16bn. Bulk of the CAPEX would consist of integrated petrochemical facility in Indonesia (RM15.1bn in
total), of which 67% of the CAPEX would be funded through borrowings. The group has net cash position of RM965.1m with net incoming IPO proceeds of RM5.8bn. Therefore, we believe the group is able to fund its CAPEX in the next 5 years without requiring
further equity cash call.
Investment in US shale gas JV
Cumulatively, the group has already injected RM2.2bn into LC USA, which is co-owned
by LCT (40%) and Lotte Chemical Corporation (60%). The CAPEX for the whole project is budgeted at RM11.9bn whereby RM5bn is equity financed while the remaining RM6.9bn is financed by syndicated loan facility. No further CAPEX commitments are
required by the group for the JV, therefore allaying our concerns of further cash requirements from the project.
Scheduled to begin in 1H19, the project involves a US MEG plant (700KTA MEG
production) and US ethane cracker plant (1000KTA ethylene) located in Louisiana, US. LCT’s entitled chemical production would be at 280KTA MEG and 360KTA ethylene.
To note, the US ethane cracker plant is only 90% owned by LC USA JV, whereby the
remaining 10% is owned by Axiall Corporation through Eagle US 2 LLC. An option is also given to Axiall Corporation to increase its stake in the cracker to 50% within 3 years from mechanical completion (scheduled to be in 2H18).
Why US?
While the project is not expected to provide any synergies to its current business, it
would provide the group with long term income flow with higher stability in margins compared to its existing business. To note, the US ethane cracker plant produces ethylene using ethane (gas-based) as feedstock instead of naphtha (oil-based). The
advantage of ethane-based plants (as compared to naphtha-based plants) are higher cash margin and significantly more stable feedstock costs.
CAPEX would be funded by
IPO proceeds and
borrowings, no equity cash
call expected.
RM2.2bn was invested into
LC USA for 40% stake, no
further CAPEX commitment
required.
1 MEG plant for final
product sales and 1 ethane
cracker plant for feedstock
of MEG plant.
US ethane cracker plant is
90% owed by LC USA, while
Axiall has 10%, with option
to increase its stake to
50%.
US ethane cracker uses
gas-based feedstock,
resulting in lower cost and
more stable raw material
prices.
-
1,000.0
2,000.0
3,000.0
4,000.0
5,000.0
6,000.0
2017 2018 2019 2020 2021
Integrated Petrochemical Facility
US shale gas
Others
Improvements & modifications
Turnaround
PP3
TE3

HLIB Research | Lotte Chemical Titan
www.hlebroking.com
Page 7 of 13
28 June 2017
Figure 6: Comparison between ethane based cracker and naphtha-
based cracker
Source: LCT, Nexant
As seen from the chart above, naphtha cracker’s cost has risen in tandem with rising crude oil prices during period of 2008-2013 but ethane cracker’s cost has risen in a much smaller quantum. This has resulted in widening of cost advantage for ethane
crackers compared to naphtha crackers. In recent years (2014-2016), the cost advantage has narrowed significantly due to plunge in oil prices. Therefore, we believe its US JV would enjoy more stable cost margins in the longer run and would be better
resilient when facing a change in trend of oil prices.
Industry outlook
Figure 7: Polyolefin supply and demand
Source: LCT, Nexant
According to Nexant, global polyolefin capacity surplus over consumption is expected to widen post 2017 due to capacity expansion in the US (due to cost competitiveness of
shale gas feedstock) and China (mainly additions of methanol-based cracker). As a result, global operating rate of chemical production facility is expected to remain flattish in 2017-2018 before tapering off in 2019.
Cost advantage of ethane
as feedstock is evident
with prices less volatile
and lower than naphtha in
the past.
Global polyolefin expected
to see its capacity surplus
widen due to capacity
expansion in China and US.
HLIB Research | Lotte Chemical Titan
www.hlebroking.com
Page 8 of 13
28 June 2017
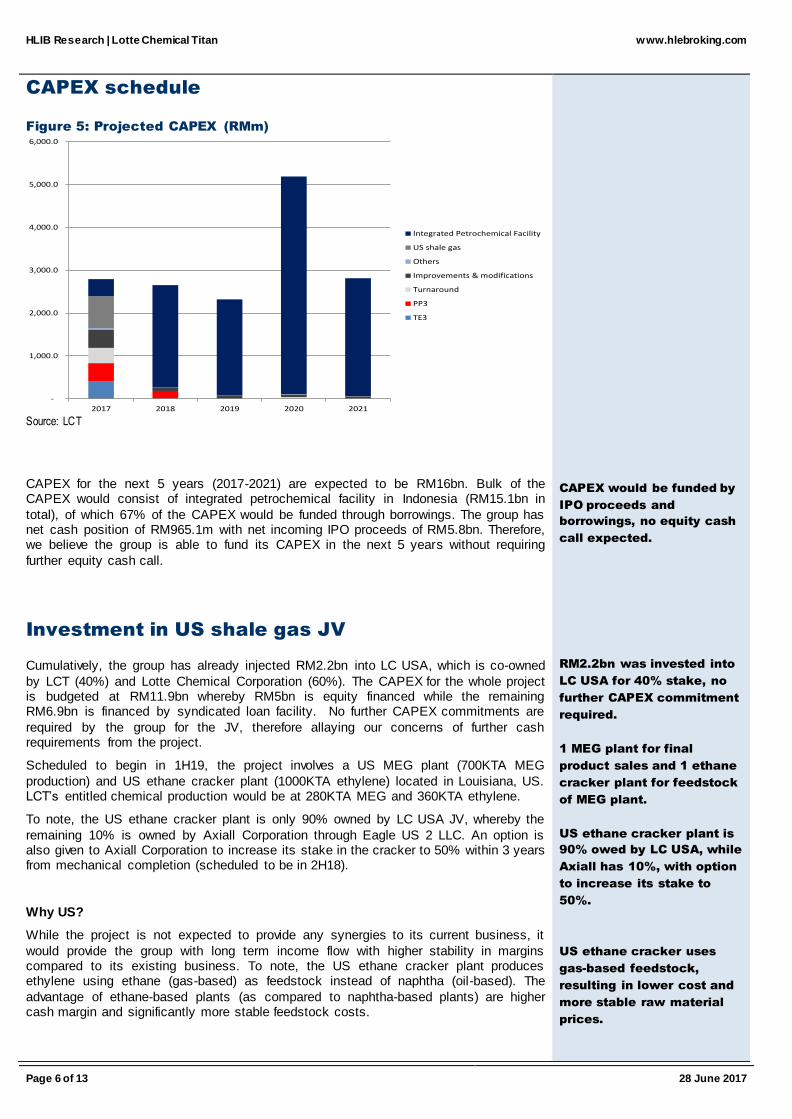
Figure 8: Global petrochemical demand and supply
Consumption (KTA) 2016 2017F 2018F 2019F
Americas 21,577.0 22,170.0 23,017.0 23,725.0
Europe 17,237.0 17,643.0 18,057.0 18,373.0
Middle East/Africa 9,459.0 9,932.0 10,685.0 11,110.0
China 25,848.0 26,364.0 27,860.0 29,406.0
SEA 5,708.0 6,032.0 6,355.0 6,629.0
Malaysia 1,205.0 1,261.0 1,320.0 1,373.0
Indonesia 1,317.0 1,405.0 1,490.0 1,565.0
Asia Pacific (exc. Sea and China) 11,915.0 12,254.0 13,169.0 13,741.0
Total 94,266.0 97,061.0 101,953.0 105,922.0
Total capacity (KTA)
Americas 25,007.0 27,095.0 30,482.0 31,488.0
Europe 18,601.0 18,705.0 18,894.0 20,473.0
Middle East/Africa 21,986.0 22,961.0 23,411.0 25,433.0
China 16,609.0 19,237.0 20,457.0 21,139.0
SEA 9,526.0 9,927.0 9,927.0 9,927.0
Malaysia 1,056.0 1,055.0 1,055.0 1,055.0
Indonesia 833.0 830.0 830.0 830.0
Asia Pacific (exc. Sea and China) 14,004.0 15,966.0 16,120.0 15,670.0
Total 107,622.0 115,776.0 121,176.0 126,015.0
Surplus 13,356.0 18,715.0 19,223.0 20,093.0
Source: LCT, Nexant
The product spread would be out under pressure as capacity surplus over consumption in the global market is expected to increase significantly over the period of 2016-2019,
being driven by China capacity expansion. LCT would be partially sheltered from the global overcapacity due to the ASEAN Free Trade agreement which would reduce incentives for additional supply from countries outside the region to penetrate into
ASEAN (subject to 10% tariff).
HLIB Research | Lotte Chemical Titan
www.hlebroking.com
Page 9 of 13
28 June 2017
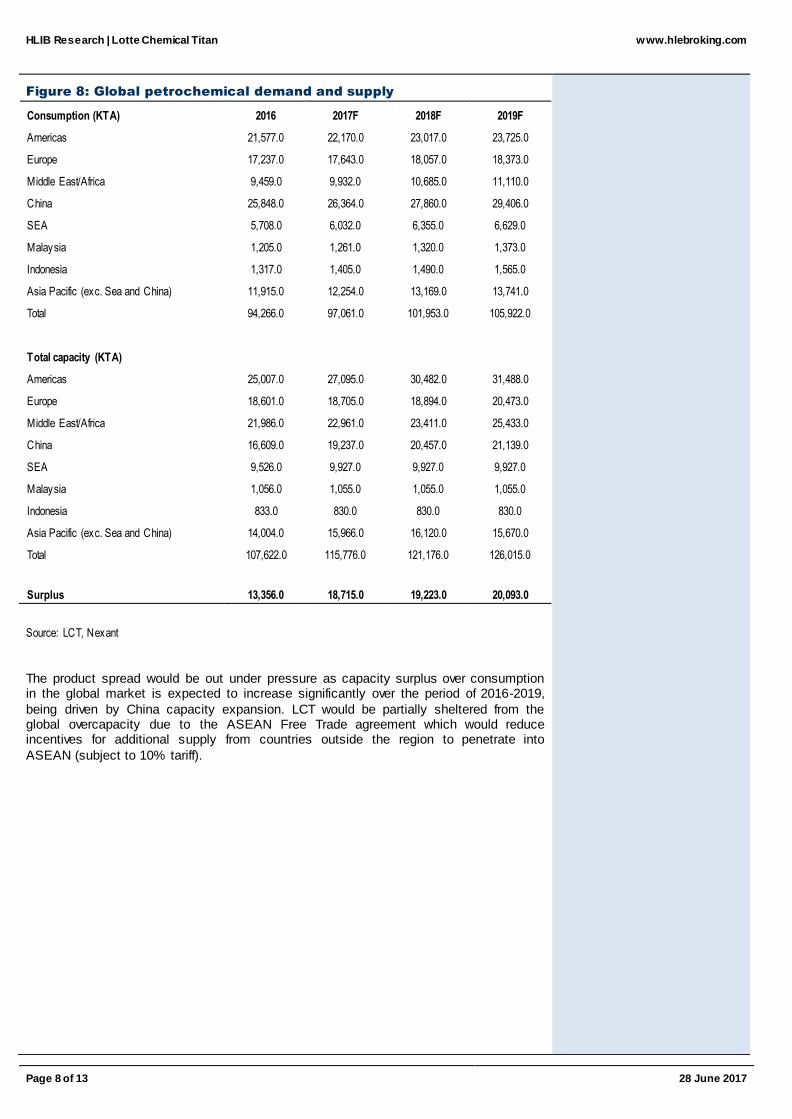
Figure 9: Asian Petrochemical Industry Profitability
Source: LCT, Nexant
In line with the expected operating rate of worldwide chemical production facilities,
integrated cash margin (product spread) for the industry is expected to start trend down from 2018 onwards before recovering in 2021. This is in tandem with the expected shift in demand-supply gap as exhibited in Fig 8.
Figure 10: ASEAN Petrochemical Industry Capacity addition
Source: LCT, Nexant
In ASEAN region, long-term capacity expansion is expected to be driven by major
projects by several major downstream players. SCG (Vietnam) plans to add 1.4m MT of polyolefin post 2020. Back in Malaysia, PCHEM plans to add circa 1.4m MT of polyolefin capacity, transforming Malaysia from a net importer of polyolefin to a net
exporter by 2019. PetroVietnam’s Nghi Son refinery would add around 0.4m MT of polypropylene in 2018. Therefore, we believe this would put downward pressure on petrochemical product spreads due to oversupply of products and therefore bringing
down overall petrochemical industry margins.
Cash margin of Asian
petrochemical facility
expected to be on
downtrend in next 5 years.
In the longer run, ASEAN
region would also
experience significant
addition in petrochemical
facility.
HLIB Research | Lotte Chemical Titan
www.hlebroking.com
Page 10 of 13
28 June 2017
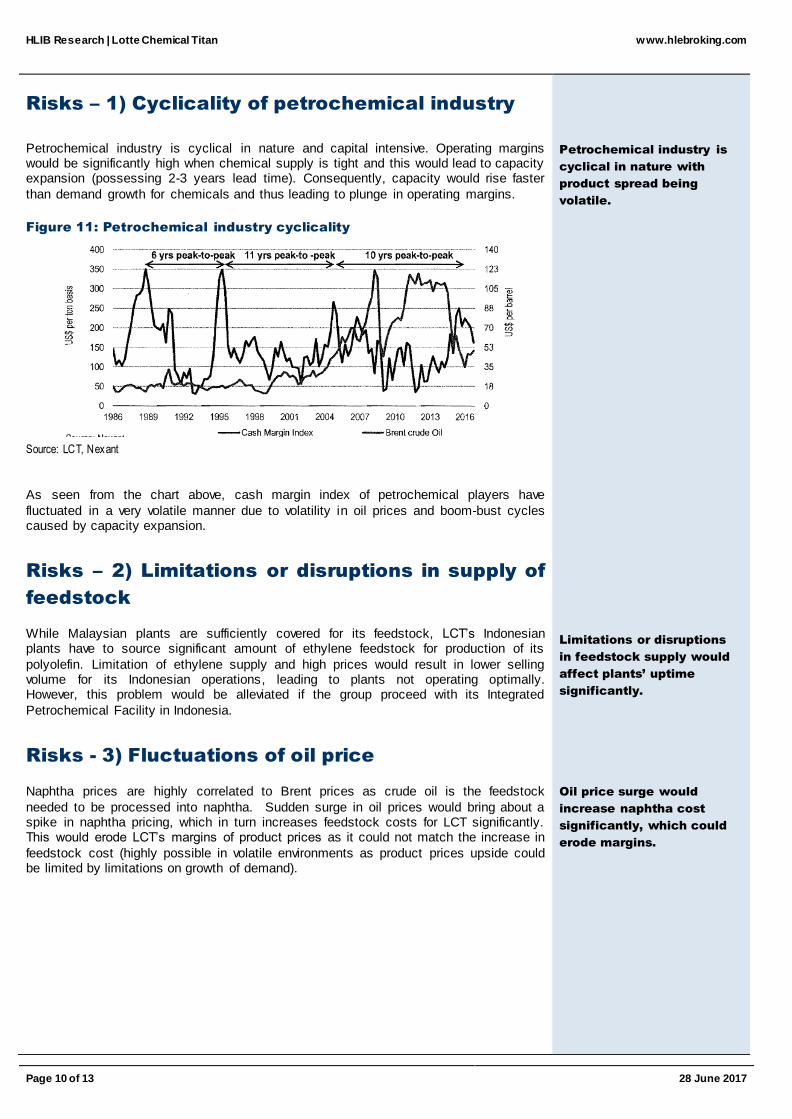
Risks – 1) Cyclicality of petrochemical industry
Petrochemical industry is cyclical in nature and capital intensive. Operating margins would be significantly high when chemical supply is tight and this would lead to capacity expansion (possessing 2-3 years lead time). Consequently, capacity would rise faster
than demand growth for chemicals and thus leading to plunge in operating margins.
Figure 11: Petrochemical industry cyclicality
Source: LCT, Nexant
As seen from the chart above, cash margin index of petrochemical players have
fluctuated in a very volatile manner due to volatility in oil prices and boom-bust cycles caused by capacity expansion.
Risks – 2) Limitations or disruptions in supply of
feedstock
While Malaysian plants are sufficiently covered for its feedstock, LCT’s Indonesian plants have to source significant amount of ethylene feedstock for production of its
polyolefin. Limitation of ethylene supply and high prices would result in lower selling volume for its Indonesian operations, leading to plants not operating optimally. However, this problem would be alleviated if the group proceed with its Integrated
Petrochemical Facility in Indonesia.
Risks - 3) Fluctuations of oil price
Naphtha prices are highly correlated to Brent prices as crude oil is the feedstock
needed to be processed into naphtha. Sudden surge in oil prices would bring about a spike in naphtha pricing, which in turn increases feedstock costs for LCT significantly. This would erode LCT’s margins of product prices as it could not match the increase in
feedstock cost (highly possible in volatile environments as product prices upside could be limited by limitations on growth of demand).
Petrochemical industry is
cyclical in nature with
product spread being
volatile.
Limitations or disruptions
in feedstock supply would
affect plants’ uptime
significantly.
Oil price surge would
increase naphtha cost
significantly, which could
erode margins.
HLIB Research | Lotte Chemical Titan
www.hlebroking.com
Page 11 of 13
28 June 2017
Forecast and Valuations
For the time period of 2017-2019, we forecast a 3-year CAGR of -4.8% in its core net
profit based on assumptions below:
- Weakening revenue/MT on expectation of capacity built globally and
regionally.
- Narrowing EBITDA margin from 25.6% in 2016 to 19.1% due to
expectation of narrowing product spread over the years due to capacity
build up from 2018.
- 3-years CAGR of 7% in volume of end product sold after accounting for
capacity expansion (TE3 and PP3).
Lower tax rate of 20% for the forecast horizon compared to 23% in 2016 due to
Principal Hub Incentive which entitles the group for tax incentives given by the
Malaysian government. The income from the hub would be tax free for the period of
2017-2021.
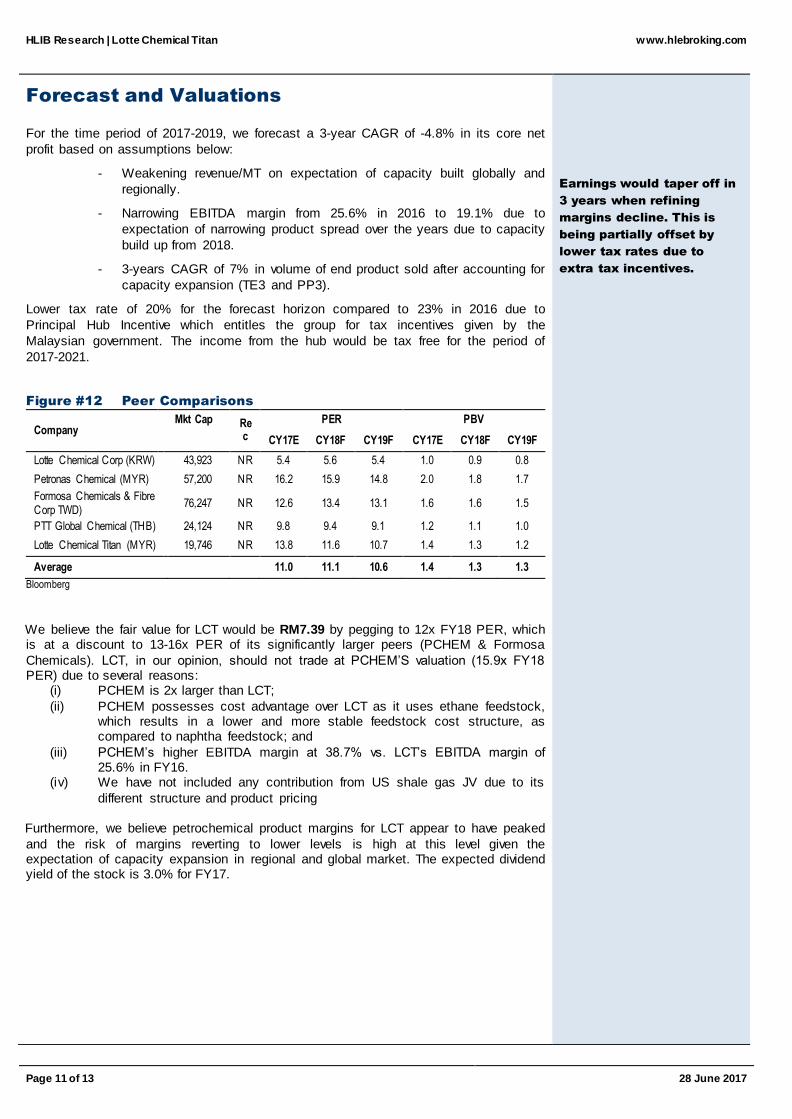
Figure #12 Peer Comparisons
Company Mkt Cap Re
c
PER PBV
CY17E CY18F CY19F CY17E CY18F CY19F
Lotte Chemical Corp (KRW) 43,923 NR 5.4 5.6 5.4 1.0 0.9 0.8
Petronas Chemical (MYR) 57,200 NR 16.2 15.9 14.8 2.0 1.8 1.7
Formosa Chemicals & Fibre Corp TWD)
76,247 NR 12.6 13.4 13.1 1.6 1.6 1.5
PTT Global Chemical (THB) 24,124 NR 9.8 9.4 9.1 1.2 1.1 1.0
Lotte Chemical Titan (MYR) 19,746 NR 13.8 11.6 10.7 1.4 1.3 1.2
Average
11.0 11.1 10.6 1.4 1.3 1.3
Bloomberg
We believe the fair value for LCT would be RM7.39 by pegging to 12x FY18 PER, which is at a discount to 13-16x PER of its significantly larger peers (PCHEM & Formosa
Chemicals). LCT, in our opinion, should not trade at PCHEM’S valuation (15.9x FY18 PER) due to several reasons:
(i) PCHEM is 2x larger than LCT;
(ii) PCHEM possesses cost advantage over LCT as it uses ethane feedstock, which results in a lower and more stable feedstock cost structure, as compared to naphtha feedstock; and
(iii) PCHEM’s higher EBITDA margin at 38.7% vs. LCT’s EBITDA margin of 25.6% in FY16.
(iv) We have not included any contribution from US shale gas JV due to its
different structure and product pricing Furthermore, we believe petrochemical product margins for LCT appear to have peaked
and the risk of margins reverting to lower levels is high at this level given the expectation of capacity expansion in regional and global market. The expected dividend yield of the stock is 3.0% for FY17.
Earnings would taper off in
3 years when refining
margins decline. This is
being partially offset by
lower tax rates due to
extra tax incentives.
HLIB Research | Lotte Chemical Titan
www.hlebroking.com
Page 12 of 13
28 June 2017
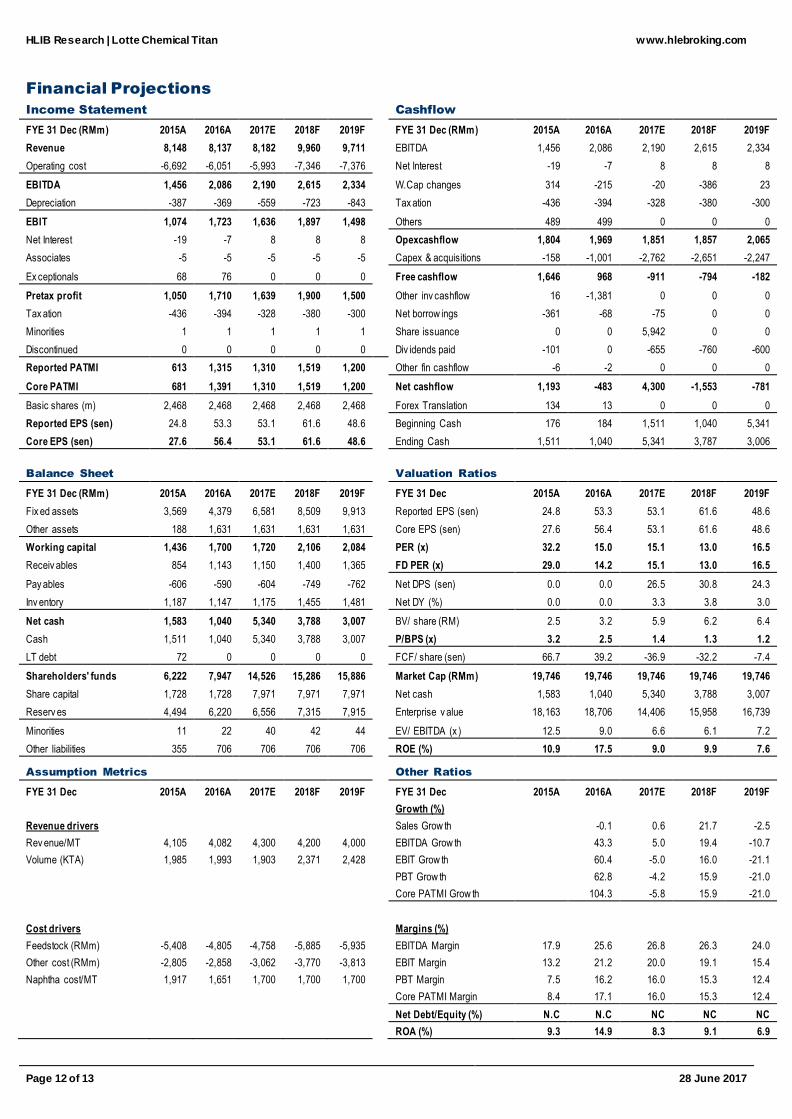
Financial Projections
Income Statement
Cashflow
FYE 31 Dec (RMm) 2015A 2016A 2017E 2018F 2019F
FYE 31 Dec (RMm) 2015A 2016A 2017E 2018F 2019F
Revenue 8,148 8,137 8,182 9,960 9,711
EBITDA 1,456 2,086 2,190 2,615 2,334
Operating cost -6,692 -6,051 -5,993 -7,346 -7,376
Net Interest -19 -7 8 8 8
EBITDA 1,456 2,086 2,190 2,615 2,334
W.Cap changes 314 -215 -20 -386 23
Depreciation -387 -369 -559 -723 -843
Tax ation -436 -394 -328 -380 -300
EBIT 1,074 1,723 1,636 1,897 1,498
Others 489 499 0 0 0
Net Interest -19 -7 8 8 8
Opexcashflow 1,804 1,969 1,851 1,857 2,065
Associates -5 -5 -5 -5 -5
Capex & acquisitions -158 -1,001 -2,762 -2,651 -2,247
Ex ceptionals 68 76 0 0 0
Free cashflow 1,646 968 -911 -794 -182
Pretax profit 1,050 1,710 1,639 1,900 1,500
Other inv cashflow 16 -1,381 0 0 0
Tax ation -436 -394 -328 -380 -300
Net borrow ings -361 -68 -75 0 0
Minorities 1 1 1 1 1
Share issuance 0 0 5,942 0 0
Discontinued 0 0 0 0 0
Div idends paid -101 0 -655 -760 -600
Reported PATMI 613 1,315 1,310 1,519 1,200
Other fin cashflow -6 -2 0 0 0
Core PATMI 681 1,391 1,310 1,519 1,200
Net cashflow 1,193 -483 4,300 -1,553 -781
Basic shares (m) 2,468 2,468 2,468 2,468 2,468
Forex Translation 134 13 0 0 0
Reported EPS (sen) 24.8 53.3 53.1 61.6 48.6
Beginning Cash 176 184 1,511 1,040 5,341
Core EPS (sen) 27.6 56.4 53.1 61.6 48.6
Ending Cash 1,511 1,040 5,341 3,787 3,006
Balance Sheet
Valuation Ratios
FYE 31 Dec (RMm) 2015A 2016A 2017E 2018F 2019F
FYE 31 Dec 2015A 2016A 2017E 2018F 2019F
Fix ed assets 3,569 4,379 6,581 8,509 9,913
Reported EPS (sen) 24.8 53.3 53.1 61.6 48.6
Other assets 188 1,631 1,631 1,631 1,631
Core EPS (sen) 27.6 56.4 53.1 61.6 48.6
Working capital 1,436 1,700 1,720 2,106 2,084
PER (x) 32.2 15.0 15.1 13.0 16.5
Receiv ables 854 1,143 1,150 1,400 1,365
FD PER (x) 29.0 14.2 15.1 13.0 16.5
Pay ables -606 -590 -604 -749 -762
Net DPS (sen) 0.0 0.0 26.5 30.8 24.3
Inv entory 1,187 1,147 1,175 1,455 1,481
Net DY (%) 0.0 0.0 3.3 3.8 3.0
Net cash 1,583 1,040 5,340 3,788 3,007
BV/ share (RM) 2.5 3.2 5.9 6.2 6.4
Cash 1,511 1,040 5,340 3,788 3,007
P/BPS (x) 3.2 2.5 1.4 1.3 1.2
LT debt 72 0 0 0 0
FCF/ share (sen) 66.7 39.2 -36.9 -32.2 -7.4
Shareholders' funds 6,222 7,947 14,526 15,286 15,886
Market Cap (RMm) 19,746 19,746 19,746 19,746 19,746
Share capital 1,728 1,728 7,971 7,971 7,971
Net cash 1,583 1,040 5,340 3,788 3,007
Reserv es 4,494 6,220 6,556 7,315 7,915
Enterprise v alue 18,163 18,706 14,406 15,958 16,739
Minorities 11 22 40 42 44
EV/ EBITDA (x ) 12.5 9.0 6.6 6.1 7.2
Other liabilities 355 706 706 706 706
ROE (%) 10.9 17.5 9.0 9.9 7.6
Assumption Metrics
Other Ratios
FYE 31 Dec 2015A 2016A 2017E 2018F 2019F
FYE 31 Dec 2015A 2016A 2017E 2018F 2019F
Growth (%)
Revenue drivers
Sales Grow th
-0.1 0.6 21.7 -2.5
Rev enue/MT 4,105 4,082 4,300 4,200 4,000
EBITDA Grow th
43.3 5.0 19.4 -10.7
Volume (KTA) 1,985 1,993 1,903 2,371 2,428
EBIT Grow th
60.4 -5.0 16.0 -21.1
PBT Grow th
62.8 -4.2 15.9 -21.0
Core PATMI Grow th 104.3 -5.8 15.9 -21.0
Cost drivers
Margins (%)
Feedstock (RMm) -5,408 -4,805 -4,758 -5,885 -5,935
EBITDA Margin 17.9 25.6 26.8 26.3 24.0
Other cost (RMm) -2,805 -2,858 -3,062 -3,770 -3,813
EBIT Margin 13.2 21.2 20.0 19.1 15.4
Naphtha cost/MT 1,917 1,651 1,700 1,700 1,700
PBT Margin 7.5 16.2 16.0 15.3 12.4
Core PATMI Margin 8.4 17.1 16.0 15.3 12.4
Net Debt/Equity (%) N.C N.C NC NC NC
ROA (%) 9.3 14.9 8.3 9.1 6.9
HLIB Research | Lotte Chemical Titan
www.hlebroking.com
Page 13 of 13
28 June 2017
Disclaimer
The information contained in this report is based on data obtained from sources believed to be reliable. However, the data and/or sources have not been independently verified and as such, no representation, express or implied, is made as to the accuracy, adequacy, completeness or reliability of the info or opinions in the report.
Accordingly, neither Hong Leong Investment Bank Berhad nor any of its related companies and associates nor person connected to it accept any liability whatsoever for any direct, indirect or consequential losses (including loss of profits) or damages that may arise from the use or reliance on the info or opinions in this publication.
Any information, opinions or recommendations contained herein are subject to change at any time without prior notice. Hong Leong Investment Bank Berhad has no obligation to update its opinion or the information in this report.
Investors are advised to make their own independent evaluation of the info contained in this report and seek independent financial, legal or other advice regarding the appropriateness of investing in any securities or the investment strategies discussed or recommended in this report. Nothing in this report constitutes investment, legal, accounting or tax advice or a representat ion that any investment or strategy is suitable or appropriate to your individual circumstances or otherwise represent a personal recommendation to you.
Under no circumstances should this report be considered as an offer to sell or a solicitation of any offer to buy any securities referred to herein.
Hong Leong Investment Bank Berhad and its related companies, their associates, directors, connected parties and/or employees may, from time to time, own, have positions or be materially interested in any securities mentioned herein or any securities related thereto, and may further act as market maker or have assumed underwriting commitment or deal with such securities and provide advisory, investment or other services for or do business with any companies or entities mentioned in this report. In reviewing the report, investors should be aware that any or all of the foregoing among other things, may give rise to real or potential conflict of interests.
This research report is being supplied to you on a strictly confidential basis solely for your information and is made strictly on the basis that it will remain confidential. All materials presented in this report, unless specifically indicated otherwise, is under copyright to Hong Leong Investment Bank Berhad. This research report and its contents may not be reproduced, stored in a retrieval system, redistributed, transmitted or passed on, directly or indirectly, to any person or published in whole or in part, or altered in any way, for any purpose.
This report may provide the addresses of, or contain hyperlinks to, websites. Hong Leong Investment Bank Berhad takes no responsibility for the content contained therein. Such addresses or hyperlinks (including addresses or hyperlinks to Hong Leong Investment Ban k Berhad own website material) are provided solely for your convenience. The information and the content of the linked site do not in any way form part of this report. Accessing such website or following such link through the report or Hong Leong Investm ent Bank Berhad website shall be at your own risk. 1. As of28 June 2017, Hong Leong Investment Bank Berhad has proprietary interest in the following securities covered in this report: (a) -. 2. As of 28 June 2017, the analyst, Lim Sin Kiat, who prepared this report, has interest in the following securities covered in this report: (a) -.
Published & Printed by
Hong Leong Investment Bank Berhad(10209-W)
Level 23, Menara HLA No. 3, Jalan Kia Peng 50450 Kuala Lumpur
Tel 603 2168 1168 / 603 2710 1168 Fax 603 2161 3880
Equity rating definitions
BUY Positiv e recommendation of stock under coverage. Expected absolute return of more than +10% ov er 12-months, with low risk of sustained downside. TRADING BUY Positiv e recommendation of stock not under coverage. Expected absolute return of more than +10% ov er 6-months. Situational or arbitrage trading opportunity . HOLD Neutral recommendation of stock under coverage. Expected absolute return betw een -10% and +10% over 12-months, with low risk of sustained downside. TRADING SELL Negativ e recommendation of stock not under coverage. Expected absolute return of less than -10% ov er 6-months. Situational or arbitrage trading opportunity.
SELL Negativ e recommendation of stock under coverage. High risk of negative absolute return of more than -10% ov er 12-months. NOT RATED No research coverage and report is intended purely for informational purposes.
Industry rating definitions
OVERWEIGHT The sector, based on weighted market capitalization, is expected to have absolute return of more than +5% ov er 12-months. NEUTRAL The sector, based on weighted market capitalization, is expected to have absolute return betw een –5% and +5% over 12-months. UNDERWEIGHT The sector, based on weighted market capitalization, is expected to have absolute return of less than –5% ov er 12-months.