hmic asb ipsos mori national report with cover jr …...2010/09/23 · ipsos mori would like to...
TRANSCRIPT

Acknowledgements
Ipsos MORI would like to thank Peter Brunswick at HMIC for his help and guidance on this project. We are also grateful to all 43 police forces for their assistance in enabling the research to take place. We wish to extend our thanks to all those members of the public who gave their time to participate in both the qualitative and quantitative strands of this research.
© Crown Copyright 2010
ContentsExecutive summary .......................................................................2
Background and methodology......................................................8
Background................................................................................................ 8
Qualitative research: focus groups............................................................. 8
Quantitative research: telephone survey.................................................... 9
Qualitative research.....................................................................13
1. Defining and Scoping Anti-Social Behaviour ........................................ 13
2. Responsibility for dealing with anti-social behaviour ............................ 15
3. Reporting anti-social behaviour............................................................ 17
Quantitative research ..................................................................20
1. Perceptions of the local area................................................................ 20
2. Overall attitudes to levels of anti-social behaviour and response......... 21
3. Importance attached to anti-social behaviour....................................... 29
4. Details of previous calls ....................................................................... 32
5. The caller experience........................................................................... 35
6. Consequences of the call ..................................................................... 40
7. Intimidation as a result of reporting anti-social behaviour .................... 44
Appendix A: Marked-up Questionnaire ......................................50
Appendix B: Discussion guide....................................................72
Appendix C: Opt-out letter ..........................................................80
Appendix D: Response rate calculations ...................................82
Appendix E: Guide to statistical reliability.................................84
Appendix F: Cross-breaks used for analysis.............................86

1© 2010 Ipsos MORI.
Executive Summary Executive summary
Policing anti-social behaviour: The public perspective
2
Executive summary
Aims and objectives
Her Majesty’s Inspectorate of Constabulary (HMIC) commissioned this research to obtain evidence of public attitudes towards anti-social behaviour and police response, and to highlight potential implications for the police in their approaches to anti-social behaviour. In particular, the research identified what people understand by the term ‘anti-social behaviour’; who they feel ought to be responsible for dealing with it; their expectations of key agencies such as the police; and the conditions under which people report particular incidents/behaviour. The research measures attitudes towards contact with the police when reporting anti-social behaviour and identifies key areas for improvement.
Overview of methodology
The research includes both qualitative and quantitative strands. For the qualitative research, ten discussion groups were held with a cross-section of the public in five locations across England in March 2010. For the quantitative research, a total of 5,699 telephone interviews were conducted in May-June 2010 with a random selection of people who had contacted the police to report anti-social behaviour during September 2009. These individuals were sampled from police force records.
While the aims and objectives were covered across both quantitative and qualitative methodologies, the quantitative research focussed to a greater extent on questions relating to the caller experience, while the qualitative research focussed on questions related to individuals’ understanding of ‘anti-social behaviour’ and how it should best be tackled.
Key findings
The term ‘Anti-social behaviour’ is associated with a range of factors and people make no clear distinction from ‘crime’ When asked what types of behaviours come to mind at a spontaneous level when thinking about ‘anti-social behaviour’, the most frequently mentioned in the survey by those who previously reported anti-social behaviour to the police are:
� street drinking and under age drinking;
� teenagers and kids loitering in the streets; and
� vandalism and graffiti.
These associations reflect people’s own experiences given the strong links between how people define anti-social behaviour, and the specific type of incident they have previously called the police to report. Furthermore, those with a poor quality of life, and those living in more deprived areas (two factors which often overlap) tend to associate the term ‘anti-social behaviour’ with more ‘extreme’ forms of behaviour, such as intimidation, abusive behaviour, and violence/fighting.
Policing anti-social behaviour: The public perspective
3
The qualitative research (which included people who had never reported anti-social behaviour, as well as others who had) highlighted how people associate the term ‘anti-social behaviour’ with a range of factors, from specific types of behaviour to wider cultural and societal issues (such as lack of consideration and respect, moral decline and lack of community spirit), as well as particular types of individuals, cultures and perpetrators, with views often focussing on young people, typically teenagers. There is no clear or systematic distinction made between ‘crime’ and ‘anti-social behaviour’.
The research suggests that the police must be wary in their use of the term ‘anti-social behaviour’. In general terms the phrase can be used in quite a throwaway sense to encapsulate a range of issues ranging from specific incidents to wider social trends. However, within a policing context, the term is typically used by the public to describe persistent and/or serious incidents that are causing significant direct harm or upset to them personally or to others in their local community.
Indeed, given the public do not make clear distinctions between ‘anti-social behaviour’ and ‘crime’ (with many noting the overlap between the two), the value of police using the term ‘anti-social behaviour’ to classify particular incidents is questionable.
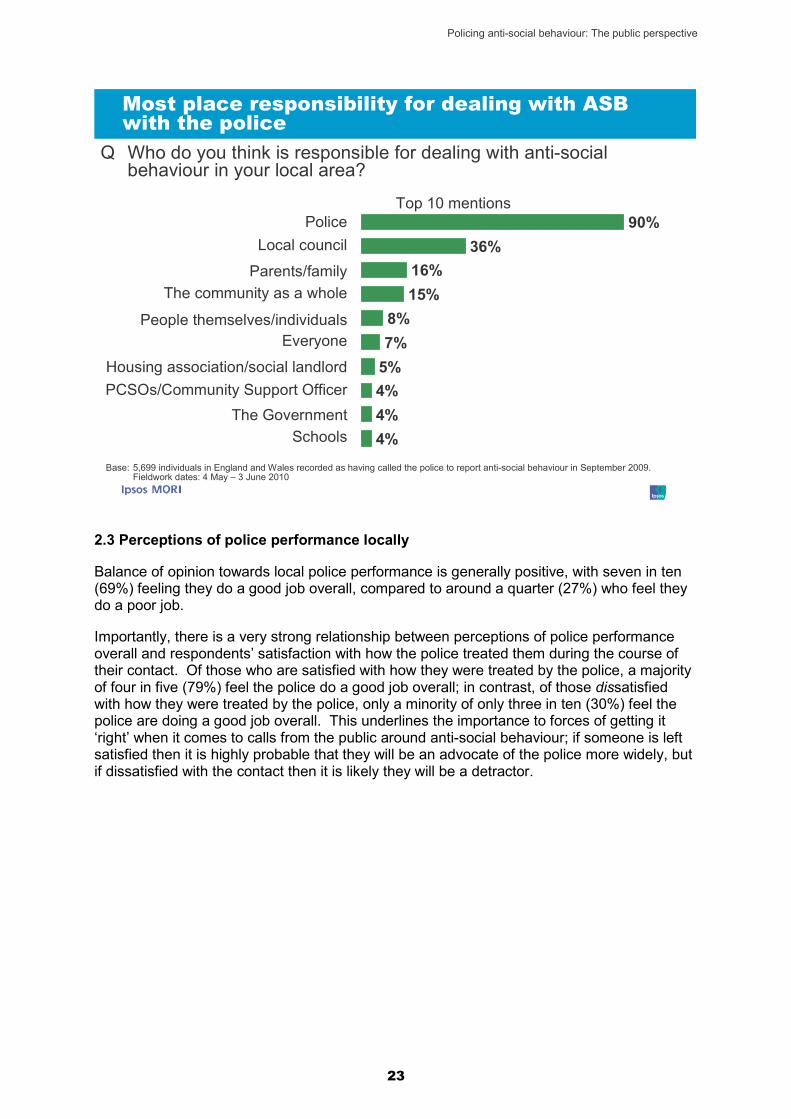
The police are seen as primarily responsible for tackling anti-social behaviour Overwhelmingly, survey respondents feel that it is the police who are (solely or jointly) responsible for dealing with anti-social behaviour (mentioned by 90%), with the local council coming a distant second (36%). After the police and the local council, it is felt to be the responsibility of families, local communities and individuals themselves to deal with anti-social behaviour. This dominance of the police in public associations with anti-social behaviour is consistent with other Ipsos MORI research findings.
When members of the public have opportunity to discuss the relevant issues in more detail within the qualitative research, then collective responsibility is felt to be the most appropriate way of increasing levels of respect in society, thereby dealing with anti-social behaviour. Particular emphasis for taking responsibility for improving anti-social behaviour levels is put on:
� families;
� parents;
� teachers;
� individuals;
� perpetrators; and
� ‘society as a whole’.
The police’s role is seen to be multi-faceted: acting as a deterrent, responding to and dealing with incidents, and helping to foster positive relations within communities.
There is some sense that, in practice, the police are too overwhelmed by administration and bureaucracy, or by conflicting targets they are required to meet, to respond properly to anti-social behaviour or to give it the attention it needs. That said, forces must be aware of their critical role in dealing with anti-social behaviour across local communities where people will expect the police to take the lead in taking action and providing reassurance. In the public’s eyes, partnerships between local public services, such as the police, the local council, and other organisations such as housing associations or social services are worthless unless they lead to single points of contact and swifter, more effective outcomes.
The police are generally well regarded but must do more to inform and engage the public around anti-social behaviour issues
General attitudes towards the police are typically positive: most survey respondents (69%) feel they are doing a good job in their local areas, compared to 27% who feel they are doing
Policing anti-social behaviour: The public perspective
4
a poor job. The majority (53%) also feel that the police and local public services are dealing with the anti-social behaviour issues that matter locally, although almost half do not agree. Improvements have been noted by some; 23% feel that local public services have improved in their response to anti-social behaviour in the last 12 months, twice the proportion of those who feel they have got worse (12%).
Awareness of measures to tackle anti-social behaviour tends to be low, with most survey respondents (59%) saying they don’t feel informed about what is being done to tackle anti-social behaviour in their area. This rises to 64% among those who think anti-social behaviour is a problem in their local area, highlighting the potential for reassurance via effective information provision.
The qualitative research highlights how people believe the police should play a key role in facilitating local community links to help foster local cohesion and should provide both appropriate information and reassurance to the public. While the concept of neighbourhood policing is generally believed to be a positive and appropriate approach, more needs to be done to increase awareness, engagement and impact of local policing activities in local communities.
A flexible approach to reflect the needs, concerns and make-up of local areas is felt to be most appropriate. This is mirrored in the survey findings which show consistent variations in public perceptions between more deprived and more affluent areas; local teams must be aware that levels of tolerance, attitudes to response, and likelihood of reporting will vary from one area to another.
The police must be aware of their role in informing the public about local action to tackle anti-social behaviour. Expectations will be that such information should come from the police given most people’s association with them as the main agency responsible for dealing with anti-social behaviour.
Anti-social behaviour has a significant impact on the day-to-day lives of many, particularly those in more deprived areas
The research shows the huge impact that anti-social behaviour has on some people’s lives: almost two-thirds of callers (63%) feel anti-social behaviour is a big problem in their area, and over one in three (36%) take active steps to adapt their daily routine through fear of anti-social behaviour, for instance by avoiding certain streets or not going out at night. Those living in more deprived areas and who note their quality of life as poor are particularly likely to express concerns and note the impact on their everyday lives. Indeed, among those with a ‘poor’ quality of life, 85% feel that anti-social behaviour is a problem locally, and 69% say it has an impact on their everyday routine. This is consistent with Ipsos MORI analysis of Place Survey findings which demonstrates an extremely strong correlation between perceived levels of anti-social behaviour and satisfaction with local area1.
The fact that over two in three (68%) callers have made repeat calls to report ASB within the past year demonstrates the persistent nature of many issues and helps to explain the major impact that many feel.
1 Duffy, B., and Lee Chan, D. People, Perceptions and Place. Ipsos MORI report, 2009. http://bit.ly/as1vR3
Policing anti-social behaviour: The public perspective
5
People do not make trade-offs between ‘crime’ and ‘anti-social behaviour’ Even when asked alongside crimes such as burglary of homes, domestic violence and street robberies, the majority of people still attach significant importance to the police focussing efforts on a range of ‘anti-social behaviour’ incidents. For instance, while almost all respondents feel it is very important or essential to direct resources towards tackling burglary (95%), robbery (94%) and domestic violence (89%), many also feel it is very important or essential that efforts are directed at tackling vandalism and graffiti (64%), noisy and nuisance neighbours (54%), and public drunkenness and rowdy behaviour (47%). Only very small minorities do not feel it is important to focus on anti-social behaviour issues (up to 7%). This illustrates again the lack of distinction that people make between crime and ASB. Instead, a sliding scale of importance is attached to incidents, which varies according to factors such as the type of incident, the specifics of the situation, and the respondent’s own experience of ASB. For instance, those in the telephone survey whose quality of life is affected more significantly by ASB are more likely to prioritise response to the ASB incidents noted above as either essential or very important.
Anti-social behaviour is most likely to be reported where it directly affects quality of life
When asked how likely they would be to report different types of anti-social behaviour were they to experience it, around nine in ten respondents to the telephone survey say they would report vandalism/graffiti/damage to property, harassment/discrimination, and drug use/dealing. Fewer but still a majority (around three in five), say they would report noisy neighbours or public drunkenness/rowdiness. Fewer than half say they would report rubbish/litter or teenagers loitering.
The qualitative research shows that people tend only to consider reporting anti-social behaviour when it has a significant impact on their own quality of life, either because their own property or their own day-to-day lives are being affected. By the time something is reported to the police it is perhaps because attempts to deal with the issue within the community have failed, or because the impact of the behaviour has escalated. Reported anti-social behaviour therefore tends not to reflect more general definitions or associations with the term ‘anti-social behaviour’; reported incidents tend to be closer to home, with a more direct and severe impact on the caller’s quality of life.
The caller experience is generally positive, though there is notable scope for improvements to feedback and follow-up
Most of the calls made to the police in September 2009 (recorded by the police as ‘anti-social behaviour’) related to rowdy/inconsiderate behaviour (56%), followed by vehicle nuisance (13%) and nuisance neighbours (12%).
In general, the caller experience is a positive one in terms of access and perceived treatment. The majority of people who call to report anti-social behaviour are happy with the way the police handled their call (65% satisfied) and, where action was taken, are satisfied with the response (83%). This helps to reinforce future pro-active behaviour, with most saying they would report similar incidents in the future (87%) and would encourage others to make similar reports (89%).
However, only two in five (39%) are aware of any action that the police took in response to their call, and only 54% feel their call made any difference to the problem. This is likely to be associated with a lack of feedback from the police; while most (56%) are happy with the way in which they were provided with information from the police following their call, one in three
Policing anti-social behaviour: The public perspective
6
(35%) are dissatisfied, including one in five (22%) who are ‘very’ dissatisfied. These findings will partly explain the high proportion of repeat callers: two in three (68%) say they have called the police to report anti-social behaviour at least twice in the past year, with one in three (32%) saying they have made at least five calls, and one in five (19%) at least 10 calls. Most of these repeat callers (around two in three) say their calls related to the same or related problems.
Partnership working can lead to better outcomes
While the police were the only agency involved for most callers, one in five (19%) say that other services did get involved. The qualitative research finds strong public support for partnership working across local public services (such as between the police, the local council, and other local services such as housing associations and social services), though people expect reassurance that something will be done and that they will not be referred to another agency or asked to call another number; people expect that truly joined-up agencies will liaise with each other on behalf of the caller. People also expect that they will be treated with sensitivity, action will be taken, and, ideally, they will be kept informed.
Within the telephone survey, in instances where only the police took action, around one in four (26%) felt their call made a big difference to the problem they were calling about. In contrast, in cases where at least one other local public service also took action, more than half (54%) felt their call made a big difference to the problem they were calling about.
The quantitative research also shows that ratings of police response vary significantly by the type of anti-social behaviour reported, with those reporting issues around nuisance neighbours, for example, more likely to express dissatisfaction throughout. This may potentially indicate differences between the police approach and public expectations in some areas, notably where partner agencies may also be involved.
The impact of police handling and response to calls cannot be underestimated
People’s perceptions of their own contact with the police has wider-reaching implications. Those who are dissatisfied with how their call was dealt with are significantly more likely to feel the police:
� do a poor job overall;
� do not deal with the things that matter locally;
� have got worse at tackling anti-social behaviour.
As well as actively ‘talking down’ the police, these dissatisfied callers are also far less likely to consider reporting similar incidents in the future or recommending others do the same.
Those who would not report a similar incident to the police in the future are most likely to cite reasons relating to a lack of support from the police, a perception that they would spend too much time and hassle waiting for an unsatisfactory outcome, and/or that the police simply ‘do not care’.
Intimidation is a very real problem for those most affected by anti-social behaviour
One in five (19%) say that fear of intimidation or repercussions has stopped them from reporting anti-social behaviour in the past, while one in three (32%) say they have actually experienced intimidation or repercussions as a result of reporting anti-social behaviour. Reflecting the impact that anti-social behaviour has on overall quality of life, the majority (61%) of those who feel their quality of life is bad overall say they have experienced intimidation or repercussions. Police must be sensitive to these factors when handling calls and co-ordinating appropriate response.

Policing anti-social behaviour: The public perspective
7
Background and methodology

Policing anti-social behaviour: The public perspective
8
Background and methodology
Background
Aims and objectives
Her Majesty’s Inspectorate of Constabulary (HMIC) commissioned this research to obtain evidence of public attitudes towards anti-social behaviour and police response, and to highlight potential implications for the police in their approaches to anti-social behaviour. In particular, the research identified what people understand by the term ‘anti-social behaviour’; who they feel ought to be responsible for dealing with it; their expectations of key agencies such as the police; and the conditions under which people report particular incidents/behaviour. The research measures attitudes towards contact with the police when reporting anti-social behaviour and identifies key areas for improvement.
This project consisted of qualitative and quantitative research methodologies, the details of which are described below. Both the qualitative and quantitative aspects of this research were carried out to ISO 20252 standards, the international quality standard for market research.
Structure of report
This report brings together findings from both the qualitative and quantitative strands of research. The commentary explores in detail the sub-group differences and patterns within the data, as well as drawing out implications where relevant. The report is structured as follows:
� Executive summary: This section is intended to be a standalone summary of the key findings across both the qualitative and quantitative strands of research.
� Background and objectives: This section includes an introduction to the study and provides key details of the approach taken, as well as important pointers to aid the interpretation of findings.
� Qualitative research: An overview of the key findings and themes from the focus groups, with illustrative quotes from research participants.
� Quantitative research: Commentary on findings from the telephone survey, with specific reference to sub-group analysis.
� Appendices: Includes the key research tools including the discussion guide from the focus groups and questionnaire from the telephone survey, as well as details of response rates and statistical reliability.
Separate outputs that have been provided to HMIC include force-level summary reports (see HMIC website to view these reports) and a separate set of data tables.
Qualitative research: focus groups
Ten discussion groups were held in five locations (two groups per location) across England in March 2010; Stockport on 8th March, Shrewsbury on 11th March, Trowbridge on 15th March, London on 16th March and Maidstone on 18th March. Around ten people participated in each of the discussion groups, with quotas set on recruitment so that each group included
Policing anti-social behaviour: The public perspective
9
a mix of people by age, gender, social class, type of area (urban and rural), presence of children in household and previous experience of reporting anti-social behaviour. Each group discussion lasted for approximately 90 minutes and all discussions were tape recorded for analysis purposes. Participants were recruited by Ipsos MORI recruiters within the local areas in-street and door-to-door (i.e. not via lists of local residents etc).
Interpretation of the data
Qualitative research is not, by its nature, designed to be statistically representative. It is intended to be illustrative, and claims cannot be made about the extent to which the conclusions may be generalised to the population. As with any qualitative research, the aim was to facilitate deeper insight into, and understanding of, specific topic areas that go beyond ‘top of the mind’ responses.
Quantitative research: telephone survey
Telephone interviews were conducted with 5,699 members of the public who had called the police to report anti-social behaviour during September 2009. The interviews took place between 4th May and 3rd June 2010. The interviews were conducted by Ipsos MORI’s computer assisted telephone interviewing (CATI) telephone centre. Each of the 43 forces of England and Wales were invited by HMIC to submit a sample of callers who had reported anti-social behaviour in September 2009. Definitions of anti-social behaviour calls were set out by HMIC, covering the following areas:
� Abandoned vehicles
� Animal problems
� Inappropriate use / sale /
possession of fireworks
� Begging / Vagrancy
� Noise
� Prostitution related activity
� Littering/drugs paraphernalia
� Nuisance neighbours
� Rowdy or inconsiderate
behaviour
� Street drinking
� Trespass
� Vehicle nuisance/inappropriate
vehicle use.
Given the varying quality of the samples received from forces, Ipsos MORI conducted a thorough sample cleaning process in order to remove individuals reporting incidents that did not fall into these anti-social behaviour categories. Ipsos MORI also removed the following cases (where they had not already been excluded by the force):
� Hoax calls / malicious communications;
� Reports where caller was under 16 years of age;
� Reports where the incident involved a family member;

Policing anti-social behaviour: The public perspective
10
� Reports where the caller was a ‘professional witness’, for example an off-duty
police officer or CCTV operator.
Cases which lacked addresses or telephone numbers, meaning there were insufficient details to make contact with the lead, were also removed. A de-duplication process was also conducted, to account for cases where an individual had contacted the force on more than one occasion during September 2009.
Each individual was assigned a unique ID to protect the anonymity of the caller. Ipsos MORI wrote to eligible individuals to invite them to participate and offer them the opportunity to opt out by either returning a freepost opt out slip or by calling the project helpline and leaving their details. The letters were mailed out in two batches of roughly equal size; the first batch, made up of callers from 22 police forces, was mailed out on 21st April, with the second batch of the remaining 21 forces being mailed on 30th April. A copy of the opt-out letter can be found in the appendices. Fieldwork was staggered so that those who received their letters from the second batch were given sufficient time to respond before being contacted by our telephone interviewers.
A total of 27,603 opt-out letters were mailed out and 1,137 responded to say that they did not wish to take part.
A target of 100 interviews per force was set, apart from the four metropolitan forces of Greater Manchester, London Metropolitan, West Midlands, and West Yorkshire, for which the target was 400 interviews per force. These targets were met in each force apart from City of London, reflecting the low volume of anti-social behaviour calls received, and Greater Manchester, where a total of 388 interviews was achieved.
The questionnaire comprised of 45 questions, and took an average of 19.5 minutes to complete. A ‘topline’ of results showing the aggregate findings from each question in the quantitative research has been appended.
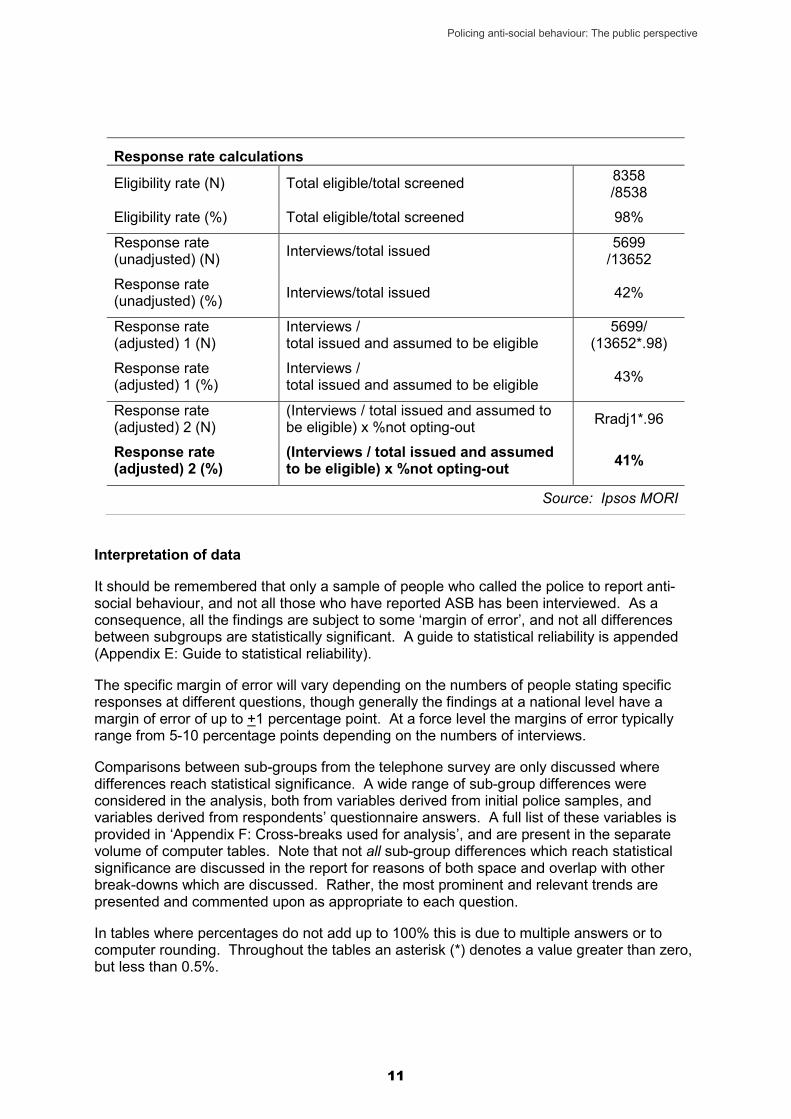
Response rates
Three separate response rates were calculated for the survey, as shown in the following table. The final adjusted response rate is 41%, which compares favourably with other social research studies conducted by phone. A more detailed description of response rate calculations is included in the appendices.
Policing anti-social behaviour: The public perspective
11
Response rate calculations
Eligibility rate (N) Total eligible/total screened 8358 /8538
Eligibility rate (%) Total eligible/total screened 98%
Response rate (unadjusted) (N) Interviews/total issued 5699
/13652
Response rate (unadjusted) (%) Interviews/total issued 42%
Response rate (adjusted) 1 (N)
Interviews / total issued and assumed to be eligible
5699/ (13652*.98)
Response rate (adjusted) 1 (%)
Interviews / total issued and assumed to be eligible 43%
Response rate (adjusted) 2 (N)
(Interviews / total issued and assumed to be eligible) x %not opting-out Rradj1*.96
Response rate (adjusted) 2 (%)
(Interviews / total issued and assumed to be eligible) x %not opting-out 41%
Source: Ipsos MORI
Interpretation of data
It should be remembered that only a sample of people who called the police to report anti-social behaviour, and not all those who have reported ASB has been interviewed. As a consequence, all the findings are subject to some ‘margin of error’, and not all differences between subgroups are statistically significant. A guide to statistical reliability is appended (Appendix E: Guide to statistical reliability).
The specific margin of error will vary depending on the numbers of people stating specific responses at different questions, though generally the findings at a national level have a margin of error of up to +1 percentage point. At a force level the margins of error typically range from 5-10 percentage points depending on the numbers of interviews.
Comparisons between sub-groups from the telephone survey are only discussed where differences reach statistical significance. A wide range of sub-group differences were considered in the analysis, both from variables derived from initial police samples, and variables derived from respondents’ questionnaire answers. A full list of these variables is provided in ‘Appendix F: Cross-breaks used for analysis’, and are present in the separate volume of computer tables. Note that not all sub-group differences which reach statistical significance are discussed in the report for reasons of both space and overlap with other break-downs which are discussed. Rather, the most prominent and relevant trends are presented and commented upon as appropriate to each question.
In tables where percentages do not add up to 100% this is due to multiple answers or to computer rounding. Throughout the tables an asterisk (*) denotes a value greater than zero, but less than 0.5%.

Policing anti-social behaviour: The public perspective
12
Qualitative research
Policing anti-social behaviour: The public perspective
13
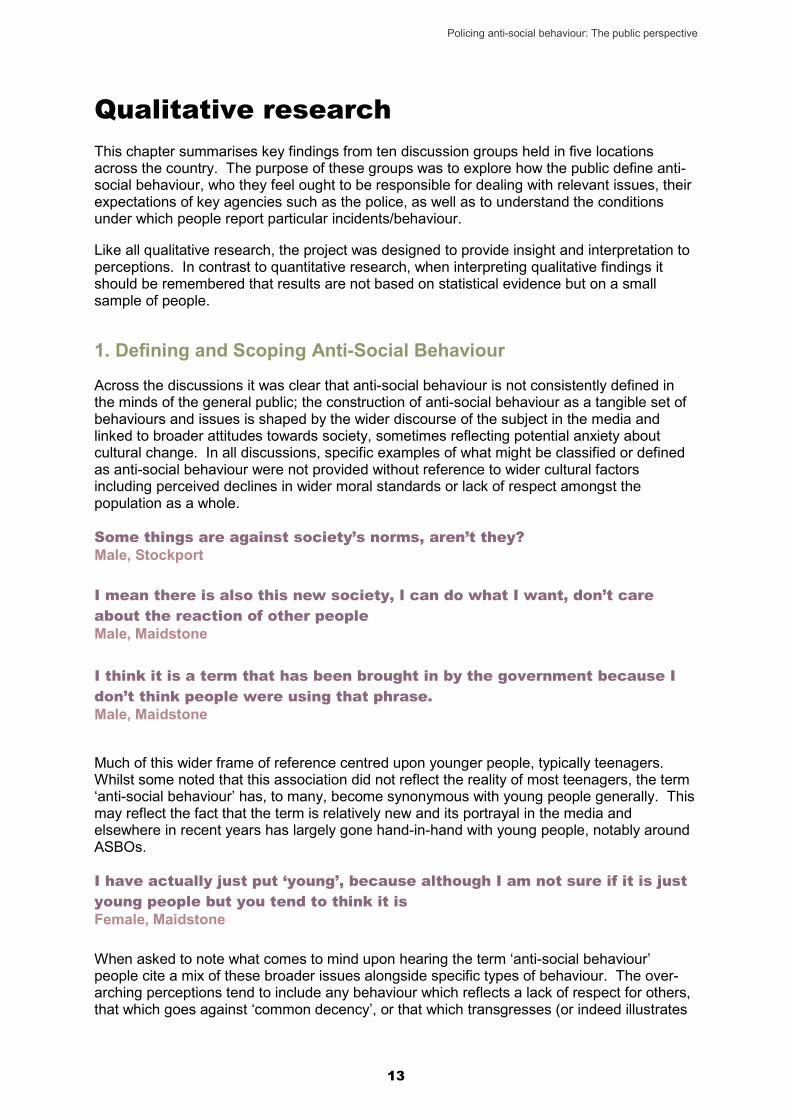
Qualitative research This chapter summarises key findings from ten discussion groups held in five locations across the country. The purpose of these groups was to explore how the public define anti-social behaviour, who they feel ought to be responsible for dealing with relevant issues, their expectations of key agencies such as the police, as well as to understand the conditions under which people report particular incidents/behaviour.
Like all qualitative research, the project was designed to provide insight and interpretation to perceptions. In contrast to quantitative research, when interpreting qualitative findings it should be remembered that results are not based on statistical evidence but on a small sample of people.
1. Defining and Scoping Anti-Social Behaviour
Across the discussions it was clear that anti-social behaviour is not consistently defined in the minds of the general public; the construction of anti-social behaviour as a tangible set of behaviours and issues is shaped by the wider discourse of the subject in the media and linked to broader attitudes towards society, sometimes reflecting potential anxiety about cultural change. In all discussions, specific examples of what might be classified or defined as anti-social behaviour were not provided without reference to wider cultural factors including perceived declines in wider moral standards or lack of respect amongst the population as a whole.
Some things are against society’s norms, aren’t they? Male, Stockport I mean there is also this new society, I can do what I want, don’t care about the reaction of other people Male, Maidstone I think it is a term that has been brought in by the government because I don’t think people were using that phrase. Male, Maidstone
Much of this wider frame of reference centred upon younger people, typically teenagers. Whilst some noted that this association did not reflect the reality of most teenagers, the term ‘anti-social behaviour’ has, to many, become synonymous with young people generally. This may reflect the fact that the term is relatively new and its portrayal in the media and elsewhere in recent years has largely gone hand-in-hand with young people, notably around ASBOs.
I have actually just put ‘young’, because although I am not sure if it is just young people but you tend to think it is Female, Maidstone When asked to note what comes to mind upon hearing the term ‘anti-social behaviour’ people cite a mix of these broader issues alongside specific types of behaviour. The over-arching perceptions tend to include any behaviour which reflects a lack of respect for others, that which goes against ‘common decency’, or that which transgresses (or indeed illustrates

Policing anti-social behaviour: The public perspective
14
the breakdown of) societal norms, the term was felt by participants to embrace a range of situations from people failing to give up their seats for the infirm on public transport to accepted ‘criminal acts’ such as violence against the person or vandalism to private property.
They might be like throwing rocks at windows and stuff like that or like breaking into cars or like you hear things like that. But then you have the other type, people on drugs, the alcoholics that will cause crime or just be loud on the street Female, London
In relation to the range of behaviours / problems considered to be anti-social behaviour participants found it difficult to draw a clear dividing line between ‘anti-social behaviour’ and ‘criminal acts’, feeling that the term ‘anti-social behaviour’ is often used too casually, in a way which, in some respects, ‘normalises’ unacceptable and thoughtless behaviour.
This might be controversial but I actually think it almost softens what it actually is. It’s just a throwaway term people use. It’s something that’s actually quite unacceptable Female, Shrewsbury In contrast, participants sometimes felt particularly upset with regard what to an outsider may appear seemingly quite low-level issues, such as pulling up plants from communal gardens and vandalism / graffiti of private property, which they found more frustrating in the mindless way in which they were undertaken and the hurt that this can cause.
Multi-level definition of anti-social behaviour
Cultural factors
Specific incidents/ behaviour
Typologies
- lack of respect / consideration- ‘Broken Britain’- lack of community spirit
- graffiti- damage to property- swearing
- drug users- ‘chavs’- ‘wannabe gangsters’- young people/ teenagers- intimidation/
threatening behaviour - alcoholics

Policing anti-social behaviour: The public perspective
15
Reflecting wider narratives around anti-social behaviour and its perceived proliferation across society generally, participants in general had much to say about perceived problems in their local areas and expressed concerns about their possible impact. However, fewer had felt motivated to report any anti-social behaviour incidents to the police or other local public sector agency, such as the local council. This variation between general attitudes and definitions of anti-social behaviour and the personalised experiences and reports of anti-social behaviour is significant and highlights potential operational issues in the use of the term ‘anti-social behaviour’. By labelling some incidents as ‘anti-social behaviour’ there could be a risk that they are perceived as being trivialised.
In its widest sense, anti-social behaviour is perceived as a term coined to reflect some of the more negative aspects of modern society and is, therefore, sometimes used fairly loosely to describe a wide set of issues that, whilst provoking some negative reaction, typically do not impact greatly upon many people’s day-by-day lives. In contrast, anti-social behaviour incidents that are reported to authorities are far more likely to have a deep-seated impact on the individual’s quality of life (in many cases it will likely have already escalated, will be repetitive or causing significant distress to the person who has made the report).
Indeed, discussion in the groups illustrated that the ‘anti-social behaviour’ calls to the police do not reflect the wider views of anti-social behaviour; those reported are far more serious in terms of their impact on people’s lives. When considering the types of anti-social behaviour that have been/are likely to be reported, people make no distinction between the impact of ‘anti-social behaviour’ and the impact of most criminal behaviour, and therefore feel they warrant the same response.
2. Responsibility for dealing with anti-social behaviour
Given that anti-social behaviour was generally associated with wider moral standards such as respect for others and common decency, participants in the groups typically felt that responsibility for dealing with anti-social behaviour should be collective. Participants mentioned individuals as well as collective groups, such as ‘parents’, ‘neighbourhood watch’ and ‘bouncers’, alongside local agencies such as ‘the police’ and ‘the local council’. They also noted the responsibility of local businesses such as supermarkets and off-licences, specifically with regards to the sale of alcohol to teenagers.
Some distinction was made between these ‘agencies’ in terms of whether their responsibility towards dealing with anti-social behaviour would be in preventing its occurrence in the first place, or in dealing with the effects of the behaviours. In terms of prevention, both education and parenting were of key interest to participants who felt that more could be done to build greater levels of respect moving forwards.
Everything, anti-social behaviour, everything what’s going on in and around London and stuff like that it’s just complete and utter madness and it’s the norm, people see it as the norm, it’s acceptable. It’s just deciding where do you start to address it? And it’s not the job of the police, it’s down to every single person. In my opinion it’s down to the parents, how you raise your kids. At the end of the day the buck stops with you and that’s what I think, that’s the way I look at it. Discussion in London group

Policing anti-social behaviour: The public perspective
16
The police were felt to have multiple roles; acting to prevent anti-social behaviour by being a visible presence in communities, helping to foster positive relations with communities and responding to specific reports of anti-social behaviour. That said, many participants expressed an appreciation that to place all responsibility onto the police alone was unrealistic. People felt that the police were restrained by the degree of administration that their jobs entailed, by wider strategic concerns such as target setting, and the sheer amount of responsibilities placed upon them. That said, in general participants tended to have fairly negative top-of-mind perceptions about how well the police, including Police Community Support Officers (PCSOs), currently deal with anti-social behaviour. Some participants provided examples of situations where individual police officers or PCSOs had not dealt well with anti-social behaviour in their local areas, while more generally participants felt that ‘real’ police officers (as opposed to PCSOs) were largely absent when anti-social behaviour situations arose.
…that is not the fault of the police…it is the fact that the police are under-resourced, there are not enough of them out on the street, they are too bogged down with paperwork. They try and plug the hole with the finger in the dam and they say, ‘well we will have these community support officers’. Male, Maidstone When my bag was stolen I stopped going to that little park, because it was in the daytime as well I just thought that was nuts and because there’s big groups of like alcoholic and like drug users, like big groups and they’re all like most of them men. And like because there was a PCSO there and I told him and he did nothing, he just phoned the police and I went, no I want to go up to them now and say give me back my bag. And he wouldn’t come with me I went by myself, he just like went off on his bike or something Female, London As is typical in discussions with the public around local policing issues, a perceived lack of police officers on the beat, notably within local residential areas, was raised as a policing priority in all discussions. Lack of familiarity with local officers, lack of awareness of engagement mechanisms and a general lack of connection with key strands of Neighbourhood Policing was consistent across the discussions. This lack of direct contact and communication with the police, means that many views are based on hearsay rather than rooted in direct experience.
We are living in a world now, you can order a pizza quicker than a policeman will come to your house. Male, Maidstone ….. yes, and they will be more effective as well.Female, Maidstone
There was a general lack of awareness and some confusion around the role of PCSOs as well as around the distinction between different grades of police officer and their respective powers. Some participants appeared to be misguided as to the position of ‘Special Constables’, often confusing these with PCSOs and considering them not to have any power

Policing anti-social behaviour: The public perspective
17
of arrest. In any case, participants felt that the police’s role in dealing with anti-social behaviour should be grounded in the local community, fostering links with those living in local areas, gathering intelligence about potential or actual local issues and bringing a visible presence to deter and reassure.
To a great extent many of these community-based ideas for dealing with anti-social behaviour mentioned by participants were not new and reflect many of the concepts underpinning Neighbourhood Policing and the Policing Pledge. However, there is clearly a need to raise awareness of the presence, availability and actions being taken by local teams. This will help build confidence that local teams are genuinely listening and have the resources and ability to deal with locally relevant ASB issues.
Whilst participants noted that the ideal model for dealing with anti-social behaviour would be ‘communal’ or ‘collective’, the current situation was felt to be the opposite; involving a situation where the responsibility for dealing with anti-social behaviour tended to fall to the individual(s) affected, or where everyone was under the impression that someone else would take responsibility for any issues that arose within communities. The theme of the collective versus the individual’s experience of anti-social behaviour and the critical nature of individual experience was one which underpinned discussions. Participants were mostly unable to prioritise particular issues in their communities except with reference to their individual experience. Accordingly, some participants felt particularly vulnerable to certain situations while others stated that their first response to some types of anti-social behaviour would be to deal with the problems directly themselves by personally confronting the offenders. The issues of vulnerability, empowerment and community are therefore central to the issues at stake and resonate strongly with recent tragic high-profile cases such as that of Fiona Pilkington and David Askew.
3. Reporting anti-social behaviour
Whilst anti-social behaviour is often defined with reference to the wider community, its impact on quality of life tends to be highly personalised. Most in the discussion groups noted that they would only report an incident if it had a direct impact on them personally, i.e. vandalism / graffiti would most likely need to be on their own property before they would report it.
Therefore, in effect much of what is considered to be anti-social behaviour at the wider level goes unreported and is largely tolerated, with this tolerance dependant on the impact on quality of life (emotional and behavioural), the type of behaviour, the perceived likelihood of something being actioned by reporting and the level of fear / anxiety around potential reprisals. Many ‘low-level’ anti-social behaviour issues are given the status of reflecting more general shifts in standards and are therefore not considered to be ‘reportable’ as such. At this level some tolerance is also driven by the view that dealing with the behaviour is not the responsibility of any particular individual; that it is ‘none of my business’. These tolerance levels also vary by area, with some living on more deprived estates noting how certain types of anti-social behaviour have become accepted as part of everyday life in their neighbourhoods.
In contrast, when participants felt that anti-social behaviour was directly impacting on their day-to-day lives, for example when vandalism was directed at private property rather than at communal areas, or when participants felt that behaviour was breaking the law rather than just standards of decency, then they considered reporting this to local agencies. Due to their nature, these issues tend not to be differentiated from ‘crime’ in terms of their perceived seriousness nor, consequently, the response that is expected.
The potential impact of reporting on the individual concerned was also taken into account before people considered doing so, since some participants felt that situations might be
Policing anti-social behaviour: The public perspective
18
exacerbated, or that there was the potential for reprisals. In effect, people therefore weigh-up the degree to which the situation impacts on their lives against the potential impact before deciding whether reporting is worthwhile. Perceptions that ‘nothing will be done’, were also cited as a barrier and included perceived powerlessness in terms of expecting the current situation simply to continue, and/or that perpetrators of anti-social behaviour would / could not be caught nor held responsible and appropriately punished.
No-one deals with it, they are just left to do their own thing up there really. Someone is supposed to call the police, so people are even too scared to do that now in case they come back. Female, Maidstone If I saw any anti-social behaviour where I lived I would feel that phoning the police would probably be a waste of time in all fairness … I don’t think that they would deal with it. Because 9 times out of 10 they slap their wrists and 2 minutes later they are back out there again Male, Shrewsbury Discussion around access to help from agencies focussed on the multi-agency environment. Participants tended to conclude that they would either expect to have one single contact number available in order to report any anti-social behaviour or that multiple numbers would be available but that local agencies should be expected to work together ‘behind the scenes’ in order to liaise around response and co-ordinate efforts accordingly. Any ‘passing of the buck’ between different agencies / contact numbers is immediately cited as a signal that agencies are not joined-up in their approach.
Participants expected that their reporting of anti-social behaviour should be dealt with sensitively by the agencies involved and that responses should take account of the particular situation. For example, where there is concern about fear of reprisals, attention should be given to the anonymity of the person reporting the behaviour. These sorts of concerns are also relevant regarding feedback mechanisms used, for example avoiding personal visits to people’s homes where there is a fear of reprisals, etc.
Across all discussions having feedback as to what is likely to happen as a result of the report was considered vital and as a message that people’s concerns were being taken seriously. Information following the subsequent action is seen as an ideal and would likely help to counter some of the current negative around police response.
Yes, someone reassuring you that you have done the right thing and that, you know, they have taken it seriously Female, Maidstone

Policing anti-social behaviour: The public perspective
19
Quantitative research

Policing anti-social behaviour: The public perspective
20
Quantitative research This chapter details findings from the telephone survey of people who had called the police during September 2009 to report an incident that the relevant police force had classified as anti-social behaviour. This large-scale survey provides robust and representative findings across a range of issues from perceptions of the way their call was handled and followed-up, through to wider perceptions of the police and ASB.
1. Perceptions of the local area
Respondents to the survey were asked some questions about their local area to gauge how people reporting anti-social behaviour to the police compare to the overall population, but more importantly, so that these views could be analysed against perceptions of the police and anti-social behaviour (see later sections). Those calling the police to report anti-social behaviour tend to be relatively long-standing residents of their local areas (mirroring the general public more widely). The majority (63%) say they have lived within a 15 minute walk of their home for the past ten years or more, with only six percent saying they have lived locally for less than two years. The majority of respondents (63%) feel they belong strongly to their local area, with 23% feeling they belong very strongly. This compares to just under two in five (36%) who do not feel they belong strongly to their local area. Results from the 2008-09 Citizenship survey, based on a nationally representative sample of adults in England and Wales, finds a slightly higher sense of belonging: 72% said they belonged strongly, with 28% feeling they belonged very strongly.2
Respondents’ sense of belonging varies by area. Those living in Cleveland and Dyfed Powys are most likely to feel they belong strongly to their local area (76% feeling they belong strongly), followed by those in Cumbria (75%), North Wales (74%), and Dorset and Norfolk (both 72%). Those living in Merseyside are least likely to feel they belong strongly to their local area (52%), followed by those in Northamptonshire (53%), London and South Yorkshire (both 55%). As with all comparisons by force area made in this report, one must be mindful of the significant variations that will exist within force areas (though the relatively small number of interviews per force means we cannot look at this in detail here). While most respondents feel they belong to their local area, opinion is divided on the cohesiveness of local communities. Similar proportions agree that their local community is ‘close and tight knit’ (42%) as disagree that this is the case (48%). Moreover, on balance respondents feel that their local area has got worse over the past year: one in five (19%) say their local area has improved, compared to a third (35%) who say it has got worse (around half, 46%, say it hasn’t changed much). This pattern broadly reflects results from the 2008-09 Citizenship survey, which found that 15% felt their local area had improved, compared to one in four (25%) who felt it had got worse3.
2 In should be noted that the Citizenship survey uses a face-to-face interviewing methodology, as opposed to the telephone methodology employed in the present research. As such, comparisons should be treated with caution. Similarly, given that the Citizenship Survey is nationally representative and therefore includes people who have not contacted the police (as well as those who have), then the difference in survey populations must also be noted. 3 The Citizenship question wording used a two year reference period, compared to the one year reference period in the present research.

Policing anti-social behaviour: The public perspective
21
In spite of divided opinion in terms of community cohesion, and a perception that, on balance, their local area is getting worse as a place to live, the large majority of respondents (81%) rate their quality of life as ‘good’, with around two in five (38%) rating their quality of life as very good. One in ten feels they have a ‘bad’ quality of life, with 4% saying their quality of life is very bad.
2. Overall attitudes to levels of anti-social behaviour and response
2.1 What is understood by ‘anti-social behaviour’?
One of the objectives of the research was to understand what individuals understand by the term ‘anti-social behaviour’. To this end, the questionnaire did not provide respondents with examples or with a definition, but rather asked what kinds of anti-social behaviour they had in mind when answering questions about anti-social behaviour in general.
The two most commonly mentioned forms of anti-social behaviour are: i) problems relating to drunken behaviour and under age drinking (mentioned by 30%), and ii) youths loitering in groups or gangs on the streets (29%).
Vandalism and graffiti (mentioned by 25%), rowdy or inconsiderate behaviour (23%), and noise and loud music (21%) are next most commonly mentioned.
Q. What types of anti-social behaviour have you been thinking about when answering the last few questions? (Top 10 mentions) Base: All (5,699) %Street drinking/drunken behaviour/under age drinking/youths drinking 30 Youths/teenagers/groups/ gangs loitering on the streets 29 Vandalism/graffiti 25 Rowdy or inconsiderate behaviour 23 Noise/loud music 21 Using/dealing drugs 13 Intimidation/threats/ harassment 11 Verbal abuse/abusive behaviour 11 Assault/violence/ fighting 10 Nuisance neighbours 10
Source: Ipsos MORI
The types of anti-social behaviour that respondents mention reflect the reasons for their calls to the police. For instance, 30% of respondents overall cited street drinking while answering questions about anti-social behaviour; however amongst those who called the police to report street drinking this rises to 79%. Similarly, while 29% of respondents overall mention youths loitering in the street, among those who called to report this issue to the police, the proportion citing it spontaneously as anti-social behaviour rises to 51%. A similar pattern is evident with regards vandalism and graffiti (mentioned by 25% overall, rising to 50% amongst those who reported this particular issue)4.
The types of anti-social behaviour cited vary to some extent with people’s perception of their own quality of life. In particular, those who say their quality of life is good (vs bad) are more
4 Note that because more than one type of anti-social behaviour can be mentioned, percentages add up to more than 100%.
Policing anti-social behaviour: The public perspective
22
likely to mention problems relating to street drinking (30% vs 25% respectively) and/or groups of youths loitering in the streets (30% vs 19%). Conversely, those who say their quality of life is bad (vs good) are twice as likely to mention intimidation (21% vs 10% respectively), abusive behaviour (19% vs 9%) and/or nuisance neighbours (17% vs 9%), and are also more likely to mention the use of and dealing of drugs (18% vs 13%) and/or violence and fighting (13% vs 9%).
A similar pattern emerges when looking at levels of deprivation, as defined by the Index of Multiple Deprivation5, which is not surprising given the strong links between levels of local deprivation and perceptions of quality of life. Those living in less deprived areas are relatively more likely to mention issues regarding street drinking and youths hanging around of the streets, while those living in more deprived areas more frequently bring to mind issues surrounding drugs, verbal abuse, violence and nuisance neighbours. This highlights potential variance in the scale and tolerance of anti-social behaviour across areas and the impact it has on local communities. Police forces must be aware that calls relating to a particular types of anti-social behaviour – notably intimidation and abuse, nuisance neighbours, violence and drugs – will be more likely to be having a greater impact on local quality of life. Forces should also be aware of the potential clustering of particular issues in more deprived areas.
2.2 Responsibility for dealing with anti-social behaviour
Respondents were asked who they feel is responsible for dealing with anti-social behaviour in their local area and were able to cite multiple responses.
Overwhelmingly, respondents from across all areas of the country feel that it is the police who are responsible for dealing with anti-social behaviour (90%). The local council is cited a distant second, mentioned by just over one in three (36%). While we might expect respondents in this survey to be more likely to mention the police given their prior contact with the police regarding anti-social behaviour, the findings do mirror previous Ipsos MORI research which shows the public tend to associate crime and anti-social behaviour issues very strongly with the police and above all other agencies6.
The police and local council are the only public services among the top six mentions. Respondents place more responsibility in the hands of parents, families, the community as a whole, and individuals than in other public services such as housing associations, schools, or indeed the government as a whole.
Around two in three respondents (68%) provide more than one response at this question, and of those mentioning the police, 38% also mention the local council.
5 The Index of Multiple Deprivation (IMD) is made up of seven separate Domain Indices at Lower Super Output Area (LSOA) level. The seven domains are indicators relating to income, employment, health and disability, education skills and training, barriers to housing and services, living environment, and crime, and these are then combined into a single deprivation score for each LSOA in England and Wales. 6 For example, previous research by Ipsos MORI in September 2008 showed 85% of the public spontaneously cite ‘the police’ when asked who they think is responsible for dealing with crime or anti-social behaviour in their local area, with the council the next most cited, by 24%
Policing anti-social behaviour: The public perspective
23
90%36%
16%15%
8%7%
5%4%4%4%
Most place responsibility for dealing with ASB with the police
Top 10 mentions
Base: 5,699 individuals in England and Wales recorded as having called the police to report anti-social behaviour in September 2009. Fieldwork dates: 4 May – 3 June 2010
Police
Q Who do you think is responsible for dealing with anti-social behaviour in your local area?
Local council
Parents/familyThe community as a whole
People themselves/individuals Everyone
Housing association/social landlordPCSOs/Community Support Officer
The GovernmentSchools
2.3 Perceptions of police performance locally
Balance of opinion towards local police performance is generally positive, with seven in ten (69%) feeling they do a good job overall, compared to around a quarter (27%) who feel they do a poor job.
Importantly, there is a very strong relationship between perceptions of police performance overall and respondents’ satisfaction with how the police treated them during the course of their contact. Of those who are satisfied with how they were treated by the police, a majority of four in five (79%) feel the police do a good job overall; in contrast, of those dissatisfied with how they were treated by the police, only a minority of only three in ten (30%) feel the police are doing a good job overall. This underlines the importance to forces of getting it ‘right’ when it comes to calls from the public around anti-social behaviour; if someone is left satisfied then it is highly probable that they will be an advocate of the police more widely, but if dissatisfied with the contact then it is likely they will be a detractor.

Policing anti-social behaviour: The public perspective
24
44
49
24
25
30
629
13
16
36
5
11
Satisfaction with contact has a strong link to overall perceptions of the police
Base: 5,699 individuals in England and Wales recorded as having called the police to report anti-social behaviour in September 2009. Fieldwork dates: 4 May – 3 June 2010
Q Taking everything into account, would you say the police in yourarea do a good job or a poor job?
All respondents
Those satisfied with treatment by police
Those dissatisfied with treatment by police
Net% +/-
+42
+61
-38
% Very poor % Fairly poor % Fairly good % Very good
2.4 Anti-social behaviour and local public services
Just over half of respondents agree that the police, local council and other public services are dealing with the anti-social behaviour issues that matter locally (53%), while one in three (33%) disagree. This trend is reversed, however, for those who do not rate their quality of life as ‘good’; on balance, those rating their quality of life as ‘neither good nor poor’ or ‘poor’ do not feel that local public services are delivering in this respect. For those rating their quality of life as poor, just one in three (32%) agree that local public services are dealing with anti-social behaviour, compared to three in five (58%) who disagree.
The extent to which local public services are thought to be dealing with anti-social behaviour is also heavily associated with respondents’ satisfaction with how they were treated by the police. Of those who are satisfied with the way they were treated, the majority (61%) feel that local public services are dealing with anti-social behaviour; of those dissatisfied with the way they were treated, only a minority (23%) feel that this is the case. Again this illustrates the wider impact of how the police deal with individual calls regarding anti-social behaviour.
Opinion is fairly evenly divided as to whether the amount of anti-social behaviour locally has increased or decreased over the past year: around half (47%) have seen no change, while slightly more think it has got worse (29%) than has got better (22%). This trend mirrors perceptions of how the local area as a whole is perceived to have changed over the last year (with around half, 46%, seeing no change, 35% feeling things have got worse, and 19% feeling things have got better). As we have seen, the overwhelming majority feel that it is the police who are responsible for dealing with anti-social behaviour, and consequently there is a strong relationship between overall ratings of the police and perceived changes in levels of anti-social behaviour. Among those who feel the police are doing a good job, there is a fairly even split between those feel anti-social behaviour levels have increased (23%) vs decreased (27%). Those who feel the police are doing a poor job, however, are around six
Policing anti-social behaviour: The public perspective
25
times more likely to feel that anti-social behaviour has increased than has decreased (46% vs 8%).
In spite of a tendency to feel that anti-social behaviour is, if anything, on the increase, respondents are twice as likely to believe that local public services have got better at dealing with anti-social behaviour over the past year (23%) than have got worse (12%). Most, however, have not seen any change (59%). Again, this view is strongly tied to perceptions of police performance overall, and to how respondents feel they were treated by the police. Of those feeling the police do a poor job, only 7% say they have seen an improvement in measures to tackle anti-social behaviour over the past year, and of those dissatisfied with their treatment by the police, this figure stands at 9%.
Those who felt the police took action in response to their calls are also more likely to feel that local public services have got better at tackling anti-social behaviour.
2.5 Levels of information
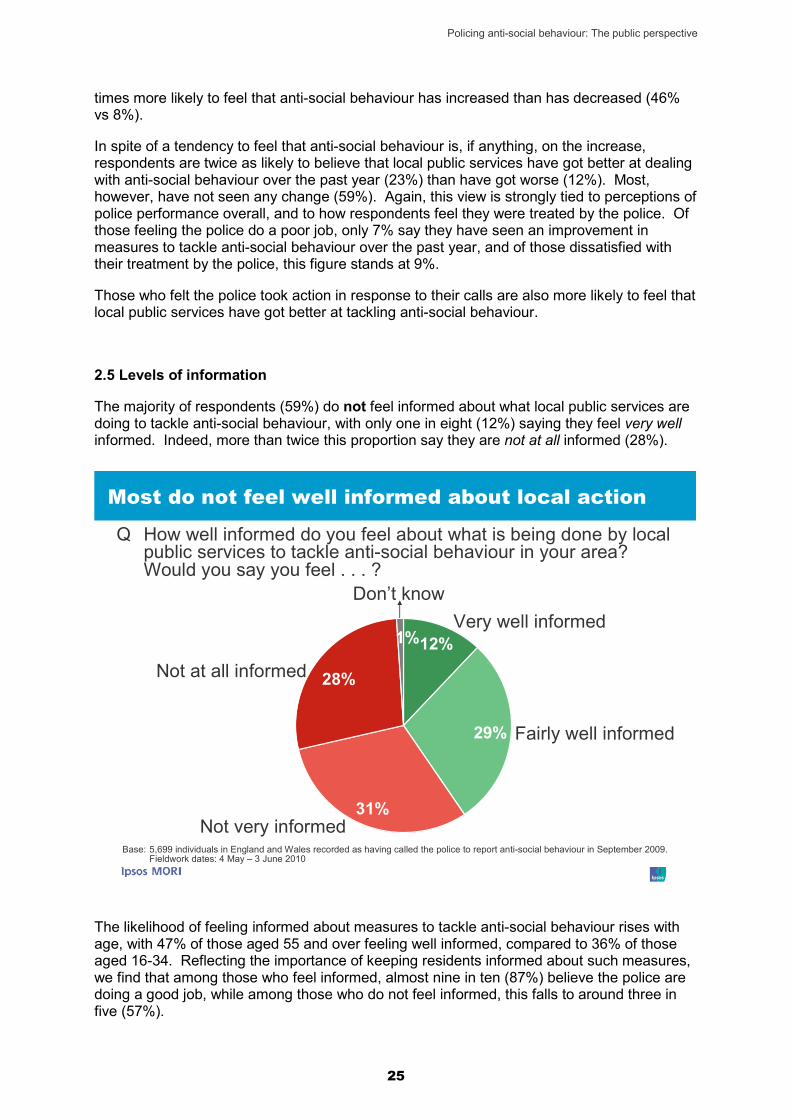
The majority of respondents (59%) do not feel informed about what local public services are doing to tackle anti-social behaviour, with only one in eight (12%) saying they feel very well informed. Indeed, more than twice this proportion say they are not at all informed (28%).
12%
29%
31%
28%
1%
Most do not feel well informed about local action
Very well informedDon’t know
Q How well informed do you feel about what is being done by local public services to tackle anti-social behaviour in your area? Would you say you feel . . . ?
Base: 5,699 individuals in England and Wales recorded as having called the police to report anti-social behaviour in September 2009. Fieldwork dates: 4 May – 3 June 2010
Fairly well informed
Not very informed
Not at all informed
The likelihood of feeling informed about measures to tackle anti-social behaviour rises with age, with 47% of those aged 55 and over feeling well informed, compared to 36% of those aged 16-34. Reflecting the importance of keeping residents informed about such measures, we find that among those who feel informed, almost nine in ten (87%) believe the police are doing a good job, while among those who do not feel informed, this falls to around three in five (57%).
Policing anti-social behaviour: The public perspective
26
2.6 The impact of anti-social behaviour
The majority of respondents (63%) feel that anti-social behaviour is a problem in their area, including around a quarter (23%) who feel it is a very big problem. Levels of anti-social behaviour are related to community cohesion; of those feeling their community is tight knit, just over half (54%) feel that anti-social behaviour is a problem, while among those who do not feel their community is tight knit, seven in ten (71%) see anti-social behaviour as a problem. A similar pattern is evident with respect to individuals’ sense of belonging, with those who feel they belong to their local area significantly less likely to see anti-social behaviour as a problem locally.
Underlining the impact that anti-social behaviour can have on quality of life, among those who feel their quality of life is poor, the great majority (85%) say that anti-social behaviour is a problem in their area, including over half (54%) who feel it is a very big problem.
The research assessed this relationship directly by asking respondents to rate, on a scale of one (no effect) to ten (total effect), how much of an impact anti-social behaviour has on their everyday quality of life. Defining scale points one to three as a ‘little effect’ and points eight to ten as a ‘large effect’, around one in five (22%) say that anti-social behaviour has a large effect on their everyday quality of life. This compares with just under two in five (38%) who say it has little effect. Among those who rate their quality of life overall as bad, three in five (62%) feel that anti-social behaviour has a large effect on their quality of life; this compares with just one in six (16%) among those who rate their quality of life as good.
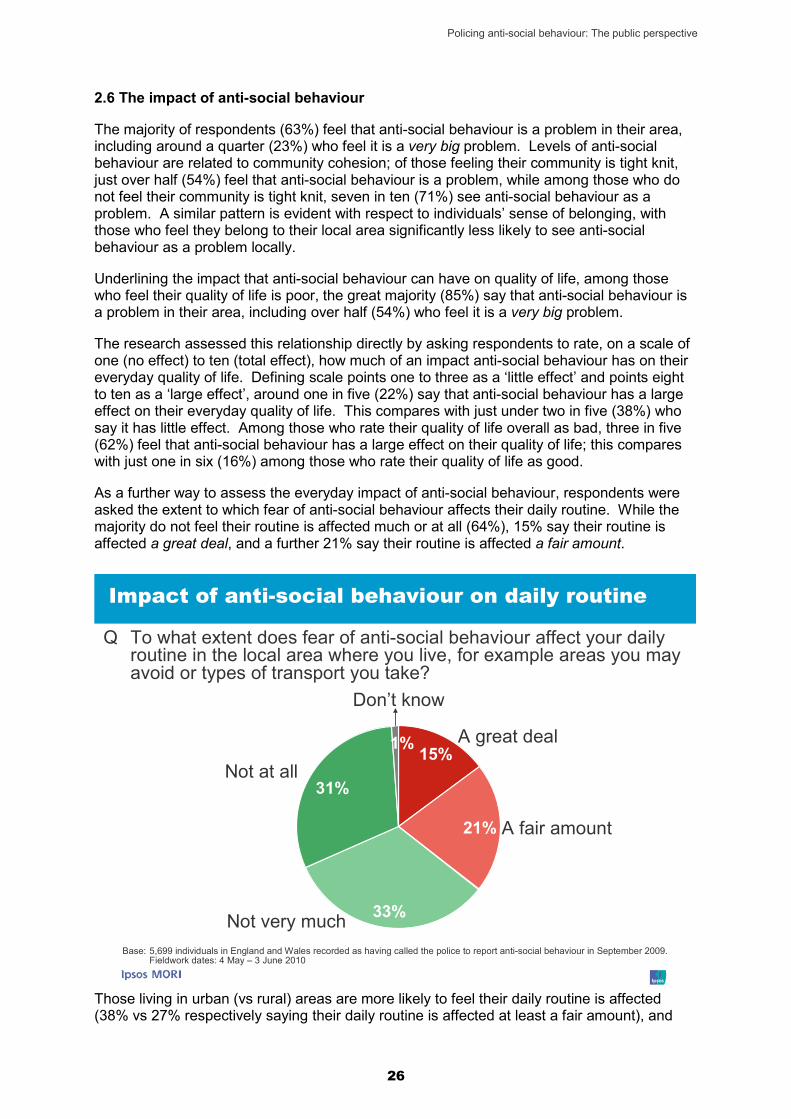
As a further way to assess the everyday impact of anti-social behaviour, respondents were asked the extent to which fear of anti-social behaviour affects their daily routine. While the majority do not feel their routine is affected much or at all (64%), 15% say their routine is affected a great deal, and a further 21% say their routine is affected a fair amount.
15%
21%
33%
31%
1%
Impact of anti-social behaviour on daily routine
A great deal
Don’t know
Q To what extent does fear of anti-social behaviour affect your daily routine in the local area where you live, for example areas you may avoid or types of transport you take?
Base: 5,699 individuals in England and Wales recorded as having called the police to report anti-social behaviour in September 2009. Fieldwork dates: 4 May – 3 June 2010
A fair amount
Not very much
Not at all
Those living in urban (vs rural) areas are more likely to feel their daily routine is affected (38% vs 27% respectively saying their daily routine is affected at least a fair amount), and

Policing anti-social behaviour: The public perspective
27
among those living in the most (vs least) deprived areas are more likely to face disruption to their daily lives (43% vs 27% respectively). These trends show the importance of tailoring strategies to tackle anti-social behaviour to meet the characteristics and respective demands of local areas.
The most common ways in which individuals alter their routine is by avoiding certain areas or streets (around half, 48%, of those who say their routine is affected), and by avoiding staying out late (41%). Being more vigilant in general, and avoiding groups of youths are also common ways in which individuals alter their routine.
Those living in the most deprived areas are more likely to say they take precautions and are vigilant than those in the least deprived areas, and there is also a tendency for those in more deprived areas to limit their use of public transport due to fear of anti-social behaviour.
In what ways would you say that your daily routine is affected by fear of anti-social behaviour in the area that you live? (Top ten mentions).
Level of deprivation Base: All those saying fear of anti-social behaviour affects their routine ‘a great deal’ or ‘a fair amount’ (2,045)
Total Lowest Mid Low
Mid High
Highest
Avoid certain areas/streets 48 49 49 50 44 Avoid walking/staying out at night/going out at night
41 38 42 42 39
Take precautions/more aware/more vigilant 30 27 31 29 34 Avoid groups/gangs of youths/school children
27 23 27 28 27
Noise affects sleep/health/work 16 14 16 16 16 Do not use public transport 8 6 7 10 9 Worry about carrying cash/valuables/using cash machines
8 8 8 7 8
Worry about damage to car/property 3 2 4 3 4Avoid going out alone/ being alone 2 3 1 3 2Worry about family members/children 2 3 3 2 2
Source: Ipsos MORI
2.7 Likelihood of reporting anti-social behaviour
Respondents were asked how likely they would be to report ten different types of anti-social behaviour were they to personally witness or experience them in their local area. For each type of anti-social behaviour, at least two in five say they would probably, or would definitely report it.
Vandalism, graffiti, and other deliberate damage to property or vehicles is the type of anti-social behaviour most likely to be reported, with nine in ten (92%) saying they would report it, including 73% who say they definitely would report it. Similar proportions say they would report harassment due to discrimination (90%) and people using or dealing drugs (89%). At the other end of the scale, fewer than half say they would definitely or probably report rubbish and litter lying around (46%) or teenagers hanging around the streets (44%).
Those with children in their household are slightly less likely to report some forms of anti-social behaviour, perhaps reflecting differing tolerance levels. For instance, of those with (vs without) children in their household, 42% (vs 46%) say they would report teenagers hanging around on the street; 60% (vs 65%) would report noisy neighbours or loud parties; and 42% (vs 49%) would report litter or rubbish lying around. This pattern does not hold for other types of anti-social behaviour however, for instance harassment, intimidation, or drugs.

Policing anti-social behaviour: The public perspective
28
19
20
12
29
20
31
26
28
21
21
73
70
76
54
62
49
37
30
25
2337
34
32
26
12
12
12
7
6
5
16
19
9
8
4
5
3
3
3
2
Likelihood of reporting depends on the anti-social behaviour involved
Q Please can you tell me whether or not you would report it if you personally witnessed or experienced it in your local area.
Vandalism, graffiti and other deliberate damage to property or vehicles
Base: 5,699 individuals in England and Wales recorded as having called the police to report anti-social behaviour in September 2009. Fieldwork dates: 4 May – 3 June 2010
People being harassed because of their skin colour, ethnic origin, religion,
handicap or disability
People using or dealing drugs
People being insulted, pestered or intimidated in the street
Abandoned or burnt out cars
Nuisance neighbours or problem families
Noisy neighbours or loud parties
People being drunk or rowdy in public places
Rubbish or litter lying around
Teenagers hanging around on the streets
% Definitely would not report
% Probably would not report
% Probably would report
% Definitely would report
Policing anti-social behaviour: The public perspective
29
It should be borne in mind that this data represents individuals’ perceptions as to whether they would report these types of anti-social behaviour, and in some cases may be over-estimates of actual behaviour.
When asked how confident they are in the ability of local public services to do something about these ten types of anti-social behaviour, the majority (56%) express confidence, although only 14% say they are very confident. This broadly reflects the finding discussed previously: respondents agree by a slim margin that the police, local council and other public services are dealing with the anti-social behaviour issues that matter locally, with 53% in agreement, although only 17% in strong agreement.
Confidence in local public services to deal with these types of anti-social behaviour relate to respondents’ own experiences of the police. Those who are satisfied with how they were treated by the police when they called to report anti-social behaviour are more than twice as likely to place confidence in local public services’ ability to address these issues than those who are dissatisfied (63% vs 28% confident respectively). Similarly, where the police were felt to have taken action as a result of individuals’ calls, confidence is higher: a majority of two in three (66%) of those who felt the police took action place confidence in the ability of local public services to address these forms of anti-social behaviour, compared to a minority of 45% among those where the police did not take action.
3. Importance attached to anti-social behaviour
In order to gauge the importance that individuals place on anti-social behaviour, respondents were asked to rate how important it is that local public services focus their efforts on tackling a number of crime and anti-social behaviour related issues. These issues included three activities generally classified as anti-social behaviour (vandalism and graffiti, noisy neighbours, and people being drunk and rowdy in public places) and four types of crime (burglary, robbery, domestic violence, criminal damage, and vehicle crime).
Respondents are most likely to feel it is important to direct efforts at burglary (95% saying very important or essential), robbery (94%), and domestic violence (89%). This is followed by crimes where the level of physical threat is less pronounced, or absent: criminal damage (84%) and vehicle crime (79%).
While the three types of anti-social behaviour are not prioritised quite so highly, there is still a clear call for public services to direct their efforts at tackling these issues. A majority of over three in five (64%) feel it is either very important or essential that resources are directed at tackling vandalism and graffiti, and this proportion stands at just over half (54%) with respect to noisy and nuisance neighbours, and around half (47%) with respect to people being drunk or rowdy in public places. Only very small minorities do not feel it is important to focus efforts on tackling anti-social behaviour issues (seven percent or fewer).

Policing anti-social behaviour: The public perspective
30
46
46
44
49
46
40
34
30
49
48
45
35
33
24
20
1745
39
33
19
15
8
5
4
7
6
-2
-1
1
1
*
*
Focusing resources on anti-social behaviour and crime
Q Local public services need to decide how best to use their resources. With this in mind, and thinking about the impact that anti-social behaviour and crime has on you and others in your local area, how important do you think it is for local public services to focus their efforts on tackling the following issues?
Burglary of homes
Base: 5,699 individuals in England and Wales recorded as having called the police to report anti-social behaviour in September 2009. Fieldwork dates: 4th May – 3rd June 2010
Street robberies
Domestic violence
Criminal damage
Vehicle crime
Vandalism and graffiti
Noisy and nuisance neighbours
People being drunk or rowdy in public places
% Not important
% Fairly important
% Very important
% Essential
There is some evidence that the greater the personal experience of anti-social behaviour, the more likely people are to feel it important that local public services direct their efforts at tackling anti-social behaviour. For instance, among those who feel anti-social behaviour is (vs is not) a problem in their local area, 51% (vs 41%) feel it is very important or essential that efforts are directed at tackling drunk and rowdy behaviour. The respective proportions for noisy neighbours are 56% (among those who feel anti-social behaviour is a problem) vs 49% (among those who don’t), and for vandalism and graffiti are 67% (among those who feel anti-social behaviour is a problem) vs 60% (among those who don’t). Moreover, those who rate their quality of life as poor are more likely to feel it very important that resources are directed at tackling these forms of anti-social behaviour.

Policing anti-social behaviour: The public perspective
31
These findings show that even when asked directly alongside some serious crimes, the large majority of respondents continue to cite the importance of focussing efforts to tackle anti-social behaviour.
There is also evidence that factors such as social grade and likelihood of repeat calls to are correlated to the prioritisation attached to ASB. For example, as detailed in the table below, high repeat callers (here defined as those calling on six or more occasions within the past year) are more likely to say that it is essential that local public services focus their efforts on the three anti-social behaviour categories of vandalism and graffiti, noisy and nuisance neighbours and people being drunk or rowdy in public places.
Similarly, those in the less affluent social grades DE are more likely than those in the more affluent AB grades to say that local public services should focus on tackling anti-social behaviour issues. This again illustrates how those who are most directly affected by anti-social behaviour are more likely to feel that local public services should focus their efforts on tackling it.
Q. Local public services need to decide how best to use their resources. With this in mind, and thinking about the impact that anti-social behaviour and crime has on you and others in your local area, how important do you think it is for local public services to focus their efforts on tackling the following issues:
Total Frequency of calls to report ASB
Social Grade Base: All (5,699)
Single caller
Medium repeat caller
High repeat caller
AB C1C2 DE
Burglary of homes Essential 49 50 48 51 55 52 44 Very important 46 45 47 44 41 44 50 Fairy important 4 5 4 4 4 4 5 Not important * * * * * * 1 Street robberies Essential 46 49 47 49 54 52 41 Very important 46 46 47 44 41 43 52 Fairy important 5 4 5 5 5 4 6 Not important 1 1 * * * 1 * Domestic Violence Essential 48 45 44 47 49 48 40 Very important 44 44 46 43 40 42 49 Fairy important 8 9 8 8 9 8 8 Not important 1 1 1 1 1 1 1 Criminal Damage Essential 35 35 34 38 38 36 32 Very important 49 47 50 48 45 48 52 Fairy important 15 17 16 12 17 17 14 Not important * * * * 1 * 1 Vehicle Crime
Essential 33 33 31 35 34 34 31 Very important 46 46 47 45 42 46 49 Fairy important 19 20 20 17 23 19 17 Not important 1 1 1 1 1 1 2

Policing anti-social behaviour: The public perspective
32
Total Frequency of calls to report ASB
Social Grade Base: All (5,699)
Single caller
Medium repeat caller
High repeat caller
AB C1C2 DE
Vandalism and graffiti Essential 24 21 24 28 24 24 25 Very important 40 37 40 42 36 40 42 Fairy important 33 39 33 27 37 34 29 Not important 2 2 3 2 2 2 3 Noisy and nuisance neighbours Essential 20 16 19 24 16 20 21 Very important 34 32 34 36 31 31 39 Fairy important 39 45 40 32 45 43 33 Not important 6 6 6 5 7 6 5 People being drunk or rowdy in public places
Essential 17 14 16 21 16 16 18 Very important 30 27 30 33 26 30 33 Fairy important 45 51 46 38 49 46 41 Not important 7 8 7 6 9 7 6
Source: Ipsos MORI
NB: Medium repeat callers = people who have called 2-5 times to report ASB in past year High repeat callers = people who have called 6+ times
4. Details of previous calls
4.1 Frequency of calling the police to report anti-social behaviour
Over two in three respondents (68%) are repeat callers within the past 12 months, having called the police to report anti-social behaviour more than once over the past year. Over one in four (28%) have called the police to report anti-social behaviour five or more times, and one in five (19%) have called ten or more times over the past 12 months.

Policing anti-social behaviour: The public perspective
33
29
33
18
11
17
18
17
10
24
23
25
24
28
24
37
51
% Once % Twice % Three to Five times % More than five times
Frequency of reporting anti-social behaviour
Base: 5,496 individuals who have called the police in the past year. Fieldwork dates: 4 May – 3 June 2010
Q Approximately, how many times over the past year have you called the police to report anti-social behaviour?
Quality of life: Good
Quality of life: Neither good nor bad
Quality of life: Bad
Total
The extent of repeat calls tends to vary by respondents’ overall quality of life. Among those who rate their quality of life as ‘good’, one in four (24%) have made five or more calls over he past year. This doubles among those who feel they have a ‘bad’ quality of life (51%).
The extent of repeat calls also varies by levels of deprivation: of those living in the least deprived areas just one in five (19%) have called the police more than five times in the past year, whereas among those living in the most deprived areas this proportion almost doubles to 35%.
Q. Approximately how many times over the past year have you called the police to report anti-social behaviour?
Base: All who have called the police in past year (5,496)
Called police once in past
year
Called 2-5 times
Called more than 5 times
Don’t know/ can’t
remember All respondents 29 40 28 3 Level of Deprivation Lowest 38 40 19 3 Mid-low 31 41 26 3 Mid-high 27 39 31 3 Highest 21 41 35 2
Source: Ipsos MORI
There is evidence that the more calls that are made to the police, the more disillusioned individuals are with the response of the police and local public services. For instance, the number of calls made over the past year varies by respondents’ opinion of whether their call made a difference: of those who felt their call in September 2009 made little difference, 32% have called the police more than five times over the past year, compared to 24% among

Policing anti-social behaviour: The public perspective
34
those who felt their call did make a difference. Furthermore, of those who do not feel local public services are dealing with the anti-social behaviour issues that matter, 39% have called the police more than five times over the past year, compared to 23% among those who feel that public services are dealing with the issues that matter. Finally, overall perceptions of the police are associated with the number of calls made: of those who feel the police are doing a poor job, 37% have called more than five times, compared to 25% among those who think the police are doing a good job.
Repeat callers are also more likely to have an illness or disability. Over a third (36%) of ‘high repeat callers’ (callers who have reported ASB six times or more over the past year) have an illness or disability. In contrast, 22% of respondents who have made a single call to report anti-social behaviour in the past year state that they have an illness or disability.
These results should be interpreted in the context of the nature of the repeat calls. Two in three (66%) respondents who have called the police more than once in the past year to report anti-social behaviour say that, in general, their calls were made in relation to the same or related problems.
In terms of the types of problems cited by callers, the patterns are generally the same for both single callers and repeat callers; rowdy/inconsiderate behaviour being the most likely incident type across all callers. However, when focusing on specific incident types, there are some notable variations in the overall make-up of callers. For example, in the case of abandoned vehicles and animal problems, over half of all calls come from people who have made only one call in the past year. In contrast, over 80% of people who have called about street drinking, teenagers hanging around and/or vandalism/graffiti are people who have called at least twice times in the past year (and at least 40% of them will have called 5+ times). Therefore, call handlers responding to a call about one of these issues will be very likely to be speaking to a repeat caller.
Q. Approximately how many times over the past year have you called the police to report anti-social behaviour?
Base: All who have called the police in past year (5,496)
Called police once in past
year
Called 2-5 times
Called more than 5 times
Don’t know/ can’t
remember All respondents 29 40 28 3 Type of incident called about (most frequent mentions only)
Abandoned vehicles 56 29 9 6 Animal problems 51 30 13 6 Rowdy/inconsiderate behaviour
30 42 26 2
Vehicle nuisance 30 40 27 3 Noise 28 48 22 2 Nuisance neighbours 26 41 31 2 Vandalism/graffiti 17 36 45 2 Street drinking 16 37 46 1 Teenagers/kids in street 14 38 47 2
Source: Ipsos MORI
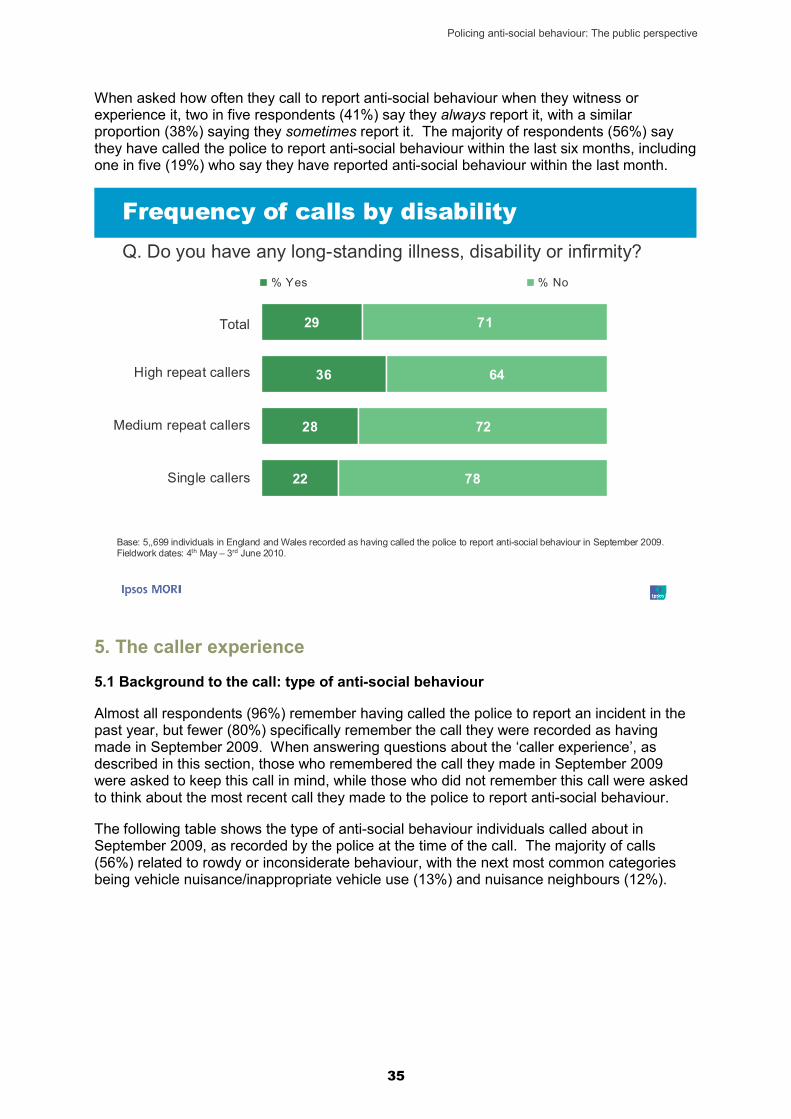
Policing anti-social behaviour: The public perspective
35
When asked how often they call to report anti-social behaviour when they witness or experience it, two in five respondents (41%) say they always report it, with a similar proportion (38%) saying they sometimes report it. The majority of respondents (56%) say they have called the police to report anti-social behaviour within the last six months, including one in five (19%) who say they have reported anti-social behaviour within the last month.
29
36
28
22
71
64
72
78
% Yes % No
Frequency of calls by disability
Base: 5,,699 individuals in England and Wales recorded as having called the police to report anti-social behaviour in September 2009. Fieldwork dates: 4th May – 3rd June 2010.
Q. Do you have any long-standing illness, disability or infirmity?
Total
High repeat callers
Medium repeat callers
Single callers
5. The caller experience
5.1 Background to the call: type of anti-social behaviour
Almost all respondents (96%) remember having called the police to report an incident in the past year, but fewer (80%) specifically remember the call they were recorded as having made in September 2009. When answering questions about the ‘caller experience’, as described in this section, those who remembered the call they made in September 2009 were asked to keep this call in mind, while those who did not remember this call were asked to think about the most recent call they made to the police to report anti-social behaviour.
The following table shows the type of anti-social behaviour individuals called about in September 2009, as recorded by the police at the time of the call. The majority of calls (56%) related to rowdy or inconsiderate behaviour, with the next most common categories being vehicle nuisance/inappropriate vehicle use (13%) and nuisance neighbours (12%).

Policing anti-social behaviour: The public perspective
36
Type of anti-social behaviour September 2009 call related to, as recorded by police records (Top 10 mentions) Base: All where ASB closing category recorded in police records (4,954)
%
Rowdy or inconsiderate behaviour 56 Vehicle nuisance/ inappropriate vehicle use 13 Nuisance neighbours 12 Abandoned vehicles 3 Noise 3 Teenagers/ kids in street 2 Street drinking 2 Vandalism/ graffiti 2 Animal problems 2 Trespass 1
Source: Ipsos MORI
Those who do not remember calling the police in September 2009 are most likely to say that their most recent call related to rowdy or inconsiderate behaviour (29%), followed by vandalism or graffiti (10%), vehicle nuisance or inappropriate vehicle use (8%) and teenagers and kids in the street (8%). There types of anti-social behaviour reported vary to some extent by level of deprivation. As illustrated in the following table, those living in less deprived areas are more likely to report vehicle nuisance or inappropriate vehicle use, while those living in more deprived areas are more likely to report assault/fighting and nuisance neighbours. Type of anti-social behaviour most recent call was about (those who could not remember September 2009 call) by level of deprivation. Top 10 mentions.
Level of deprivation Base: All who cannot remember ASB call in September 2009 (1,090) Total Lowest Mid
Low Mid High
Highest
Rowdy or inconsiderate behaviour 29 25 31 32 29 Vandalism/ graffiti 10 7 9 10 10 Vehicle nuisance/inappropriate vehicle use 8 10 12 5 7 Teenagers/ kids in street 8 8 8 9 7Nuisance neighbours 8 6 9 7 10 Street drinking 6 6 5 4 7Noise 4 4 4 3 3Trespass 4 5 4 2 3Assault/fighting 3 2 1 3 4Theft 2 5 1 2 1
Source: Ipsos MORI
5.2 Satisfaction with overall call handling and call outcomes
The majority of around two in three callers (65%) say that, overall, they are satisfied with how the police handled their call.

Policing anti-social behaviour: The public perspective
37
In general, the caller experience is typically a positive one in terms of access and perceived treatment. The large majority of callers are satisfied with the ease with which they were able to contact the police (80% satisfied, including 53% who are very satisfied) and with how well the police listened to what they had to say (82% satisfied, including 54% who are very satisfied). Similarly high proportions are satisfied with the way they were treated by police and staff during the course of their contact with them (78% satisfied, including 50% who are very satisfied). The majority of callers are also happy that their call was taken seriously (72% satisfied), and are satisfied with the speed with which the police responded to their initial contact (65%). Callers are less likely to be satisfied with feedback from the police following their call; just over half (56%) say they are satisfied with the way in which they were provided with information from the police following their call. In contrast one in three (35%) are dissatisfied, including over one in five (22%) who are very dissatisfied. As with all the findings around the caller experience, it is important to bear in mind the role of caller expectations in framing levels of satisfaction. The questionnaire has not specifically covered levels of expectations (this would have required significant additional questionnaire length) but when interpreting results and considering implications, this is an area that should not be ignored.
28
29
26
27
25
26
25
37
54
53
50
47
39
3113
10
10
9
6
8
5
22
19
18
14
11
9
9
The caller experience
Base: 5,496 individuals who have called the police in the past year. Fieldwork dates: 4 May – 3 June 2010
Q To what extent were you satisfied or dissatisfied with the following . . . .
How well they listened towhat you had to say
Ease with which you were able to contact the police
How seriously your call was taken
The way you were treated by officers/staff during course of contact with them
Overall, how the police handled your call
How quickly the police respondedto your initial contact
Way in which your were provided with information from police following your call
% Very dissatisfied % Fairly dissatisfied % Fairly satisfied % Very satisfied
Net% +/-
+37
+49
+63
+61
+65
+21
+68
Focusing in more detail on the initial response to calls, it is instructive to note which groups are most likely to be dissatisfied with police performance. Overall, one in six (17%) are dissatisfied with the ease with which they were able to contact the police. Dissatisfaction with ease of contact is higher among older callers (20% of those aged 55+ are dissatisfied, vs 13% of those aged 16-34). Three in ten (29%) are dissatisfied with how quickly the police responded to their initial contact, and while there is little difference in dissatisfaction levels across age groups, those calling about noise and street drinking are least happy with the

Policing anti-social behaviour: The public perspective
38
speed of response (38% and 35% dissatisfied respectively). Those calling about incidents which may be felt to be less of an immediate concern, such as abandoned vehicles and litter/drugs paraphernalia, are less likely to be dissatisfied with how quickly the police responded (16% and 21% dissatisfied respectively). During the call itself, one in seven (14%) were unhappy with how well the police listened to what they had to say. The type of anti-social behaviour has an influence here, with those calling about nuisance neighbours (22% dissatisfied) and noise (20%) least likely to feel they were listened to. Overall around one in four (23%) were dissatisfied with how seriously their call was taken. Opinion about how seriously calls were taken varies little by age or social grade, but does vary by incident type, with those reporting animal problems (34% dissatisfied), noise (33%) and nuisance neighbours (31%) most likely to be dissatisfied. When asked how satisfied they are overall with how the police handled their call, around two in three (65%) are satisfied, with over a quarter (28%) dissatisfied. Levels of dissatisfaction are highest among those calling to report animal problems (40% dissatisfied), noise (42%), and nuisance neighbours (36%). A similar pattern emerges when looking at how callers felt they were treated by officers and staff during the course of their contact with them: while around four in five (78%) are satisfied, one in six (17%) are dissatisfied, and this dissatisfaction is highest among those reporting animal problems (21% dissatisfied), noise (22%), and nuisance neighbours (27%). These consistent findings around particular types of anti-social behaviour, particularly nuisance neighbours given the large numbers of calls the issue generates, raise questions around potential divergence between police understanding of how such issues are handled and resolved, and what the public might expect. It may also reflect issues around the effectiveness of partnership working and taking of ownership around some of these problems. It should also be noted that the quality of the caller experience has strong associations with overall perceptions of the police and belief in the ability of public services to tackle anti-social behaviour. For instance, as detailed in the following table, those who felt the police listened to what they had to say, that they could contact the police easily, that they were taken seriously, and that they were subsequently kept informed are all more likely to feel the police do a good job overall and agree that they deal with local anti-social behaviour issues. The quality of the caller experience also relates strongly to whether action was felt to have been taken by the police in response to the call. For instance, where the police took action, nine in ten (91%) felt they were listened to, compared to 73% among those where no police action was taken. Furthermore where the police took action four in five (79%) were happy with how the police handled their call, compared to just 15% where the police took no action.

Policing anti-social behaviour: The public perspective
39
The caller experience Total Action taken
by police? Perception of
Police Police/public
services dealing with
issues
Base: All who have called the police in the past year (5,496)
Yes No Good Poor Agree Dis-agree
Overall, how the police handled your call
Satisfied 65 81 49 78 34 80 44 Dissatisfied 28 15 45 16 59 15 49 How well they listened to what you had to say
Satisfied 82 91 73 92 60 92 67 Dissatisfied 14 7 23 6 35 6 28 Ease with which you were able to contact the police
Satisfied 80 84 75 86 63 88 68 Dissatisfied 17 13 20 11 32 10 27 Way treated by police/staff during contact
Satisfied 78 89 65 89 51 89 60 Dissatisfied 17 9 28 7 41 8 33 How seriously your call was taken Satisfied 72 86 57 84 43 85 52 Dissatisfied 23 12 37 13 50 12 41 How quickly the police responded to your initial contact
Satisfied 65 79 51 76 36 79 45 Dissatisfied 29 17 43 17 58 16 49 Way in which you were provided with information following your call
Satisfied 56 74 44 68 29 71 35 Dissatisfied 35 19 48 23 64 21 57
Source: Ipsos MORI

Policing anti-social behaviour: The public perspective
40
6. Consequences of the call
6.1 Action taken by the police
Two in five respondents (41%) say that they were told police would take action as a result of their call, including 30% saying they were told police would definitely take action. This compares to 15% who were told the police would not take any action.
When asked whether the police did eventually take action, two in five (39%) say they are aware of action that the police took in response to their call. The same proportion of people say the police ended up taking no action (39%), while 22% did not know.
Of those who say the police took action, for the majority this took the form of police attending the scene (56%). The next most common police responses were to disperse or separate the perpetrators (13%), stop the noise or disruption that the call related to (13%), or visit the person reporting the incident (12%).
56%13%13%12%11%11%
6%4%3%3%
Action taken by the police
Top 10 mention
Base: All who say that the police took action as a result of their call (2,129). Fieldwork dates: 4 May – 3 June 2010
Attended the scene
Q What action did the police take?
Dispersed/separated the perpetratorsStopped the noise/disruption
Came to see me Made an arrest/arrests
Cautioned the perpetrators Spoke to me/reassured me over the phone
Got other public services/agencies involved Spoke to the offenders
Warning letter issues
There are differences in the police response when looking at the type of anti-social behaviour the call related to. For instance, those who called about animal problems or nuisance neighbours are more likely to say that the police cautioned the perpetrators (23% and 18% vs 11% overall). Calls relating to either nuisance neighbours or rowdy or inconsiderate behaviour are more likely to have led to police making an arrest (both 13%), whilst calls relating to street drinking or teenagers/kids in the street, are more likely to lead to the police dispersing or separating the perpetrators (30% and 26% respectively, vs 13% overall).

Policing anti-social behaviour: The public perspective
41
The majority of those who noted that their call led to police taking action were satisfied with the action taken by police (83% satisfied, including 55% who were very satisfied). One in eight (13%) say they were dissatisfied with the action taken. Once again, however, it should be noted that certain groups are more likely to be satisfied than others. For instance, those who called about nuisance neighbours are more likely to be dissatisfied (21% vs 13% overall).
28
27
31
55
63
22
5
4
12
8
4
28
Satisfaction with police action
Base: All who say that the police took action as a result of their call (2,129). Fieldwork dates: 4 May – 3 June 2010
Q How satisfied or dissatisfied were you with the action taken by the police?
% Very dissatisfied % Fairly dissatisfied % Fairly satisfied % Very satisfied
Net% +/-
+82
+13
+70
Those feeling police do good job
Those feeling police do poor job
Total
As the chart shows, the impact of police handling and response to calls cannot be underestimated. Those who feel the police do a poor job overall are significantly more likely to be dissatisfied with the action police took (40%) than those who feel they do a good job (8%).
Related to this, respondents who called the police to report anti-social behaviour on just one occasion in the past year are more likely than repeat callers to be satisfied with the action taken by police. The following chart shows the differences between single, ‘medium’ (2-5 calls in past year) and ‘high’ (6+) repeat callers.
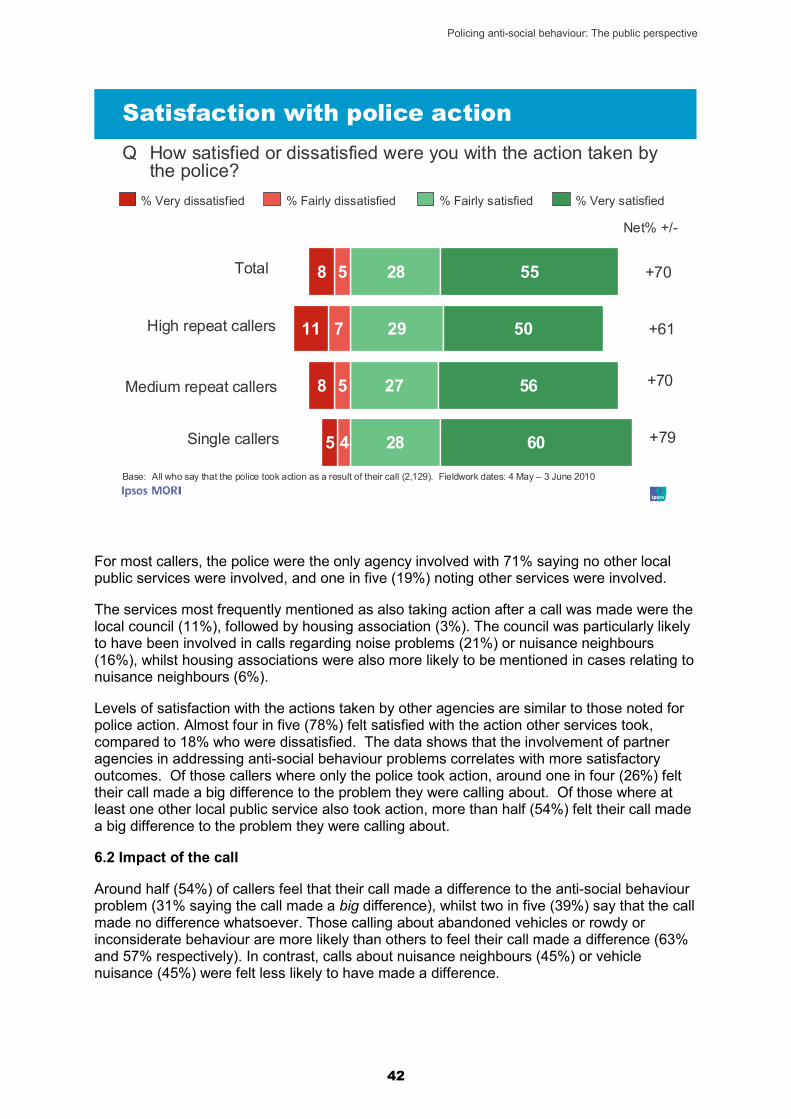
Policing anti-social behaviour: The public perspective
42
28
29
27
28
55
50
56
604
5
5
7
5
8
11
8
Satisfaction with police action
Base: All who say that the police took action as a result of their call (2,129). Fieldwork dates: 4 May – 3 June 2010
Q How satisfied or dissatisfied were you with the action taken by the police?
% Very dissatisfied % Fairly dissatisfied % Fairly satisfied % Very satisfied
Net% +/-
+61
+70
+70
Medium repeat callers
Total
High repeat callers
Single callers +79
For most callers, the police were the only agency involved with 71% saying no other local public services were involved, and one in five (19%) noting other services were involved.
The services most frequently mentioned as also taking action after a call was made were the local council (11%), followed by housing association (3%). The council was particularly likely to have been involved in calls regarding noise problems (21%) or nuisance neighbours (16%), whilst housing associations were also more likely to be mentioned in cases relating to nuisance neighbours (6%).
Levels of satisfaction with the actions taken by other agencies are similar to those noted for police action. Almost four in five (78%) felt satisfied with the action other services took, compared to 18% who were dissatisfied. The data shows that the involvement of partner agencies in addressing anti-social behaviour problems correlates with more satisfactory outcomes. Of those callers where only the police took action, around one in four (26%) felt their call made a big difference to the problem they were calling about. Of those where at least one other local public service also took action, more than half (54%) felt their call made a big difference to the problem they were calling about.
6.2 Impact of the call
Around half (54%) of callers feel that their call made a difference to the anti-social behaviour problem (31% saying the call made a big difference), whilst two in five (39%) say that the call made no difference whatsoever. Those calling about abandoned vehicles or rowdy or inconsiderate behaviour are more likely than others to feel their call made a difference (63% and 57% respectively). In contrast, calls about nuisance neighbours (45%) or vehicle nuisance (45%) were felt less likely to have made a difference.
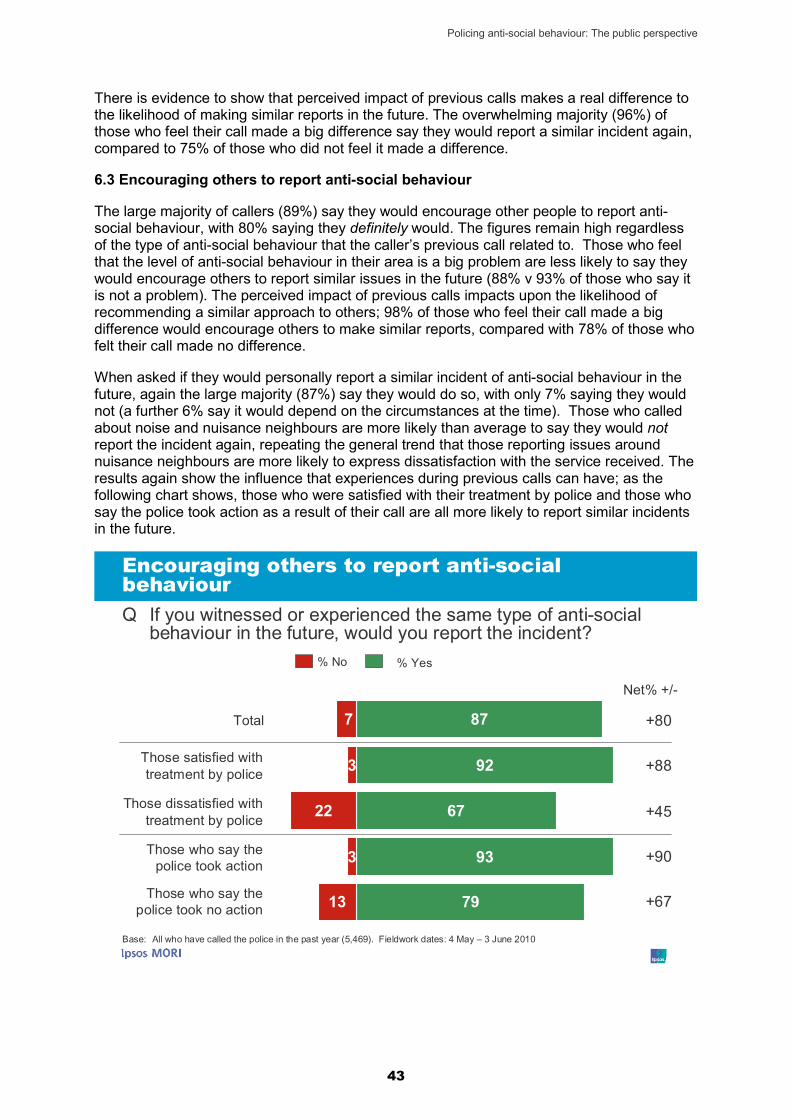
Policing anti-social behaviour: The public perspective
43
There is evidence to show that perceived impact of previous calls makes a real difference to the likelihood of making similar reports in the future. The overwhelming majority (96%) of those who feel their call made a big difference say they would report a similar incident again, compared to 75% of those who did not feel it made a difference.
6.3 Encouraging others to report anti-social behaviour
The large majority of callers (89%) say they would encourage other people to report anti-social behaviour, with 80% saying they definitely would. The figures remain high regardless of the type of anti-social behaviour that the caller’s previous call related to. Those who feel that the level of anti-social behaviour in their area is a big problem are less likely to say they would encourage others to report similar issues in the future (88% v 93% of those who say it is not a problem). The perceived impact of previous calls impacts upon the likelihood of recommending a similar approach to others; 98% of those who feel their call made a big difference would encourage others to make similar reports, compared with 78% of those who felt their call made no difference.
When asked if they would personally report a similar incident of anti-social behaviour in the future, again the large majority (87%) say they would do so, with only 7% saying they would not (a further 6% say it would depend on the circumstances at the time). Those who called about noise and nuisance neighbours are more likely than average to say they would not report the incident again, repeating the general trend that those reporting issues around nuisance neighbours are more likely to express dissatisfaction with the service received. The results again show the influence that experiences during previous calls can have; as the following chart shows, those who were satisfied with their treatment by police and those who say the police took action as a result of their call are all more likely to report similar incidents in the future.
87
92
67
93
79
7
3
22
3
13
Encouraging others to report anti-social behaviour
Base: All who have called the police in the past year (5,469). Fieldwork dates: 4 May – 3 June 2010
Q If you witnessed or experienced the same type of anti-social behaviour in the future, would you report the incident?
% No % Yes
Net% +/-
+45
+67
+80Total
Those dissatisfied with treatment by police
Those satisfied with treatment by police
Those who say the police took action
Those who say the police took no action
+90
+88
Policing anti-social behaviour: The public perspective
44
In terms of reasons for not reporting again, the main reasons cited are a lack of support from the police (32%), a perception that they would spend too much time and hassle waiting for an unsatisfactory outcome (28%) and a perception that the police ‘do not care’ (21%). Again those who called about nuisance neighbours hold some of the most negative views towards the police response, being more likely than others to say that they wouldn’t report the incident because the police don’t care (29%).
7. Intimidation as a result of reporting anti-social behaviour
7.1 Fear of intimidation
One in five (19%) say that fear of intimidation or repercussions have stopped them from reporting anti-social behaviour in the past. This proportion is higher among women than men (22% v 15% respectively), and among those with (vs without) a disability (21% v 17%). Those who have lived in the local area for less than 2 years (23%) are also more likely than average to say that fear of intimidation has stopped them from reporting anti-social behaviour in the past, as are those whose call related to nuisance neighbours (22%).
Community cohesion and local characteristics are also influencing factors. Those feeling their community is tight knit are less likely to have held off making a report (16%) than those who feel they do not live in a tight knit community (21%); and those who feel they belong to their local area are less likely to have been put off making a report than those who do not feel a sense of belonging (15% vs 24% respectively).
7.2 Experience of intimidation
When asked if they have actually experienced intimidation or repercussions as a result of reporting anti-social behaviour, around one in three (32%) say they have.
Those who have a disability are more likely to have experienced intimidation (43%) than those without (27%), whilst those in the less affluent lower social grades are also more likely to have had such experiences (39% of those in the less affluent social grades DE say they have, compared with 25% in social grades AB). Looking at type of anti-social behaviour, those reporting nuisance neighbours are more likely than average to say that they have experienced intimidation or repercussions (46%).
As illustrated in the following chart, experience of intimidation is closely linked to quality of life; amongst those who say their quality of life is good, just over a quarter (27%) say they have experienced intimidation in some form. In contrast, among those who say their quality of life is bad, this figure rises to a majority of 61%. Linked to this, those living in the most (vs least) deprived areas are more likely to have experienced intimidation or repercussions (37% vs 27% respectively).

Policing anti-social behaviour: The public perspective
45
8
9
5
3
59
63
47
34
32
27
46
61
% No - have not reported anti-social behaviour before% No - have reported but have not experienced intimidation or repercussions% Yes
Experience of intimidationQ Have you ever experienced intimidation or repercussions as a
result of reporting anti-social behaviour?
Quality of life: Good
Quality of life: Neither good nor bad
Quality of life: Bad
Total
Base: 5,699 individuals in England and Wales recorded as having called the police to report anti-social behaviour in September 2009. Fieldwork dates: 4 May – 3 June 2010
7.3 Priorities for improvements
Those who called the police in the past year were asked what, if anything, could be done to improve the service they received. The most common response, as mentioned by 29% of people, was that they were happy with the service and that they could not think of anything further that could be done:
They were very prompt. I don’t think they could have done anything else. They are very good, especially our local policeman. I am very pleased. Female, aged 65+, called about vehicle-related nuisance/inappropriate vehicle use
Nothing really - they did a very good job. They were very informative, advised us of our rights, and gave me the confidence to not put up with the behaviour if it happens again, and contact the police if I have to. Female, aged 35-44, called about nuisance neighbours
However, there were suggestions put forward for possible areas for improvement, as shown in the following chart.

Policing anti-social behaviour: The public perspective
46
14%
12%
10%
8%
6%
6%
29%
Priorities for improvement
Top mentions
Base: All who have called the police in the past year (5,496). Fieldwork dates: 4 May – 3 June 2010
Quicker response time
Q What, if anything, could the police have done to improve the service you received on this occasion?
More feedback/informed of the outcome/updated
Taken action/dealt with the issue
More police on the beat/more patrol cars/police presence/night patrols
Turning up/attending the scene
Better/more communication/information
Nothing
The most common suggestion, as mentioned by 14% of people, was to try and improve the speed of response times:
I think an increased police presence in the area (is needed...and) a quicker response, ‘cos by the time the police had arrived it was 2 hours later and they’d already gone. Female, aged 25-34, called about rowdy/inconsiderate behaviour
The incident was 200 yards from the police station. It took them 45 minutes to get there – they need to get there quicker. I rang the police four times for the same reason - kids were damaging a car – but by the time the police arrived the damage was done. They do a good job, but when you ring them you expect them to be there. Male, aged 25-34, called about rowdy/inconsiderate behaviour The police could have got back to me a lot quicker. They said they where going to call me back the same evening, but they never did until two days later. Male, aged 35-44, called about rowdy/inconsiderate behaviour
People also suggested that it would have been beneficial to have more feedback and to be kept updated of the outcome of the call (12% mentioning this):

Policing anti-social behaviour: The public perspective
47
I didn’t get feedback. I would have liked feedback. But I think they did an excellent job. Female, aged 65+, called about rowdy/inconsiderate behaviour I contacted the police four times and they didn’t do anything about it. The last time I called they said they were going to send someone over but they didn’t. It would have been good if they had done something or let me know how long they would take in dealing with it. I think that if they had have called then I would have felt that they at least knew who I was. We had no feedback at all - what was happening, how long they would be...I was completely kept in the dark. Male, aged 25-34, called about nuisance neighbours They haven’t done anything about it. You never get any feedback; they say they will go and have a word but you don’t know if they did it or not, and what happened after… (You don’t know) whether there’s any point in contacting them or they just think it’s the same issue. Female, aged 35-44, called about vehicle-related nuisance/inappropriate vehicle use
Some also indicated that there was sometimes a lack of clarity in the information they were given, and that the police could have communicated information about what was happening in a better way:
Well I called (the police) because folk were taking drugs in my front yard. They arrived quickly so I was happy with that, but the folk had recently left. The police chatted to me, and then I went round to the shop and saw one of the people that had been in my garden. The police car was still there so I went back and told them that one of the people was there. The police said they were just going to drive around the block first. I don't understand why they didn't go round and speak to the person when I'd told them he was there. I then saw the second person coming out of the shop too. The police then didn't even drive around the block; it would have been helpful for them to talk to them and it has been a big problem. I felt they took it seriously but I was confused as to why they didn't speak to the people when they were right there. Female, aged 35-44, called about rowdy/inconsiderate behaviour
Actually taking action, and dealing with the issue itself, was also highlighted:
The police should act on the information they have on the group of youths as they know the shops they illegally get alcohol from, and they should listen to what the community is telling them about the actions and anti-social behaviour of the youths. They should try
Policing anti-social behaviour: The public perspective
48
harder to understand the stress living like this puts on people in the area. Female, aged 45-54, called about rowdy/inconsiderate behaviour I gave their names to the police, but the police told me to get in touch with the school myself. They said they would not take action any further unless the boys throw bricks through our window. I was disappointed with the result as they could have prevented the incident. Female, aged 45-54, called about rowdy/inconsiderate behaviour
And another suggestion for improvement was to have a greater police presence in the area, with more police on the beat or night patrols for example (8% mentioning this):
They could have followed it up and shown a police presence at the relevant times. I think the police forget about (incidents) quickly and don’t follow them up. Male, aged 55-59, called about vehicle-related nuisance/inappropriate vehicle use (The police) should take more action, not just wait for things to happen. They should stop kids assembling in the area and have more foot patrols, rather than driving around in cars. Male, aged 35-44, called about rowdy/inconsiderate behaviour

Policing anti-social behaviour: The public perspective
49
Appendices
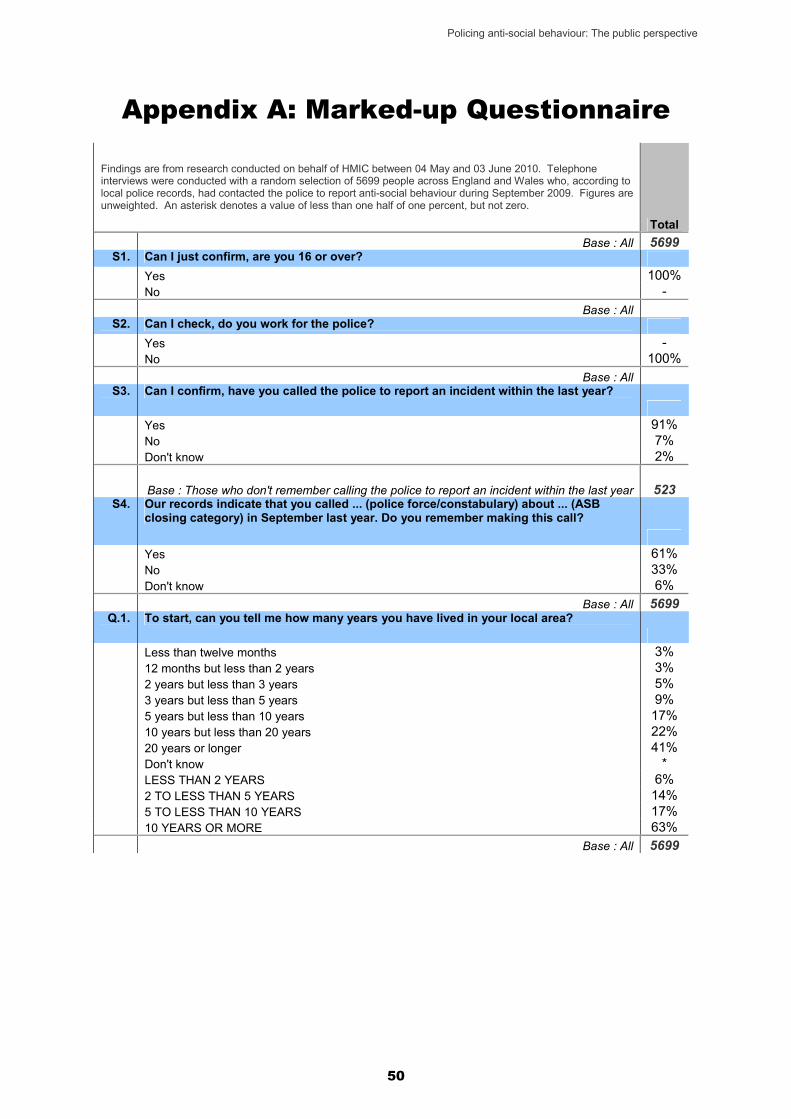
Policing anti-social behaviour: The public perspective
50
Appendix A: Marked-up Questionnaire
Findings are from research conducted on behalf of HMIC between 04 May and 03 June 2010. Telephone interviews were conducted with a random selection of 5699 people across England and Wales who, according to local police records, had contacted the police to report anti-social behaviour during September 2009. Figures are unweighted. An asterisk denotes a value of less than one half of one percent, but not zero.
Total Base : All 5699
S1. Can I just confirm, are you 16 or over? Yes 100% No -
Base : All S2. Can I check, do you work for the police?
Yes -No 100%
Base : All S3. Can I confirm, have you called the police to report an incident within the last year?
Yes 91% No 7% Don't know 2%
Base : Those who don't remember calling the police to report an incident within the last year 523 S4. Our records indicate that you called ... (police force/constabulary) about ... (ASB
closing category) in September last year. Do you remember making this call?
Yes 61% No 33% Don't know 6%
Base : All 5699 Q.1. To start, can you tell me how many years you have lived in your local area?
Less than twelve months 3% 12 months but less than 2 years 3% 2 years but less than 3 years 5% 3 years but less than 5 years 9% 5 years but less than 10 years 17% 10 years but less than 20 years 22% 20 years or longer 41% Don't know *LESS THAN 2 YEARS 6% 2 TO LESS THAN 5 YEARS 14% 5 TO LESS THAN 10 YEARS 17% 10 YEARS OR MORE 63%
Base : All 5699

Policing anti-social behaviour: The public perspective
51
Q.2. If we were to define your “quality of life” as how you feel overall about your life, including your standard of living, your surroundings, friendships and how you feel day-to-day, how good or bad would you rate your quality of life?
Very good 38% Fairly good 43% Neither good nor bad 9% Fairly bad 6% Very bad 4% Don't know 1% GOOD 81% BAD 10% NET GOOD 71%
Base : All 5699 Q.3. On the whole, do you think that over the past year your local area has got better or
worse to live in, or haven't things changed much.
Much better 6% Slightly better 12% Has not changed much 46% Slightly worse 17% Much worse 17% Don't know 1% BETTER 19% WORSE 35% NET BETTER -16%
Base : All 5699 Q.4. Do you agree or disagree that your local area is a close, tight knit community?
Strongly agree 17% Tend to agree 25% Neither agree nor disagree 7% Tend to disagree 27% Strongly disagree 21% Don't know 3% AGREE 42% DISAGREE 48% NET AGREE -6%
Base : All 5699 Q.5. How strongly do you feel you belong to your local area?
Very strongly 23% Fairly strongly 40% Not very strongly 22% Not at all strongly 14% Don't know 1% STRONGLY 63% NOT STRONGLY 36% NET STRONGLY 27%
Base : All 5699
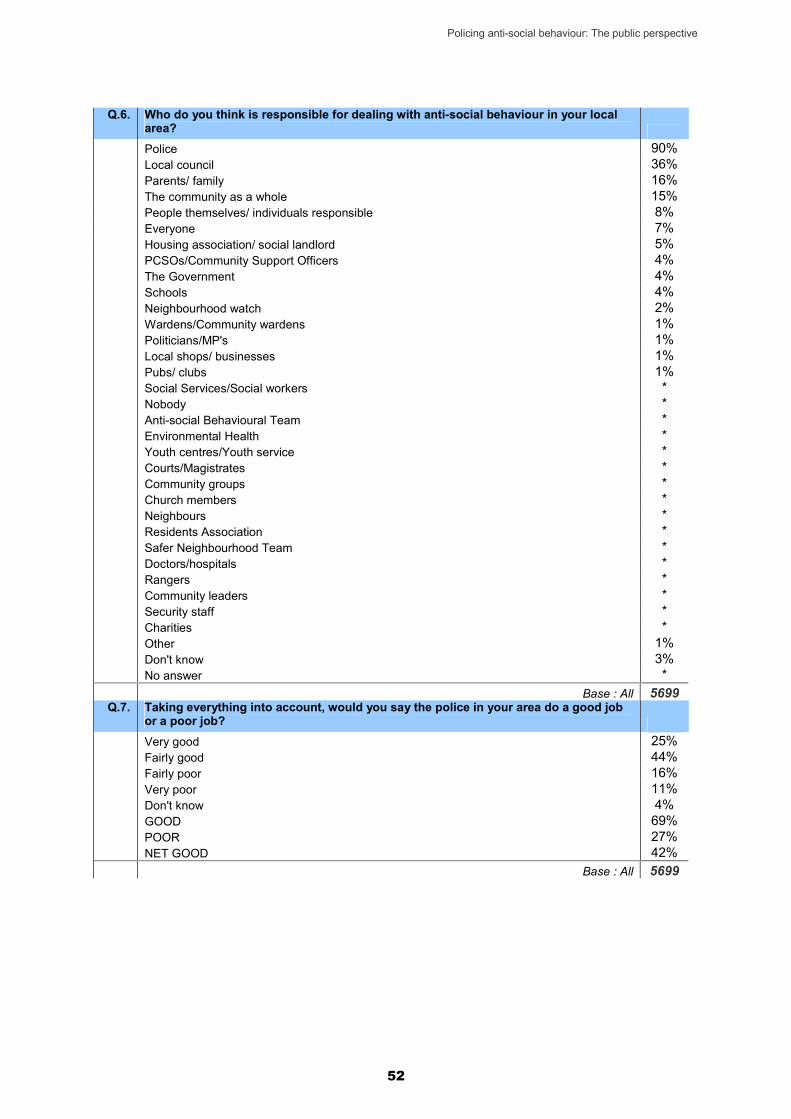
Policing anti-social behaviour: The public perspective
52
Q.6. Who do you think is responsible for dealing with anti-social behaviour in your local area?
Police 90% Local council 36% Parents/ family 16% The community as a whole 15% People themselves/ individuals responsible 8% Everyone 7% Housing association/ social landlord 5% PCSOs/Community Support Officers 4% The Government 4% Schools 4% Neighbourhood watch 2% Wardens/Community wardens 1% Politicians/MP's 1% Local shops/ businesses 1% Pubs/ clubs 1% Social Services/Social workers *Nobody *Anti-social Behavioural Team *Environmental Health *Youth centres/Youth service *Courts/Magistrates *Community groups *Church members *Neighbours *Residents Association *Safer Neighbourhood Team *Doctors/hospitals *Rangers *Community leaders *Security staff *Charities *Other 1% Don't know 3% No answer *
Base : All 5699 Q.7. Taking everything into account, would you say the police in your area do a good job
or a poor job?
Very good 25% Fairly good 44% Fairly poor 16% Very poor 11% Don't know 4% GOOD 69% POOR 27% NET GOOD 42%
Base : All 5699
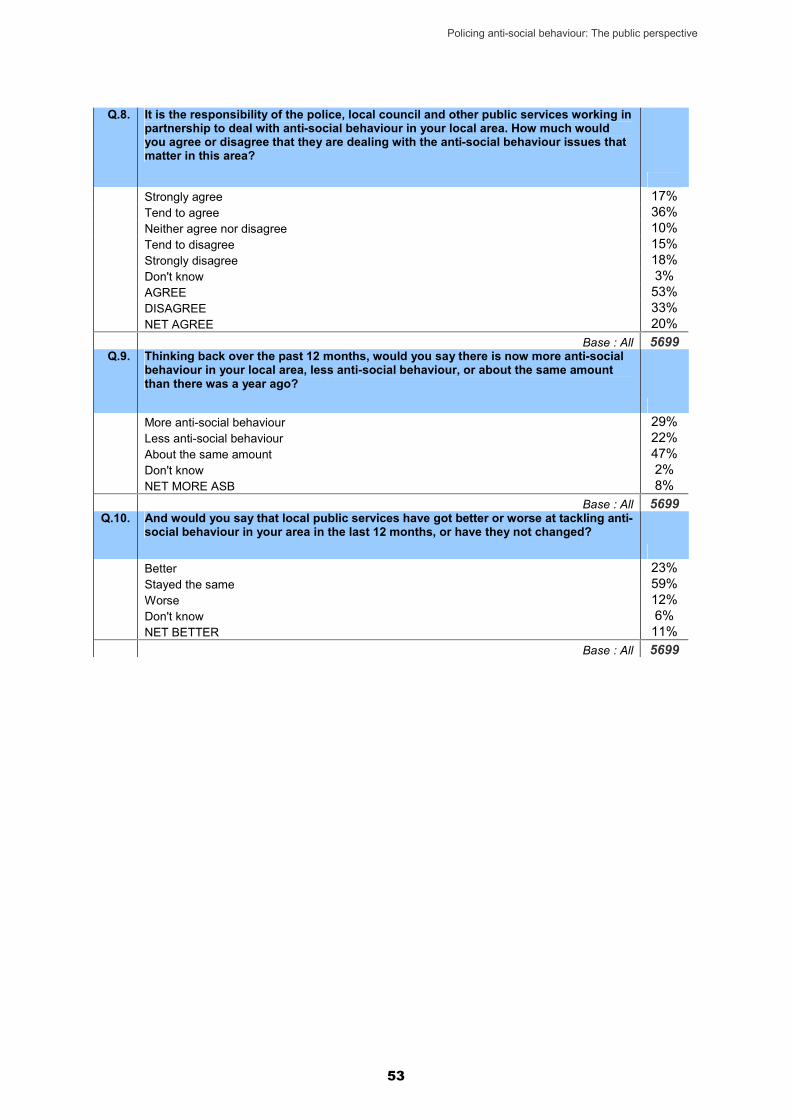
Policing anti-social behaviour: The public perspective
53
Q.8. It is the responsibility of the police, local council and other public services working in partnership to deal with anti-social behaviour in your local area. How much would you agree or disagree that they are dealing with the anti-social behaviour issues that matter in this area?
Strongly agree 17% Tend to agree 36% Neither agree nor disagree 10% Tend to disagree 15% Strongly disagree 18% Don't know 3% AGREE 53% DISAGREE 33% NET AGREE 20%
Base : All 5699 Q.9. Thinking back over the past 12 months, would you say there is now more anti-social
behaviour in your local area, less anti-social behaviour, or about the same amount than there was a year ago?
More anti-social behaviour 29% Less anti-social behaviour 22% About the same amount 47% Don't know 2% NET MORE ASB 8%
Base : All 5699 Q.10. And would you say that local public services have got better or worse at tackling anti-
social behaviour in your area in the last 12 months, or have they not changed?
Better 23% Stayed the same 59% Worse 12% Don't know 6% NET BETTER 11%
Base : All 5699

Policing anti-social behaviour: The public perspective
54
Q.11. What types of anti-social behaviour have you been thinking about when answering the last few questions?
Street drinking/drunken behaviour/under age drinking/youths drinking 30% Youths/teenagers/groups/ gangs loitering on the streets 29% Vandalism/graffiti 25% Rowdy or inconsiderate behaviour 23% Noise/loud music 21% Using/dealing drugs 13% Intimidation/threats/ harassment 11% Verbal abuse/abusive behaviour 11% Assault/violence/ fighting 10% Nuisance neighbours 10% Theft/burglary/break-ins 9% Throwing stones/glass/ cans/eggs/objects 9% Youths/teenagers (unspecified) 9% Motor cycle/cycle nuisance/speeding/riding on pavements 8% Vehicle damage 8% Littering 7% Bad language/swearing 7% Vehicle nuisance/ speeding/revving/boy racers 5% Criminal damage 4% Youths kicking/throwing balls/playing football 4% Arson/setting fires/ fireworks 3% Trespassing 3% Lack of respect 3% Urinating/spitting 2% Parking 2% Breaking glass/smashing bottles 2% Out of control dogs/ barking dogs 2% Bullying 1% Racial abuse/racism 1% Dog fouling 1% Aggressive behaviour 1% Smoking 1% Stabbings/shootings/ murders 1% Lack of parental control 1% Fly tipping 1% Begging/vagrancy/ Problems with homeless people 1% Prostitution 1% Carrying knives/weapons 1% Cruelty to animals 1% Committing sexual acts 1% Mugging 1% Motor cyclists without helmets *Abandoned vehicles *Problems with gypsies *Other 2% Nothing/ none 1% Don't know 1% No answer 1%
Base : All 5699
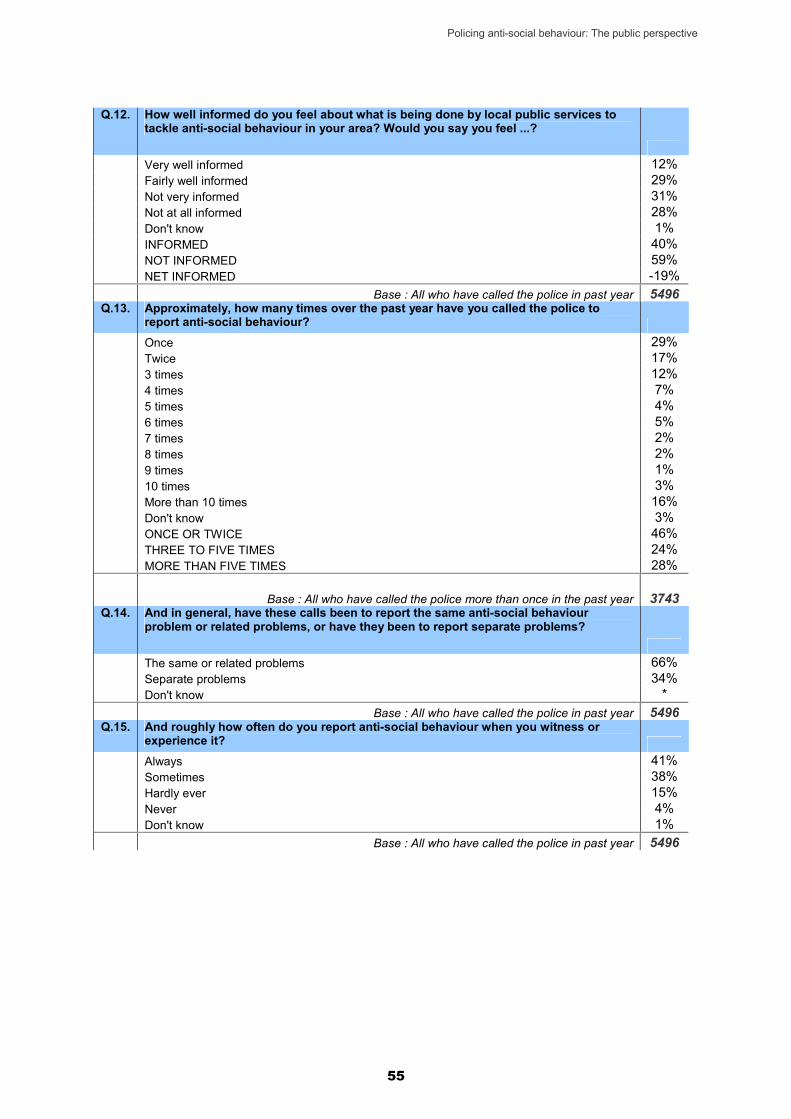
Policing anti-social behaviour: The public perspective
55
Q.12. How well informed do you feel about what is being done by local public services to tackle anti-social behaviour in your area? Would you say you feel ...?
Very well informed 12% Fairly well informed 29% Not very informed 31% Not at all informed 28% Don't know 1% INFORMED 40% NOT INFORMED 59% NET INFORMED -19%
Base : All who have called the police in past year 5496 Q.13. Approximately, how many times over the past year have you called the police to
report anti-social behaviour?
Once 29% Twice 17% 3 times 12% 4 times 7% 5 times 4% 6 times 5% 7 times 2% 8 times 2% 9 times 1% 10 times 3% More than 10 times 16% Don't know 3% ONCE OR TWICE 46% THREE TO FIVE TIMES 24% MORE THAN FIVE TIMES 28%
Base : All who have called the police more than once in the past year 3743 Q.14. And in general, have these calls been to report the same anti-social behaviour
problem or related problems, or have they been to report separate problems?
The same or related problems 66% Separate problems 34% Don't know *
Base : All who have called the police in past year 5496 Q.15. And roughly how often do you report anti-social behaviour when you witness or
experience it?
Always 41% Sometimes 38% Hardly ever 15% Never 4% Don't know 1%
Base : All who have called the police in past year 5496
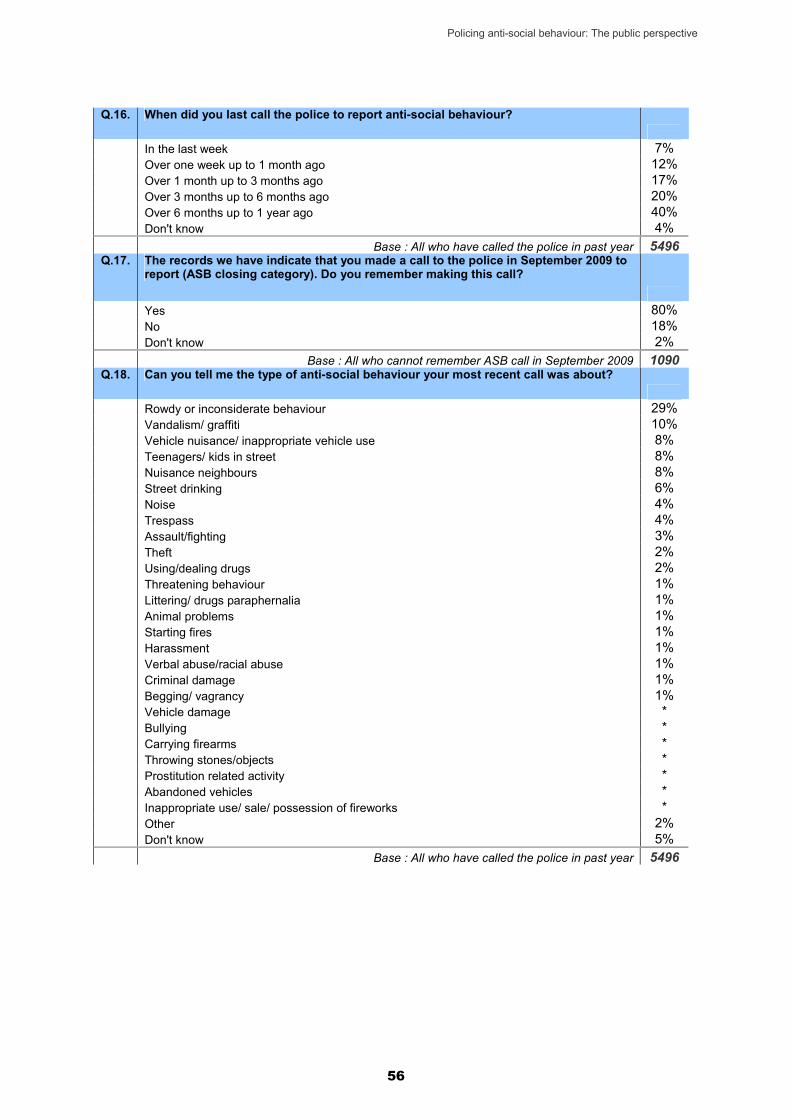
Policing anti-social behaviour: The public perspective
56
Q.16. When did you last call the police to report anti-social behaviour?
In the last week 7% Over one week up to 1 month ago 12% Over 1 month up to 3 months ago 17% Over 3 months up to 6 months ago 20% Over 6 months up to 1 year ago 40% Don't know 4%
Base : All who have called the police in past year 5496 Q.17. The records we have indicate that you made a call to the police in September 2009 to
report (ASB closing category). Do you remember making this call?
Yes 80% No 18% Don't know 2%
Base : All who cannot remember ASB call in September 2009 1090 Q.18. Can you tell me the type of anti-social behaviour your most recent call was about?
Rowdy or inconsiderate behaviour 29% Vandalism/ graffiti 10% Vehicle nuisance/ inappropriate vehicle use 8% Teenagers/ kids in street 8% Nuisance neighbours 8% Street drinking 6% Noise 4% Trespass 4% Assault/fighting 3% Theft 2% Using/dealing drugs 2% Threatening behaviour 1% Littering/ drugs paraphernalia 1% Animal problems 1% Starting fires 1% Harassment 1% Verbal abuse/racial abuse 1% Criminal damage 1% Begging/ vagrancy 1% Vehicle damage *Bullying *Carrying firearms *Throwing stones/objects *Prostitution related activity *Abandoned vehicles *Inappropriate use/ sale/ possession of fireworks *Other 2% Don't know 5%
Base : All who have called the police in past year 5496

Policing anti-social behaviour: The public perspective
57
Q.19. Overall, to what extent were you satisfied or dissatisfied with how the police handled your call?
Very satisfied 37% Fairly satisfied 28% Neither satisfied nor dissatisfied 5% Fairly dissatisfied 10% Very dissatisfied 18% Don't know 1% SATISFIED 65% DISSATISFIED 28% NET SATISFIED 37%
Base : All who have called the police in past year 5496 Q.20. Thinking of your contact with the police, overall, to what extent were you satisfied or
dissatisfied with the way you were treated by police officers and/ or staff during the course of your contact with them?
Very satisfied 50% Fairly satisfied 27% Neither satisfied nor dissatisfied 4% Fairly dissatisfied 6% Very dissatisfied 11% Don't know 1% SATISFIED 78% DISSATISFIED 17% NET SATISFIED 61%
Base : All who have called the police in past year 5496 Q.21. To what extent were you satisfied or dissatisfied with the following aspects of how
you were treated by the police? How well they listened to what you had to say
Very satisfied 54% Fairly satisfied 29% Neither satisfied nor dissatisfied 3% Fairly dissatisfied 5% Very dissatisfied 9% Don't know 1% SATISFIED 82% DISSATISFIED 14% NET SATISFIED 68%
Base : All who have called the police in past year 5496 Q.22. To what extent were you satisfied or dissatisfied with the following aspects of how
you were treated by the police? How seriously your call was taken Very satisfied 47% Fairly satisfied 25% Neither satisfied nor dissatisfied 3% Fairly dissatisfied 9% Very dissatisfied 14% Don't know 1% SATISFIED 72% DISSATISFIED 23% NET SATISFIED 49%
Base : All who have called the police in past year 5496

Policing anti-social behaviour: The public perspective
58
Q.23. I'm now going to ask a few questions about getting hold of the Police. Overall, to what extent were you satisfied with the ease with which you were able to contact the police?
Very satisfied 53% Fairly satisfied 26% Neither satisfied nor dissatisfied 3% Fairly dissatisfied 8% Very dissatisfied 9% Don't know 1% SATISFIED 80% DISSATISFIED 17% NET SATISFIED 63%
Base : All who have called the police in past year 5496 Q.24. To what extent were you satisfied or dissatisfied with how quickly the police
responded to your initial contact?
Very satisfied 39% Fairly satisfied 26% Neither satisfied nor dissatisfied 3% Fairly dissatisfied 10% Very dissatisfied 19% Don't know 3% SATISFIED 65% DISSATISFIED 29% NET SATISFIED 36%
Base : All who have called the police in past year 5496 Q.25. To what extent were you satisfied or dissatisfied with the way in which you were
provided with information from the police following your call?
Very satisfied 31% Fairly satisfied 25% Neither satisfied nor dissatisfied 6% Fairly dissatisfied 13% Very dissatisfied 22% Don't know 3% SATISFIED 56% DISSATISFIED 35% NET SATISFIED 21%
Base : All who have called the police in past year 5496 Q.26. Did the police tell you that they would be taking action or not be taking action as a
result of your call? Said would definitely take action 30% Said would probably take action 11% Said would probably not take action 5% Said would definitely not take action 10% Didn't say one way or the other 36% Don't know/ can't remember 8% WOULD TAKE ACTION 41% WOULD NOT TAKE ACTION 15% NET WOULD TAKE ACTION 26%
Base : All who have called the police in past year 5496 Q.27. As far as you know, did the police take any action?
Yes 39% No 39% Don't know 22%
Base : All who say that the police took action as a result of their call 2129
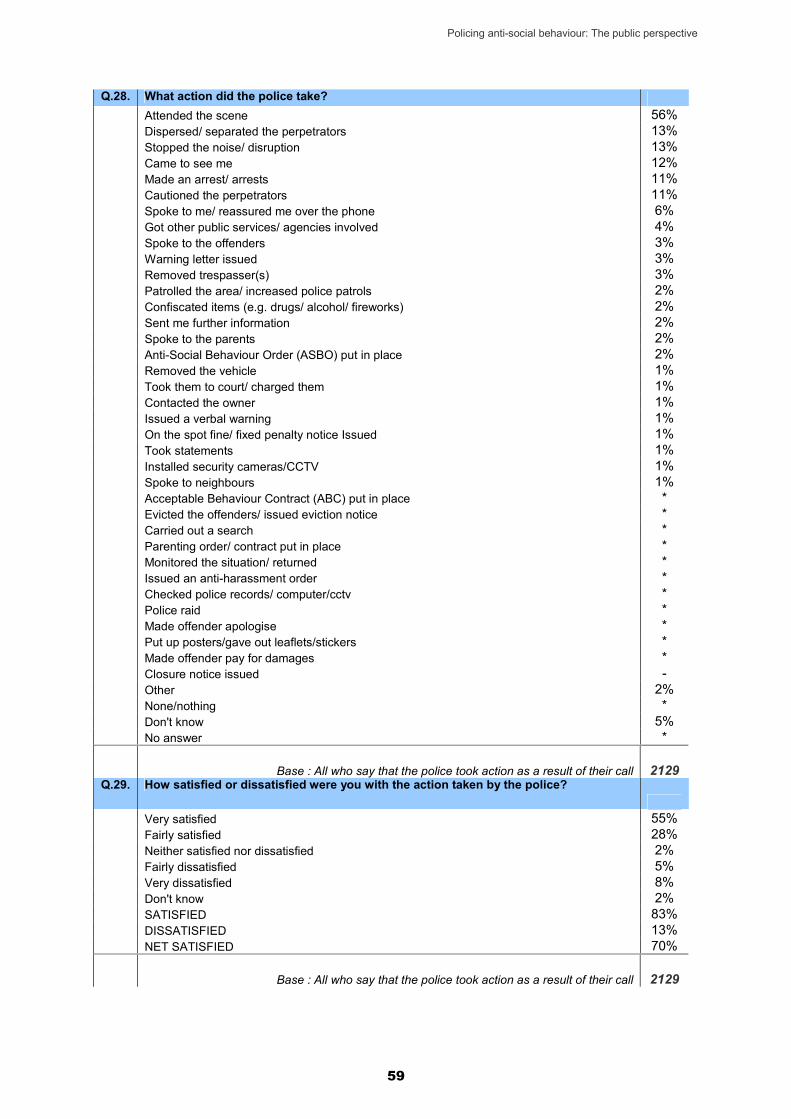
Policing anti-social behaviour: The public perspective
59
Q.28. What action did the police take? Attended the scene 56% Dispersed/ separated the perpetrators 13% Stopped the noise/ disruption 13% Came to see me 12% Made an arrest/ arrests 11% Cautioned the perpetrators 11% Spoke to me/ reassured me over the phone 6% Got other public services/ agencies involved 4% Spoke to the offenders 3%Warning letter issued 3% Removed trespasser(s) 3% Patrolled the area/ increased police patrols 2% Confiscated items (e.g. drugs/ alcohol/ fireworks) 2% Sent me further information 2% Spoke to the parents 2% Anti-Social Behaviour Order (ASBO) put in place 2% Removed the vehicle 1% Took them to court/ charged them 1% Contacted the owner 1% Issued a verbal warning 1% On the spot fine/ fixed penalty notice Issued 1% Took statements 1% Installed security cameras/CCTV 1% Spoke to neighbours 1% Acceptable Behaviour Contract (ABC) put in place *Evicted the offenders/ issued eviction notice *Carried out a search *Parenting order/ contract put in place *Monitored the situation/ returned *Issued an anti-harassment order *Checked police records/ computer/cctv *Police raid *Made offender apologise *Put up posters/gave out leaflets/stickers *Made offender pay for damages *Closure notice issued -Other 2% None/nothing *Don't know 5% No answer *
Base : All who say that the police took action as a result of their call 2129 Q.29. How satisfied or dissatisfied were you with the action taken by the police?
Very satisfied 55% Fairly satisfied 28% Neither satisfied nor dissatisfied 2% Fairly dissatisfied 5% Very dissatisfied 8% Don't know 2% SATISFIED 83% DISSATISFIED 13% NET SATISFIED 70%
Base : All who say that the police took action as a result of their call 2129

Policing anti-social behaviour: The public perspective
60
Q.30. Did any other local services take any action as a result of your call, for example the council?
Yes 19% Council 11% Housing Association 3% Environmental Health 1% Anti-social Behaviour Team 1% MP/councillor 1% Social Services 1% Victim Support *Wardens *Fire Brigade *Police *School/university *PCSO *Noise Pollution/ Noise Environment Department *Safer Neighbourhood Team *Residents *Other 1% Don't know who *No 71% Don't know/ can't remember 10%
Base : All who say that other local services took action as a result of their call 400 Q.31. How satisfied or dissatisfied were you with the action taken by this/ these services?
Very satisfied 55% Fairly satisfied 23% Neither satisfied nor dissatisfied 3% Fairly dissatisfied 4% Very dissatisfied 13% Don't know 3% SATISFIED 78% DISSATISFIED 18% NET SATISFIED 60%
Base : All who have called the police in past year 5496 Q.32. To what extent do you feel your call made a difference to the problem you were
calling about? Made a big difference 31% Made a little difference 23% Made no difference 39% Don't know/ can't say 7% MADE A DIFFERENCE 54%
Base : All who have called the police in past year 5496 Q.33. Would you encourage others to make similar reports of anti-social behaviour?
Yes, definitely 80% Yes, probably 10% Probably not 3% Definitely not 6% Don't know/ can't say 2% YES 89% NO 9% NET YES 80%
Base : All who have called the police in past year 5496
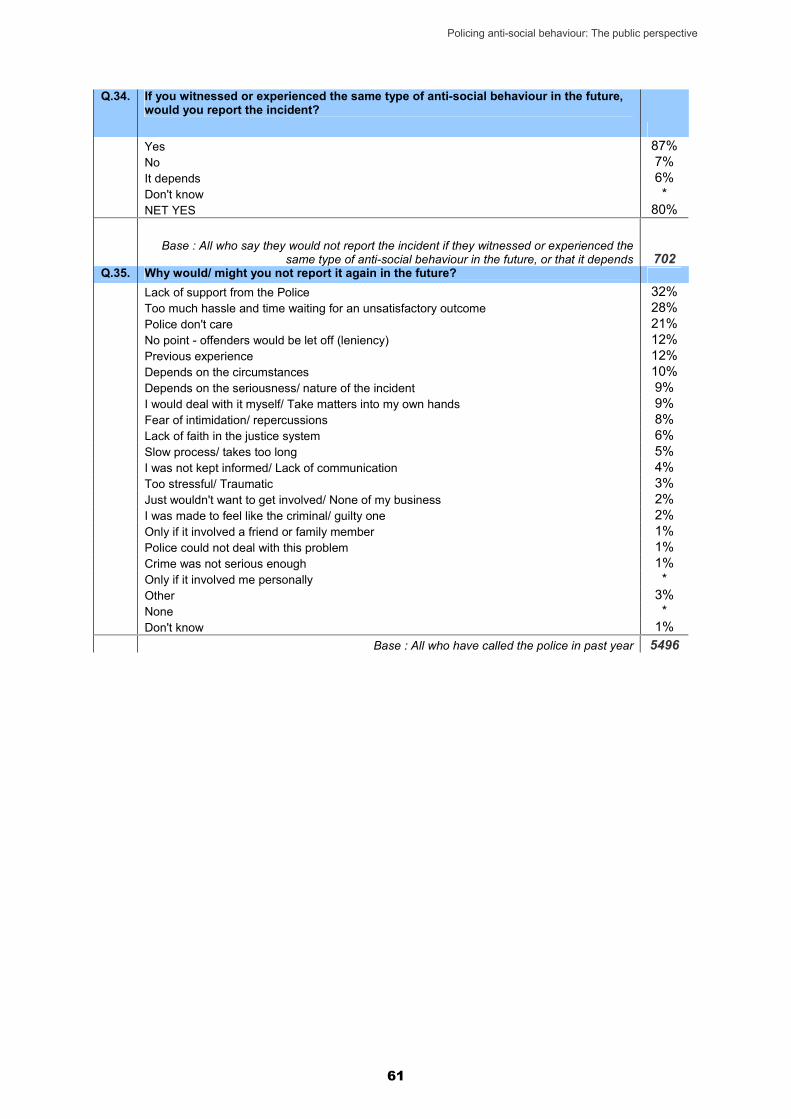
Policing anti-social behaviour: The public perspective
61
Q.34. If you witnessed or experienced the same type of anti-social behaviour in the future, would you report the incident?
Yes 87% No 7% It depends 6% Don't know *NET YES 80%
Base : All who say they would not report the incident if they witnessed or experienced the same type of anti-social behaviour in the future, or that it depends 702
Q.35. Why would/ might you not report it again in the future? Lack of support from the Police 32% Too much hassle and time waiting for an unsatisfactory outcome 28% Police don't care 21% No point - offenders would be let off (leniency) 12% Previous experience 12% Depends on the circumstances 10% Depends on the seriousness/ nature of the incident 9% I would deal with it myself/ Take matters into my own hands 9% Fear of intimidation/ repercussions 8% Lack of faith in the justice system 6% Slow process/ takes too long 5% I was not kept informed/ Lack of communication 4% Too stressful/ Traumatic 3% Just wouldn't want to get involved/ None of my business 2% I was made to feel like the criminal/ guilty one 2% Only if it involved a friend or family member 1% Police could not deal with this problem 1% Crime was not serious enough 1% Only if it involved me personally *Other 3% None *Don't know 1%
Base : All who have called the police in past year 5496
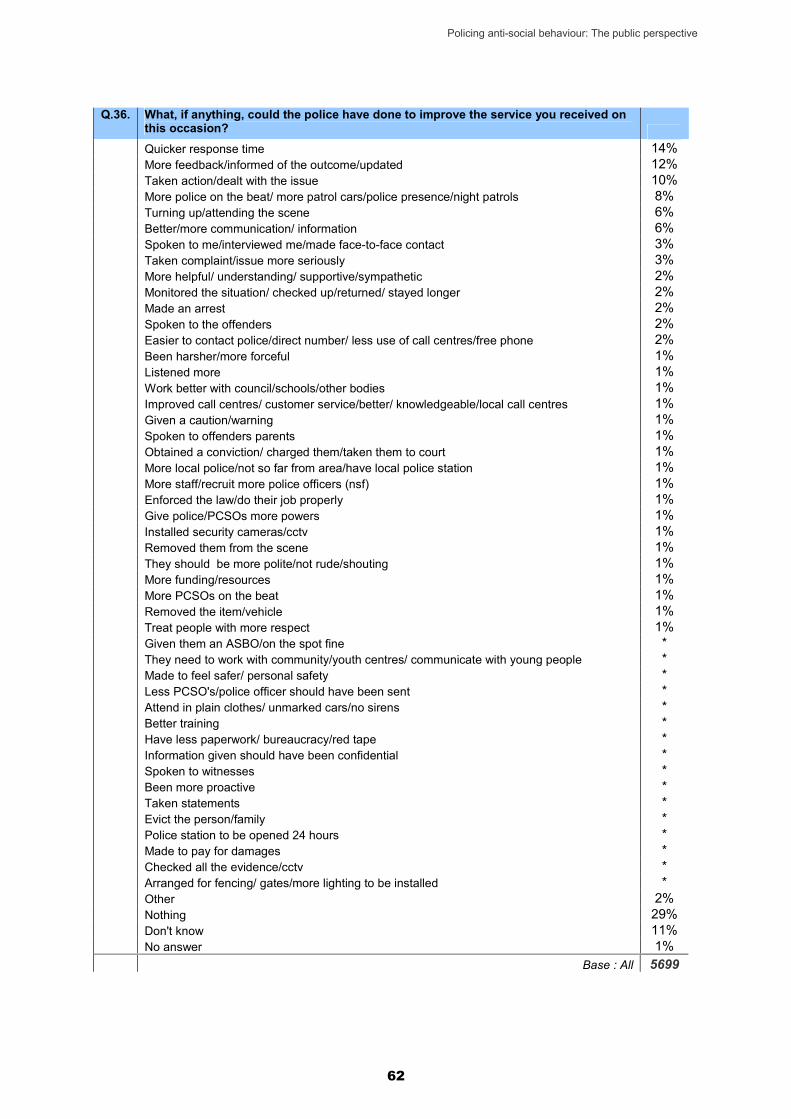
Policing anti-social behaviour: The public perspective
62
Q.36. What, if anything, could the police have done to improve the service you received on this occasion?
Quicker response time 14% More feedback/informed of the outcome/updated 12% Taken action/dealt with the issue 10% More police on the beat/ more patrol cars/police presence/night patrols 8% Turning up/attending the scene 6% Better/more communication/ information 6% Spoken to me/interviewed me/made face-to-face contact 3% Taken complaint/issue more seriously 3% More helpful/ understanding/ supportive/sympathetic 2% Monitored the situation/ checked up/returned/ stayed longer 2% Made an arrest 2% Spoken to the offenders 2% Easier to contact police/direct number/ less use of call centres/free phone 2% Been harsher/more forceful 1% Listened more 1% Work better with council/schools/other bodies 1% Improved call centres/ customer service/better/ knowledgeable/local call centres 1% Given a caution/warning 1% Spoken to offenders parents 1% Obtained a conviction/ charged them/taken them to court 1% More local police/not so far from area/have local police station 1% More staff/recruit more police officers (nsf) 1% Enforced the law/do their job properly 1% Give police/PCSOs more powers 1% Installed security cameras/cctv 1% Removed them from the scene 1% They should be more polite/not rude/shouting 1% More funding/resources 1% More PCSOs on the beat 1% Removed the item/vehicle 1% Treat people with more respect 1% Given them an ASBO/on the spot fine *They need to work with community/youth centres/ communicate with young people *Made to feel safer/ personal safety *Less PCSO's/police officer should have been sent *Attend in plain clothes/ unmarked cars/no sirens *Better training *Have less paperwork/ bureaucracy/red tape *Information given should have been confidential *Spoken to witnesses *Been more proactive *Taken statements *Evict the person/family *Police station to be opened 24 hours *Made to pay for damages *Checked all the evidence/cctv *Arranged for fencing/ gates/more lighting to be installed *Other 2% Nothing 29% Don't know 11% No answer 1%
Base : All 5699
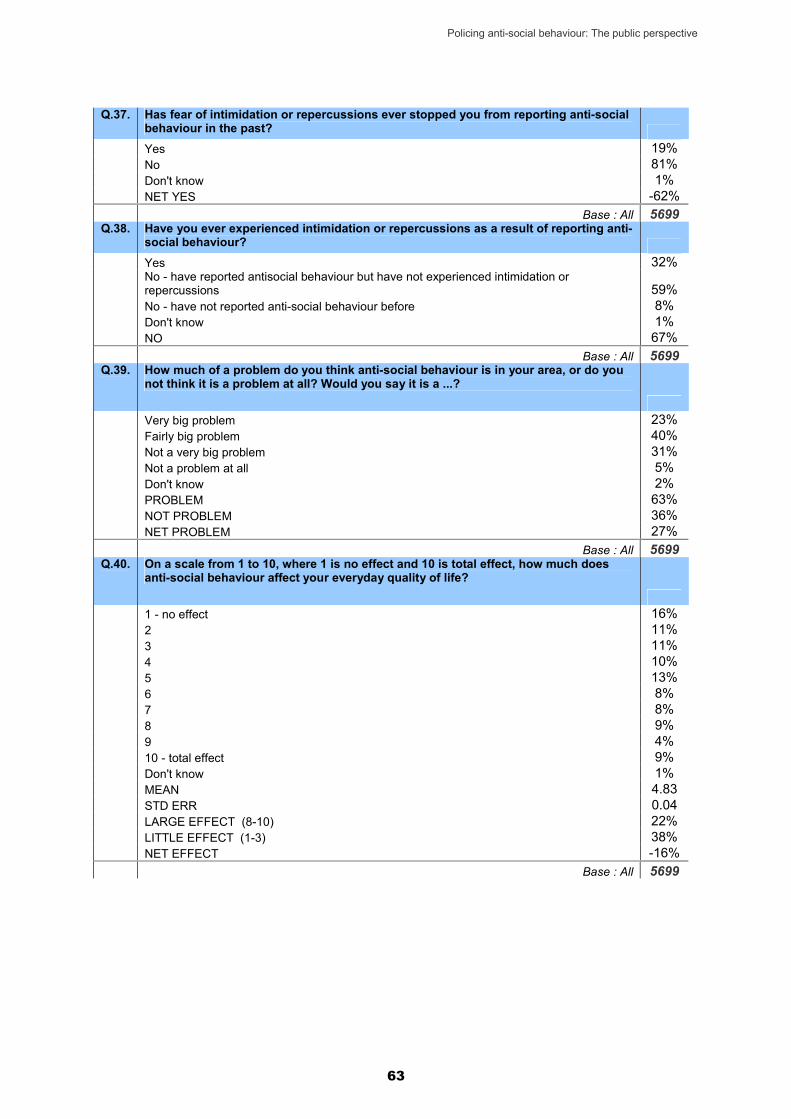
Policing anti-social behaviour: The public perspective
63
Q.37. Has fear of intimidation or repercussions ever stopped you from reporting anti-social behaviour in the past?
Yes 19% No 81% Don't know 1% NET YES -62%
Base : All 5699 Q.38. Have you ever experienced intimidation or repercussions as a result of reporting anti-
social behaviour?
Yes 32% No - have reported antisocial behaviour but have not experienced intimidation or repercussions 59% No - have not reported anti-social behaviour before 8% Don't know 1% NO 67%
Base : All 5699 Q.39. How much of a problem do you think anti-social behaviour is in your area, or do you
not think it is a problem at all? Would you say it is a ...?
Very big problem 23% Fairly big problem 40% Not a very big problem 31% Not a problem at all 5% Don't know 2% PROBLEM 63% NOT PROBLEM 36% NET PROBLEM 27%
Base : All 5699 Q.40. On a scale from 1 to 10, where 1 is no effect and 10 is total effect, how much does
anti-social behaviour affect your everyday quality of life?
1 - no effect 16% 2 11% 3 11% 4 10% 5 13% 6 8% 7 8% 8 9% 9 4% 10 - total effect 9% Don't know 1% MEAN 4.83 STD ERR 0.04 LARGE EFFECT (8-10) 22% LITTLE EFFECT (1-3) 38% NET EFFECT -16%
Base : All 5699
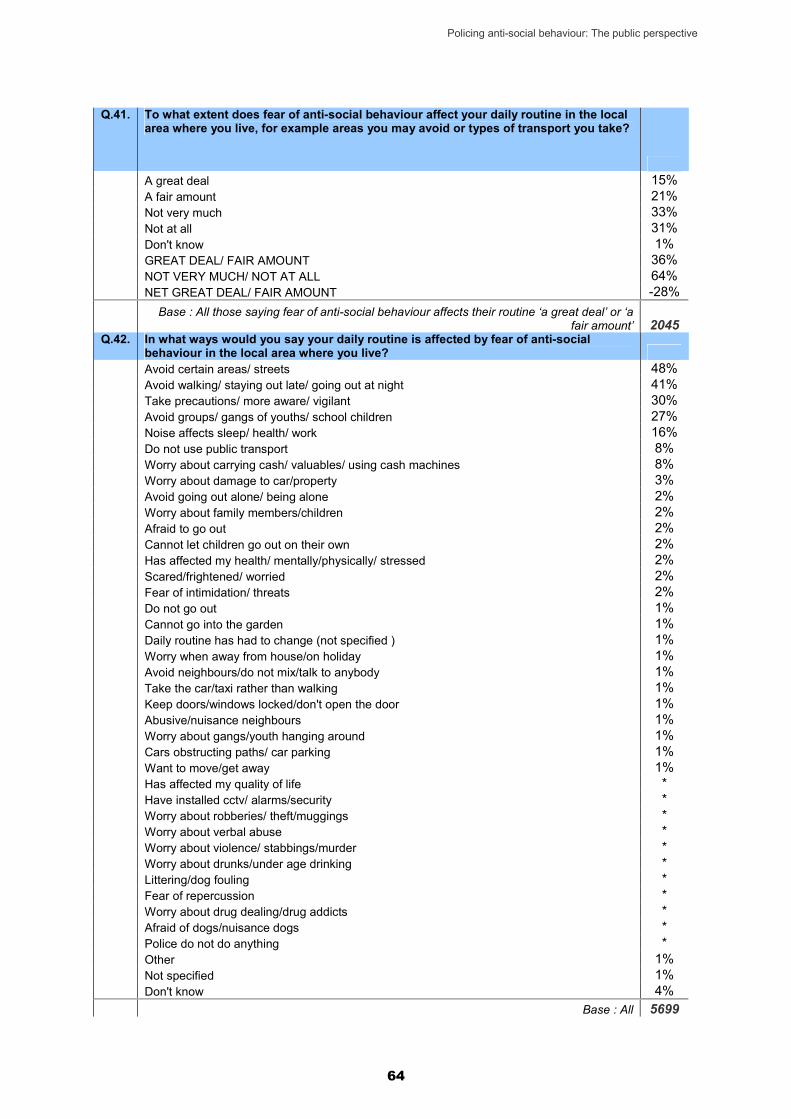
Policing anti-social behaviour: The public perspective
64
Q.41. To what extent does fear of anti-social behaviour affect your daily routine in the local area where you live, for example areas you may avoid or types of transport you take?
A great deal 15% A fair amount 21% Not very much 33% Not at all 31% Don't know 1% GREAT DEAL/ FAIR AMOUNT 36% NOT VERY MUCH/ NOT AT ALL 64% NET GREAT DEAL/ FAIR AMOUNT -28%
Base : All those saying fear of anti-social behaviour affects their routine ‘a great deal’ or ‘a fair amount’ 2045
Q.42. In what ways would you say your daily routine is affected by fear of anti-social behaviour in the local area where you live? Avoid certain areas/ streets 48% Avoid walking/ staying out late/ going out at night 41% Take precautions/ more aware/ vigilant 30% Avoid groups/ gangs of youths/ school children 27% Noise affects sleep/ health/ work 16% Do not use public transport 8% Worry about carrying cash/ valuables/ using cash machines 8% Worry about damage to car/property 3% Avoid going out alone/ being alone 2% Worry about family members/children 2% Afraid to go out 2% Cannot let children go out on their own 2% Has affected my health/ mentally/physically/ stressed 2% Scared/frightened/ worried 2% Fear of intimidation/ threats 2% Do not go out 1% Cannot go into the garden 1% Daily routine has had to change (not specified ) 1% Worry when away from house/on holiday 1% Avoid neighbours/do not mix/talk to anybody 1% Take the car/taxi rather than walking 1% Keep doors/windows locked/don't open the door 1% Abusive/nuisance neighbours 1% Worry about gangs/youth hanging around 1% Cars obstructing paths/ car parking 1% Want to move/get away 1% Has affected my quality of life *Have installed cctv/ alarms/security *Worry about robberies/ theft/muggings *Worry about verbal abuse *Worry about violence/ stabbings/murder *Worry about drunks/under age drinking *Littering/dog fouling *Fear of repercussion *Worry about drug dealing/drug addicts *Afraid of dogs/nuisance dogs *Police do not do anything *Other 1% Not specified 1% Don't know 4%
Base : All 5699
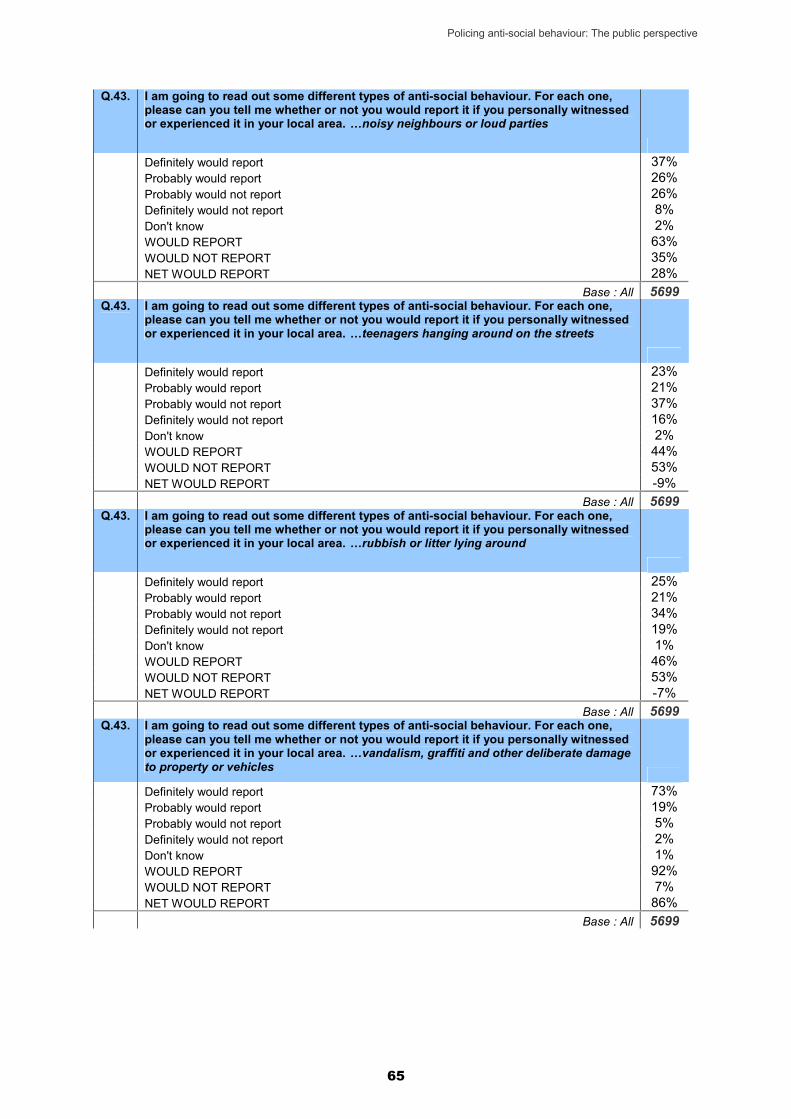
Policing anti-social behaviour: The public perspective
65
Q.43. I am going to read out some different types of anti-social behaviour. For each one, please can you tell me whether or not you would report it if you personally witnessed or experienced it in your local area. …noisy neighbours or loud parties
Definitely would report 37% Probably would report 26% Probably would not report 26% Definitely would not report 8% Don't know 2% WOULD REPORT 63% WOULD NOT REPORT 35% NET WOULD REPORT 28%
Base : All 5699 Q.43. I am going to read out some different types of anti-social behaviour. For each one,
please can you tell me whether or not you would report it if you personally witnessed or experienced it in your local area. …teenagers hanging around on the streets
Definitely would report 23% Probably would report 21% Probably would not report 37% Definitely would not report 16% Don't know 2% WOULD REPORT 44% WOULD NOT REPORT 53% NET WOULD REPORT -9%
Base : All 5699 Q.43. I am going to read out some different types of anti-social behaviour. For each one,
please can you tell me whether or not you would report it if you personally witnessed or experienced it in your local area. …rubbish or litter lying around
Definitely would report 25% Probably would report 21% Probably would not report 34% Definitely would not report 19% Don't know 1% WOULD REPORT 46% WOULD NOT REPORT 53% NET WOULD REPORT -7%
Base : All 5699 Q.43. I am going to read out some different types of anti-social behaviour. For each one,
please can you tell me whether or not you would report it if you personally witnessed or experienced it in your local area. …vandalism, graffiti and other deliberate damage to property or vehicles
Definitely would report 73% Probably would report 19% Probably would not report 5% Definitely would not report 2% Don't know 1% WOULD REPORT 92% WOULD NOT REPORT 7% NET WOULD REPORT 86%
Base : All 5699
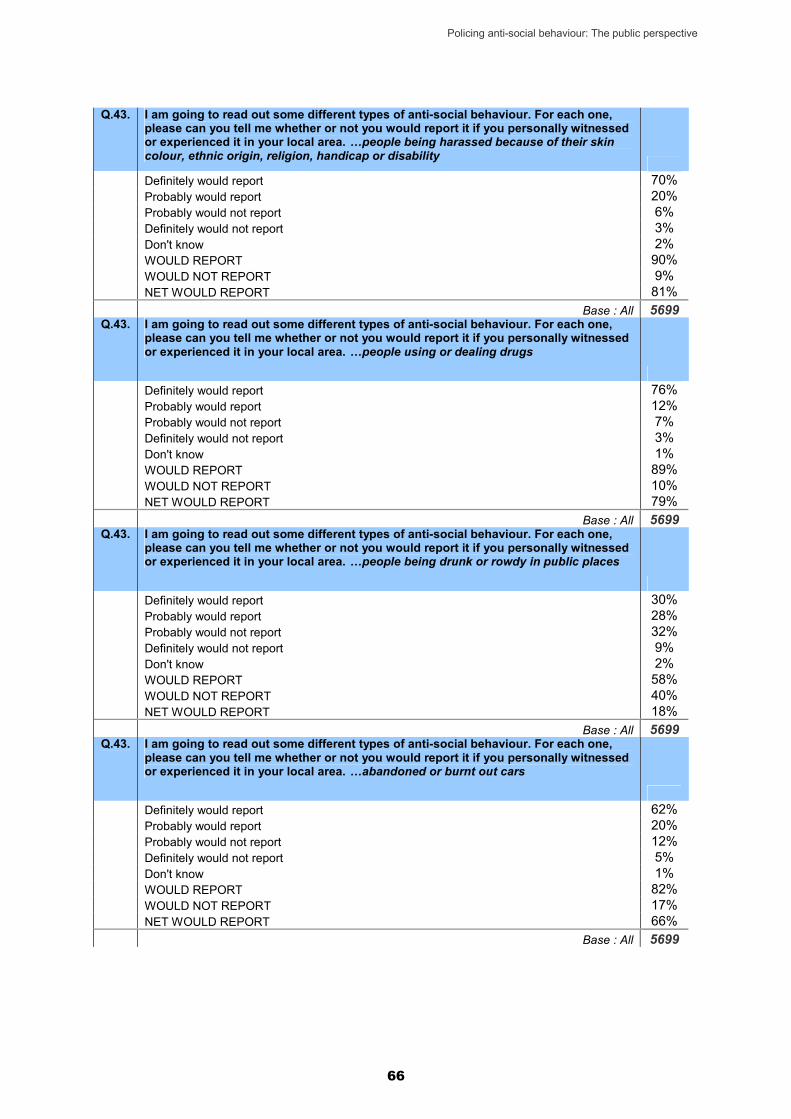
Policing anti-social behaviour: The public perspective
66
Q.43. I am going to read out some different types of anti-social behaviour. For each one, please can you tell me whether or not you would report it if you personally witnessed or experienced it in your local area. …people being harassed because of their skin colour, ethnic origin, religion, handicap or disability
Definitely would report 70% Probably would report 20% Probably would not report 6% Definitely would not report 3% Don't know 2% WOULD REPORT 90% WOULD NOT REPORT 9% NET WOULD REPORT 81%
Base : All 5699 Q.43. I am going to read out some different types of anti-social behaviour. For each one,
please can you tell me whether or not you would report it if you personally witnessed or experienced it in your local area. …people using or dealing drugs
Definitely would report 76% Probably would report 12% Probably would not report 7% Definitely would not report 3% Don't know 1% WOULD REPORT 89% WOULD NOT REPORT 10% NET WOULD REPORT 79%
Base : All 5699 Q.43. I am going to read out some different types of anti-social behaviour. For each one,
please can you tell me whether or not you would report it if you personally witnessed or experienced it in your local area. …people being drunk or rowdy in public places
Definitely would report 30% Probably would report 28% Probably would not report 32% Definitely would not report 9% Don't know 2% WOULD REPORT 58% WOULD NOT REPORT 40% NET WOULD REPORT 18%
Base : All 5699 Q.43. I am going to read out some different types of anti-social behaviour. For each one,
please can you tell me whether or not you would report it if you personally witnessed or experienced it in your local area. …abandoned or burnt out cars
Definitely would report 62% Probably would report 20% Probably would not report 12% Definitely would not report 5% Don't know 1% WOULD REPORT 82% WOULD NOT REPORT 17% NET WOULD REPORT 66%
Base : All 5699

Policing anti-social behaviour: The public perspective
67
Q.43. I am going to read out some different types of anti-social behaviour. For each one, please can you tell me whether or not you would report it if you personally witnessed or experienced it in your local area. …people being insulted, pestered or intimidated in the street
Definitely would report 54% Probably would report 29% Probably would not report 12% Definitely would not report 3% Don't know 2% WOULD REPORT 83% WOULD NOT REPORT 15% NET WOULD REPORT 69%
Base : All 5699 Q.43. I am going to read out some different types of anti-social behaviour. For each one,
please can you tell me whether or not you would report it if you personally witnessed or experienced it in your local area. …nuisance neighbours or problem families
Definitely would report 49% Probably would report 31% Probably would not report 12% Definitely would not report 4% Don't know 3% WOULD REPORT 81% WOULD NOT REPORT 16% NET WOULD REPORT 65%
Base : All 5699 Q.44. How confident or not are you in the ability of local public services to do something
about these types of anti-social behaviour?
Very confident 14% Fairly confident 42% Not very confident 29% Not at all confident 14% Don't know 1% CONFIDENT 56% NOT CONFIDENT 43% NET CONFIDENT 13%
Base : All 5699 Q.45. Local public services need to decide how best to use their resources. With this in
mind, and thinking about the impact that anti-social behaviour and crime has on you and others in your local area, how important do you think it is for local public services to focus their efforts on tackling the following issues?... Vehicle crime
Essential 33% Very important 46% Fairly important 19% Not important 1% Don't know 1%
Base : All 5699
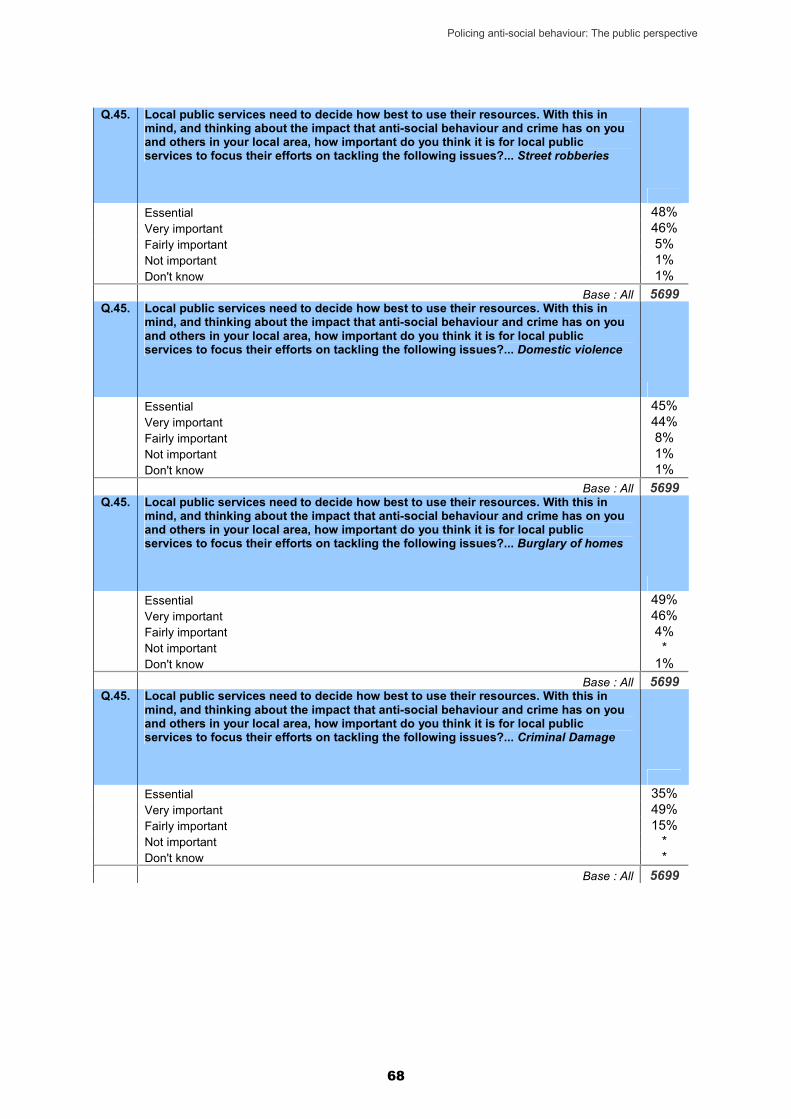
Policing anti-social behaviour: The public perspective
68
Q.45. Local public services need to decide how best to use their resources. With this in mind, and thinking about the impact that anti-social behaviour and crime has on you and others in your local area, how important do you think it is for local public services to focus their efforts on tackling the following issues?... Street robberies
Essential 48% Very important 46% Fairly important 5% Not important 1% Don't know 1%
Base : All 5699 Q.45. Local public services need to decide how best to use their resources. With this in
mind, and thinking about the impact that anti-social behaviour and crime has on you and others in your local area, how important do you think it is for local public services to focus their efforts on tackling the following issues?... Domestic violence
Essential 45% Very important 44% Fairly important 8% Not important 1% Don't know 1%
Base : All 5699 Q.45. Local public services need to decide how best to use their resources. With this in
mind, and thinking about the impact that anti-social behaviour and crime has on you and others in your local area, how important do you think it is for local public services to focus their efforts on tackling the following issues?... Burglary of homes
Essential 49% Very important 46% Fairly important 4% Not important *Don't know 1%
Base : All 5699 Q.45. Local public services need to decide how best to use their resources. With this in
mind, and thinking about the impact that anti-social behaviour and crime has on you and others in your local area, how important do you think it is for local public services to focus their efforts on tackling the following issues?... Criminal Damage
Essential 35% Very important 49% Fairly important 15% Not important *Don't know *
Base : All 5699

Policing anti-social behaviour: The public perspective
69
Q.45. Local public services need to decide how best to use their resources. With this in mind, and thinking about the impact that anti-social behaviour and crime has on you and others in your local area, how important do you think it is for local public services to focus their efforts on tackling the following issues?... Noisy and nuisance neighbours
Essential 20% Very important 34% Fairly important 39% Not important 6% Don't know 1%
Base : All 5699 Q.45. Local public services need to decide how best to use their resources. With this in
mind, and thinking about the impact that anti-social behaviour and crime has on you and others in your local area, how important do you think it is for local public services to focus their efforts on tackling the following issues?... People being drunk or rowdy in public places
Essential 17% Very important 30% Fairly important 45% Not important 7% Don't know 1%
Base : All 5699 Q.45. Local public services need to decide how best to use their resources. With this in
mind, and thinking about the impact that anti-social behaviour and crime has on you and others in your local area, how important do you think it is for local public services to focus their efforts on tackling the following issues?... Vandalism and graffiti
Essential 24% Very important 40% Fairly important 33% Not important 2% Don't know 1%
Base : All 5699 D1. Gender.
Male 46% Female 54% Trans-gender *Prefer not to answer -
Base : All 5699 D2. Could you please tell me your age?
16-24 6% 25-34 15% 35-44 26% 45-54 23% 55-59 8% 60-64 9% 65+ 13% Refused *
Base : All 5699
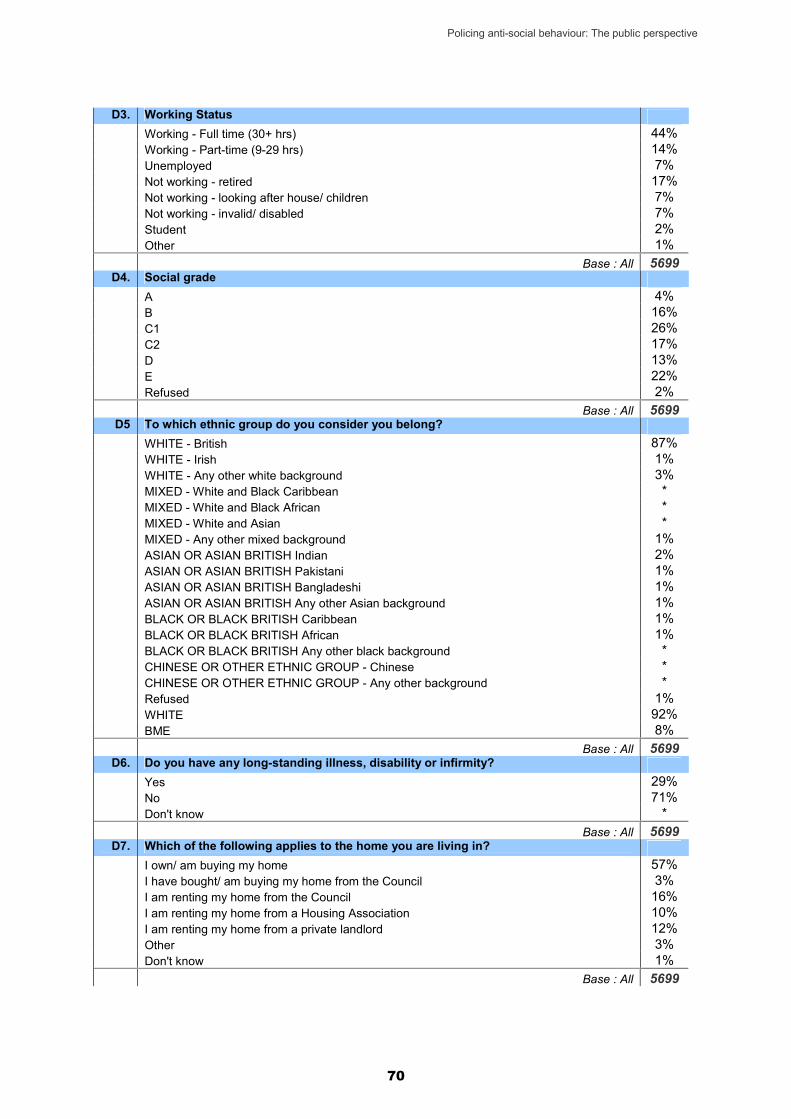
Policing anti-social behaviour: The public perspective
70
D3. Working Status Working - Full time (30+ hrs) 44% Working - Part-time (9-29 hrs) 14% Unemployed 7% Not working - retired 17% Not working - looking after house/ children 7% Not working - invalid/ disabled 7% Student 2% Other 1%
Base : All 5699 D4. Social grade
A 4% B 16% C1 26% C2 17% D 13% E 22% Refused 2%
Base : All 5699 D5 To which ethnic group do you consider you belong?
WHITE - British 87% WHITE - Irish 1% WHITE - Any other white background 3% MIXED - White and Black Caribbean *MIXED - White and Black African *MIXED - White and Asian *MIXED - Any other mixed background 1% ASIAN OR ASIAN BRITISH Indian 2% ASIAN OR ASIAN BRITISH Pakistani 1% ASIAN OR ASIAN BRITISH Bangladeshi 1% ASIAN OR ASIAN BRITISH Any other Asian background 1% BLACK OR BLACK BRITISH Caribbean 1% BLACK OR BLACK BRITISH African 1% BLACK OR BLACK BRITISH Any other black background *CHINESE OR OTHER ETHNIC GROUP - Chinese *CHINESE OR OTHER ETHNIC GROUP - Any other background *Refused 1% WHITE 92% BME 8%
Base : All 5699 D6. Do you have any long-standing illness, disability or infirmity?
Yes 29% No 71% Don't know *
Base : All 5699 D7. Which of the following applies to the home you are living in?
I own/ am buying my home 57% I have bought/ am buying my home from the Council 3% I am renting my home from the Council 16% I am renting my home from a Housing Association 10% I am renting my home from a private landlord 12% Other 3% Don't know 1%
Base : All 5699

Policing anti-social behaviour: The public perspective
71
D8. How many children aged fifteen or under are there in your household?
None 64% 1 16% 2 14% 3 4% 4 1% 5 *6 *7 *8 *9+ -Refused *

72
Appendix B: Discussion guideAttitudes towards Anti Social Behaviour
FINAL Discussion Guide – 04 March 2010
Time: 6 30 to 8 30 pmApprox. 2 hour Group Discussions
Primary objectives� To explore public understanding of ASB and how perceptions are framed at different levels (personal, local neighbourhood, national)� Understand public perceptions towards police/council/others handling of ASB� Understand how experiences of ASB impact on perceptions, attitudes and behaviour.� Explore tolerance levels and trigger points for taking action. What are the trigger points for calling to report? What are the barriers?� Experiences of calling to report ASB. Why are people positive or negative? What are the key levels of service people would expect?
Key Themes� Perceptions of the local area� Perceptions of ASB (and how framed)� Responsibilities for tackling ASB, and how should those with responsibilities be working together/handling ASB?� Actual experiences of ASB� Likelihood to report� Expected outcomes of reporting

73
6.30 – 6.40Plenary: Introductionsand warm up
Introductions to the session, intros to moderatorsTHANK PARTICIPANTS FOR ATTENDING
INTRODUCE SELF/ IPSOS MORI – STRESS ROLE AS INDEPENDENTRESEARCH ORGANISATION AND THAT WE ARE HERE TO GATHER ALLOPINIONS.
EXPLAIN THE AIM OF THE DISCUSSION
RULES OF THE DISCUSSION – ALL OPINIONS ARE VALID, NO RIGHT ORWRONG ANSWERS. ONLY ONE PERSON SPEAKING AT A TIME, NO TALKINGOVER THE TOP OF EACH ANOTHER. ENCOURAGE DEBATE ANDDISCUSSION WHERE THERE ARE DIFFERENCES OF OPINION, BUT MAKECLEAR THERE MUST BE RESPECT FOR ONE ANOTHER’S POINT OF VIEW.
CONFIDENTIALITY – REASSURE RESPONSES ANONYMOUS AND THATINFORMATION ABOUT INDIVIDUALS WILL NOT BE PASSED ON TO ANYONE.EXPLAIN WE ABIDE BY MRS CODE OF CONDUCT.
GET PERMISSION TO DIGITALLY RECORD – TRANSCRIBE FOR QUOTESAND AN ACCURATE RECORD, AGAIN EXPLAIN THAT THERE IS NODETAILED ATTRIBUTION.
HOUSEKEEPING – TOILETS, FIRE EXIT, REFRESHMENTS, MOBILE PHONESOFF.
6:40 -6.50Syndicate: The localarea as a place to live
ICEBREAKER – GO ROUND THE GROUP ASKING EACH PARTICIPANT. THEFOLLOWING. NEEDS TO BE KEPT BRIEF
Flip chart paperPictures
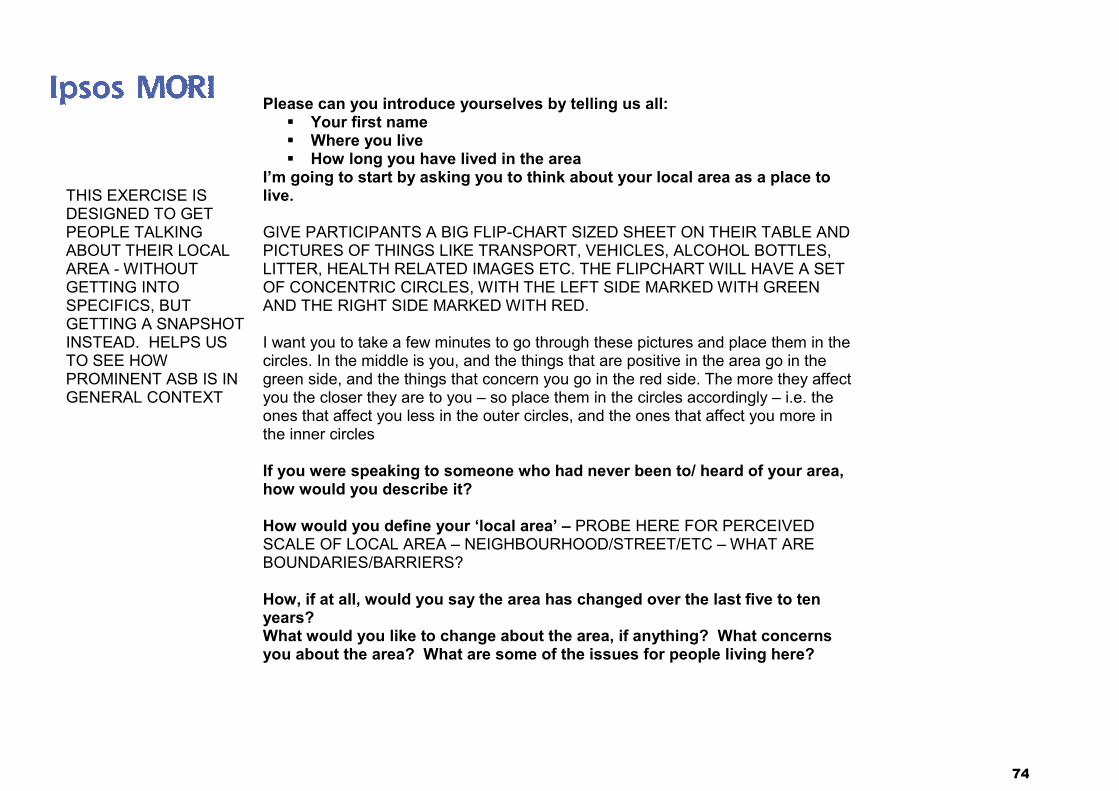
74
THIS EXERCISE ISDESIGNED TO GETPEOPLE TALKINGABOUT THEIR LOCALAREA - WITHOUTGETTING INTOSPECIFICS, BUTGETTING A SNAPSHOTINSTEAD. HELPS USTO SEE HOWPROMINENT ASB IS INGENERAL CONTEXT
Please can you introduce yourselves by telling us all:� Your first name� Where you live� How long you have lived in the area
I’m going to start by asking you to think about your local area as a place tolive.
GIVE PARTICIPANTS A BIG FLIP-CHART SIZED SHEET ON THEIR TABLE ANDPICTURES OF THINGS LIKE TRANSPORT, VEHICLES, ALCOHOL BOTTLES,LITTER, HEALTH RELATED IMAGES ETC. THE FLIPCHART WILL HAVE A SETOF CONCENTRIC CIRCLES, WITH THE LEFT SIDE MARKED WITH GREENAND THE RIGHT SIDE MARKED WITH RED.
I want you to take a few minutes to go through these pictures and place them in thecircles. In the middle is you, and the things that are positive in the area go in thegreen side, and the things that concern you go in the red side. The more they affectyou the closer they are to you – so place them in the circles accordingly – i.e. theones that affect you less in the outer circles, and the ones that affect you more inthe inner circles
If you were speaking to someone who had never been to/ heard of your area,how would you describe it?
How would you define your ‘local area’ – PROBE HERE FOR PERCEIVEDSCALE OF LOCAL AREA – NEIGHBOURHOOD/STREET/ETC – WHAT AREBOUNDARIES/BARRIERS?
How, if at all, would you say the area has changed over the last five to tenyears?What would you like to change about the area, if anything? What concernsyou about the area? What are some of the issues for people living here?

75
6:50 – 7.15Syndicate: Perceptionsof ASB
The Home Office hasthree broad categories ofASB:
Street Problems:including Intimidation,Drunkenness, Begging,Public drug dealing,Street prostitution andKerb-crawling.
Nuisance Neighbours:including Intimidation,Harassment, Noisenuisance, Rowdybehaviour such asswearing and fighting,Waste dumping, Hoaxcalls, Animal-relatedproblems and Vehicle-related problems.
Environmental:including Graffiti, Fly-tipping, Littering andwaste dumping, Dogfouling, Vandalism,
Generally what is it like to live around here? What is good about it? What is bad about it? How hasit changed? PROMPT ON LIVEABILITY ISSUES – crime, problems, environment, cleanliness, etc.
NOTE BALANCE BETWEEN POSITIVES AND NEGATIVES – WHY DO PEOPLE PRIORITISEPARTICULAR ISSUES? WHY IS CRIME/ASB HIGHLIGHTED? (OR WHY NOT?)
IF NOT RAISED BEFORE SAY: I’d now like to talk to you about Anti-SocialBehaviour. Has anyone heard of the term ‘Anti-Social Behaviour’? Where do youhear this turn being mentioned? What does it mean to you?MIND MAPPING EXERCISE – ask respondents to note down what they consider tobe anti-social behaviour.DISCUSS AND NOTE DOWN ON FLIP CHART.
SPLIT INTO TWO GROUPS - EACH GROUP TO STICK POST-IT NOTES OFBEHAVIOUR TYPES ON FLIPCHART – [rank the different types of behaviour on ascale (top-to-bottom) of impact on quality of life in the area, with a scale (left-to-right) of how prevalent anti-social the behaviour is locally]. Discuss why there mightbe differences between the two groups.Is ASB a problem in this area? How serious is it? What kind of impact does ithave on you? And on other people in the community? Why do you say this?FOR EACH ASK: Is this an issue for you personally? For the localneighbourhood? Is this an issue across neighbourhoods – national issue?PROBE FOR REASONINGHow serious is each relative to other social issues PROMPT for other issues suchas healthcare, transport, education, unemployment etc (and other liveability issuesraised earlier on).What are the most important ASB issues to deal with in terms of thecommunity as a whole? Why do you say this? PROBE FULLY TO SEE THELEVEL OF CONSENSUS IN THE GROUP.
Flip chart paperBlank sort cardsMarker pens
76
Abandoned vehicles andCriminal damage.
Who do you think is causing this ASB? NOTE IF FOCUS IS ON GENERALGROUPINGS OR PROBLEM INDIVIDUALS. Why do you say that?PROBE FOR WHO IS SEEN RESPONSIBLE FOR DIFFERENT TYPES OF ASBAND HOW VIEWS CHANGE (OR NOT)
7.15 – 7.30Syndicate:RESPONSIBILITIESFOR HANDLING ASB
Local council dealingwith crime and anti-social behaviour
CONNECT WITH PREVIOUS SECTION BY CONTINUING TO USE MINDMAP
Whose responsibility do you think it is to improve these things generally?PROBE: COUNCIL VS. POLICE/ HEALTH SERVICES, CENTRAL GOVERNMENTETC.
And whose responsibility do you think it is to deal with each of the differentelements of anti social behaviour?
PROBE police, local council, government, schools/teachers, parents, outsideagencies, social services? PROBE within these for names/types/ranks ofindividuals i.e. local police or PCSOs? Rather than just ‘the police’.
WRITE AGENCY ON RELEVANT ITEM ON MINDMAP
PROBE for positives and negatives about each of these groups. How far do youtrust the police (and other groups mentioned in turn) to take action? What elsewould you like to see them do?
Are there any schemes/initiatives going on in the area to tackle ASB issuesthat you are aware of? What are the schemes doing? Have you heardanything about action to tackle ASB issues on the news, in the papers, oranywhere else?
What do you think about these? Why do you say that?
77
How far do you think they are successful? Why do you say this? Who runsthem? PROBE for names of agencies, names.FOR EACH INITIATIVE MENTIONED LIST AND ESTABLISH WHICHAGENCIES/AUTHORITIES IT LINKS IN WITH ON FLIPCHARTWho should run them? Why do you think that?
7.30 – 7.45(15 minutes)Syndicate:IMPACT OFEXPERIENCES
Have you or anyone you know experienced ASB? ASK THEM TO DESCRIBEFULLY: WHAT TYPE OF INCIDENTS, FREQUENCY, SEVERITY, WHO BY,HOW CLOSE TO WHERE LIVE/WORK/LEARN ETC?
How did these experiences effect you/others? In what way? How did it makeyou feel?
Did it make you/them behave differently to normal? PROBE FOR CHANGE INBEHAVIOUR GENERALLY, AND ALSO CHANGES TO HABITS AND ROUTINES.
7.45 – 8.05(20 minutes)Syndicate:LIKELIHOOD TOREPORT
Have you ever reported ASB?IF YES: What was your experience? What made you report it? Who did youreport it to? How easy was it to report it? What kind of response did you get?What was the outcome? How did you feel throughout?
IF NO: Why not? Would you consider it? In what circumstances?
GIVE SCENARIO TO RESPOND TO, THEN REPEAT WITH ANOTHER TYPE OFSCENARIO:- would you report in this instance?- What would be your considerations?- What would encourage you to report?- What would stop you?
Scenarios
78
- What would you worry about?DO COST BENEFIT EXERCISE FOR REPORTING TO SUMMARISE KEYPOINTS. WHAT ARE THE COSTS? WHAT ARE THE BENEFITS? DOESBALANCE LIE IN FAVOUR OF COSTS OR BENEFITS?
NOTE HOW ATTITUDES CHANGE IF ASSOCIATE ASB WITH DIFFERENTTYPES OF PEOPLE – DIFFERENT TOLERANCE LEVELS FOR DIFFERENTPEOPLE?
8.05 – 8.20(15 minutes)Syndicate: EXPECTEDSERVICE LEVELS
When / if you have reported ASB who do you expect to respond? What do youexpect to happen? What kind of service do you expect:- at the point of reporting- should you be visited? Who by? What should happen?- Any further action? Feedback?- General communications
Are there aspects of this which need to happen to encourage you to report ASB?Are there aspects of way you are treated by the agencies addressing ASB that putyou off reporting ASB
ASK PARTICIPANTS TO DRAW UP A MINIMUM SERVICE REQUIREMENT /PLEDGE
Does how you perceive the police and their actions have any impact on how youchose to behave? PROBE – Do you think you may be more or less inclined to takea stance against ASB if you had confidence in what the police were doing?
IN RELATION TO THE MULTIPLE AGENCIES MENTIONED PREVIOUSLY ASK:
Flipchart paper and pen

79
How should these joined-up services be presented / accessible to you? If youexperienced a problem with crime or anti-social behaviour but you weren’t sure whowas responsible for dealing with it, what do you think would be an acceptable levelof service to receive from any member of the partnership you chose to contact?PROBE – Why do you say that?How would that help? Would that help them to be more or less effective? Howwould that make you feel about your local police force/ partnership?
8.20 – 8.30Final round-up After everything we have discussed today I would like us to go around the table and
for each of you to let us know what is the one key message that you would like meto take back to HMIC?
Thank you all very much for your time. Are there any other final things you’d like tosay about the issue?
Thank and distribute incentives.Close.

80
Appendix C: Opt-out letter
Private and Confidential [Title] [Name] [Surname] [Address] [Postcode] REF NO: [moriid] April 2010 Dear [title] [Name] [Surname]
Can you spare 15 minutes to help improve your local police service?
We are writing to ask you to take part in research about police response to anti-social behaviour. Hearing your views is the best way to improve the service the police provides to those who report anti-social behaviour. Her Majesty’s Inspectorate of Constabulary (HMIC), the independent body which assesses police performance, has asked Ipsos MORI, an independent research agency, to carry out this survey.
We understand that you have called the police to report anti-social behaviour within the last twelve months. Your views are very important to us, no matter how minor the issue. The survey will ask about how the police handled your call. We will not ask any questions about the incident itself. On average, the survey will take 15 minutes to complete.
To take part, you do not need to do anything. One of Ipsos MORI’s interviewers will call you over the coming weeks to arrange a convenient time to conduct the interview by telephone. If you do not wish to take part, or if you think your telephone number has changed since you gave it to the police, please complete and return the contact form overleaf within the next two weeks.
All of your answers to the survey will be completely confidential – neither Her Majesty’s Inspectorate of Constabulary nor your local police force will know who has taken part. Your details will be used only for the purposes of this research and will not be shared with any other organisation.
There is more information about the survey overleaf. If you have any questions, please contact Ipsos MORI on 0203 043 3213, leaving your name, reference number (from the top right hand side of this letter) and telephone number.
Thank you very much for your time.
Yours sincerely
Will Scott, Crime and Justice Research Team Bernard Hogan-Howe, QPM MBA MA (Oxon) CMI Ipsos MORI Social Research Institute HM Inspector of Constabulary
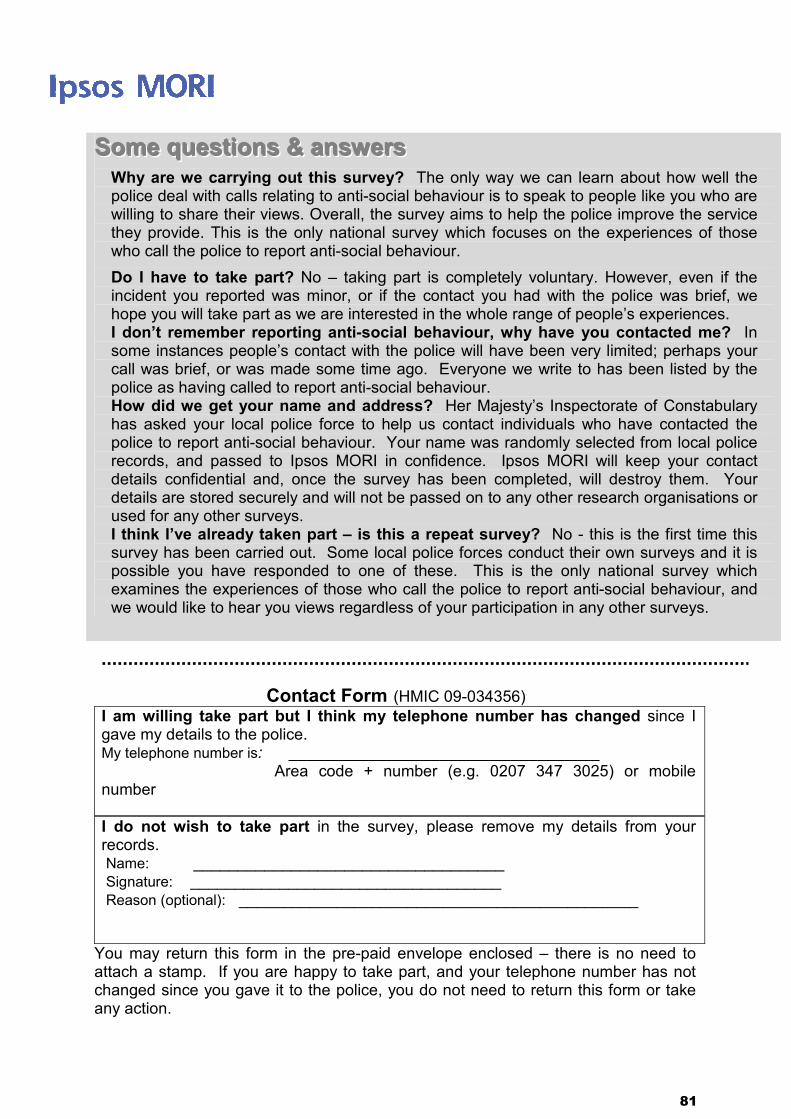
81
Contact Form (HMIC 09-034356) I am willing take part but I think my telephone number has changed since I gave my details to the police. My telephone number is: ___________________________________ Area code + number (e.g. 0207 347 3025) or mobile number
I do not wish to take part in the survey, please remove my details from your records. Name: ___________________________________ Signature: ___________________________________ Reason (optional): _____________________________________________
You may return this form in the pre-paid envelope enclosed – there is no need to attach a stamp. If you are happy to take part, and your telephone number has not changed since you gave it to the police, you do not need to return this form or take any action.
SSSooommmeee qqquuueeessstttiiiooonnnsss &&& aaannnssswwweeerrrsssWhy are we carrying out this survey? The only way we can learn about how well the police deal with calls relating to anti-social behaviour is to speak to people like you who are willing to share their views. Overall, the survey aims to help the police improve the service they provide. This is the only national survey which focuses on the experiences of those who call the police to report anti-social behaviour. Do I have to take part? No – taking part is completely voluntary. However, even if the incident you reported was minor, or if the contact you had with the police was brief, we hope you will take part as we are interested in the whole range of people’s experiences. I don’t remember reporting anti-social behaviour, why have you contacted me? In some instances people’s contact with the police will have been very limited; perhaps your call was brief, or was made some time ago. Everyone we write to has been listed by the police as having called to report anti-social behaviour. How did we get your name and address? Her Majesty’s Inspectorate of Constabulary has asked your local police force to help us contact individuals who have contacted the police to report anti-social behaviour. Your name was randomly selected from local police records, and passed to Ipsos MORI in confidence. Ipsos MORI will keep your contact details confidential and, once the survey has been completed, will destroy them. Your details are stored securely and will not be passed on to any other research organisations or used for any other surveys. I think I’ve already taken part – is this a repeat survey? No - this is the first time this survey has been carried out. Some local police forces conduct their own surveys and it is possible you have responded to one of these. This is the only national survey which examines the experiences of those who call the police to report anti-social behaviour, and we would like to hear you views regardless of your participation in any other surveys.
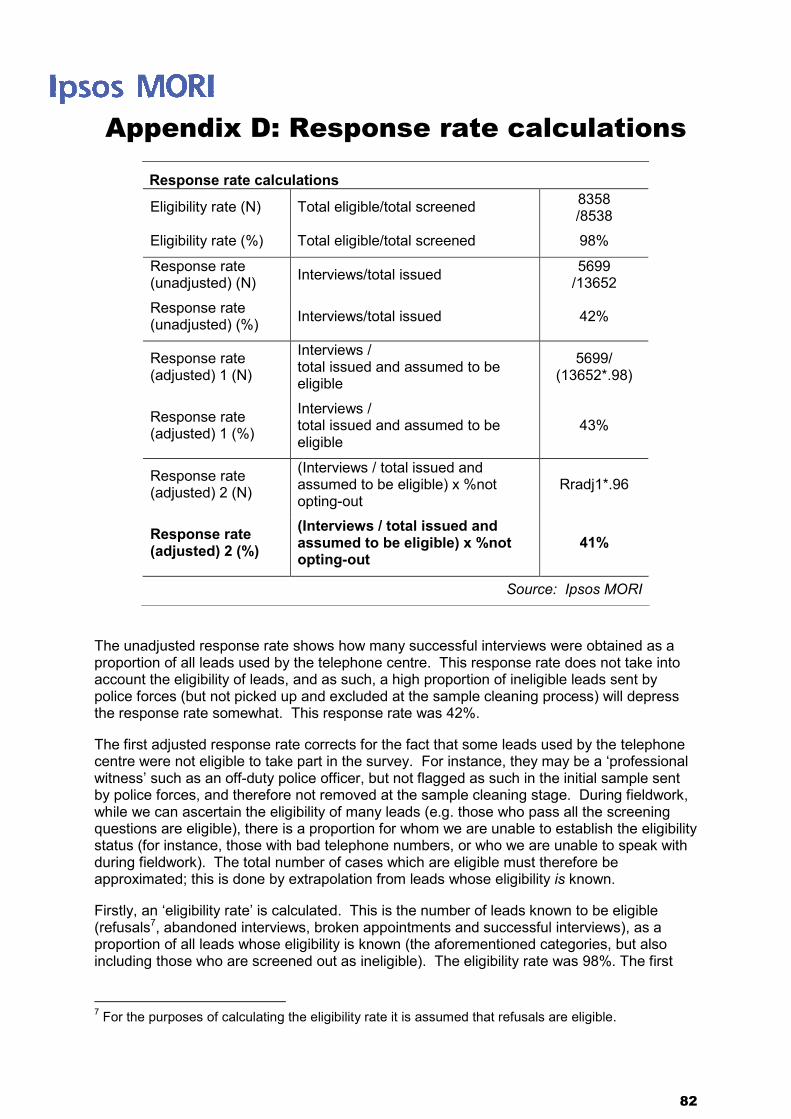
82
Appendix D: Response rate calculations
Response rate calculations
Eligibility rate (N) Total eligible/total screened 8358 /8538
Eligibility rate (%) Total eligible/total screened 98%
Response rate (unadjusted) (N) Interviews/total issued 5699
/13652
Response rate (unadjusted) (%) Interviews/total issued 42%
Response rate (adjusted) 1 (N)
Interviews / total issued and assumed to be eligible
5699/ (13652*.98)
Response rate (adjusted) 1 (%)
Interviews / total issued and assumed to be eligible
43%
Response rate (adjusted) 2 (N)
(Interviews / total issued and assumed to be eligible) x %not opting-out
Rradj1*.96
Response rate (adjusted) 2 (%)
(Interviews / total issued and assumed to be eligible) x %not opting-out
41%
Source: Ipsos MORI
The unadjusted response rate shows how many successful interviews were obtained as a proportion of all leads used by the telephone centre. This response rate does not take into account the eligibility of leads, and as such, a high proportion of ineligible leads sent by police forces (but not picked up and excluded at the sample cleaning process) will depress the response rate somewhat. This response rate was 42%.
The first adjusted response rate corrects for the fact that some leads used by the telephone centre were not eligible to take part in the survey. For instance, they may be a ‘professional witness’ such as an off-duty police officer, but not flagged as such in the initial sample sent by police forces, and therefore not removed at the sample cleaning stage. During fieldwork, while we can ascertain the eligibility of many leads (e.g. those who pass all the screening questions are eligible), there is a proportion for whom we are unable to establish the eligibility status (for instance, those with bad telephone numbers, or who we are unable to speak with during fieldwork). The total number of cases which are eligible must therefore be approximated; this is done by extrapolation from leads whose eligibility is known.
Firstly, an ‘eligibility rate’ is calculated. This is the number of leads known to be eligible (refusals7, abandoned interviews, broken appointments and successful interviews), as a proportion of all leads whose eligibility is known (the aforementioned categories, but also including those who are screened out as ineligible). The eligibility rate was 98%. The first
7 For the purposes of calculating the eligibility rate it is assumed that refusals are eligible.

83
adjusted response rate is then calculated as the number of successful interviews, as a proportion of all leads issued, divided by the eligibility rate. This response rate was 43%.
The second adjusted response rate corrects for the fact that some leads opt out of the survey at the opt-out stage. Although not directly approached for an interview, these leads could be classed as refusals. Removing these leads before sample is issued to the telephone centre artificially increases response rates, given that some leads who are more likely to refuse are not telephoned. In order to correct for this bias, the second adjusted response rate weights the first adjusted response rate down by the proportion who opted out before fieldwork. This response rate stood at 41% (i.e. 96% of the first adjusted response rate). As such, taking into account those who opt out of the survey, just over two in five eligible leads uploaded by the telephone centre result in a successful interview.
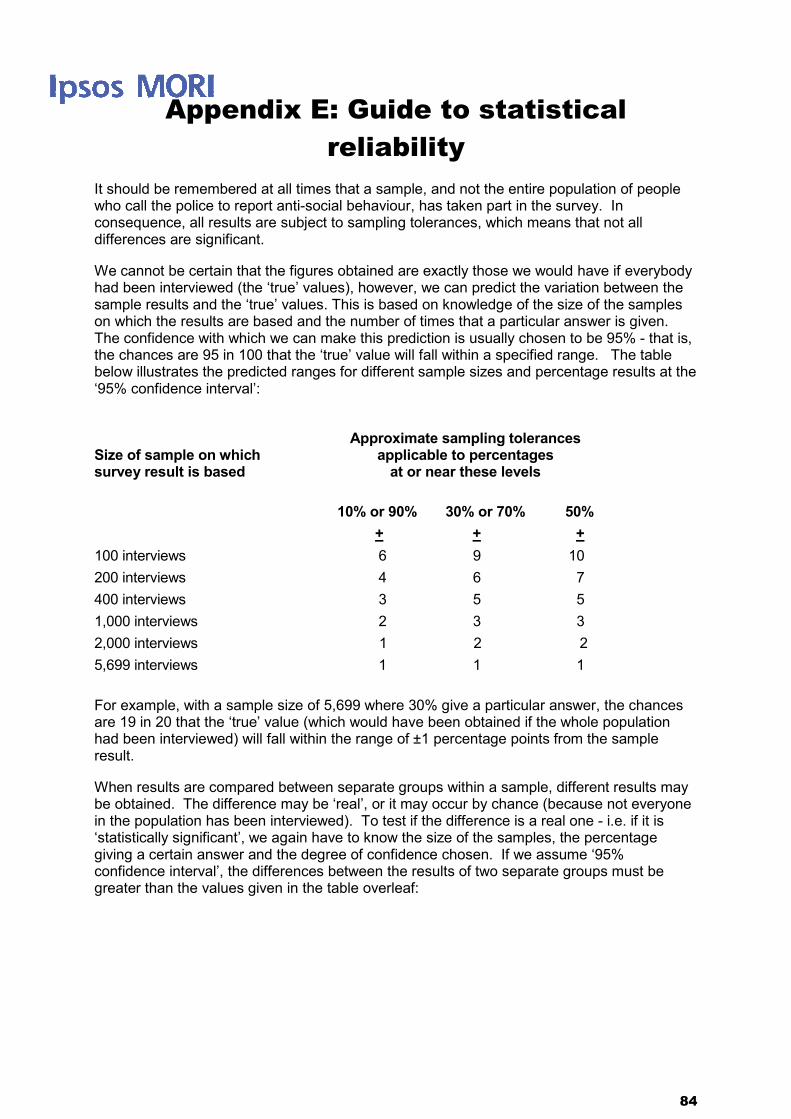
84
Appendix E: Guide to statistical reliability
It should be remembered at all times that a sample, and not the entire population of people who call the police to report anti-social behaviour, has taken part in the survey. In consequence, all results are subject to sampling tolerances, which means that not all differences are significant.
We cannot be certain that the figures obtained are exactly those we would have if everybody had been interviewed (the ‘true’ values), however, we can predict the variation between the sample results and the ‘true’ values. This is based on knowledge of the size of the samples on which the results are based and the number of times that a particular answer is given. The confidence with which we can make this prediction is usually chosen to be 95% - that is, the chances are 95 in 100 that the ‘true’ value will fall within a specified range. The table below illustrates the predicted ranges for different sample sizes and percentage results at the ‘95% confidence interval’:
Approximate sampling tolerances
Size of sample on which applicable to percentages survey result is based at or near these levels
10% or 90% 30% or 70% 50% + + +100 interviews 6 9 10 200 interviews 4 6 7 400 interviews 3 5 5 1,000 interviews 2 3 3 2,000 interviews 1 2 2 5,699 interviews 1 1 1 For example, with a sample size of 5,699 where 30% give a particular answer, the chances are 19 in 20 that the ‘true’ value (which would have been obtained if the whole population had been interviewed) will fall within the range of ±1 percentage points from the sample result.
When results are compared between separate groups within a sample, different results may be obtained. The difference may be ‘real’, or it may occur by chance (because not everyone in the population has been interviewed). To test if the difference is a real one - i.e. if it is ‘statistically significant’, we again have to know the size of the samples, the percentage giving a certain answer and the degree of confidence chosen. If we assume ‘95% confidence interval’, the differences between the results of two separate groups must be greater than the values given in the table overleaf:
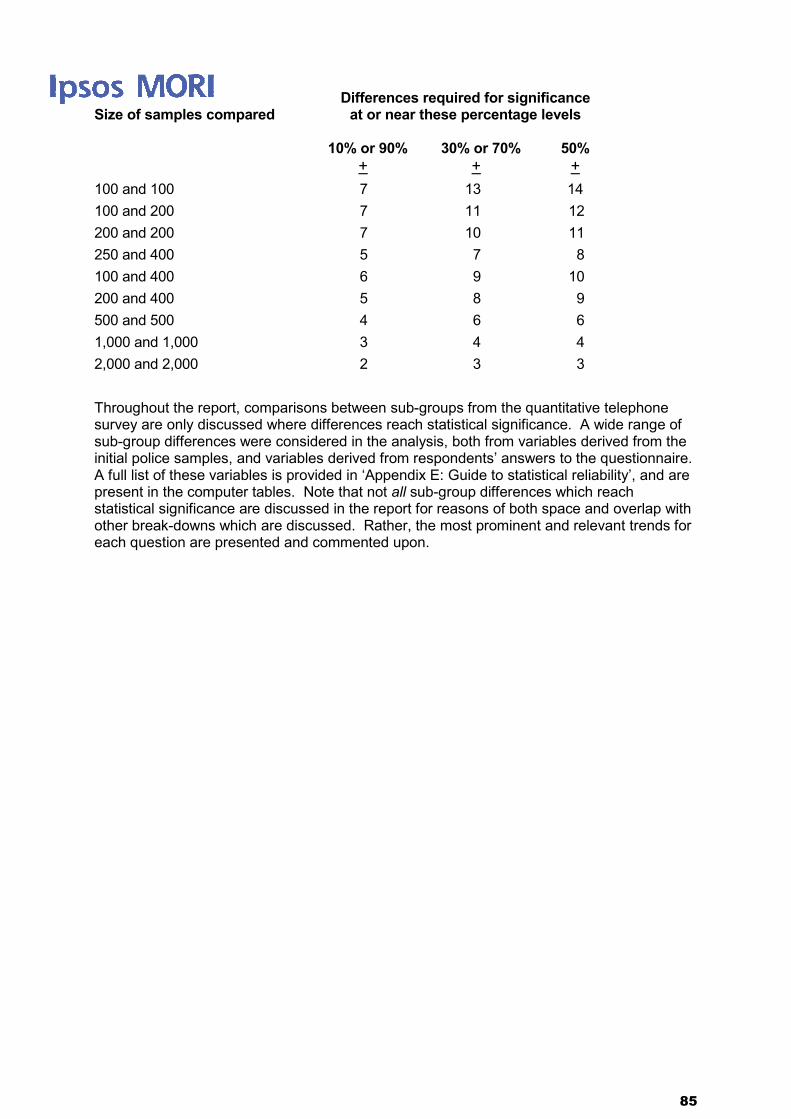
85
Differences required for significance Size of samples compared at or near these percentage levels
10% or 90% 30% or 70% 50% + + +
100 and 100 7 13 14 100 and 200 7 11 12 200 and 200 7 10 11 250 and 400 5 7 8 100 and 400 6 9 10 200 and 400 5 8 9 500 and 500 4 6 6 1,000 and 1,000 3 4 4 2,000 and 2,000 2 3 3 Throughout the report, comparisons between sub-groups from the quantitative telephone survey are only discussed where differences reach statistical significance. A wide range of sub-group differences were considered in the analysis, both from variables derived from the initial police samples, and variables derived from respondents’ answers to the questionnaire. A full list of these variables is provided in ‘Appendix E: Guide to statistical reliability’, and are present in the computer tables. Note that not all sub-group differences which reach statistical significance are discussed in the report for reasons of both space and overlap with other break-downs which are discussed. Rather, the most prominent and relevant trends for each question are presented and commented upon.

86
Appendix F: Cross-breaks used for analysis
The following table details the cross-breaks by which the data were interrogated in writing the quantitative sections of the report.
Gender Male
Female
Age 16-34
35-54
55+
Ethnicity White
Mixed
BME
Working Status Working full / part time
Not working
Unemployed (seeking work)
Tenure Own/Buying
Rent
Other
Disability Yes
No
Social Grade AB
C1C2
DE
Children living in household Yes
No
Time lived in local area Less than 2 years 2 to less than 5 years
5 to less than 10 years
10 years or more
Rurality (from sample postcode) Urban
Rural
IMD deprivation measure (from sample postcode) Lowest
Mid-Low
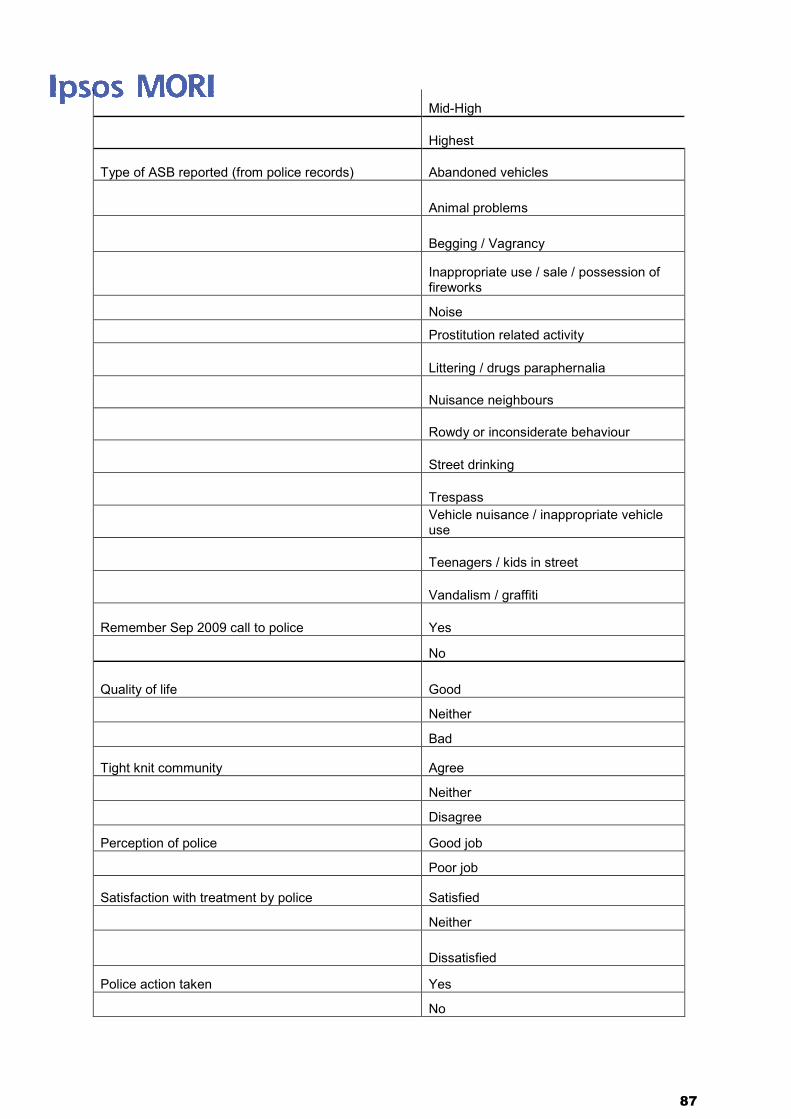
87
Mid-High
Highest
Type of ASB reported (from police records) Abandoned vehicles
Animal problems
Begging / Vagrancy
Inappropriate use / sale / possession of fireworks
Noise
Prostitution related activity
Littering / drugs paraphernalia
Nuisance neighbours
Rowdy or inconsiderate behaviour
Street drinking
Trespass Vehicle nuisance / inappropriate vehicle use
Teenagers / kids in street
Vandalism / graffiti
Remember Sep 2009 call to police Yes
No
Quality of life Good
Neither
Bad
Tight knit community Agree
Neither
Disagree
Perception of police Good job
Poor job
Satisfaction with treatment by police Satisfied
Neither
Dissatisfied
Police action taken Yes
No
88
Level of ASB in local area Problem
Not a problem
Difference call made Big
Little
None
Sense of belonging Yes
No
Dealing with ASB issues that matter Agree
Neither
Disagree
Reported ASB over past year Once
More than once

© HMIC 2010
ISBN: 978-1-84987-304-8
www.hmic.gov.uk