hoekstra morocco -...
TRANSCRIPT
THE WATER FOOTPRINT IN
MOROCCO
J.F. SCHYNS
A.Y. HOEKSTRA
SEPTEMBER 2014
THE ADDED VALUE OF WATER
FOOTPRINT ASSESSMENT FOR
NATIONAL WATER POLICY
VALUE OF WATER RESEARCH REPORT SERIES NO. 67

THE WATER FOOTPRINT IN MOROCCO THE ADDED VALUE OF WATER FOOTPRINT ASSESSMENT
FOR NATIONAL WATER POLICY
J.F. SCHYNS1,*
A.Y. HOEKSTRA1
SEPTEMBER 2014
VALUE OF WATER RESEARCH REPORT SERIES NO. 67
1 University of Twente, Enschede, the Netherlands
*Corresponding author, e-mail: [email protected]
© 2014 J.F. Schyns and A.Y. Hoekstra
Published by:
UNESCO-IHE Institute for Water Education
P.O. Box 3015
2601 DA Delft
The Netherlands
The Value of Water Research Report Series is published by UNESCO-IHE Institute for Water Education, in
collaboration with University of Twente, Enschede, and Delft University of Technology, Delft.
All rights reserved. No part of this publication may be reproduced, stored in a retrieval system, or transmitted, in
any form or by any means, electronic, mechanical, photocopying, recording or otherwise, without the prior
permission of the authors. Printing the electronic version for personal use is allowed.
Please cite this publication as follows:
Schyns, J.F. and Hoekstra, A.Y. (2014) The water footprint in Morocco: The added value of Water Footprint
Assessment for national water policy, Value of Water Research Report Series No. 67, UNESCO-IHE, Delft, the
Netherlands.
Units
1 Mm3 = 1×10⁶ m3 = million m3
1 Gm3 = 1×10⁹ m3 = billion m3
Acknowledgement
This report is an extended version of an article published in PLOS ONE (Schyns and Hoekstra, 2014). The work
was developed as a MSc thesis by Schyns and has been made possible by Deltares (Delft, Netherlands), which
provided the resources to carry out the study. We like to thank Mesfin Mekonnen (University of Twente,
Enschede, Netherlands), Karen Meijer and Wil van der Krogt (Deltares, Delft, Netherlands), Abdelkader Larabi
(Mohammadia School of Engineers, Rabat, Morocco) and Siham Laraichi (Ministry of Energy, Mining, Water
and Environment, Rabat, Morocco) for their feedback during the various stages of research. The present work
was partially developed within the framework of the Panta Rhei Research Initiative of the International
Association of Hydrological Sciences (IAHS).
Contents
Summary................................................................................................................................................................. 5
1. Introduction ........................................................................................................................................................ 9 2. Method and data ............................................................................................................................................... 13
2.1. Scope and study area ................................................................................................................................. 13 2.2. Water footprint of agriculture, industry and households ........................................................................... 14 2.3. Water footprint of storage reservoirs ......................................................................................................... 15 2.4. Water footprint of irrigation supply network ............................................................................................. 16 2.5. Economic water and land productivity ...................................................................................................... 17 2.6. Virtual water flows and associated economic value .................................................................................. 17 2.7. Water footprint in the context of water availability and waste assimilation capacity ................................ 18 2.8. Partial relocation of crop production and benchmarking water productivities .......................................... 22 2.9. Evaluating the added value of Water Footprint Assessment for national water policy in Morocco .......... 23
3. Water Footprint Assessment for Morocco ........................................................................................................ 25 3.1. Water footprint of national production ...................................................................................................... 25 3.2. Water footprint of main crops .................................................................................................................... 29 3.3. Economic water and land productivity of main crops ............................................................................... 32 3.4. Virtual water trade balance and national water saving through trade ........................................................ 34
3.4.1. Morocco’s virtual water import ....................................................................................................... 34 3.4.2. Morocco’s virtual water export ....................................................................................................... 36 3.4.3. Morocco’s water savings related to trade ........................................................................................ 38
3.5. Water footprint of consumption and external water dependency .............................................................. 39 3.6. Blue water footprint of production in the context of water availability ..................................................... 40
3.6.1. Blue groundwater footprint in the context of groundwater availability........................................... 42 3.7. Grey water footprint of crop production in the context of available waste assimilation capacity ............. 43
4. Response options .............................................................................................................................................. 47 4.1. Reducing the water footprint of crop production ....................................................................................... 47
4.1.1. Partial relocation of crop production across basins ......................................................................... 47
4.1.2. Overall improvement of water productivities of crops .................................................................... 49 4.1.3. Reducing water footprints of crops to benchmark levels................................................................. 51 4.1.4. Overview of potential water savings in crop production ................................................................. 52
4.2. Water footprint caps per river basin........................................................................................................... 53 4.3. Resource allocation to different crops ....................................................................................................... 54 4.4. Wise virtual water trade ............................................................................................................................. 56
4.4.1. Virtual water import ........................................................................................................................ 56 4.4.2. Virtual water export ......................................................................................................................... 57
5. Added value of Water Footprint Assessment for national water policy ........................................................... 59
4 / The water footprint in Morocco
6. Discussion ......................................................................................................................................................... 61 6.1. Uncertainties and limitations ..................................................................................................................... 61
7. Conclusions ...................................................................................................................................................... 65
References ............................................................................................................................................................ 67
Appendix I: Derivation of K-factor in water footprint of irrigation supply network ............................................ 73 Appendix II: Fraction of total blue water supply withdrawn from groundwater per river basin .......................... 75 Appendix III: Map of aquifers (partially) in action zone ABH Oum Er Rbia ...................................................... 77 Appendix IV: Open water evaporation from different sources ............................................................................. 79 Appendix V: Water footprint of production (1996-2005) at 5x5 arc minute resolution ....................................... 81 Appendix VI: Water footprint of main crops per river basin (1996-2005) ........................................................... 83 Appendix VII: Economic water and land productivity of crops per river basin ................................................... 87 Appendix VIII: Input and output data regarding the crop relocation assessment ................................................. 91 Appendix IX: Summary of national water strategy of Morocco ........................................................................... 97
Summary
Morocco is a semi-arid country in the Mediterranean facing water scarcity and deteriorating water quality. Its
limited water resources constrain the activities in different sectors of the economy. The national water strategy
includes options to reduce water demand and increase supply, but does not consider possibilities to save water
through international virtual water trade or to increase water use efficiency through changing the allocation of
water to different crops (the main water consumers).
The objective of this study is to assess the added value of understanding the water footprint (WF) of the
economy and international virtual water trade in formulating national water policy in Morocco. The question is
whether a thorough Water Footprint Assessment (WFA) can provide new insights and response options that are
currently not considered in the country’s national water strategy and river basin plans. The study includes
analysis of the WF of activities in Morocco (on river basin level and monthly scale), the virtual water trade
balance of the country and the WF in the context of water availability and waste assimilation capacity. Based on
this, response options are formulated to reduce the WF within Morocco, alleviate water scarcity and allocate
water resources more efficiently. Results and conclusions from the WFA are compared with the scope of
analysis of and action plans included in Morocco’s national water strategy and river basin plans in order to
evaluate the added value of WFA relative to these existing plans.
Main results of the WFA are:
• The total WF within Morocco in the period 1996-2005 was 38.8 billion m³/yr (77% green, 18% blue, 5%
grey). The largest contribution comes from crop production, mainly wheat and barley, followed by olives
and maize. Evaporation from storage reservoirs accounts for the second largest form of blue water
consumption nationally, after irrigated crop production. The largest WFs are found in the Oum Er Rbia and
Sebou basins, the main agricultural areas. The green WF is largest in the rainy period December-May,
whereas the blue WF is largest in the period April-September, when irrigation demands increase.
• In the period 1996-2005, Morocco’s water resources have mainly been used to produce relatively low-value
water-intensive (in US$/m³) crops such as cereals, olives and almonds. These crops also took the largest
share in the country’s harvested area, although they had the lowest value per hectare cultivated (in US$/ha).
More economic return per drop and per hectare of land cultivated was generated by production of grapes,
sugar beets, citrus fruits (oranges, mandarins etc.) and tomatoes.
• Morocco was a net virtual water importer in the period 1996-2005. Virtual water import was 12.6 billion
m³/yr, with an average cost of 0.98 US$/m³, and virtual water export was 4.3 billion m³/yr, with an average
earning of 1.66 US$/m³. Only 31% of the virtual water export originated from Moroccan water resources
(the remainder was re-export). Virtual water import and export were related to trade in crop products for
respectively 95% and 91%. By importing products instead of producing them domestically, Morocco saved
27.8 billion m³/yr (75% green, 21% blue and 4% grey) of domestic water, equivalent to 72% of the WF
within Morocco.
6 / The water footprint in Morocco
• Blue water scarcity on a monthly scale is severe in all river basins. Seasonal shortages result in a large
alteration of natural runoff. Also groundwater scarcity and pollution are significant in most basins, especially
in the basins of Bouregreg, Oum Er Rbia and Tensift. In order to move towards sustainable use of
Morocco’s blue water resources, discussing and agreeing on blue WF caps, per river basin, per month, and
for surface and groundwater separately, would be useful.
• Potential green plus blue water savings by partial relocation of crop production across basins are in the order
of 1.9 and 1.2 billion m³ per year when all main crops or only annual crops are relocated, respectively.
Lowering the WFs of the main crops in each river basin down to benchmarks (which are defined as the
lowest water consumption of a crop in a comparable basin) can lead to green plus blue water savings of 2.8
billion m³/yr. When the water productivities of the twelve main water-consuming crops were to be improved
by 10% throughout Morocco, it could potentially save 2.5 billion m³/yr of water (green plus blue).
• Morocco obtained fairly large water savings by food (virtual water) imports in the period 1996-2005 (27.8
billion m³/yr, see above). Increasing food imports to relieve pressure on domestic water resources increases
food dependency and has negative effects on the domestic agricultural sector, which plays a critical role in
the economic and social stability of Morocco.
• About 4% of the water used in the Moroccan agricultural and industrial sectors is used for making export
products (period 1996-2005). The remainder is applied for producing products that are consumed by the
Moroccan population. However, most of the virtual water export from Moroccan resources relates to the
export of products with a relatively low economic value per m³ water exported (in US$/m³).
Several insights and response options emerged from the WFA, which are currently not considered in the
national water strategy of Morocco and the country’s river basin plans. They include:
(i) New insights in the water balance of Morocco and the country’s main river basins:
• The evaporative losses from storage reservoirs account for a significant part of the blue WF within
Morocco. This sheds fresh light on the national water strategy that proposes to build another 60 large and
1000 small dams by 2030.
• Blue water scarcity on a monthly scale is severe and hidden by annual analysis of demand versus supply,
which is the common scale of analysis in Morocco’s river basin plans.
(ii) New insights in how economically efficient water and land resources are used:
• Analysis of the economic value of crop products per unit of water and land used in the period 1996-2005
shows that agricultural policy may be better brought in line with water policy by reconsidering which
crops to grow.
• It is shown that export was not optimal from a water-economics point of view, which raises the question
whether the foreign income generated by export covers the direct and indirect costs of mobilization and
(over)exploitation of Morocco’s water resources. This might not be the case considering the costs of
construction and maintenance of the large dams and intra- and inter-basin water transfers in the country
and the costs associated with the negative externalities of water (over)consumption, such as the salt-
intrusion in Morocco’s coastal aquifers.
(iii) New response options to reduce the WF of crop production:
The water footprint in Morocco / 7
• Analysis of the WF of the main crops in Morocco and its variation across the river basins offers new
ways of looking at reducing water consumption in the agricultural sector. The estimated potential water
savings by partial relocation of crops to basins where they consume less water and by reducing WFs of
crops down to benchmark levels are significant compared to demand reducing and supply increasing
measures considered in the national water strategy of Morocco.
Given these new insights and response options, it is concluded that analysing the WF of activities and
international virtual water flows has an added value for formulating national water policy. WFA forces to look
at end-users and -purposes of freshwater, which is key in determining efficient and equitable water allocation
within the boundaries of what is environmentally sustainable, both on the river basin and national level. This is
especially relevant for water-scarce countries such as Morocco. Furthermore, considering the green and grey
components of a WF provides new perspectives on blue water scarcity, because pressure on blue water
resources might be reduced by more efficient use of green water and by less pollution.

1. Introduction
Morocco is a semi-arid country in the Mediterranean that faces both water scarcity and deteriorating water
quality. The country’s limited water resources constrain the activities in different sectors of the economy.
Agriculture is the largest water consumer and withdrawals for irrigation peak in the dry period of the year,
which contributes to low surface runoff and desiccation of streams. Currently, 130 reservoirs are in operation to
deal with the mismatch in time of water demand and natural water supply and to serve for hydroelectric
generation and flood control (Ministry EMWE, 2011). Groundwater resources also play an important role in the
socio-economic development of the country, in particular by ensuring the water supply for rural communities
(Ministry EMWE, 2012a). However, most aquifers are being overexploited and many suffer from worsening
water quality by intrusion of salt water, caused by the overexploitation, and nitrates and pesticides that leach
from croplands, caused by excessive use of fertilizers. Surface water downstream of some urban centres is also
polluted, due to untreated wastewater discharges.
In 1995, the Moroccan Water Law (no. 10-95) came into force and introduced decentralized integrated water
management and rationalisation of water use, including the polluter-pays and user-pays principles. It also
prescribes the development of national and river basin master plans (Official State Gazette, 1995). Although not
formally established, these plans should be elaborated in accordance with the national water strategy (S.
Laraichi, personal communication, May 24, 2013). To cope with water scarcity and pollution, the national water
strategy includes action plans to reduce demand, increase supply and preserve and protect water resources
(Ministry EMWE, 2011). It also proposes legal and institutional reforms for proper implementation and
enforcement of these actions. Demand management focuses on improving the efficiency of irrigation and urban
supply networks and valorisation of water to rationalise its use. Plans to increase supply include the construction
of more dams and a large North-South inter-basin water transfer, protection of existing hydraulic infrastructure,
desalinization of seawater and reuse of treated wastewater.
Although the national water strategy considers options to reduce water demand in addition to options to increase
supply, it does not analyse potential water saving through international virtual water trade or through changing
the allocation of water to different crops (the main water consumers). Analysis of the water footprint (WF) of
activities in Morocco and the virtual water trade balance of the country therefore might reveal new insights to
alleviate water scarcity.
The concept of WF introduced by Hoekstra (2003) and subsequently elaborated by Hoekstra and Chapagain
(2008) and Hoekstra et al. (2011a) is an indicator of freshwater use that looks not only at direct water use of a
consumer or producer, but also at the indirect water use. As such, it provides a link between human consumption
(final products) and the appropriation of freshwater systems. The WF of a product is the volume of freshwater
used to produce the product, measured over its full supply chain (Hoekstra et al., 2011a). The total freshwater
volume consumed or polluted within the territory of a nation as a result of activities within the different sectors
of the economy is called the WF of national production. Trade in products with a water footprint at the place of
their production is said to cause virtual water flows or trade.
10 / The water footprint in Morocco
The WF is specified spatially and temporarily: it shows not only the volume of water consumed or polluted, but
also where and when. Three different components of a WF are distinguished: green, blue and grey. The green
WF is the volume of rainwater evaporated or incorporated into a product. The blue WF refers to the volume of
surface or groundwater evaporated, incorporated into a product or returned to another catchment or the sea. The
blue WF thus differs from the traditional measure of gross water abstraction, as it refers to net water abstraction,
i.e. gross abstraction minus the volume of water that is returned to where it was abstracted. The grey WF relates
to pollution and is defined as the volume of freshwater required to assimilate the load of pollutants given natural
background concentrations and existing ambient water quality standards (Hoekstra et al., 2011a).
Mekonnen and Hoekstra (2011) quantified and mapped the WFs of nations (incl. Morocco) from a production
and consumption perspective and estimated international virtual water flows and national and global water
savings as a result of international trade. They state that understanding the WF of a nation is highly relevant for
developing well-informed national policy. On the regional level, Aldaya et al. (2010b) conclude that WF
analyses can provide a transparent framework to identify measures to increase water use and allocation
efficiency at the catchment level. In a case study for an agricultural region in Spain, they found that significant
changes in water demand can occur not only by changing the amount of irrigated area but also by modifying the
cropping patterns. By expressing the economic value of farm output per unit of water consumed, they showed
that Spain uses its scarce water resources mainly to produce low-value water-intensive crops. According to
Aldaya et al. (2010a), understanding WFs and virtual water trade in arid and semiarid countries broadens the
understanding of water and food security. Chahed et al. (2011) argue that an integrated analysis of all water
resources at the national scale, including the green water used in rain-fed agriculture and the water resources
virtually embedded in traded foodstuffs, is essential in facing the great challenges of food security in arid
countries.
The objective of this study is to assess the added value of understanding the WF of the economy and
international virtual water trade in formulating national water policy in Morocco. The question is whether a
thorough Water Footprint Assessment (WFA) can provide new insights and response options that are currently
not considered in the country’s national water strategy and river basin plans. The study includes analysis of the
WF of activities in Morocco, the country’s virtual water imports and exports, and the WF in the context of water
availability and waste assimilation capacity. Based on this, response options are formulated to reduce the WF
within Morocco, alleviate water scarcity and allocate water resources more efficiently. Results and conclusions
from the WFA are compared with the scope of analysis of and action plans included in Morocco’s national
water strategy and river basin plans in order to evaluate the added value of WFA relative to these existing plans.
Specifically, the WFA in this study aims to:
1. Analyse the green, blue and grey WF of the different sectors of Morocco’s economy at river basin level on
a monthly scale. The study is largely based on data from Mekonnen and Hoekstra (2011), who estimated
the WF of nations (incl. Morocco) over the period 1996-2005 related to: crop production, grazing, industrial
production, domestic water supply and animal water supply. Their estimates are supplemented with first-
time estimates of the evaporation from the Moroccan irrigation supply network and storage reservoirs.
The water footprint in Morocco / 11
2. Place the blue WF within Morocco in the context of natural runoff and groundwater availability and
compare the nitrogen-related grey WF on groundwater with the waste assimilation capacity of the
groundwater system. The monthly blue WF is compared with monthly natural runoff, since water scarcity
usually manifests itself on a monthly scale (Hoekstra et al., 2012).
3. Assess the water consumption (in m³/ton), economic water productivity (in US$/m³) and economic land
productivity (in US$/ha) of the main crops in Morocco and the variation of these parameters across river
basins within the country.
4. Analyse Morocco’s gross virtual water imports and exports related to international trade in commodities
and the water savings associated with this trade, based on estimates by Mekonnen and Hoekstra (2011). It
includes analysis of which part of its resources Morocco uses for producing export products and the
economic value of imports and exports per unit of water imported and exported, respectively.
5. Discuss the WF of consumption by the Moroccan population as estimated by Mekonnen and Hoekstra
(2011).
6. Formulate response options to reduce the WF within Morocco and allocate water resources more
efficiently, including:
• Reducing the WF of crop production by partial relocation of crop production across river basins (which
is possible due to spatial differences in crop water use) or by improving water productivities (through
improvement with a certain percentage or through improvements towards certain benchmarks).
• Setting maximum sustainable WFs (WF caps) per river basin.
• Resource allocation to different crops (based on economic water and land productivities).
• Smart virtual water import and export.
The WF of Morocco has not been assessed previously on the river basin level on a monthly scale. In addition,
the study is innovative by including in a national WFA specific estimates of the evaporative losses from the
irrigation supply network and from storage reservoirs. Furthermore, this is the first national WFA that includes
quantitative estimates of the potential water savings by (a) relocation of crop production to regions with lower
water consumption per ton of crop; and (b) lowering WFs of crops down to benchmarks (which are defined as
the lowest water consumption of a crop achieved in a basin with comparable reference evapotranspiration).
The applied methodology and data are described in Chapter 2. Chapter 3 includes analysis of the WF of
activities within Morocco, the virtual water trade balance of the country and the WF in the context of water
availability and waste assimilation capacity. Based on this, response options are formulated in Chapter 4. The
added value of WFA for national water policy is discussed in Chapter 5. Chapter 6 discusses uncertainties and
limitations and Chapter 7 presents the final conclusions.

2. Method and data
The applied methods, assumptions and data for the estimates and analyses in this study are described in this
chapter. The study follows the terminology and methodology of The Water Footprint Assessment Manual
(Hoekstra et al., 2011a), which contains the Global Standard for Water Footprint Assessment developed by the
Water Footprint Network.
2.1. Scope and study area
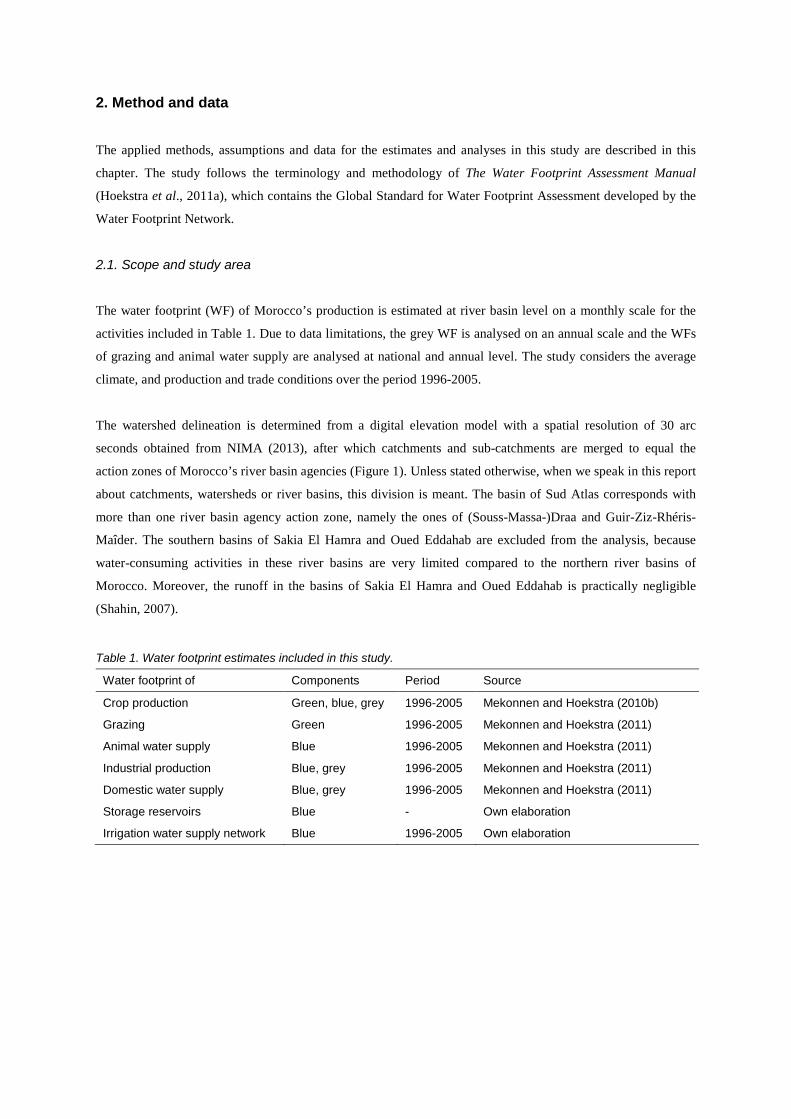
The water footprint (WF) of Morocco’s production is estimated at river basin level on a monthly scale for the
activities included in Table 1. Due to data limitations, the grey WF is analysed on an annual scale and the WFs
of grazing and animal water supply are analysed at national and annual level. The study considers the average
climate, and production and trade conditions over the period 1996-2005.
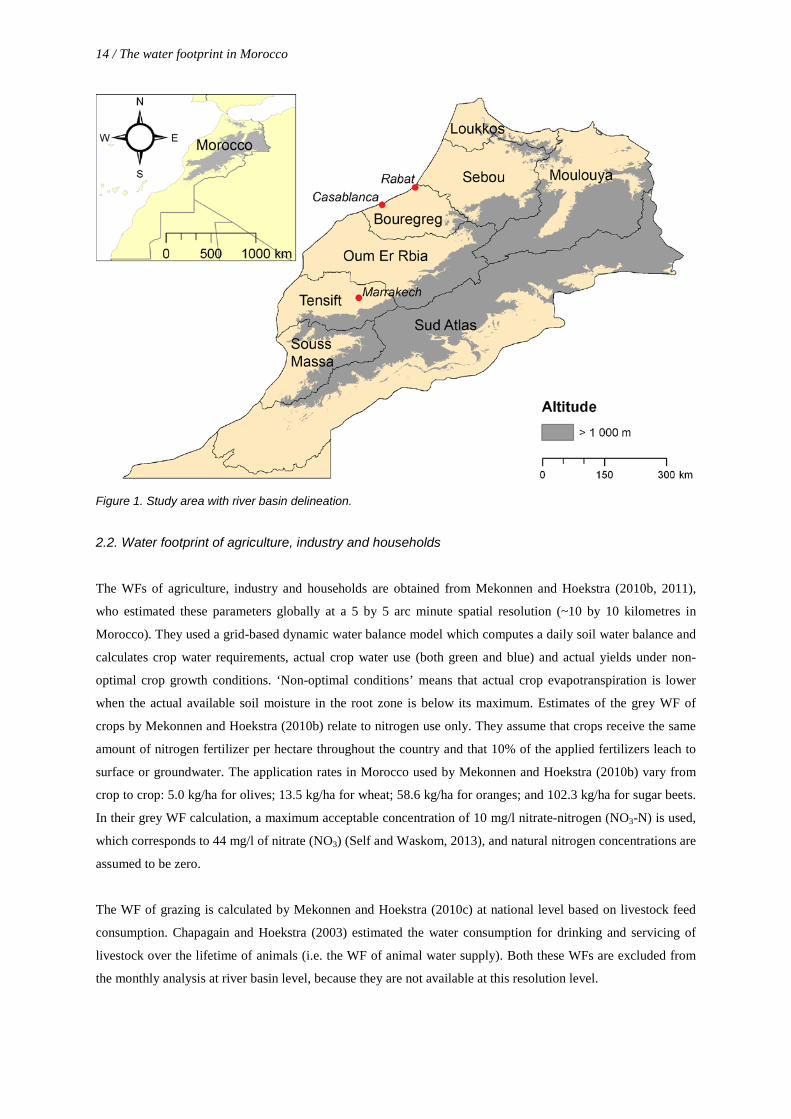
The watershed delineation is determined from a digital elevation model with a spatial resolution of 30 arc
seconds obtained from NIMA (2013), after which catchments and sub-catchments are merged to equal the
action zones of Morocco’s river basin agencies (Figure 1). Unless stated otherwise, when we speak in this report
about catchments, watersheds or river basins, this division is meant. The basin of Sud Atlas corresponds with
more than one river basin agency action zone, namely the ones of (Souss-Massa-)Draa and Guir-Ziz-Rhéris-
Maîder. The southern basins of Sakia El Hamra and Oued Eddahab are excluded from the analysis, because
water-consuming activities in these river basins are very limited compared to the northern river basins of
Morocco. Moreover, the runoff in the basins of Sakia El Hamra and Oued Eddahab is practically negligible
(Shahin, 2007).
Table 1. Water footprint estimates included in this study.
Water footprint of Components Period Source
Crop production Green, blue, grey 1996-2005 Mekonnen and Hoekstra (2010b)
Grazing Green 1996-2005 Mekonnen and Hoekstra (2011)
Animal water supply Blue 1996-2005 Mekonnen and Hoekstra (2011)
Industrial production Blue, grey 1996-2005 Mekonnen and Hoekstra (2011)
Domestic water supply Blue, grey 1996-2005 Mekonnen and Hoekstra (2011)
Storage reservoirs Blue - Own elaboration
Irrigation water supply network Blue 1996-2005 Own elaboration
14 / The water footprint in Morocco
Figure 1. Study area with river basin delineation.
2.2. Water footprint of agriculture, industry and households
The WFs of agriculture, industry and households are obtained from Mekonnen and Hoekstra (2010b, 2011),
who estimated these parameters globally at a 5 by 5 arc minute spatial resolution (~10 by 10 kilometres in
Morocco). They used a grid-based dynamic water balance model which computes a daily soil water balance and
calculates crop water requirements, actual crop water use (both green and blue) and actual yields under non-
optimal crop growth conditions. ‘Non-optimal conditions’ means that actual crop evapotranspiration is lower
when the actual available soil moisture in the root zone is below its maximum. Estimates of the grey WF of
crops by Mekonnen and Hoekstra (2010b) relate to nitrogen use only. They assume that crops receive the same
amount of nitrogen fertilizer per hectare throughout the country and that 10% of the applied fertilizers leach to
surface or groundwater. The application rates in Morocco used by Mekonnen and Hoekstra (2010b) vary from
crop to crop: 5.0 kg/ha for olives; 13.5 kg/ha for wheat; 58.6 kg/ha for oranges; and 102.3 kg/ha for sugar beets.
In their grey WF calculation, a maximum acceptable concentration of 10 mg/l nitrate-nitrogen (NO3-N) is used,
which corresponds to 44 mg/l of nitrate (NO3) (Self and Waskom, 2013), and natural nitrogen concentrations are
assumed to be zero.
The WF of grazing is calculated by Mekonnen and Hoekstra (2010c) at national level based on livestock feed
consumption. Chapagain and Hoekstra (2003) estimated the water consumption for drinking and servicing of
livestock over the lifetime of animals (i.e. the WF of animal water supply). Both these WFs are excluded from
the monthly analysis at river basin level, because they are not available at this resolution level.
The water footprint in Morocco / 15
The blue WF estimates by Mekonnen and Hoekstra (2011) of industrial production and domestic water supply
are based on water abstraction data from the AQUASTAT database of the Food and Agriculture Organization of
the Unites Nations. For industries it is assumed that 5% is actual consumption and that the remainder is return
flow. For households a consumptive portion of 10% is assumed. The part of the return flow that is disposed into
the environment without prior treatment is taken as a measure of the grey WF, thus conservatively assuming a
dilution factor of 1. For rural areas zero treatment is assumed. The WF of industrial production and domestic
water supply are both mapped with a global population density map. The annual blue WF estimates for
industries and households by Mekonnen and Hoekstra (2011) are distributed throughout the year according to
the monthly distribution of public water supply obtained from Ministry EMWE (2013a). These distributions are
available for the basins Loukkos, Sebou, Bouregreg and Oum Er Rbia. For the other basins an average of these
distributions is taken.
The following raster data (at 5x5 arc minute resolution) are obtained from Mekonnen and Hoekstra (2010a,
2011):
• Harvested area per crop (in ha/yr)
• Crop yield (in ton/ha)
• Production per crop (in ton/yr)
• The green and blue WF of crops (in m³/month) and the grey WF of crops (in m³/yr)
• The blue and grey WF of industrial production (in m³/yr)
• The blue and grey WF of domestic water supply (in m³/yr)
All data are averages over the period 1996-2005. The raster data are aggregated per river basin according to the
delineation shown in Figure 1. Reported WF estimates in this study slightly differ (in the order of 1%) from the
reported values by Mekonnen and Hoekstra (2010b; 2011), due to different methods applied in retrieving the
data from the database.
2.3. Water footprint of storage reservoirs
The monthly WF of storage reservoirs per catchment, i.e. evaporation from reservoirs (in m³/month), is
calculated as the surface area of storage reservoirs (in m²) times the open water evaporation (in m/month). Data
per reservoir on long-term monthly average open water evaporation (1939-2011) and surface area at different
reservoir levels for the basins Loukkos, Sebou, Bouregreg and Oum Er Rbia are obtained from Ministry EMWE
(2013c). The surface areas of reservoirs at upper storage level in the other basins are derived from
AQUASTAT’s geo-referenced database of African dams (FAO, 2013b), which includes 105 dams in Morocco.
Reservoir area is reported in 1,000 square metres, but comparison with data from the Ministry EMWE (2013c),
shows the correct unit is more likely to be hectares (10,000 square metres) and is therefore treated as such in this
study. For the basins for which no reservoir specific evaporation data are available, monthly average daily
Penman-Monteith potential evaporation is obtained from a model simulation with the global hydrological model
PCR-GLOBWB carried out by Sperna Weiland et al. (2010). These values are derived at points corresponding
16 / The water footprint in Morocco
with the locations of reservoirs in these catchments (more than one location/reservoir for large catchments). At
these locations, the Penman-Monteith potential evaporation equals the evaporation from open water. Simulation
was carried out for the period 1961-1990 with a time step of one day. Appendix IV contains a comparison of
open water evaporation estimates per river basin (in mm/yr) according to the different data sources used.
Although for the basins of Loukkos, Sebou, Bouregreg and Oum Er Rbia reservoir areas are known at different
water levels, for reasons of consistency, the surface area of reservoirs at upper storage level is taken as a starting
point for all basins. Since storage levels vary throughout the year (and over the years), and reservoir areas
accordingly, assuming upper storage levels would give an overestimation of the evaporation from reservoirs.
Therefore, but due to lack of data on monthly storage levels and associated reservoir areas, for all months a
fraction of the evaporation at upper storage level (43%) is taken as estimate of the WF of storage reservoirs.
This fraction represents the average reservoir area as fraction of its area at upper storage level, calculated as the
average over the reservoirs in the basins of Loukkos, Sebou, Bouregreg and Oum Er Rbia for which data on
surface area at different reservoir levels are available from Ministry EMWE (2013c).
2.4. Water footprint of irrigation supply network
The WF of the irrigation supply network refers to the evaporative loss in the network and is estimated based on
a factor K, which is defined as the ratio of the blue WF of the irrigation supply network to the blue surface WF
of crop production at field level (i.e. crop evapotranspiration of irrigation water stemming from surface water).
K is calculated as (see Appendix I for the derivation of the formula and a clarifying figure):
feee Eaca
K ×
−
×=
11
in which ea represents the field application efficiency, ec the irrigation canal efficiency and fE the fraction of
losses in the irrigation canal network through evaporation (as opposed to percolation), assumed at 50%. The
efficiencies ea and ec are estimated based on data from ABH Sebou (2011) and FAO (2013a) (Table 2).
Table 2. Field and conveyance efficiencies in Morocco’s irrigation supply network.
Type of irrigation Weighted
efficiency* Surface Sprinkler Localized Spate
Field application efficiency 70% 85% 90% 70% 73%
Conveyance efficiency 80% 90% 90% 100% 82%
Scheme irrigation efficiency 56% 77% 81% 70% 60%
% in total area equipped for irrigation 81% 10% 7% 2%
* Weighted average of the irrigation efficiencies according to the area equipped with a specific irrigation type in the total area equipped for irrigation in Morocco. Since the efficiencies used are targets to be achieved with the national irrigation water saving programme, the estimate can be regarded as conservative for the current situation. Sources: irrigation efficiencies from ABH Sebou (2011); area equipped for irrigation from FAO (2013a).
The water footprint in Morocco / 17
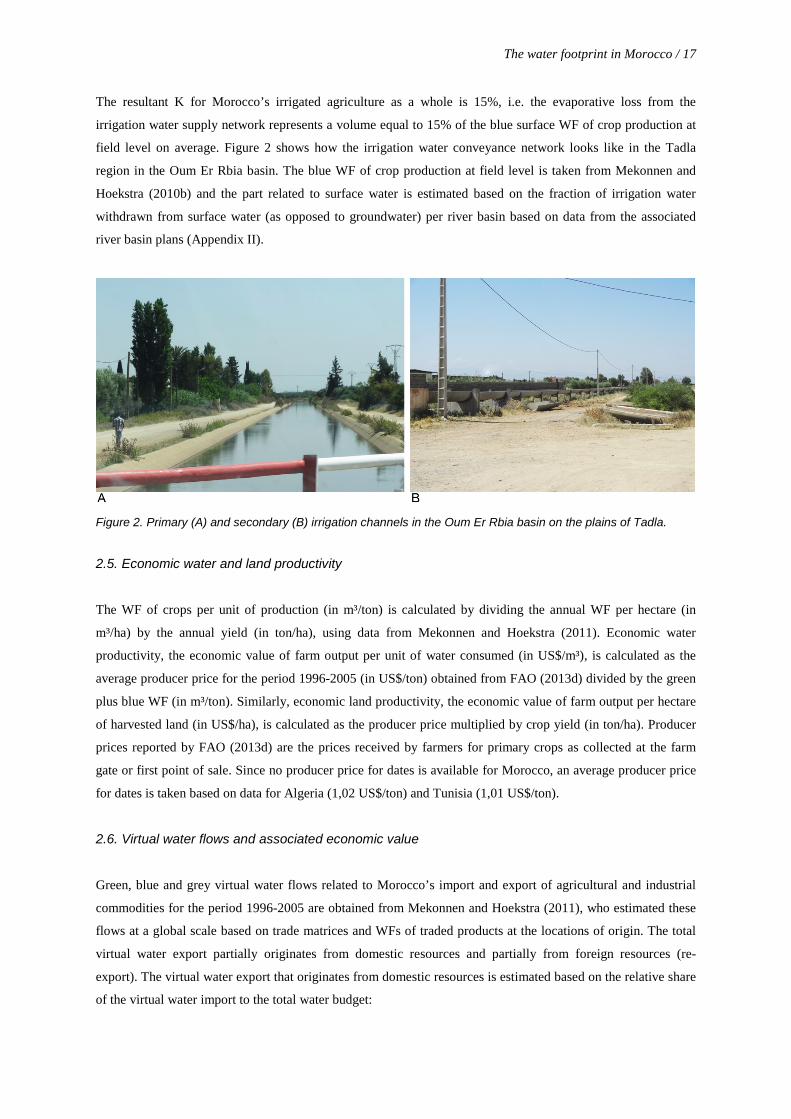
The resultant K for Morocco’s irrigated agriculture as a whole is 15%, i.e. the evaporative loss from the
irrigation water supply network represents a volume equal to 15% of the blue surface WF of crop production at
field level on average. Figure 2 shows how the irrigation water conveyance network looks like in the Tadla
region in the Oum Er Rbia basin. The blue WF of crop production at field level is taken from Mekonnen and
Hoekstra (2010b) and the part related to surface water is estimated based on the fraction of irrigation water
withdrawn from surface water (as opposed to groundwater) per river basin based on data from the associated
river basin plans (Appendix II).
Figure 2. Primary (A) and secondary (B) irrigation channels in the Oum Er Rbia basin on the plains of Tadla.
2.5. Economic water and land productivity
The WF of crops per unit of production (in m³/ton) is calculated by dividing the annual WF per hectare (in
m³/ha) by the annual yield (in ton/ha), using data from Mekonnen and Hoekstra (2011). Economic water
productivity, the economic value of farm output per unit of water consumed (in US$/m³), is calculated as the
average producer price for the period 1996-2005 (in US$/ton) obtained from FAO (2013d) divided by the green
plus blue WF (in m³/ton). Similarly, economic land productivity, the economic value of farm output per hectare
of harvested land (in US$/ha), is calculated as the producer price multiplied by crop yield (in ton/ha). Producer
prices reported by FAO (2013d) are the prices received by farmers for primary crops as collected at the farm
gate or first point of sale. Since no producer price for dates is available for Morocco, an average producer price
for dates is taken based on data for Algeria (1,02 US$/ton) and Tunisia (1,01 US$/ton).
2.6. Virtual water flows and associated economic value
Green, blue and grey virtual water flows related to Morocco’s import and export of agricultural and industrial
commodities for the period 1996-2005 are obtained from Mekonnen and Hoekstra (2011), who estimated these
flows at a global scale based on trade matrices and WFs of traded products at the locations of origin. The total
virtual water export partially originates from domestic resources and partially from foreign resources (re-
export). The virtual water export that originates from domestic resources is estimated based on the relative share
of the virtual water import to the total water budget:
18 / The water footprint in Morocco
VWFVWFV e
nationali
nationalresdome ×
+=..,
in which WFnational is the WF within the nation, Vi the virtual water import and Ve the virtual water export. The
equation is applied separately for agricultural and industrial products. Within the first category the formula is
applied separately for the main export commodities and further per crop category.
The average earning per unit of water exported (in US$/m³) is calculated by dividing the value of export (in
US$/yr) by the virtual water export (in m³/yr). Similarly, the cost per unit of virtual water import is calculated
by dividing the import value (in US$/yr) by the virtual water import (in m³/yr). Both are calculated separately
for crop, animal and industrial products and for specific crop products associated with large virtual water trade
volumes. The average economic values of imports and exports for the period 1996-2005 are derived from the
SITA database from the International Trade Centre (ITC, 2007), which covers trade data from 230 reporting
countries disaggregated by product and partner countries and has also been used by Mekonnen and Hoekstra
(2011) to estimate the international virtual water flows.
2.7. Water footprint in the context of water availability and waste assimilation capacity
To assess the environmental sustainability of the WF within Morocco, the monthly blue WF (the sum of the net
abstractions from surface- and groundwater) in each river basin is compared to the monthly natural runoff
(surface water plus groundwater) in the basin. In addition, in order to specifically evaluate the sustainability of
groundwater consumption, the annual ground-WF (the net abstraction from groundwater) is compared to the
annual groundwater availability. Furthermore, the nitrogen-related grey WF (the water needed to assimilate the
nitrogen fertilizers that reach groundwater due to leaching) is compared with the waste assimilation capacity of
aquifers.
The ground-WF is calculated from the total blue WF of crop production, industrial production and domestic
water supply based on the fraction withdrawn from groundwater per river basin as provided by the river basin
plans (Appendix II). It is assumed that the return flows from the groundwater abstracted for the industrial and
domestic sectors return to the surface water system, not to the groundwater. Thus, while the return flows from
these sectors are not considered as consumptive water use (blue WF) from an overall water resources point of
view, they can be regarded as consumptive use from the groundwater system perspective. Therefore, for the
evaluation of the sustainability of groundwater consumption, the ground-WF of the industrial and domestic
sectors is taken equal to groundwater withdrawals for these sectors.
Monthly historical runoff series (1939-2011) (later referred to as ‘series’) for the basins of Oum Er Rbia,
Bouregreg, Sebou and Loukkos are obtained from Ministry EMWE (2013b). The series represent actual inflow
per sub-catchment as received from the river basin agencies. Only small-scale withdrawals upstream of these
points are subtracted from natural inflow. Large-scale withdrawals for irrigation are not subtracted from the
inflow figures, since these are withdrawn from the reservoirs at the downstream end of the sub-catchments.
The water footprint in Morocco / 19
Natural runoff is therefore considered equal to the actual inflow series, which are also taken as estimate of
surface water availability in the river basin plans. Generally, environmental flow requirements are not
considered in Morocco’s river basin plans and local studies on the minimum flows Moroccan rivers require to
sustain aquatic and riparian ecosystems, and the livelihoods that depend on them, are lacking. Therefore
environmental flow requirements are not subtracted from natural runoff in this study either. Monthly natural
runoff for the four river basins is calculated by summation of the monthly inflows of the sub-catchments.
Subsequently, a long-term average of these monthly inflows is taken for the period 1980-2011. In Morocco, a
significant decrease in water availability is observed since the eighties. However, the chosen period is
considered to represent the current climate and as an appropriate context for the WF estimates over the period
1996-2005.
The long-term average annual runoff in the basins of Bouregreg, Oum Er Rbia and Sebou, derived from the
monthly historical runoff series, does not differ significantly from the figures mentioned in the corresponding
river basin plans (ABH Bouregreg et de la Chaouia, 2012; ABH Oum Er Rbia, 2011; ABH Sebou, 2011). For
the Loukkos basin, however, there is a large discrepancy. ABH Loukkos (2011) estimates the average annual
runoff at 3,600 Mm³/yr for the period 1945-2010, while the series used in this study give an average annual
runoff of 2,113 Mm³/yr for the same period. The series used exclude some small Mediterranean basins in the
east of the action zone of the river basin agency of Loukkos, but their runoff is relatively small (<230 Mm³/yr)
according to ABH Loukkos (2011). The reason of the discrepancy remains unclear. Therefore the blue water
resources in the Loukkos basin might be underestimated. The historical runoff series for the basin of Oum Er
Rbia excludes the runoff in the Atlantic coast basins south of the watershed from the Oum Er Rbia river, but
within the action zone of the river basin agency of Oum Er Rbia, the unit of analysis in this study. In the river
basin plan of this agency, the water availability in these coastal basins is estimated to be 40 Mm³/yr (ABH Oum
Er Rbia, 2011). This volume is added to the long-term average runoff in the Oum Er Rbia basin and distributed
over the months according to the variation of the originally obtained series. Although the long-term average
annual runoff for the basins of Sebou and Bouregreg from the series used in this study does not significantly
differ from the figures mentioned in the corresponding river basin plans, their natural runoff might be slightly
underestimated. The series for Sebou exclude a part of the coastal area (also excluded in surface water
availability assessment in the river basin plan of Sebou (ABH Sebou, 2011)) and the plains of Berrechid and
Chaouia south of Casablanca in the Bouregreg basin are excluded in the series for Bouregreg. Net precipitation
in these areas is thus not accounted for.
Monthly historical runoff series are not available for the river basins of Moulouya, Souss Massa, Sud Atlas and
Tensift. Alternatively, annual natural runoff in the basins is obtained from the corresponding river basin plans
(ABH Moulouya, 2011; ABH Souss Massa Draa, n.d.a; ABH Souss Massa Draa, n.d.b; ABH Tensift, 2011;
Direction de la Region Hydraulique du Guir Rheris Ziz, 2012) and subsequently distributed over the months
according to different sources:
• For Moulouya, annual natural runoff relates to the period 1981-2003 and is distributed according to mean
monthly precipitation over the period 1971-2005 obtained from Tekken and Kropp (2012).
20 / The water footprint in Morocco
• For Sud Atlas, annual natural runoff is calculated as the sum of the annual natural runoff in the basins of
Draa, Guir-Ziz-Rhéris-Maîder and the North-Eastern region Zousfana and relates to different periods, but all
within the time span of 1970-2010. Distribution over the months is according to mean monthly precipitation
over the period 1973/75-1994 in the basins of Ziz-Rhéris obtained from Riad (2003).
• For Tensift, annual natural runoff relates to the period 1980-2010 and is distributed according to the average
monthly natural discharge of the river Tensift and its tributaries within the period 1970-2006 obtained from
JICA, MATEE and ABHT (2007).
• For Souss Massa, annual natural runoff relates to the period 1971-2007 and is distributed according to the
same temporal variation as for the Tensift basin, due to lack of data. The basin of Tensift is considered most
comparable with the basin of Souss Massa, since both are located in the Middle/South of Morocco and their
streams spring from the High (and Anti) Atlas and discharge into the Atlantic Ocean.
Groundwater availability is defined by Hoekstra et al. (2011a) as the rate of groundwater recharge minus the
fraction of natural groundwater outflow required to sustain environmental flow requirements in the river. As
discussed previously, environmental flow requirements are not considered in this study. In this study,
groundwater availability is assessed on river basin scale and defined as the recharge by infiltration of rainwater
and from rivers, minus the direct evaporation from aquifers. Underground connections between aquifers are not
included to avoid double counting. In most of the river basin plans the mentioned fluxes are given per aquifer
and groundwater availability is calculated as defined. For the basins of Draa, Guir-Ziz-Rhéris-Maîder (both part
of Sud Atlas basin in this study) and Souss Massa these fluxes are not available. Instead, for the basin of Souss
Massa, data on aquifer recharge by infiltration of rainwater and streams are obtained from Laouina (2001). For
the Sud Atlas basin, groundwater availability is taken as the sum of available groundwater in the basins Draa
and Guir-Ziz-Rhéris-Maîder and the North-Eastern region Zousfana. For the latter region, above mentioned
fluxes are available and groundwater availability is calculated according to the above definition. The terms used
to indicate the groundwater resources in the river basin plans of Draa and Guir-Ziz-Rhéris-Maîder are taken as
estimate of the groundwater availability in these basins. However, different terms are used and no clear
definition is given. The river basin plan of Draa speaks of exploitable resources (ABH Souss Massa Draa, n.d.a),
whereas the plan for the rivers Guir-Ziz-Rhéris-Maîder speaks of renewable resources (Direction de la Region
Hydraulique du Guir Rheris Ziz, 2012). The latter probably comes close to the definition of groundwater
availability in this study. The exploitable resources can be smaller than the natural water availability due to
political, social, economic or environmental constraints (FAO, 2003). Some aquifers cross the border between
action zones of river basin agencies and are included in both river basin plans. These are the aquifers of Bahira
and Haouz underneath the Tensift and Oum Er Rbia basins and the aquifer of Chaouia côtière underneath the
Bouregreg and Oum Er Rbia basins (Appendix III). Table 3 shows how the groundwater availability in these
aquifers is accounted to the river basin action zones. The estimate of the groundwater availability for these
aquifers is based on data in the river basin plan of the agency that contains the major part of the aquifer.
The water footprint in Morocco / 21
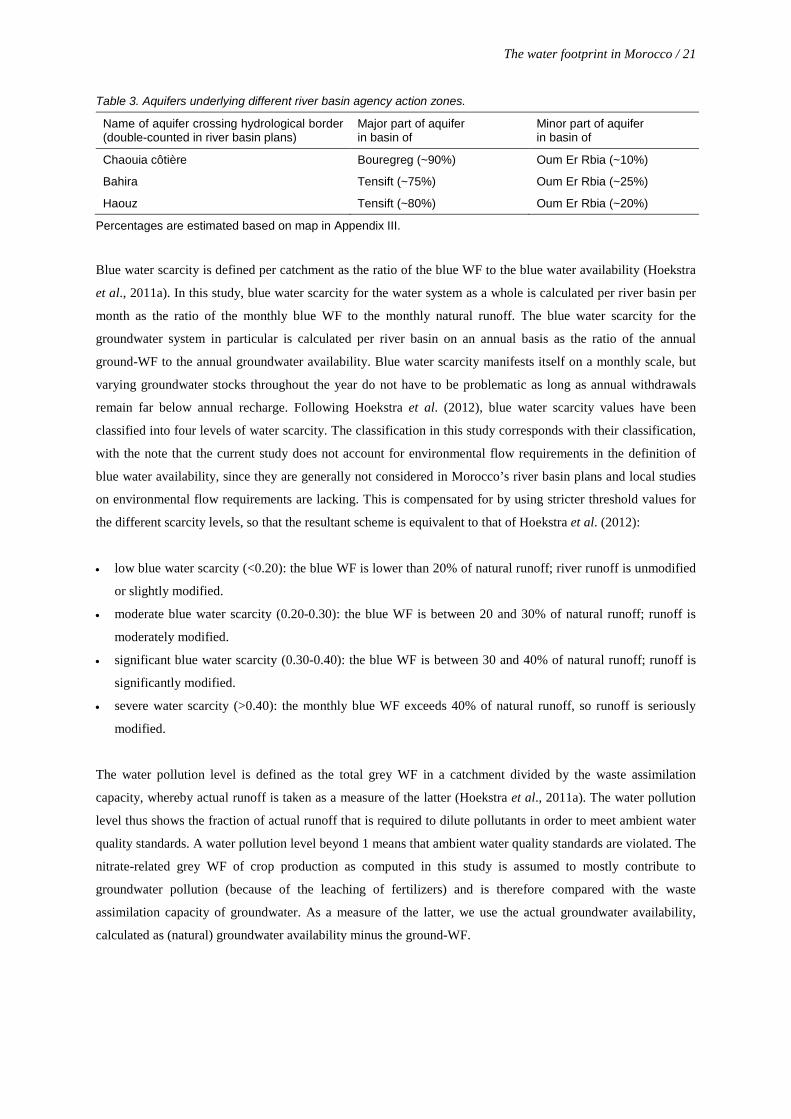
Table 3. Aquifers underlying different river basin agency action zones.
Name of aquifer crossing hydrological border (double-counted in river basin plans)
Major part of aquifer in basin of
Minor part of aquifer in basin of
Chaouia côtière Bouregreg (~90%) Oum Er Rbia (~10%)
Bahira Tensift (~75%) Oum Er Rbia (~25%)
Haouz Tensift (~80%) Oum Er Rbia (~20%)
Percentages are estimated based on map in Appendix III.
Blue water scarcity is defined per catchment as the ratio of the blue WF to the blue water availability (Hoekstra
et al., 2011a). In this study, blue water scarcity for the water system as a whole is calculated per river basin per
month as the ratio of the monthly blue WF to the monthly natural runoff. The blue water scarcity for the
groundwater system in particular is calculated per river basin on an annual basis as the ratio of the annual
ground-WF to the annual groundwater availability. Blue water scarcity manifests itself on a monthly scale, but
varying groundwater stocks throughout the year do not have to be problematic as long as annual withdrawals
remain far below annual recharge. Following Hoekstra et al. (2012), blue water scarcity values have been
classified into four levels of water scarcity. The classification in this study corresponds with their classification,
with the note that the current study does not account for environmental flow requirements in the definition of
blue water availability, since they are generally not considered in Morocco’s river basin plans and local studies
on environmental flow requirements are lacking. This is compensated for by using stricter threshold values for
the different scarcity levels, so that the resultant scheme is equivalent to that of Hoekstra et al. (2012):
• low blue water scarcity (<0.20): the blue WF is lower than 20% of natural runoff; river runoff is unmodified
or slightly modified.
• moderate blue water scarcity (0.20-0.30): the blue WF is between 20 and 30% of natural runoff; runoff is
moderately modified.
• significant blue water scarcity (0.30-0.40): the blue WF is between 30 and 40% of natural runoff; runoff is
significantly modified.
• severe water scarcity (>0.40): the monthly blue WF exceeds 40% of natural runoff, so runoff is seriously
modified.
The water pollution level is defined as the total grey WF in a catchment divided by the waste assimilation
capacity, whereby actual runoff is taken as a measure of the latter (Hoekstra et al., 2011a). The water pollution
level thus shows the fraction of actual runoff that is required to dilute pollutants in order to meet ambient water
quality standards. A water pollution level beyond 1 means that ambient water quality standards are violated. The
nitrate-related grey WF of crop production as computed in this study is assumed to mostly contribute to
groundwater pollution (because of the leaching of fertilizers) and is therefore compared with the waste
assimilation capacity of groundwater. As a measure of the latter, we use the actual groundwater availability,
calculated as (natural) groundwater availability minus the ground-WF.
22 / The water footprint in Morocco
2.8. Partial relocation of crop production and benchmarking water productivities
The potential water savings by changing the pattern of crop production across river basins (which is possible
due to spatial differences in crop water use) are quantified by means of an optimization model. The total green
plus blue WF of twelve main crops in the country (in Mm³/yr) is minimized by changing the spatial pattern of
production (in ton/yr) over the river basins under constraints for production demand (in ton/yr) and land
availability (in ha/yr). The analysed crops are five annual crops (barley, maize, sugar beets, tomatoes and wheat)
and seven perennial crops (almonds, dates, grapes, olives, oranges, sugar cane, mandarins). Results are
compared with a base case, which corresponds with the average green plus blue WF of the analysed crops over
the period 1996-2005. Land availability is restricted per river basin and taken equal to the average harvested
area in the period 1996-2005 obtained from Mekonnen and Hoekstra (2010b). The input data and base case are
recorded in Appendix VIII. Two cases are distinguished: 1) all twelve crops mentioned above can be relocated;
2) only the five annual crops can be relocated. For both cases, the restriction is imposed that the total national
production per crop (in ton/yr) should be equal to (or greater than) the total national production of the crop in
the base case, which is defined as the average production in the period 1996-2005 obtained from Mekonnen and
Hoekstra (2010b).
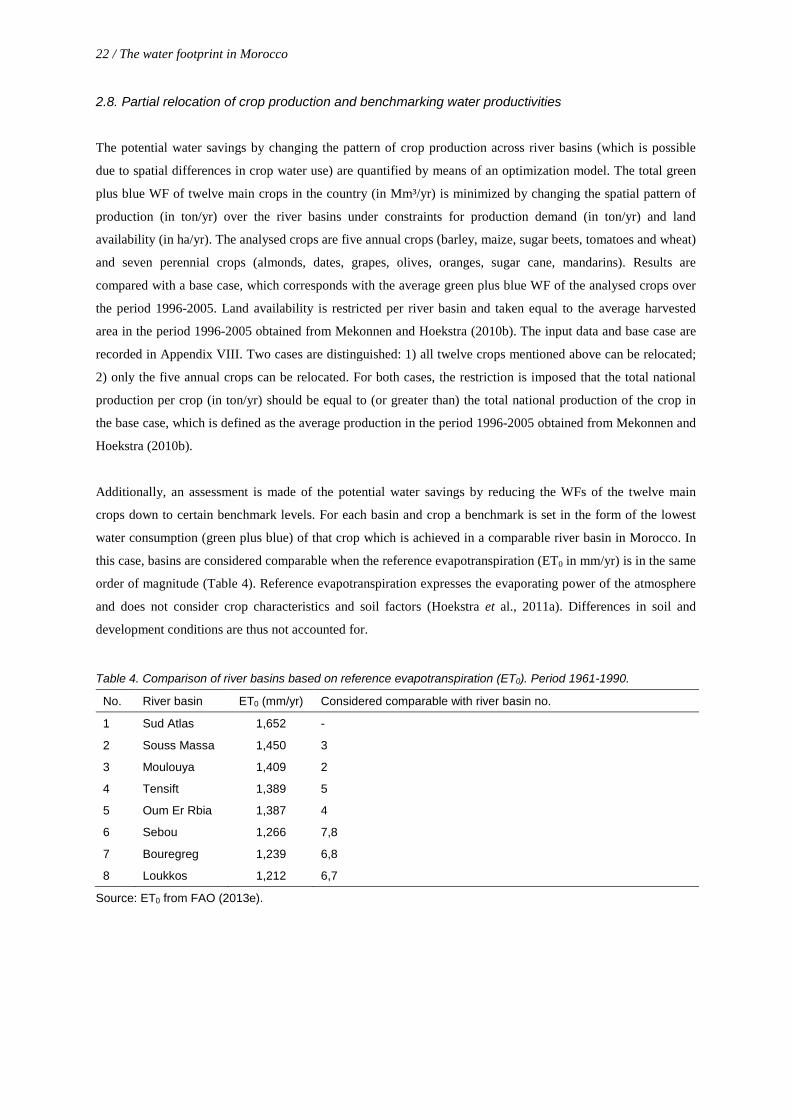
Additionally, an assessment is made of the potential water savings by reducing the WFs of the twelve main
crops down to certain benchmark levels. For each basin and crop a benchmark is set in the form of the lowest
water consumption (green plus blue) of that crop which is achieved in a comparable river basin in Morocco. In
this case, basins are considered comparable when the reference evapotranspiration (ET0 in mm/yr) is in the same
order of magnitude (Table 4). Reference evapotranspiration expresses the evaporating power of the atmosphere
and does not consider crop characteristics and soil factors (Hoekstra et al., 2011a). Differences in soil and
development conditions are thus not accounted for.
Table 4. Comparison of river basins based on reference evapotranspiration (ET0). Period 1961-1990.
No. River basin ET0 (mm/yr) Considered comparable with river basin no.
1 Sud Atlas 1,652 -
2 Souss Massa 1,450 3
3 Moulouya 1,409 2
4 Tensift 1,389 5
5 Oum Er Rbia 1,387 4
6 Sebou 1,266 7,8
7 Bouregreg 1,239 6,8
8 Loukkos 1,212 6,7
Source: ET0 from FAO (2013e).
The water footprint in Morocco / 23
2.9. Evaluating the added value of Water Footprint Assessment for national water policy in Morocco
In order to assess whether WFA provides new insights and response options in addition to the existing water
management plans in Morocco, the results and conclusions from the WFA are compared with the scope of
analysis of and action plans included in Morocco’s national water strategy (Ministry EMWE, 2011) and river
basin plans (ABH Bouregreg et de la Chaouia, 2012; ABH Loukkos, 2011; ABH Moulouya, 2011; ABH Oum
Er Rbia, 2011; ABH Sebou, 2011; ABH Souss Massa Draa, n.d.a; ABH Souss Massa Draa, n.d.b; ABH Tensift,
2011; Direction de la Region Hydraulique du Guir Rheris Ziz, 2012). A summary of the action plans in the
national water strategy is provided in Appendix IX. The action plans in the river basin plans conform to the
national water strategy.

3. Water Footprint Assessment for Morocco
3.1. Water footprint of national production
The total WF within Morocco in the period 1996-2005 was 38.8 Gm³/yr (Table 5). Crop production is the
largest contributor to this total, accounting for 78% of all green water consumed, 83% of all blue water
consumed (evaporative losses in the irrigation water supply network included) and 66% of the total volume of
polluted water. Evaporative losses from storage reservoirs are estimated at 884 Mm³/yr, which is 13% of the
total blue WF within Morocco. For most reservoirs, these losses are ultimately linked to irrigated agriculture and
in some cases potable water supply.
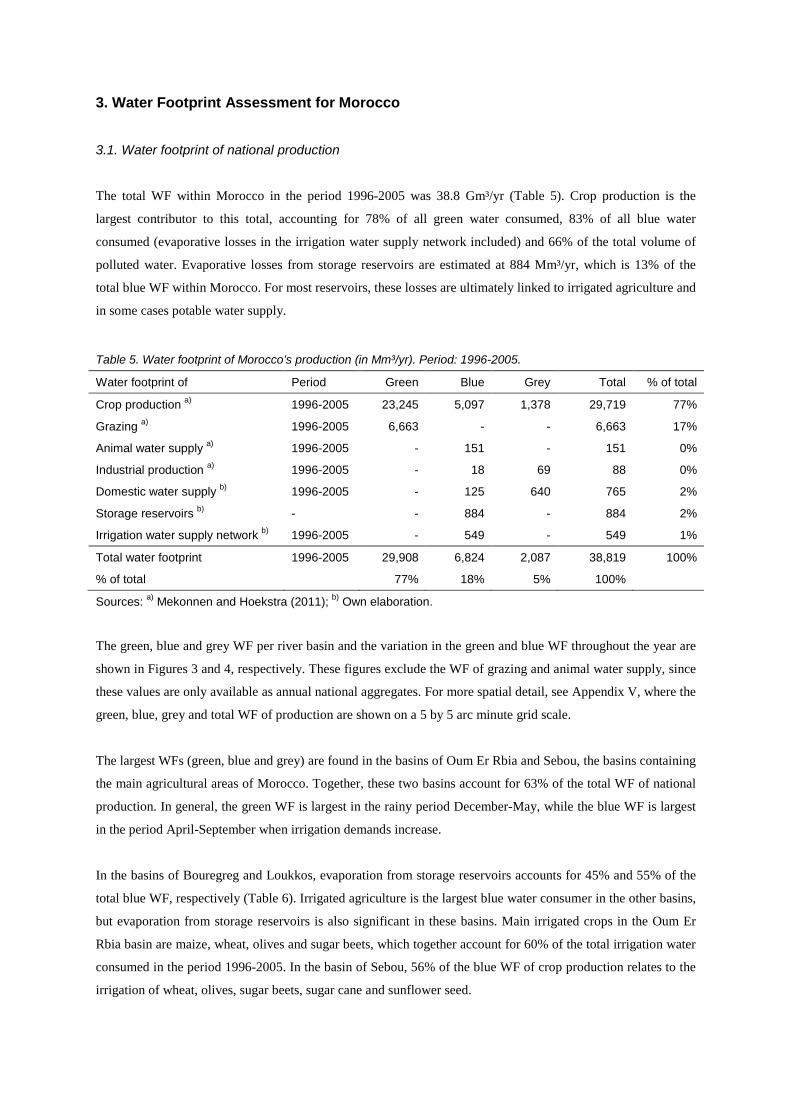
Table 5. Water footprint of Morocco’s production (in Mm³/yr). Period: 1996-2005.
Water footprint of Period Green Blue Grey Total % of total
Crop production a) 1996-2005 23,245 5,097 1,378 29,719 77%
Grazing a) 1996-2005 6,663 - - 6,663 17%
Animal water supply a) 1996-2005 - 151 - 151 0%
Industrial production a) 1996-2005 - 18 69 88 0%
Domestic water supply b) 1996-2005 - 125 640 765 2%
Storage reservoirs b) - - 884 - 884 2%
Irrigation water supply network b) 1996-2005 - 549 - 549 1%
Total water footprint 1996-2005 29,908 6,824 2,087 38,819 100%
% of total 77% 18% 5% 100%
Sources: a) Mekonnen and Hoekstra (2011); b) Own elaboration.
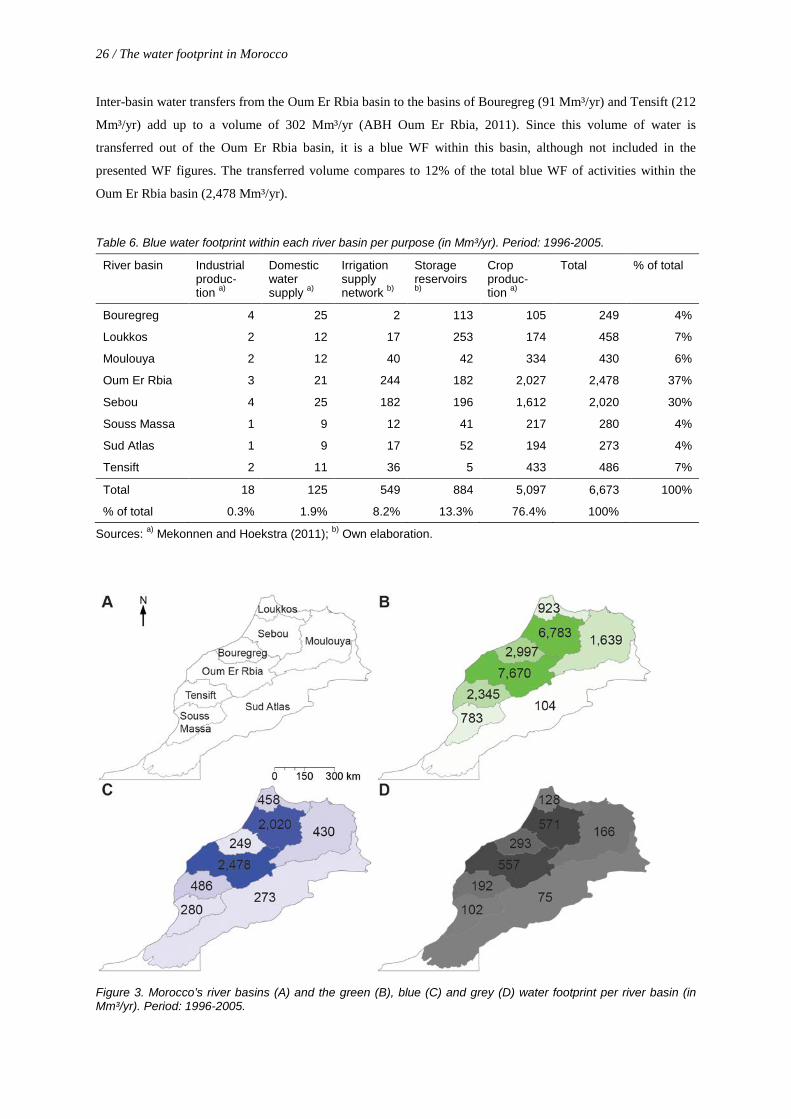
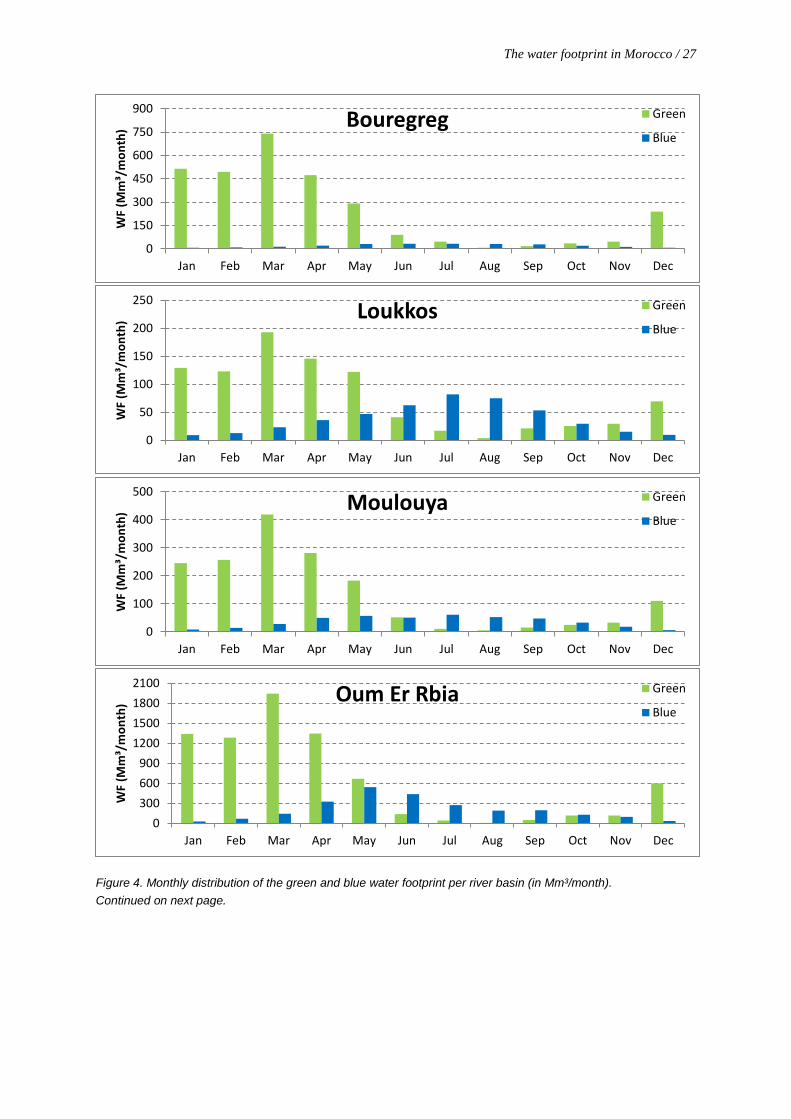
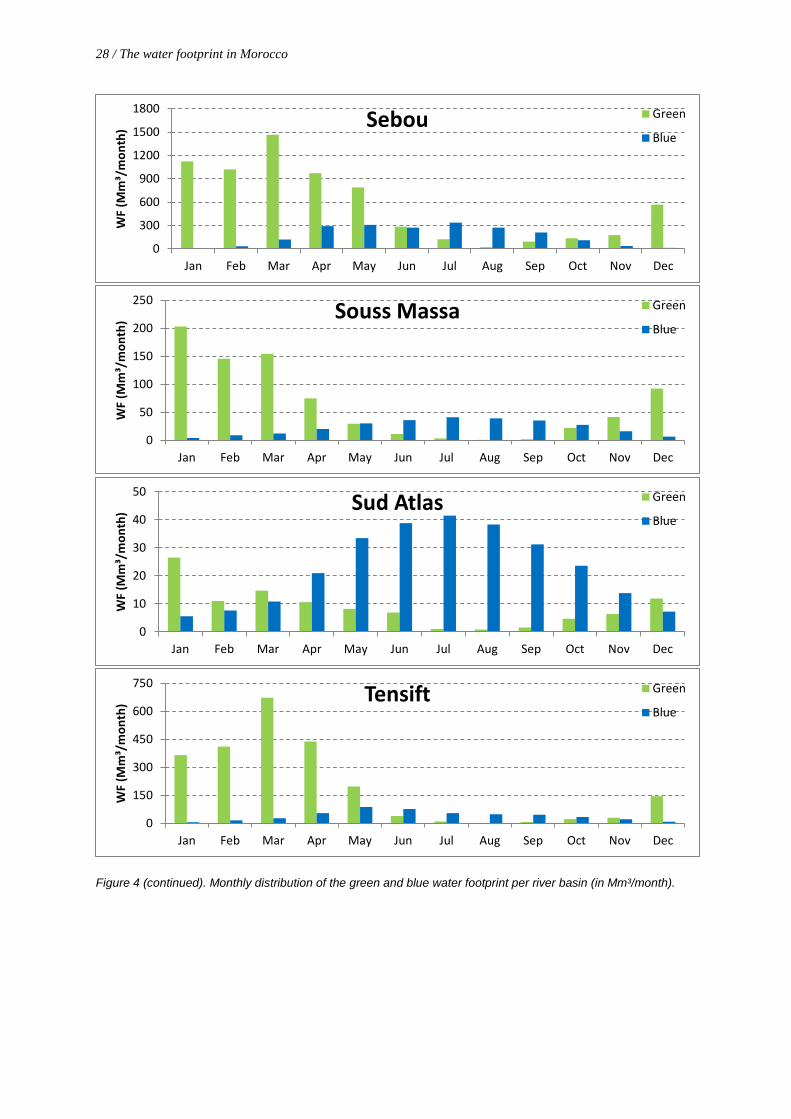
The green, blue and grey WF per river basin and the variation in the green and blue WF throughout the year are
shown in Figures 3 and 4, respectively. These figures exclude the WF of grazing and animal water supply, since
these values are only available as annual national aggregates. For more spatial detail, see Appendix V, where the
green, blue, grey and total WF of production are shown on a 5 by 5 arc minute grid scale.
The largest WFs (green, blue and grey) are found in the basins of Oum Er Rbia and Sebou, the basins containing
the main agricultural areas of Morocco. Together, these two basins account for 63% of the total WF of national
production. In general, the green WF is largest in the rainy period December-May, while the blue WF is largest
in the period April-September when irrigation demands increase.
In the basins of Bouregreg and Loukkos, evaporation from storage reservoirs accounts for 45% and 55% of the
total blue WF, respectively (Table 6). Irrigated agriculture is the largest blue water consumer in the other basins,
but evaporation from storage reservoirs is also significant in these basins. Main irrigated crops in the Oum Er
Rbia basin are maize, wheat, olives and sugar beets, which together account for 60% of the total irrigation water
consumed in the period 1996-2005. In the basin of Sebou, 56% of the blue WF of crop production relates to the
irrigation of wheat, olives, sugar beets, sugar cane and sunflower seed.
26 / The water footprint in Morocco
Inter-basin water transfers from the Oum Er Rbia basin to the basins of Bouregreg (91 Mm³/yr) and Tensift (212
Mm³/yr) add up to a volume of 302 Mm³/yr (ABH Oum Er Rbia, 2011). Since this volume of water is
transferred out of the Oum Er Rbia basin, it is a blue WF within this basin, although not included in the
presented WF figures. The transferred volume compares to 12% of the total blue WF of activities within the
Oum Er Rbia basin (2,478 Mm³/yr).
Table 6. Blue water footprint within each river basin per purpose (in Mm³/yr). Period: 1996-2005.
River basin Industrial produc-tion a)
Domestic water supply a)
Irrigation supply network b)
Storage reservoirs b)
Crop produc-tion a)
Total % of total
Bouregreg 4 25 2 113 105 249 4%
Loukkos 2 12 17 253 174 458 7%
Moulouya 2 12 40 42 334 430 6%
Oum Er Rbia 3 21 244 182 2,027 2,478 37%
Sebou 4 25 182 196 1,612 2,020 30%
Souss Massa 1 9 12 41 217 280 4%
Sud Atlas 1 9 17 52 194 273 4%
Tensift 2 11 36 5 433 486 7%
Total 18 125 549 884 5,097 6,673 100%
% of total 0.3% 1.9% 8.2% 13.3% 76.4% 100%
Sources: a) Mekonnen and Hoekstra (2011); b) Own elaboration.
Figure 3. Morocco’s river basins (A) and the green (B), blue (C) and grey (D) water footprint per river basin (in Mm³/yr). Period: 1996-2005.
The water footprint in Morocco / 27
Figure 4. Monthly distribution of the green and blue water footprint per river basin (in Mm³/month). Continued on next page.
0
150
300
450
600
750
900
Jan Feb Mar Apr May Jun Jul Aug Sep Oct Nov Dec
WF
(Mm
³/m
onth
) Bouregreg Green
Blue
0
50
100
150
200
250
Jan Feb Mar Apr May Jun Jul Aug Sep Oct Nov Dec
WF
(Mm
³/m
onth
) Loukkos Green
Blue
0
100
200
300
400
500
Jan Feb Mar Apr May Jun Jul Aug Sep Oct Nov Dec
WF
(Mm
³/m
onth
) Moulouya Green
Blue
0300600900
1200150018002100
Jan Feb Mar Apr May Jun Jul Aug Sep Oct Nov Dec
WF
(Mm
³/m
onth
) Oum Er Rbia Green
Blue
28 / The water footprint in Morocco
Figure 4 (continued). Monthly distribution of the green and blue water footprint per river basin (in Mm³/month).
0
300
600
900
1200
1500
1800
Jan Feb Mar Apr May Jun Jul Aug Sep Oct Nov Dec
WF
(Mm
³/m
onth
) Sebou Green
Blue
0
50
100
150
200
250
Jan Feb Mar Apr May Jun Jul Aug Sep Oct Nov Dec
WF
(Mm
³/m
onth
) Souss Massa Green
Blue
0
10
20
30
40
50
Jan Feb Mar Apr May Jun Jul Aug Sep Oct Nov Dec
WF
(Mm
³/m
onth
) Sud Atlas Green
Blue
0
150
300
450
600
750
Jan Feb Mar Apr May Jun Jul Aug Sep Oct Nov Dec
WF
(Mm
³/m
onth
) Tensift Green
Blue
The water footprint in Morocco / 29
3.2. Water footprint of main crops
The WF of crop production in the period 1996-2005 was 29,719 Mm³/yr, of which 95% was consumed by crops
(green and blue WF) and 5% was needed to assimilate the nitrogen fertilizers that reach the water systems due to
leaching or runoff (grey WF). The WF per ton of production and its variation over the river basins is analysed
for the top-ten of water consuming crops in the period 1996-2005 and for three additional crops / crop categories
that play an important role in the Moroccan agricultural sector: sugar cane, tomatoes and the category of
tangerines, mandarins, clementines and satsumas. The category of tangerines etc. and tomatoes are principal
export products and sugar cane production forms a significant, well-organised sector (Ministry of Agriculture
and Fisheries of Morocco, 2010).
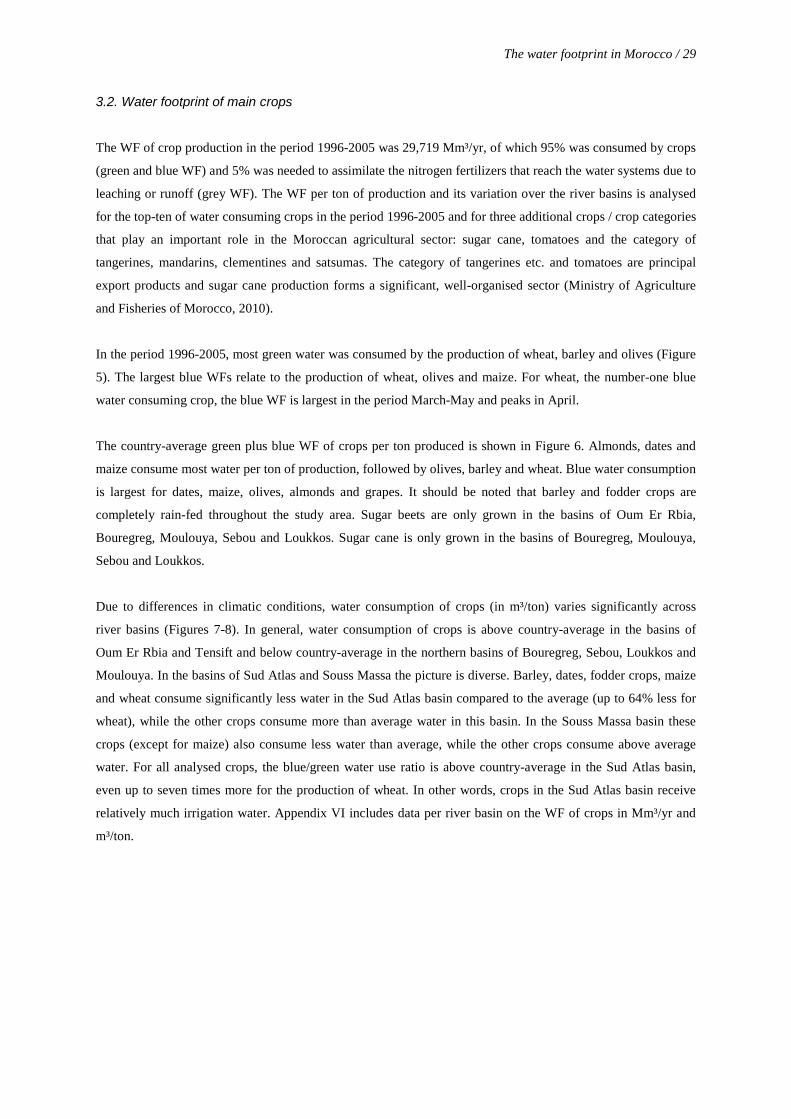
In the period 1996-2005, most green water was consumed by the production of wheat, barley and olives (Figure
5). The largest blue WFs relate to the production of wheat, olives and maize. For wheat, the number-one blue
water consuming crop, the blue WF is largest in the period March-May and peaks in April.
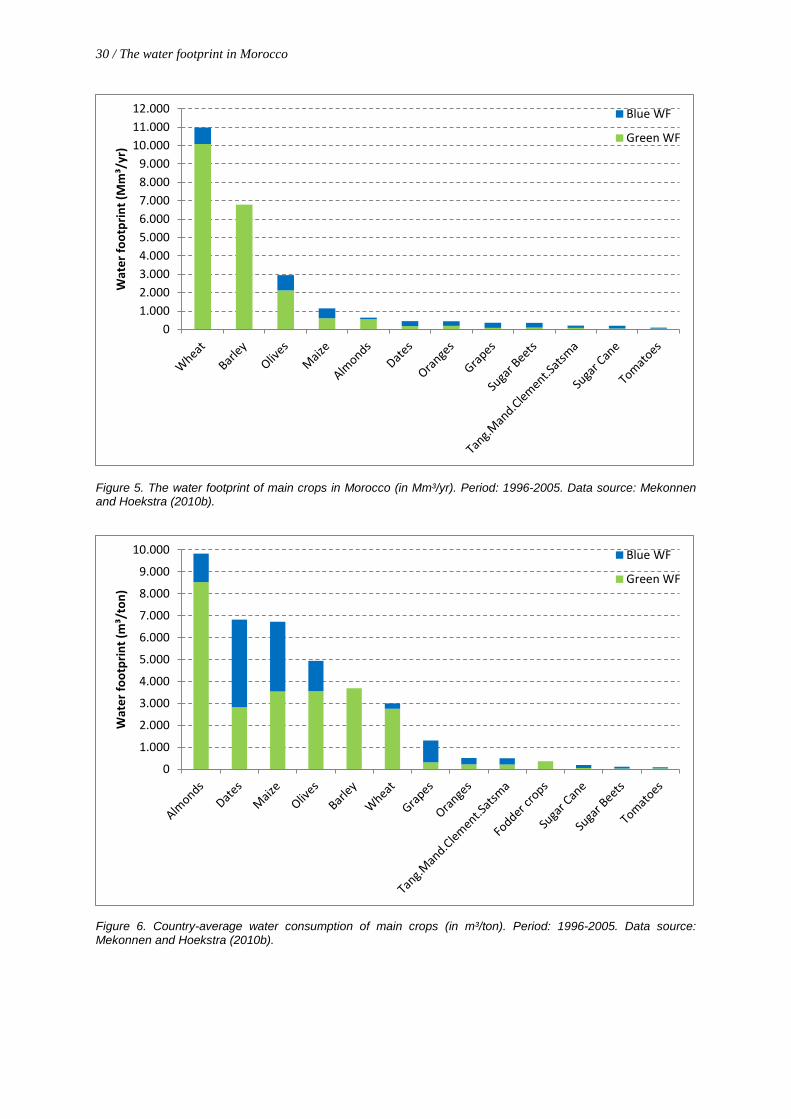
The country-average green plus blue WF of crops per ton produced is shown in Figure 6. Almonds, dates and
maize consume most water per ton of production, followed by olives, barley and wheat. Blue water consumption
is largest for dates, maize, olives, almonds and grapes. It should be noted that barley and fodder crops are
completely rain-fed throughout the study area. Sugar beets are only grown in the basins of Oum Er Rbia,
Bouregreg, Moulouya, Sebou and Loukkos. Sugar cane is only grown in the basins of Bouregreg, Moulouya,
Sebou and Loukkos.
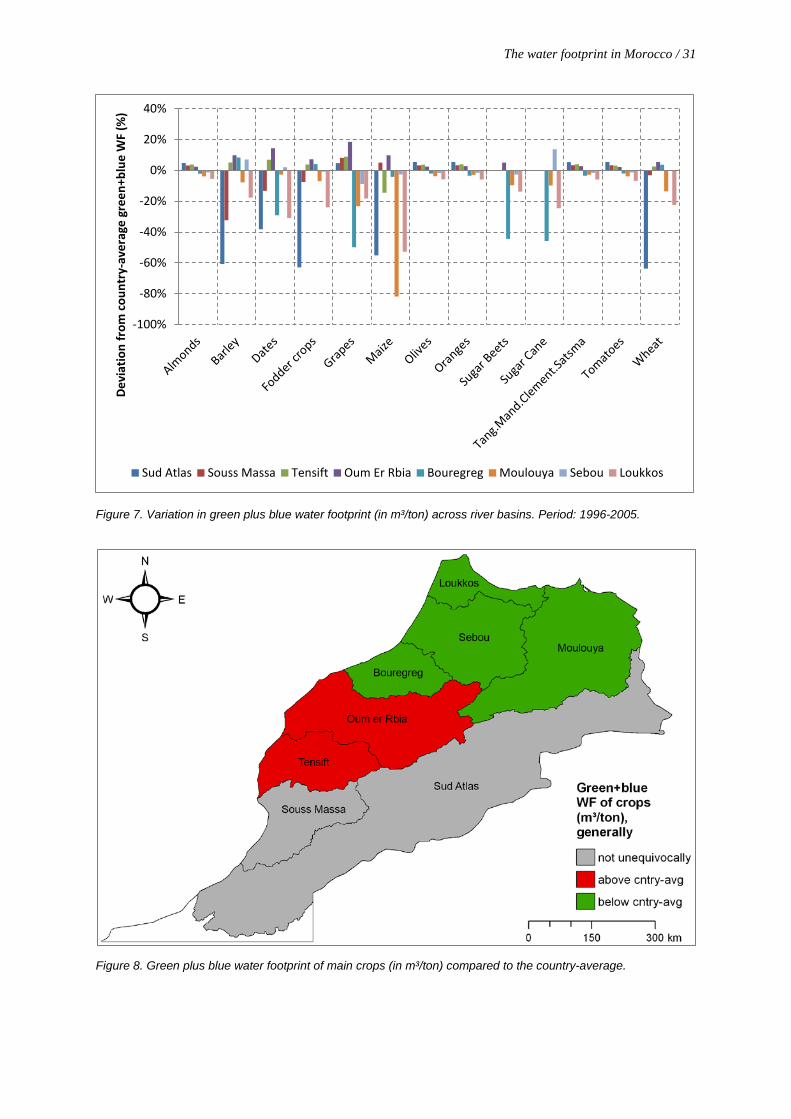
Due to differences in climatic conditions, water consumption of crops (in m³/ton) varies significantly across
river basins (Figures 7-8). In general, water consumption of crops is above country-average in the basins of
Oum Er Rbia and Tensift and below country-average in the northern basins of Bouregreg, Sebou, Loukkos and
Moulouya. In the basins of Sud Atlas and Souss Massa the picture is diverse. Barley, dates, fodder crops, maize
and wheat consume significantly less water in the Sud Atlas basin compared to the average (up to 64% less for
wheat), while the other crops consume more than average water in this basin. In the Souss Massa basin these
crops (except for maize) also consume less water than average, while the other crops consume above average
water. For all analysed crops, the blue/green water use ratio is above country-average in the Sud Atlas basin,
even up to seven times more for the production of wheat. In other words, crops in the Sud Atlas basin receive
relatively much irrigation water. Appendix VI includes data per river basin on the WF of crops in Mm³/yr and
m³/ton.
30 / The water footprint in Morocco
Figure 5. The water footprint of main crops in Morocco (in Mm³/yr). Period: 1996-2005. Data source: Mekonnen and Hoekstra (2010b).
Figure 6. Country-average water consumption of main crops (in m³/ton). Period: 1996-2005. Data source: Mekonnen and Hoekstra (2010b).
01.0002.0003.0004.0005.0006.0007.0008.0009.000
10.00011.00012.000
Wat
er fo
otpr
int (
Mm
³/yr
) Blue WF
Green WF
0
1.000
2.000
3.000
4.000
5.000
6.000
7.000
8.000
9.000
10.000
Wat
er fo
otpr
int (
m³/
ton)
Blue WF
Green WF
The water footprint in Morocco / 31
Figure 7. Variation in green plus blue water footprint (in m³/ton) across river basins. Period: 1996-2005.
Figure 8. Green plus blue water footprint of main crops (in m³/ton) compared to the country-average.
-100%
-80%
-60%
-40%
-20%
0%
20%
40%De
viat
ion
from
cou
ntry
-ave
rage
gre
en+b
lue
WF
(%)
Sud Atlas Souss Massa Tensift Oum Er Rbia Bouregreg Moulouya Sebou Loukkos
32 / The water footprint in Morocco
3.3. Economic water and land productivity of main crops
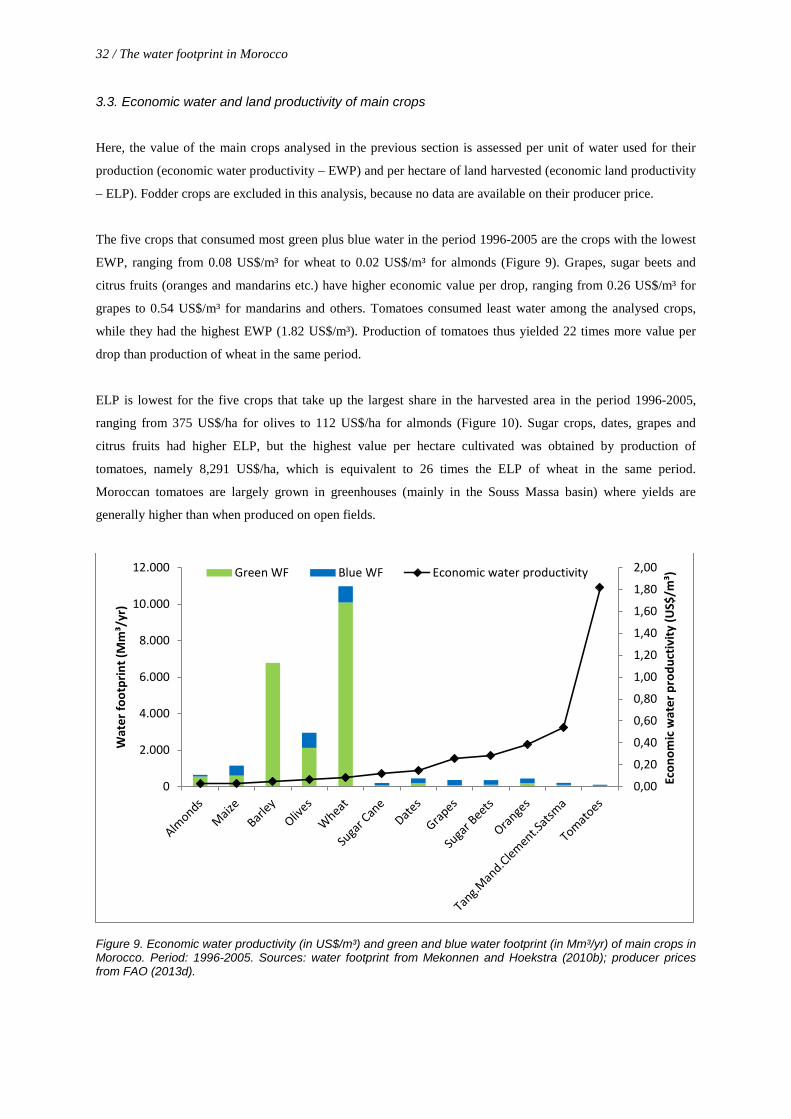
Here, the value of the main crops analysed in the previous section is assessed per unit of water used for their
production (economic water productivity – EWP) and per hectare of land harvested (economic land productivity
– ELP). Fodder crops are excluded in this analysis, because no data are available on their producer price.
The five crops that consumed most green plus blue water in the period 1996-2005 are the crops with the lowest
EWP, ranging from 0.08 US$/m³ for wheat to 0.02 US$/m³ for almonds (Figure 9). Grapes, sugar beets and
citrus fruits (oranges and mandarins etc.) have higher economic value per drop, ranging from 0.26 US$/m³ for
grapes to 0.54 US$/m³ for mandarins and others. Tomatoes consumed least water among the analysed crops,
while they had the highest EWP (1.82 US$/m³). Production of tomatoes thus yielded 22 times more value per
drop than production of wheat in the same period.
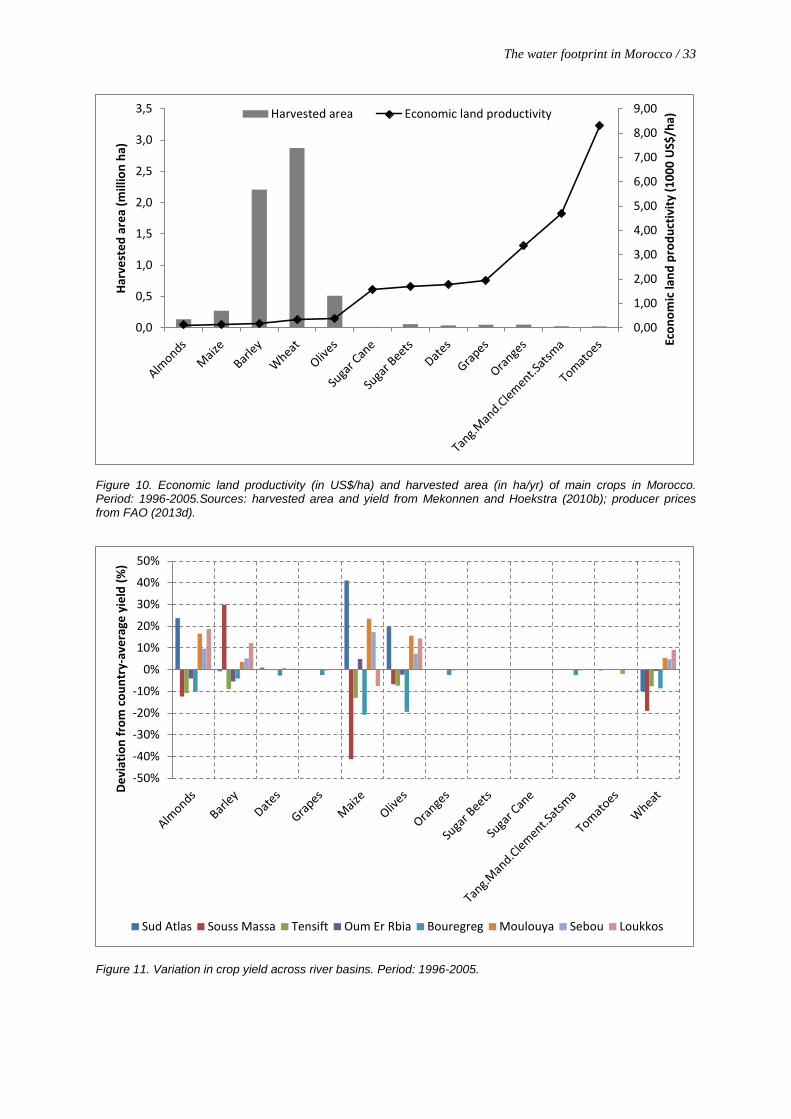
ELP is lowest for the five crops that take up the largest share in the harvested area in the period 1996-2005,
ranging from 375 US$/ha for olives to 112 US$/ha for almonds (Figure 10). Sugar crops, dates, grapes and
citrus fruits had higher ELP, but the highest value per hectare cultivated was obtained by production of
tomatoes, namely 8,291 US$/ha, which is equivalent to 26 times the ELP of wheat in the same period.
Moroccan tomatoes are largely grown in greenhouses (mainly in the Souss Massa basin) where yields are
generally higher than when produced on open fields.
Figure 9. Economic water productivity (in US$/m³) and green and blue water footprint (in Mm³/yr) of main crops in Morocco. Period: 1996-2005. Sources: water footprint from Mekonnen and Hoekstra (2010b); producer prices from FAO (2013d).
0,00
0,20
0,40
0,60
0,80
1,00
1,20
1,40
1,60
1,80
2,00
0
2.000
4.000
6.000
8.000
10.000
12.000
Econ
omic
wat
er p
rodu
ctiv
ity (U
S$/m
³)
Wat
er fo
otpr
int (
Mm
³/yr
)
Green WF Blue WF Economic water productivity
The water footprint in Morocco / 33
Figure 10. Economic land productivity (in US$/ha) and harvested area (in ha/yr) of main crops in Morocco. Period: 1996-2005.Sources: harvested area and yield from Mekonnen and Hoekstra (2010b); producer prices from FAO (2013d).
Figure 11. Variation in crop yield across river basins. Period: 1996-2005.
0,00
1,00
2,00
3,00
4,00
5,00
6,00
7,00
8,00
9,00
0,0
0,5
1,0
1,5
2,0
2,5
3,0
3,5
Econ
omic
land
pro
duct
ivity
(100
0 U
S$/h
a)
Harv
este
d ar
ea (m
illio
n ha
) Harvested area Economic land productivity
-50%
-40%
-30%
-20%
-10%
0%
10%
20%
30%
40%
50%
Devi
atio
n fr
om c
ount
ry-a
vera
ge y
ield
(%)
Sud Atlas Souss Massa Tensift Oum Er Rbia Bouregreg Moulouya Sebou Loukkos
34 / The water footprint in Morocco
EWP of crops varies across the basins according to their water consumption (m³/ton) as discussed in section 3.2,
being large in basins where water consumption is small and vice versa. ELP of crops varies across the basins
analogue to differences in yield. Significant differences in crop yields across the basins are observed for
almonds, barley, maize, olives and wheat (Figure 11). In general, yields (and thus ELPs) of these crops are
above country average in the basins of Moulouya, Sebou and Loukkos and below country-average in the
southern basins. However, this general picture is not unequivocally, in particular for the basins Sud Atlas and
Souss Massa.
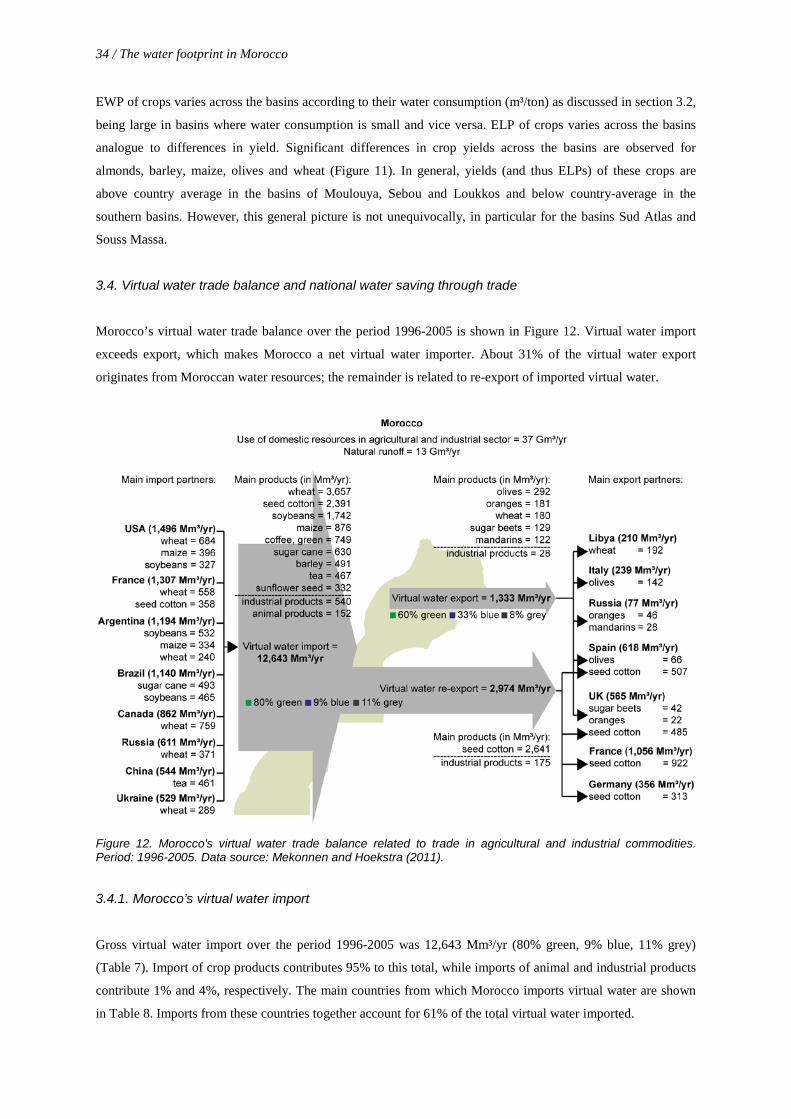
3.4. Virtual water trade balance and national water saving through trade
Morocco’s virtual water trade balance over the period 1996-2005 is shown in Figure 12. Virtual water import
exceeds export, which makes Morocco a net virtual water importer. About 31% of the virtual water export
originates from Moroccan water resources; the remainder is related to re-export of imported virtual water.
Figure 12. Morocco's virtual water trade balance related to trade in agricultural and industrial commodities. Period: 1996-2005. Data source: Mekonnen and Hoekstra (2011).
3.4.1. Morocco’s virtual water import
Gross virtual water import over the period 1996-2005 was 12,643 Mm³/yr (80% green, 9% blue, 11% grey)
(Table 7). Import of crop products contributes 95% to this total, while imports of animal and industrial products
contribute 1% and 4%, respectively. The main countries from which Morocco imports virtual water are shown
in Table 8. Imports from these countries together account for 61% of the total virtual water imported.
The water footprint in Morocco / 35
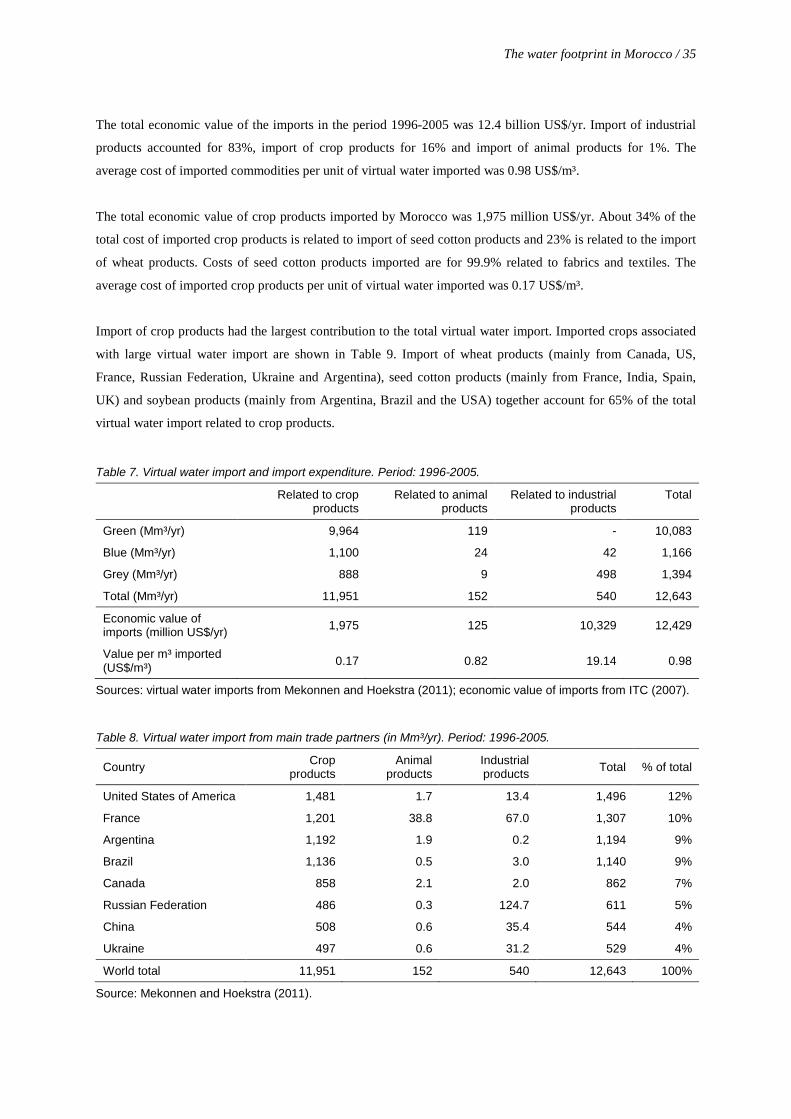
The total economic value of the imports in the period 1996-2005 was 12.4 billion US$/yr. Import of industrial
products accounted for 83%, import of crop products for 16% and import of animal products for 1%. The
average cost of imported commodities per unit of virtual water imported was 0.98 US$/m³.
The total economic value of crop products imported by Morocco was 1,975 million US$/yr. About 34% of the
total cost of imported crop products is related to import of seed cotton products and 23% is related to the import
of wheat products. Costs of seed cotton products imported are for 99.9% related to fabrics and textiles. The
average cost of imported crop products per unit of virtual water imported was 0.17 US$/m³.
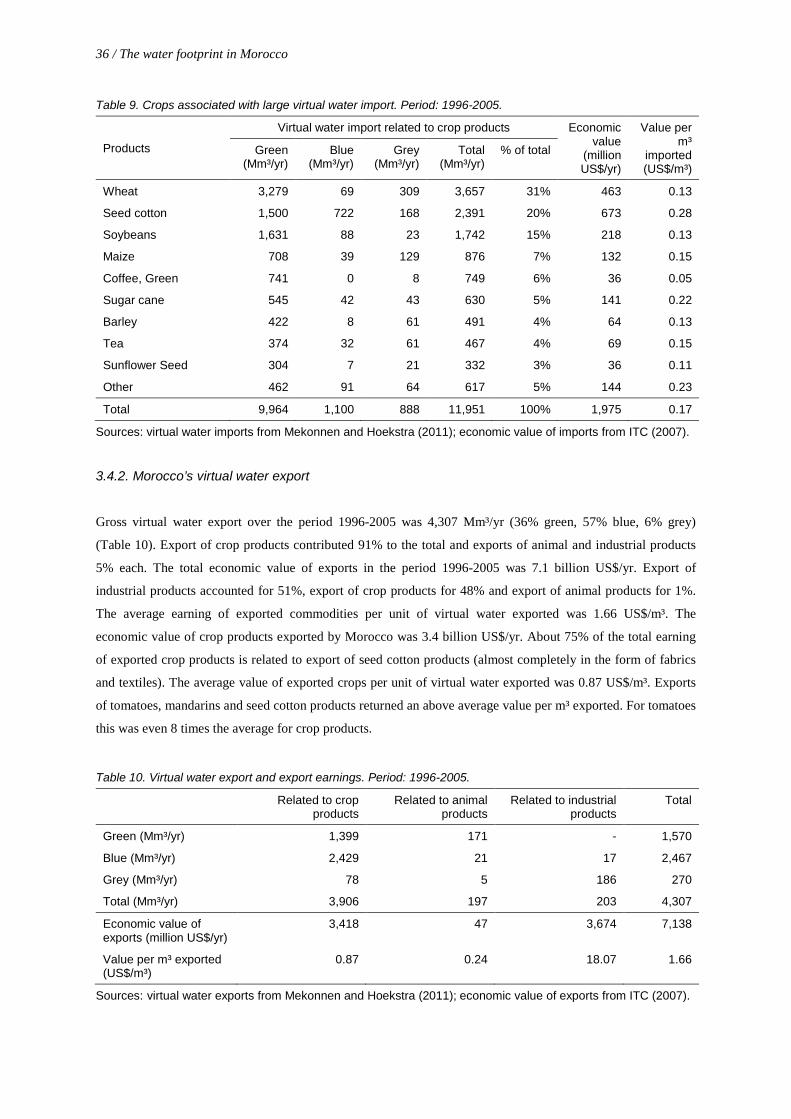
Import of crop products had the largest contribution to the total virtual water import. Imported crops associated
with large virtual water import are shown in Table 9. Import of wheat products (mainly from Canada, US,
France, Russian Federation, Ukraine and Argentina), seed cotton products (mainly from France, India, Spain,
UK) and soybean products (mainly from Argentina, Brazil and the USA) together account for 65% of the total
virtual water import related to crop products.
Table 7. Virtual water import and import expenditure. Period: 1996-2005.
Related to crop products
Related to animal products
Related to industrial products
Total
Green (Mm³/yr) 9,964 119 - 10,083
Blue (Mm³/yr) 1,100 24 42 1,166
Grey (Mm³/yr) 888 9 498 1,394
Total (Mm³/yr) 11,951 152 540 12,643
Economic value of imports (million US$/yr) 1,975 125 10,329 12,429
Value per m³ imported (US$/m³) 0.17 0.82 19.14 0.98
Sources: virtual water imports from Mekonnen and Hoekstra (2011); economic value of imports from ITC (2007).
Table 8. Virtual water import from main trade partners (in Mm³/yr). Period: 1996-2005.
Country Crop products
Animal products
Industrial products Total % of total
United States of America 1,481 1.7 13.4 1,496 12%
France 1,201 38.8 67.0 1,307 10%
Argentina 1,192 1.9 0.2 1,194 9%
Brazil 1,136 0.5 3.0 1,140 9%
Canada 858 2.1 2.0 862 7%
Russian Federation 486 0.3 124.7 611 5%
China 508 0.6 35.4 544 4%
Ukraine 497 0.6 31.2 529 4%
World total 11,951 152 540 12,643 100%
Source: Mekonnen and Hoekstra (2011).
36 / The water footprint in Morocco
Table 9. Crops associated with large virtual water import. Period: 1996-2005.
Products
Virtual water import related to crop products Economic value
(million US$/yr)
Value per m³
imported (US$/m³)
Green (Mm³/yr)
Blue (Mm³/yr)
Grey (Mm³/yr)
Total (Mm³/yr)
% of total
Wheat 3,279 69 309 3,657 31% 463 0.13
Seed cotton 1,500 722 168 2,391 20% 673 0.28
Soybeans 1,631 88 23 1,742 15% 218 0.13
Maize 708 39 129 876 7% 132 0.15
Coffee, Green 741 0 8 749 6% 36 0.05
Sugar cane 545 42 43 630 5% 141 0.22
Barley 422 8 61 491 4% 64 0.13
Tea 374 32 61 467 4% 69 0.15
Sunflower Seed 304 7 21 332 3% 36 0.11
Other 462 91 64 617 5% 144 0.23
Total 9,964 1,100 888 11,951 100% 1,975 0.17
Sources: virtual water imports from Mekonnen and Hoekstra (2011); economic value of imports from ITC (2007).
3.4.2. Morocco’s virtual water export
Gross virtual water export over the period 1996-2005 was 4,307 Mm³/yr (36% green, 57% blue, 6% grey)
(Table 10). Export of crop products contributed 91% to the total and exports of animal and industrial products
5% each. The total economic value of exports in the period 1996-2005 was 7.1 billion US$/yr. Export of
industrial products accounted for 51%, export of crop products for 48% and export of animal products for 1%.
The average earning of exported commodities per unit of virtual water exported was 1.66 US$/m³. The
economic value of crop products exported by Morocco was 3.4 billion US$/yr. About 75% of the total earning
of exported crop products is related to export of seed cotton products (almost completely in the form of fabrics
and textiles). The average value of exported crops per unit of virtual water exported was 0.87 US$/m³. Exports
of tomatoes, mandarins and seed cotton products returned an above average value per m³ exported. For tomatoes
this was even 8 times the average for crop products.
Table 10. Virtual water export and export earnings. Period: 1996-2005.
Related to crop products
Related to animal products
Related to industrial products
Total
Green (Mm³/yr) 1,399 171 - 1,570
Blue (Mm³/yr) 2,429 21 17 2,467
Grey (Mm³/yr) 78 5 186 270
Total (Mm³/yr) 3,906 197 203 4,307
Economic value of exports (million US$/yr)
3,418 47 3,674 7,138
Value per m³ exported (US$/m³)
0.87 0.24 18.07 1.66
Sources: virtual water exports from Mekonnen and Hoekstra (2011); economic value of exports from ITC (2007).

The water footprint in Morocco / 37
The countries shown in Table 11 together receive 81% of Morocco’s total virtual water export. Table 12 shows
the crop products associated with large virtual water export. Export of seed cotton products (mainly to France,
Spain, UK and Germany) accounts for 68% of the total virtual water export related to crop products.
Table 11. Virtual water export to main trade partners (in Mm³/yr). Period: 1996-2005.
Country Crop products
Animal products
Industrial products Total % of total
France 1,056 2.2 61.8 1,120 26%
Spain 618 7.6 26.4 651 15%
United Kingdom 565 0.0 17.3 582 14%
Germany 356 0.1 12.0 368 9%
Italy 239 8.8 9.9 258 6%
Libyan Arab Jamahiriya 210 25.8 1.5 237 6%
United States of America 144 0.0 9.6 153 4%
Belgium 127 0.1 7.3 134 3%
World total 3,906 197 203 4,307 100%
Source: Mekonnen and Hoekstra (2011).
Table 12. Crops associated with large virtual water export. Period: 1996-2005.
Products
Virtual water export related to crop products Economic value
(million US$/yr)
Value per m³
exported (US$/m³)
Green (Mm³/yr)
Blue (Mm³/yr)
Grey (Mm³/yr)
Total (Mm³/yr)
% of total
Seed cotton 652 1,992 0 2,645 68% 2,559 0.97
Olives 214 83 3 299 8% 31 0.10
Wheat 211 19 8 238 6% 4 0.02
Oranges 73 97 11 181 5% 152 0.84
Sugar beets 31 79 19 129 3% 5 0.04
Tang., mand. etc. 49 65 8 122 3% 168 1.37
Maize 12 11 1 12 1% 0 0.02
Tomatoes 10 11 3 10 1% 169 7.13
Other 147 71 26 244 6% 330 1.35
Total 1,399 2,429 78 3,906 100% 3,418 0.87
Sources: virtual water exports from Mekonnen and Hoekstra (2011); economic value of exports from ITC (2007).
Part of the total virtual water export is from Moroccan water resources, another part is re-exported from foreign
resources (Table 13). The total volume of Moroccan water virtually exported out of the country is estimated at
1,333 Mm³/yr, which means that about 4% of the water used in the Moroccan agricultural and industrial sectors
is used for making export products. The remainder is used to produce products that are consumed by the
inhabitants of Morocco. Virtual export of blue water from Moroccan resources was 435 Mm³/yr, which is
equivalent to 3.4% of Morocco’s long-term average natural runoff (section 3.6). Specific crop products
associated with large virtual water export from Moroccan origin are olives, oranges, wheat, sugar beets and
mandarins. Only export of the latter returned a value larger than the average for crop products.
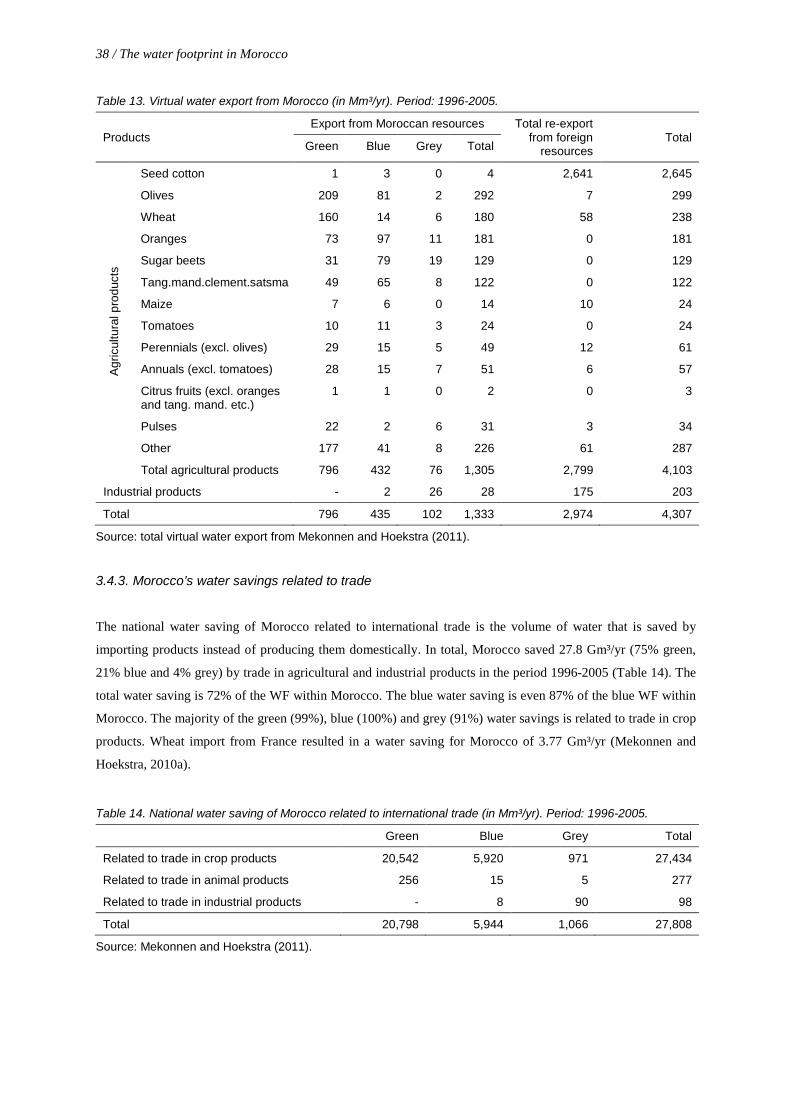
38 / The water footprint in Morocco
Table 13. Virtual water export from Morocco (in Mm³/yr). Period: 1996-2005.
Products Export from Moroccan resources Total re-export
from foreign resources
Total Green Blue Grey Total
Agr
icul
tura
l pro
duct
s
Seed cotton 1 3 0 4 2,641 2,645
Olives 209 81 2 292 7 299
Wheat 160 14 6 180 58 238
Oranges 73 97 11 181 0 181
Sugar beets 31 79 19 129 0 129
Tang.mand.clement.satsma 49 65 8 122 0 122
Maize 7 6 0 14 10 24
Tomatoes 10 11 3 24 0 24
Perennials (excl. olives) 29 15 5 49 12 61
Annuals (excl. tomatoes) 28 15 7 51 6 57
Citrus fruits (excl. oranges and tang. mand. etc.)
1 1 0 2 0 3
Pulses 22 2 6 31 3 34
Other 177 41 8 226 61 287
Total agricultural products 796 432 76 1,305 2,799 4,103
Industrial products - 2 26 28 175 203
Total 796 435 102 1,333 2,974 4,307
Source: total virtual water export from Mekonnen and Hoekstra (2011).
3.4.3. Morocco’s water savings related to trade
The national water saving of Morocco related to international trade is the volume of water that is saved by
importing products instead of producing them domestically. In total, Morocco saved 27.8 Gm³/yr (75% green,
21% blue and 4% grey) by trade in agricultural and industrial products in the period 1996-2005 (Table 14). The
total water saving is 72% of the WF within Morocco. The blue water saving is even 87% of the blue WF within
Morocco. The majority of the green (99%), blue (100%) and grey (91%) water savings is related to trade in crop
products. Wheat import from France resulted in a water saving for Morocco of 3.77 Gm³/yr (Mekonnen and
Hoekstra, 2010a).
Table 14. National water saving of Morocco related to international trade (in Mm³/yr). Period: 1996-2005.
Green Blue Grey Total
Related to trade in crop products 20,542 5,920 971 27,434
Related to trade in animal products 256 15 5 277
Related to trade in industrial products - 8 90 98
Total 20,798 5,944 1,066 27,808
Source: Mekonnen and Hoekstra (2011).
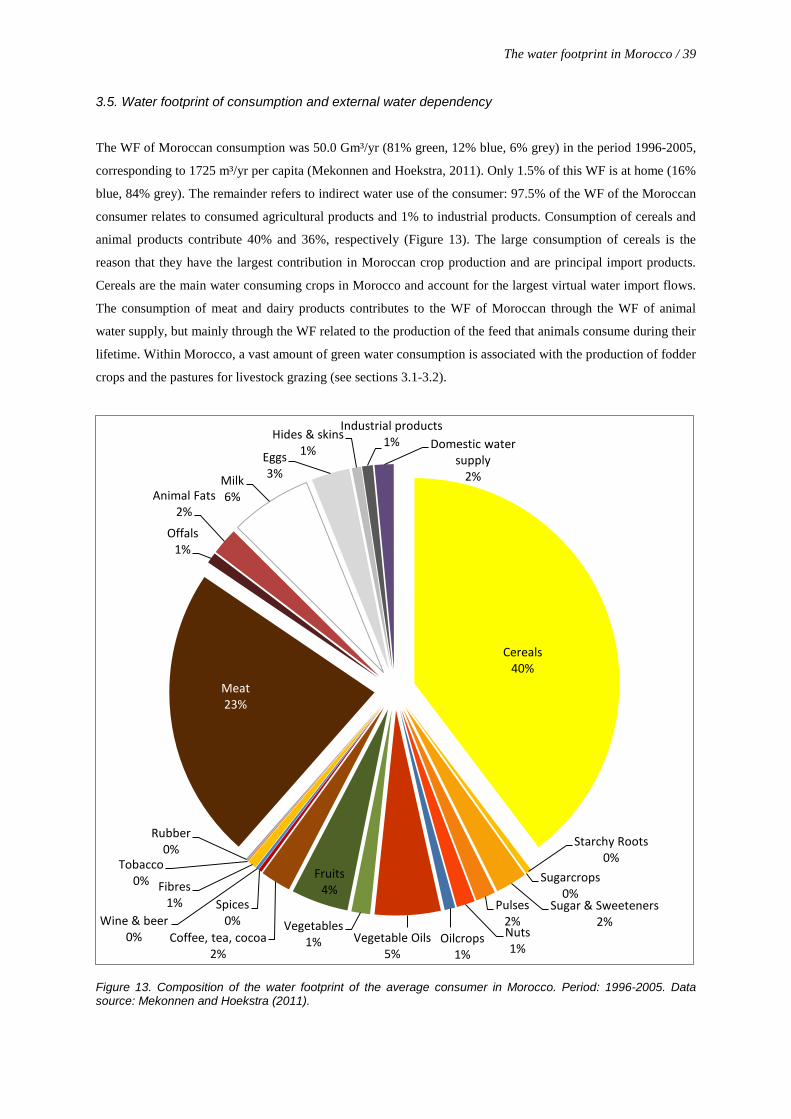
The water footprint in Morocco / 39
3.5. Water footprint of consumption and external water dependency
The WF of Moroccan consumption was 50.0 Gm³/yr (81% green, 12% blue, 6% grey) in the period 1996-2005,
corresponding to 1725 m³/yr per capita (Mekonnen and Hoekstra, 2011). Only 1.5% of this WF is at home (16%
blue, 84% grey). The remainder refers to indirect water use of the consumer: 97.5% of the WF of the Moroccan
consumer relates to consumed agricultural products and 1% to industrial products. Consumption of cereals and
animal products contribute 40% and 36%, respectively (Figure 13). The large consumption of cereals is the
reason that they have the largest contribution in Moroccan crop production and are principal import products.
Cereals are the main water consuming crops in Morocco and account for the largest virtual water import flows.
The consumption of meat and dairy products contributes to the WF of Moroccan through the WF of animal
water supply, but mainly through the WF related to the production of the feed that animals consume during their
lifetime. Within Morocco, a vast amount of green water consumption is associated with the production of fodder
crops and the pastures for livestock grazing (see sections 3.1-3.2).
Figure 13. Composition of the water footprint of the average consumer in Morocco. Period: 1996-2005. Data source: Mekonnen and Hoekstra (2011).
Cereals 40%
Starchy Roots 0%
Sugarcrops 0%
Sugar & Sweeteners 2%
Pulses 2% Nuts 1%
Oilcrops 1%
Vegetable Oils 5%
Vegetables 1%
Fruits 4%
Coffee, tea, cocoa 2%
Spices 0% Wine & beer
0%
Fibres 1%
Tobacco 0%
Rubber 0%
Meat 23%
Offals 1%
Animal Fats 2%
Milk 6%
Eggs 3%
Hides & skins 1%
Industrial products 1% Domestic water
supply 2%
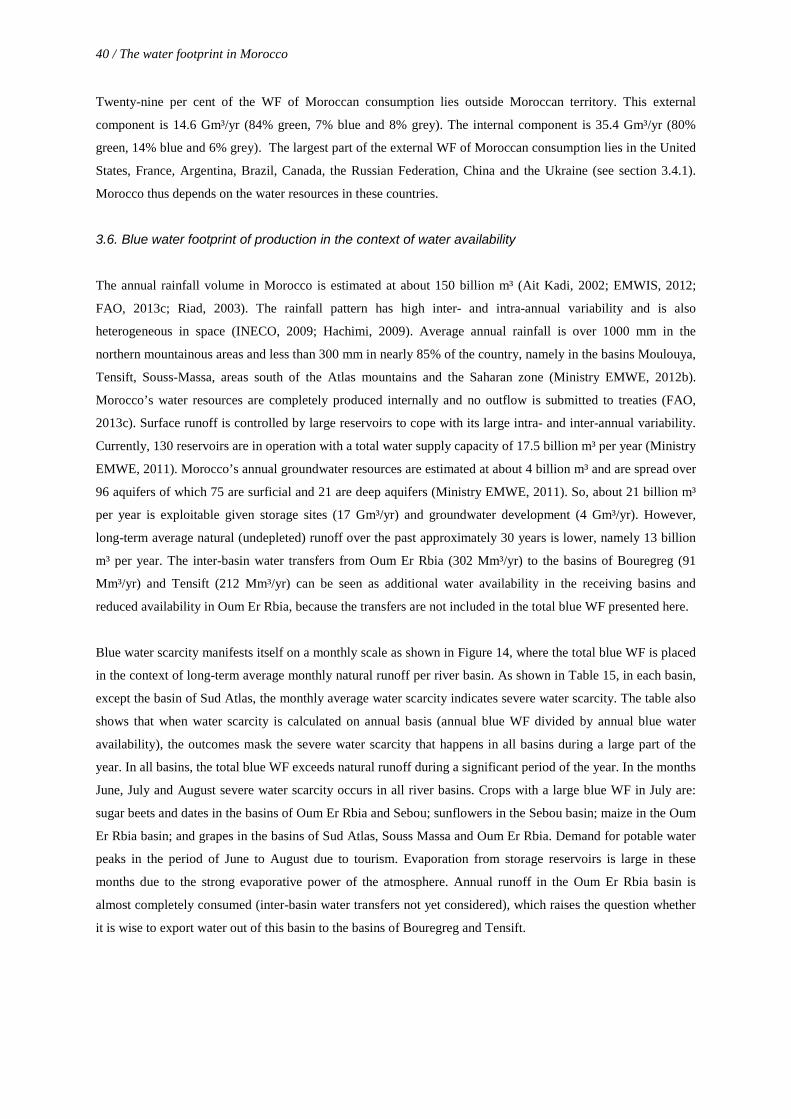
40 / The water footprint in Morocco
Twenty-nine per cent of the WF of Moroccan consumption lies outside Moroccan territory. This external
component is 14.6 Gm³/yr (84% green, 7% blue and 8% grey). The internal component is 35.4 Gm³/yr (80%
green, 14% blue and 6% grey). The largest part of the external WF of Moroccan consumption lies in the United
States, France, Argentina, Brazil, Canada, the Russian Federation, China and the Ukraine (see section 3.4.1).
Morocco thus depends on the water resources in these countries.
3.6. Blue water footprint of production in the context of water availability
The annual rainfall volume in Morocco is estimated at about 150 billion m³ (Ait Kadi, 2002; EMWIS, 2012;
FAO, 2013c; Riad, 2003). The rainfall pattern has high inter- and intra-annual variability and is also
heterogeneous in space (INECO, 2009; Hachimi, 2009). Average annual rainfall is over 1000 mm in the
northern mountainous areas and less than 300 mm in nearly 85% of the country, namely in the basins Moulouya,
Tensift, Souss-Massa, areas south of the Atlas mountains and the Saharan zone (Ministry EMWE, 2012b).
Morocco’s water resources are completely produced internally and no outflow is submitted to treaties (FAO,
2013c). Surface runoff is controlled by large reservoirs to cope with its large intra- and inter-annual variability.
Currently, 130 reservoirs are in operation with a total water supply capacity of 17.5 billion m³ per year (Ministry
EMWE, 2011). Morocco’s annual groundwater resources are estimated at about 4 billion m³ and are spread over
96 aquifers of which 75 are surficial and 21 are deep aquifers (Ministry EMWE, 2011). So, about 21 billion m³
per year is exploitable given storage sites (17 Gm³/yr) and groundwater development (4 Gm³/yr). However,
long-term average natural (undepleted) runoff over the past approximately 30 years is lower, namely 13 billion
m³ per year. The inter-basin water transfers from Oum Er Rbia (302 Mm³/yr) to the basins of Bouregreg (91
Mm³/yr) and Tensift (212 Mm³/yr) can be seen as additional water availability in the receiving basins and
reduced availability in Oum Er Rbia, because the transfers are not included in the total blue WF presented here.
Blue water scarcity manifests itself on a monthly scale as shown in Figure 14, where the total blue WF is placed
in the context of long-term average monthly natural runoff per river basin. As shown in Table 15, in each basin,
except the basin of Sud Atlas, the monthly average water scarcity indicates severe water scarcity. The table also
shows that when water scarcity is calculated on annual basis (annual blue WF divided by annual blue water
availability), the outcomes mask the severe water scarcity that happens in all basins during a large part of the
year. In all basins, the total blue WF exceeds natural runoff during a significant period of the year. In the months
June, July and August severe water scarcity occurs in all river basins. Crops with a large blue WF in July are:
sugar beets and dates in the basins of Oum Er Rbia and Sebou; sunflowers in the Sebou basin; maize in the Oum
Er Rbia basin; and grapes in the basins of Sud Atlas, Souss Massa and Oum Er Rbia. Demand for potable water
peaks in the period of June to August due to tourism. Evaporation from storage reservoirs is large in these
months due to the strong evaporative power of the atmosphere. Annual runoff in the Oum Er Rbia basin is
almost completely consumed (inter-basin water transfers not yet considered), which raises the question whether
it is wise to export water out of this basin to the basins of Bouregreg and Tensift.
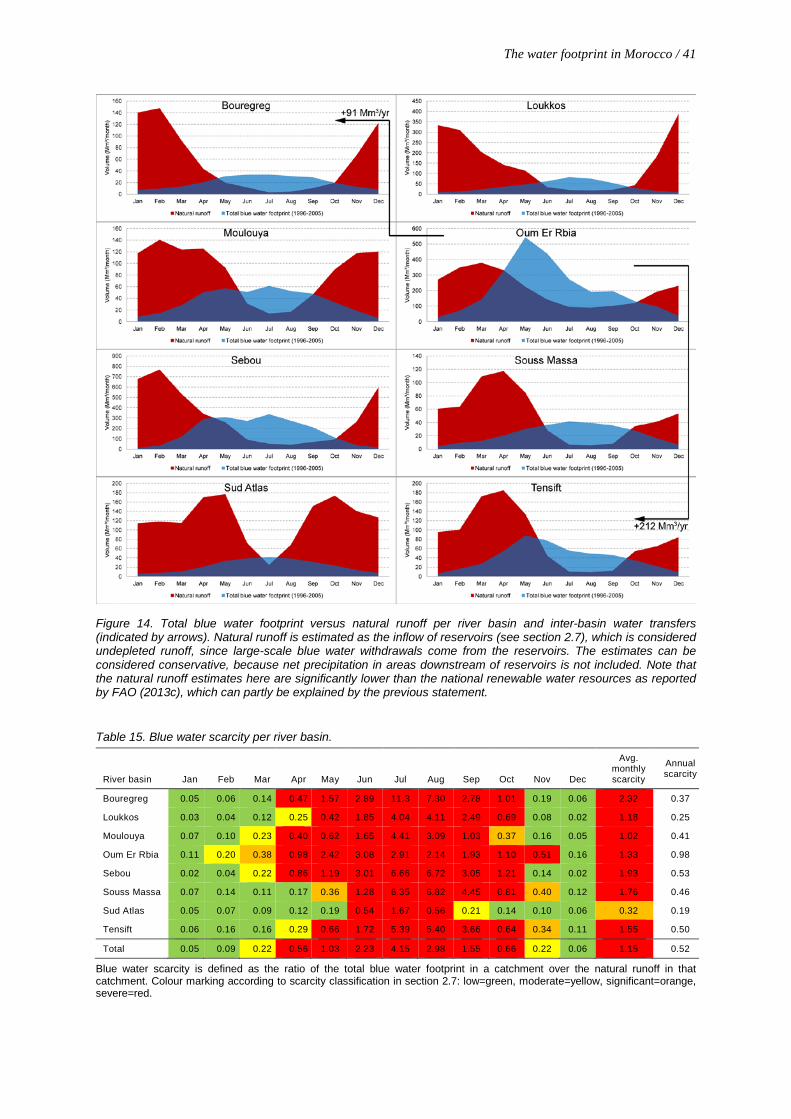
The water footprint in Morocco / 41
Figure 14. Total blue water footprint versus natural runoff per river basin and inter-basin water transfers (indicated by arrows). Natural runoff is estimated as the inflow of reservoirs (see section 2.7), which is considered undepleted runoff, since large-scale blue water withdrawals come from the reservoirs. The estimates can be considered conservative, because net precipitation in areas downstream of reservoirs is not included. Note that the natural runoff estimates here are significantly lower than the national renewable water resources as reported by FAO (2013c), which can partly be explained by the previous statement.
Table 15. Blue water scarcity per river basin.
River basin Jan Feb Mar Apr May Jun Jul Aug Sep Oct Nov Dec
Avg. monthly scarcity
Annual scarcity
Bouregreg 0.05 0.06 0.14 0.47 1.57 2.89 11.3 7.30 2.78 1.01 0.19 0.06 2.32 0.37
Loukkos 0.03 0.04 0.12 0.25 0.42 1.85 4.04 4.11 2.49 0.69 0.08 0.02 1.18 0.25
Moulouya 0.07 0.10 0.23 0.40 0.62 1.65 4.41 3.09 1.03 0.37 0.16 0.05 1.02 0.41
Oum Er Rbia 0.11 0.20 0.38 0.98 2.42 3.08 2.91 2.14 1.93 1.10 0.51 0.16 1.33 0.98
Sebou 0.02 0.04 0.22 0.86 1.19 3.01 6.66 6.72 3.05 1.21 0.14 0.02 1.93 0.53
Souss Massa 0.07 0.14 0.11 0.17 0.36 1.28 6.35 6.82 4.45 0.81 0.40 0.12 1.76 0.46
Sud Atlas 0.05 0.07 0.09 0.12 0.19 0.54 1.67 0.56 0.21 0.14 0.10 0.06 0.32 0.19
Tensift 0.06 0.16 0.16 0.29 0.66 1.72 5.39 5.40 3.66 0.64 0.34 0.11 1.55 0.50
Total 0.05 0.09 0.22 0.56 1.03 2.23 4.15 2.98 1.55 0.66 0.22 0.06 1.15 0.52
Blue water scarcity is defined as the ratio of the total blue water footprint in a catchment over the natural runoff in that catchment. Colour marking according to scarcity classification in section 2.7: low=green, moderate=yellow, significant=orange, severe=red.
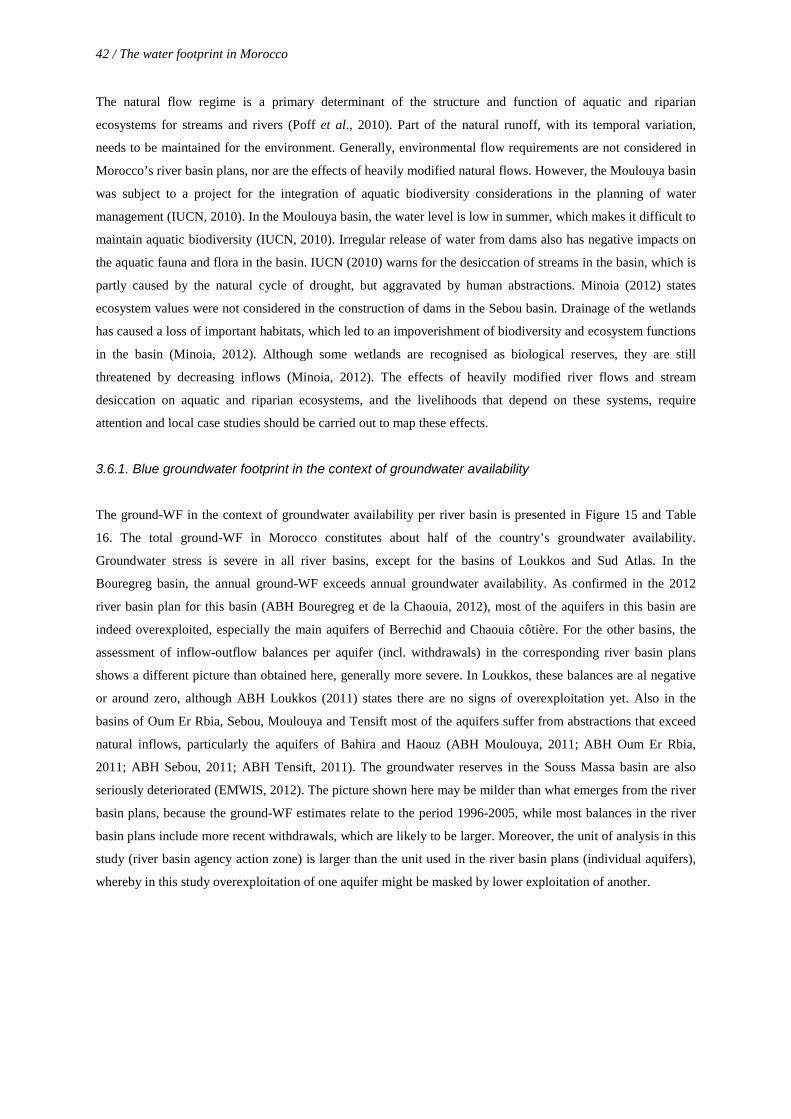
42 / The water footprint in Morocco
The natural flow regime is a primary determinant of the structure and function of aquatic and riparian
ecosystems for streams and rivers (Poff et al., 2010). Part of the natural runoff, with its temporal variation,
needs to be maintained for the environment. Generally, environmental flow requirements are not considered in
Morocco’s river basin plans, nor are the effects of heavily modified natural flows. However, the Moulouya basin
was subject to a project for the integration of aquatic biodiversity considerations in the planning of water
management (IUCN, 2010). In the Moulouya basin, the water level is low in summer, which makes it difficult to
maintain aquatic biodiversity (IUCN, 2010). Irregular release of water from dams also has negative impacts on
the aquatic fauna and flora in the basin. IUCN (2010) warns for the desiccation of streams in the basin, which is
partly caused by the natural cycle of drought, but aggravated by human abstractions. Minoia (2012) states
ecosystem values were not considered in the construction of dams in the Sebou basin. Drainage of the wetlands
has caused a loss of important habitats, which led to an impoverishment of biodiversity and ecosystem functions
in the basin (Minoia, 2012). Although some wetlands are recognised as biological reserves, they are still
threatened by decreasing inflows (Minoia, 2012). The effects of heavily modified river flows and stream
desiccation on aquatic and riparian ecosystems, and the livelihoods that depend on these systems, require
attention and local case studies should be carried out to map these effects.
3.6.1. Blue groundwater footprint in the context of groundwater availability
The ground-WF in the context of groundwater availability per river basin is presented in Figure 15 and Table
16. The total ground-WF in Morocco constitutes about half of the country’s groundwater availability.
Groundwater stress is severe in all river basins, except for the basins of Loukkos and Sud Atlas. In the
Bouregreg basin, the annual ground-WF exceeds annual groundwater availability. As confirmed in the 2012
river basin plan for this basin (ABH Bouregreg et de la Chaouia, 2012), most of the aquifers in this basin are
indeed overexploited, especially the main aquifers of Berrechid and Chaouia côtière. For the other basins, the
assessment of inflow-outflow balances per aquifer (incl. withdrawals) in the corresponding river basin plans
shows a different picture than obtained here, generally more severe. In Loukkos, these balances are al negative
or around zero, although ABH Loukkos (2011) states there are no signs of overexploitation yet. Also in the
basins of Oum Er Rbia, Sebou, Moulouya and Tensift most of the aquifers suffer from abstractions that exceed
natural inflows, particularly the aquifers of Bahira and Haouz (ABH Moulouya, 2011; ABH Oum Er Rbia,
2011; ABH Sebou, 2011; ABH Tensift, 2011). The groundwater reserves in the Souss Massa basin are also
seriously deteriorated (EMWIS, 2012). The picture shown here may be milder than what emerges from the river
basin plans, because the ground-WF estimates relate to the period 1996-2005, while most balances in the river
basin plans include more recent withdrawals, which are likely to be larger. Moreover, the unit of analysis in this
study (river basin agency action zone) is larger than the unit used in the river basin plans (individual aquifers),
whereby in this study overexploitation of one aquifer might be masked by lower exploitation of another.
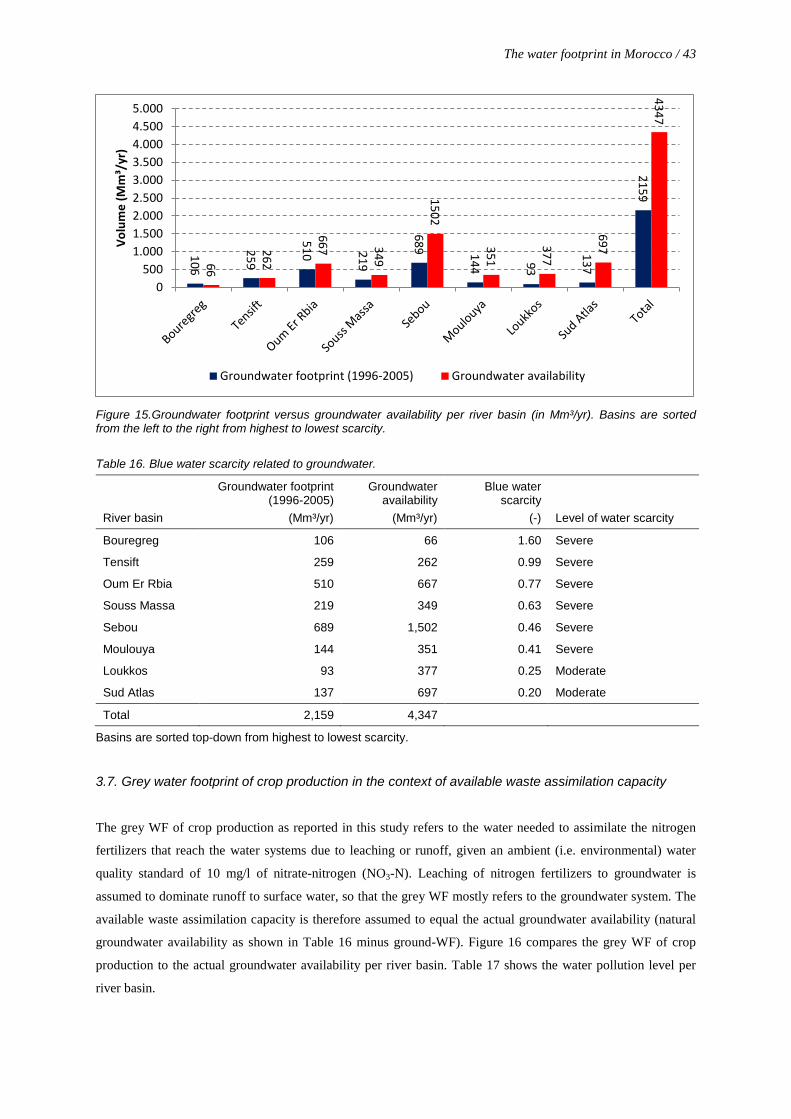
The water footprint in Morocco / 43
Figure 15.Groundwater footprint versus groundwater availability per river basin (in Mm³/yr). Basins are sorted from the left to the right from highest to lowest scarcity. Table 16. Blue water scarcity related to groundwater.
River basin
Groundwater footprint (1996-2005)
(Mm³/yr)
Groundwater availability
(Mm³/yr)
Blue water scarcity
(-) Level of water scarcity
Bouregreg 106 66 1.60 Severe
Tensift 259 262 0.99 Severe
Oum Er Rbia 510 667 0.77 Severe
Souss Massa 219 349 0.63 Severe
Sebou 689 1,502 0.46 Severe
Moulouya 144 351 0.41 Severe
Loukkos 93 377 0.25 Moderate
Sud Atlas 137 697 0.20 Moderate
Total 2,159 4,347
Basins are sorted top-down from highest to lowest scarcity.
3.7. Grey water footprint of crop production in the context of available waste assimilation capacity
The grey WF of crop production as reported in this study refers to the water needed to assimilate the nitrogen
fertilizers that reach the water systems due to leaching or runoff, given an ambient (i.e. environmental) water
quality standard of 10 mg/l of nitrate-nitrogen (NO3-N). Leaching of nitrogen fertilizers to groundwater is
assumed to dominate runoff to surface water, so that the grey WF mostly refers to the groundwater system. The
available waste assimilation capacity is therefore assumed to equal the actual groundwater availability (natural
groundwater availability as shown in Table 16 minus ground-WF). Figure 16 compares the grey WF of crop
production to the actual groundwater availability per river basin. Table 17 shows the water pollution level per
river basin.
106
259
510
219
689 144
93
137
2159
66
262
667
349
1502
351
377
697
4347
0500
1.0001.5002.0002.5003.0003.5004.0004.5005.000
Volu
me
(Mm
³/yr
)
Groundwater footprint (1996-2005) Groundwater availability
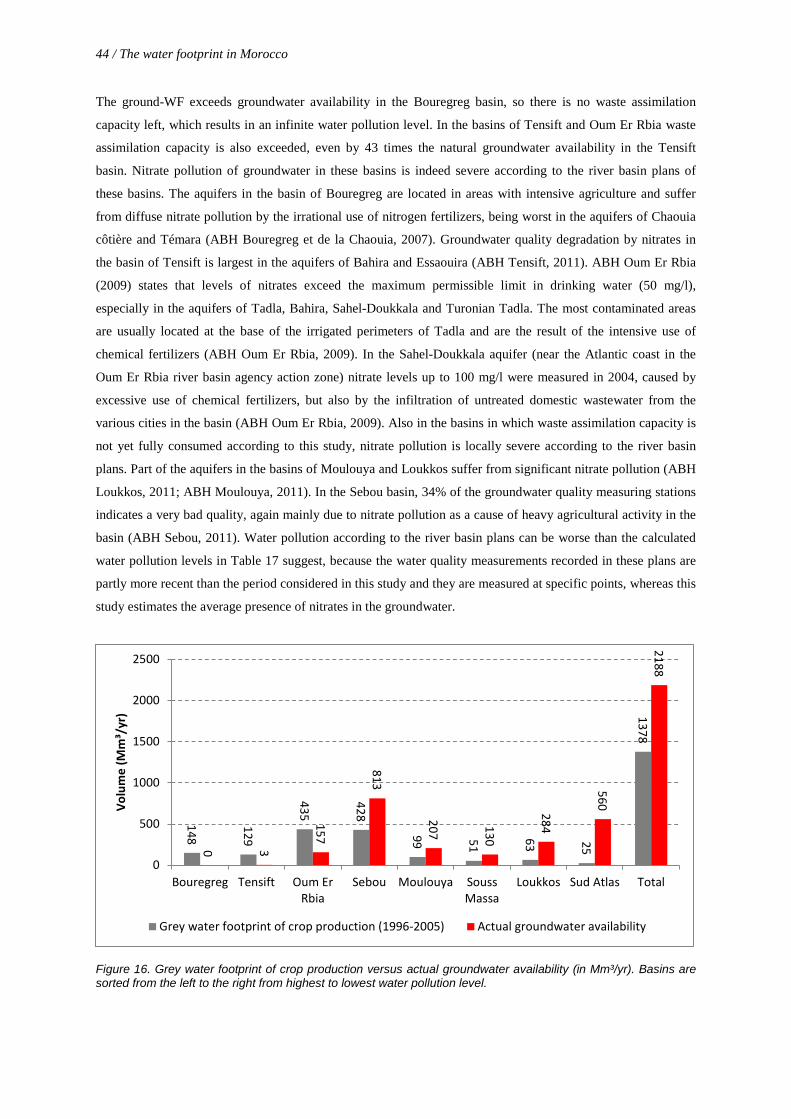
44 / The water footprint in Morocco
The ground-WF exceeds groundwater availability in the Bouregreg basin, so there is no waste assimilation
capacity left, which results in an infinite water pollution level. In the basins of Tensift and Oum Er Rbia waste
assimilation capacity is also exceeded, even by 43 times the natural groundwater availability in the Tensift
basin. Nitrate pollution of groundwater in these basins is indeed severe according to the river basin plans of
these basins. The aquifers in the basin of Bouregreg are located in areas with intensive agriculture and suffer
from diffuse nitrate pollution by the irrational use of nitrogen fertilizers, being worst in the aquifers of Chaouia
côtière and Témara (ABH Bouregreg et de la Chaouia, 2007). Groundwater quality degradation by nitrates in
the basin of Tensift is largest in the aquifers of Bahira and Essaouira (ABH Tensift, 2011). ABH Oum Er Rbia
(2009) states that levels of nitrates exceed the maximum permissible limit in drinking water (50 mg/l),
especially in the aquifers of Tadla, Bahira, Sahel-Doukkala and Turonian Tadla. The most contaminated areas
are usually located at the base of the irrigated perimeters of Tadla and are the result of the intensive use of
chemical fertilizers (ABH Oum Er Rbia, 2009). In the Sahel-Doukkala aquifer (near the Atlantic coast in the
Oum Er Rbia river basin agency action zone) nitrate levels up to 100 mg/l were measured in 2004, caused by
excessive use of chemical fertilizers, but also by the infiltration of untreated domestic wastewater from the
various cities in the basin (ABH Oum Er Rbia, 2009). Also in the basins in which waste assimilation capacity is
not yet fully consumed according to this study, nitrate pollution is locally severe according to the river basin
plans. Part of the aquifers in the basins of Moulouya and Loukkos suffer from significant nitrate pollution (ABH
Loukkos, 2011; ABH Moulouya, 2011). In the Sebou basin, 34% of the groundwater quality measuring stations
indicates a very bad quality, again mainly due to nitrate pollution as a cause of heavy agricultural activity in the
basin (ABH Sebou, 2011). Water pollution according to the river basin plans can be worse than the calculated
water pollution levels in Table 17 suggest, because the water quality measurements recorded in these plans are
partly more recent than the period considered in this study and they are measured at specific points, whereas this
study estimates the average presence of nitrates in the groundwater.
Figure 16. Grey water footprint of crop production versus actual groundwater availability (in Mm³/yr). Basins are sorted from the left to the right from highest to lowest water pollution level.
148
129
435
428
99
51
63
25
1378
0 3
157
813
207
130
284
560
2188
0
500
1000
1500
2000
2500
Bouregreg Tensift Oum ErRbia
Sebou Moulouya SoussMassa
Loukkos Sud Atlas Total
Volu
me
(Mm
³/yr
)
Grey water footprint of crop production (1996-2005) Actual groundwater availability
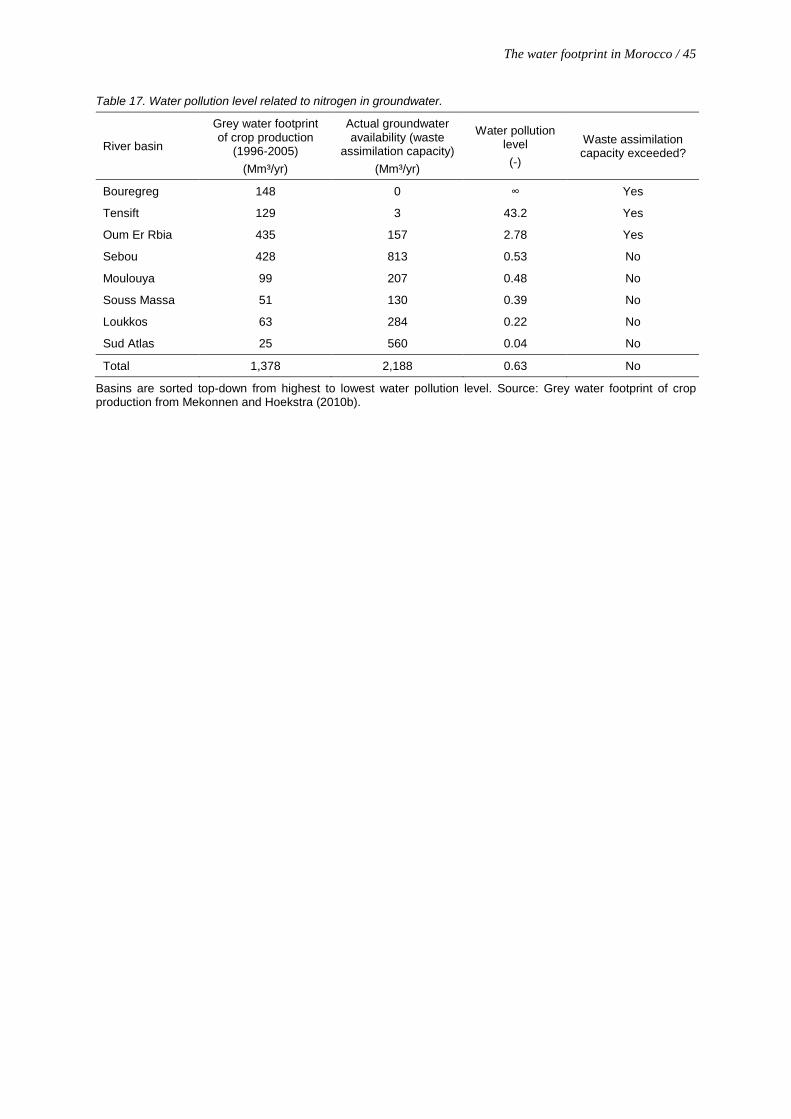
The water footprint in Morocco / 45
Table 17. Water pollution level related to nitrogen in groundwater.
River basin
Grey water footprint of crop production
(1996-2005) (Mm³/yr)
Actual groundwater availability (waste
assimilation capacity) (Mm³/yr)
Water pollution level (-)
Waste assimilation capacity exceeded?
Bouregreg 148 0 ∞ Yes
Tensift 129 3 43.2 Yes
Oum Er Rbia 435 157 2.78 Yes
Sebou 428 813 0.53 No
Moulouya 99 207 0.48 No
Souss Massa 51 130 0.39 No
Loukkos 63 284 0.22 No
Sud Atlas 25 560 0.04 No
Total 1,378 2,188 0.63 No
Basins are sorted top-down from highest to lowest water pollution level. Source: Grey water footprint of crop production from Mekonnen and Hoekstra (2010b).

4. Response options
This chapter examines possible response options to alleviate water scarcity in Morocco. Firstly, options to
reduce the WF of crop production (the largest contributor to the WF within Morocco) are considered and
associated water savings are quantified (section 4.1). Secondly, the idea of establishing WF caps per river basin
to limit increasing WFs in the already water-scarce basins of Morocco is discussed (section 4.2). Next, the
possibility of allocating land and water resources to different crops is discussed, in order to see whether one can
make more economically efficient use of these resources (section 4.3). Lastly, a discourse is provided about
water scarcity and allocation in Morocco in relation to the country’s virtual water trade balance (section 4.4).
4.1. Reducing the water footprint of crop production
As shown in section 3.1, crop production contributes most to the WF of national production. For the twelve
crops that together constituted 87% of the total water consumption of crops in the period 1996-2005 (24.6
Gm³/yr), the potential water savings are estimated by looking at three types of strategies: partial relocation of
production across river basins (which is possible due to spatial differences in crop water use) (section 4.1.1), an
overall improvement of water productivities (section 4.1.2) and benchmarking water productivity (section
4.1.3). The analysed crops are: almonds, barley, dates, grapes, maize, olives, oranges, sugar beets, sugar cane,
mandarins etc., tomatoes and wheat.
4.1.1. Partial relocation of crop production across basins
Water consumption per ton of crop production varies across the different river basins of Morocco as shown in
section 3.2. These regional differences in crop water use provide an opportunity for reduction of the WF of crop
production by changing the spatial pattern of crop production within the country. Potential water savings by a
partial relocation of crops are assessed for two different cases: harvested land of all twelve crops considered is
interchangeable and restricted per river basin (case A); only annual crops (barley, maize, sugar beets, tomatoes
and wheat) can be relocated, perennials cannot (case B). Summarised results are presented in Tables 18-20. A
full overview of the input data, base case and results for the two alternative cases A and B is provided in
Appendix VIII.
Potential water savings (green plus blue) are in the order of 1.9 and 1.2 Gm³ per year in case A and B,
respectively. Blue water savings are 1.3 Gm³/yr in case A and 0.7 Gm³/yr in case B. These are significant
savings when put in the context of the actions plans in Morocco’s national water strategy to mobilize 1.7 Gm³/yr
by 2030 through the construction of 60 large and 1000 small local dams and the North-South inter-basin water
transfer of 0.8 Gm³/yr.
Largest potential water savings can be obtained by partial relocation of the production of maize and wheat,
particularly by moving maize production from the Oum Er Rbia basin to the Moulouya basin and wheat
production from the Bouregreg basin to the basin of Sebou. Relocation of crop production in case A results in
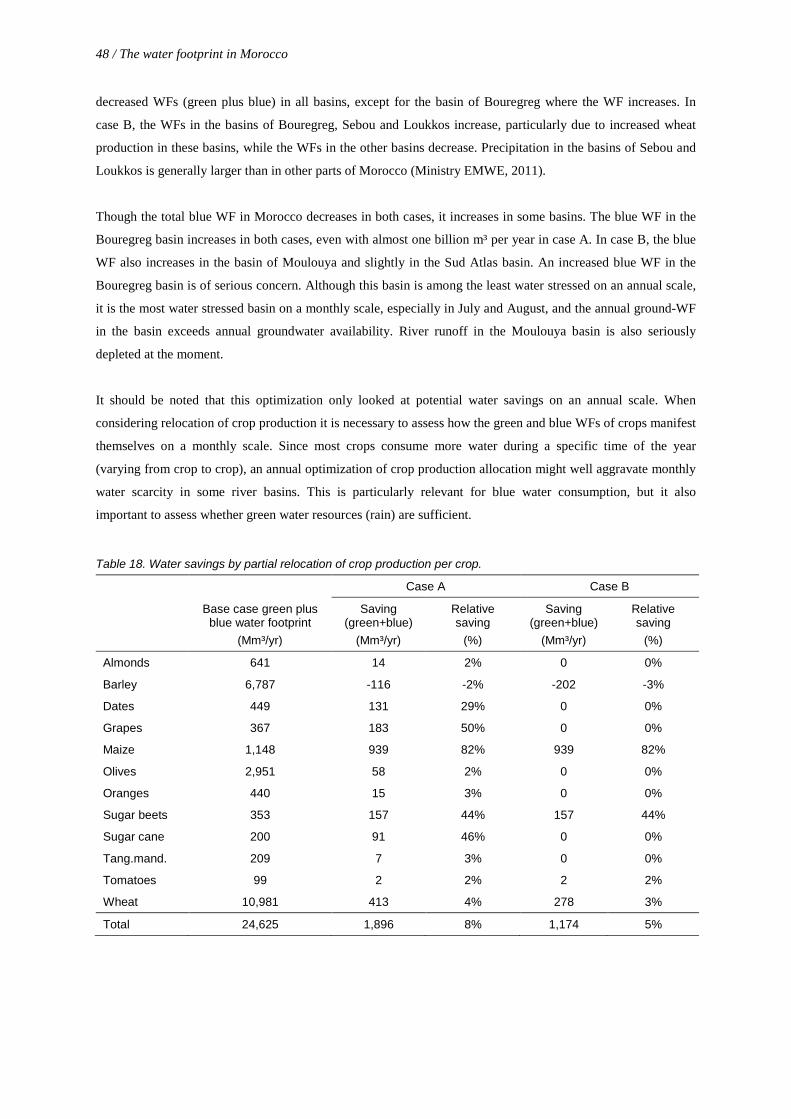
48 / The water footprint in Morocco
decreased WFs (green plus blue) in all basins, except for the basin of Bouregreg where the WF increases. In
case B, the WFs in the basins of Bouregreg, Sebou and Loukkos increase, particularly due to increased wheat
production in these basins, while the WFs in the other basins decrease. Precipitation in the basins of Sebou and
Loukkos is generally larger than in other parts of Morocco (Ministry EMWE, 2011).
Though the total blue WF in Morocco decreases in both cases, it increases in some basins. The blue WF in the
Bouregreg basin increases in both cases, even with almost one billion m³ per year in case A. In case B, the blue
WF also increases in the basin of Moulouya and slightly in the Sud Atlas basin. An increased blue WF in the
Bouregreg basin is of serious concern. Although this basin is among the least water stressed on an annual scale,
it is the most water stressed basin on a monthly scale, especially in July and August, and the annual ground-WF
in the basin exceeds annual groundwater availability. River runoff in the Moulouya basin is also seriously
depleted at the moment.
It should be noted that this optimization only looked at potential water savings on an annual scale. When
considering relocation of crop production it is necessary to assess how the green and blue WFs of crops manifest
themselves on a monthly scale. Since most crops consume more water during a specific time of the year
(varying from crop to crop), an annual optimization of crop production allocation might well aggravate monthly
water scarcity in some river basins. This is particularly relevant for blue water consumption, but it also
important to assess whether green water resources (rain) are sufficient.
Table 18. Water savings by partial relocation of crop production per crop.
Base case green plus blue water footprint
(Mm³/yr)
Case A Case B
Saving (green+blue)
(Mm³/yr)
Relative saving
(%)
Saving (green+blue)
(Mm³/yr)
Relative saving
(%)
Almonds 641 14 2% 0 0%
Barley 6,787 -116 -2% -202 -3%
Dates 449 131 29% 0 0%
Grapes 367 183 50% 0 0%
Maize 1,148 939 82% 939 82%
Olives 2,951 58 2% 0 0%
Oranges 440 15 3% 0 0%
Sugar beets 353 157 44% 157 44%
Sugar cane 200 91 46% 0 0%
Tang.mand. 209 7 3% 0 0%
Tomatoes 99 2 2% 2 2%
Wheat 10,981 413 4% 278 3%
Total 24,625 1,896 8% 1,174 5%
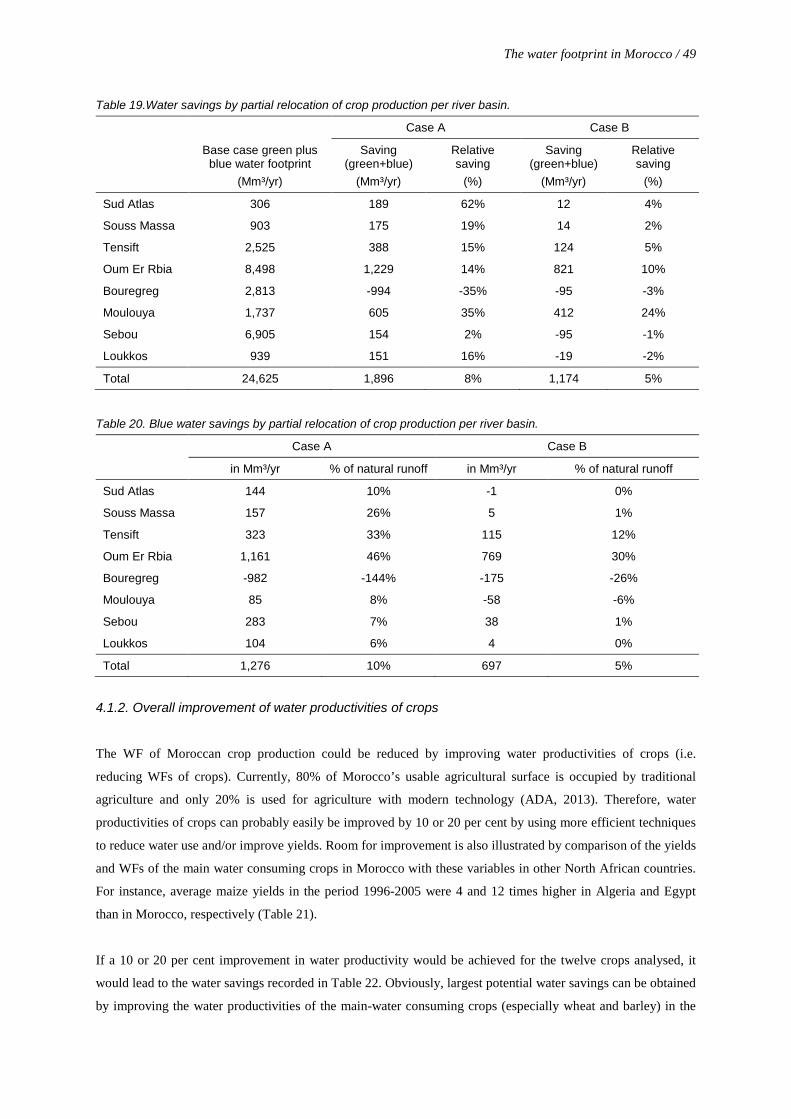
The water footprint in Morocco / 49
Table 19.Water savings by partial relocation of crop production per river basin.
Base case green plus blue water footprint
(Mm³/yr)
Case A Case B
Saving (green+blue)
(Mm³/yr)
Relative saving
(%)
Saving (green+blue)
(Mm³/yr)
Relative saving
(%)
Sud Atlas 306 189 62% 12 4%
Souss Massa 903 175 19% 14 2%
Tensift 2,525 388 15% 124 5%
Oum Er Rbia 8,498 1,229 14% 821 10%
Bouregreg 2,813 -994 -35% -95 -3%
Moulouya 1,737 605 35% 412 24%
Sebou 6,905 154 2% -95 -1%
Loukkos 939 151 16% -19 -2%
Total 24,625 1,896 8% 1,174 5%
Table 20. Blue water savings by partial relocation of crop production per river basin.
Case A Case B
in Mm³/yr % of natural runoff in Mm³/yr % of natural runoff
Sud Atlas 144 10% -1 0%
Souss Massa 157 26% 5 1%
Tensift 323 33% 115 12%
Oum Er Rbia 1,161 46% 769 30%
Bouregreg -982 -144% -175 -26%
Moulouya 85 8% -58 -6%
Sebou 283 7% 38 1%
Loukkos 104 6% 4 0%
Total 1,276 10% 697 5%
4.1.2. Overall improvement of water productivities of crops
The WF of Moroccan crop production could be reduced by improving water productivities of crops (i.e.
reducing WFs of crops). Currently, 80% of Morocco’s usable agricultural surface is occupied by traditional
agriculture and only 20% is used for agriculture with modern technology (ADA, 2013). Therefore, water
productivities of crops can probably easily be improved by 10 or 20 per cent by using more efficient techniques
to reduce water use and/or improve yields. Room for improvement is also illustrated by comparison of the yields
and WFs of the main water consuming crops in Morocco with these variables in other North African countries.
For instance, average maize yields in the period 1996-2005 were 4 and 12 times higher in Algeria and Egypt
than in Morocco, respectively (Table 21).
If a 10 or 20 per cent improvement in water productivity would be achieved for the twelve crops analysed, it
would lead to the water savings recorded in Table 22. Obviously, largest potential water savings can be obtained
by improving the water productivities of the main-water consuming crops (especially wheat and barley) in the

50 / The water footprint in Morocco
main production areas. When the water productivities for the twelve crops are improved by 10% in all basins,
the total green plus blue water saving is estimated at 2.5 Gm³/yr of which 0.37 Gm³/yr is blue water. Logically,
water savings are double if productivities where to be improved by 20%.
Table 21.Comparison of yields and green plus blue water footprints for the four main water-consuming crops in Morocco with other North African countries. Period 1996-2005.
Crop Country Yield (ton/ha) Times yield in
Morocco Green plus blue WF
(m³/ton) Times green plus blue
WF in Morocco
Wheat
Morocco 1.27 1.0 10,981 1.0
Algeria 1.15 0.9 3,355 0.3
Egypt 6.23 4.9 1,118 0.1
Tunisia 1.56 1.2 2,447 0.2
Barley
Morocco 0.83 1.0 6,787 1.0
Algeria 1.13 1.4 2,859 0.4
Egypt 2.58 3.1 2,314 0.3
Tunisia 0.91 1.1 3,636 0.5
Olives
Morocco 1.17 1.0 2,951 1.0
Algeria 1.41 1.2 4,279 1.4
Egypt 6.78 5.8 1,922 0.7
Tunisia 0.53 0.5 9,115 3.1
Maize
Morocco 0.63 1.0 1,148 1.0
Algeria 2.69 4.3 964 0.8
Egypt 7.51 12.0 1,219 1.1
Tunisia - - 0 0.0
Source: data for Morocco from Mekonnen and Hoekstra (2010b); for other countries, yield data from FAO
(2013d), water footprint data from Mekonnen and Hoekstra (2010b).
Table 22. Water savings by improving water productivities of main crops per river basin.
Water productivity improved with 10% Water productivity improved with 20%
Saving (green+blue)
(Mm³/yr)
Saving (blue) (Mm³/yr)
Saving (blue) (% of natural
runoff)
Saving (green+blue)
(Mm³/yr)
Saving (blue) (Mm³/yr)
Saving (blue) (% of natural
runoff)
Sud Atlas 31 19 1% 61 39 3%
Souss Massa 90 16 3% 181 31 5%
Tensift 252 32 3% 505 65 7%
Oum Er Rbia 850 151 6% 1,700 302 12%
Bouregreg 281 10 1% 563 19 3%
Moulouya 174 23 2% 347 46 4%
Sebou 690 108 3% 1,381 216 6%
Loukkos 94 12 1% 188 25 1%
Total 2,462 371 3% 4,925 743 6%
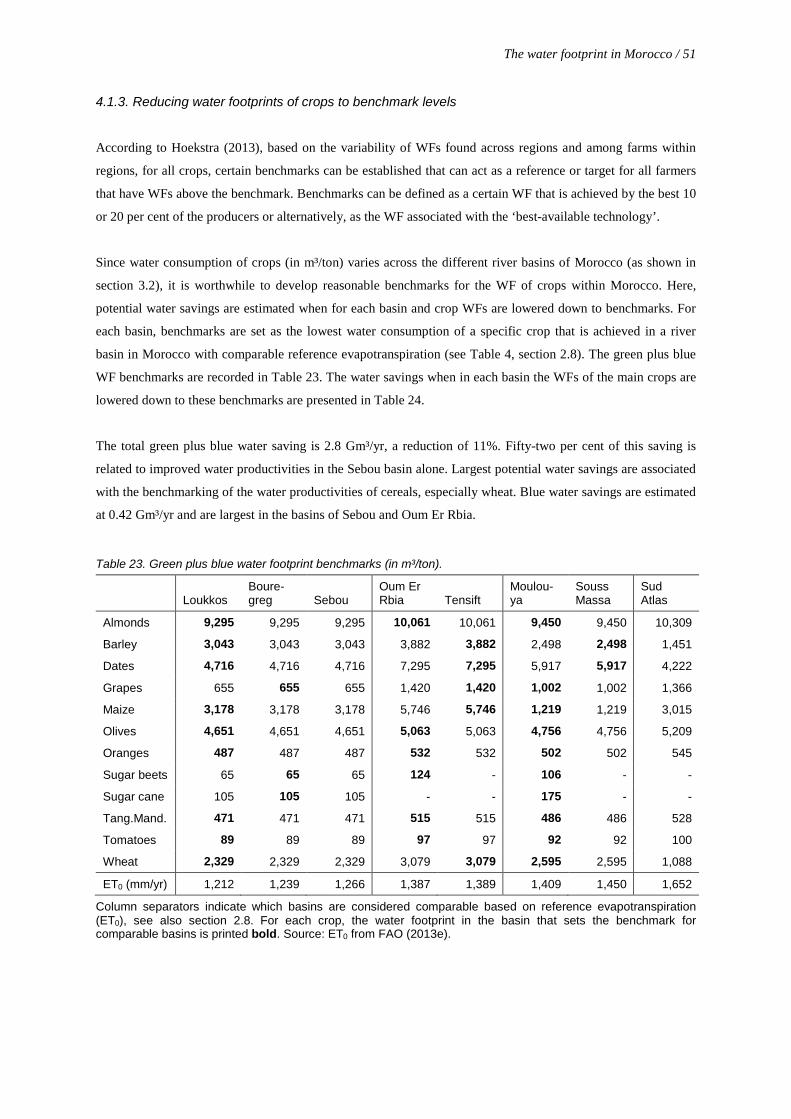
The water footprint in Morocco / 51
4.1.3. Reducing water footprints of crops to benchmark levels
According to Hoekstra (2013), based on the variability of WFs found across regions and among farms within
regions, for all crops, certain benchmarks can be established that can act as a reference or target for all farmers
that have WFs above the benchmark. Benchmarks can be defined as a certain WF that is achieved by the best 10
or 20 per cent of the producers or alternatively, as the WF associated with the ‘best-available technology’.
Since water consumption of crops (in m³/ton) varies across the different river basins of Morocco (as shown in
section 3.2), it is worthwhile to develop reasonable benchmarks for the WF of crops within Morocco. Here,
potential water savings are estimated when for each basin and crop WFs are lowered down to benchmarks. For
each basin, benchmarks are set as the lowest water consumption of a specific crop that is achieved in a river
basin in Morocco with comparable reference evapotranspiration (see Table 4, section 2.8). The green plus blue
WF benchmarks are recorded in Table 23. The water savings when in each basin the WFs of the main crops are
lowered down to these benchmarks are presented in Table 24.
The total green plus blue water saving is 2.8 Gm³/yr, a reduction of 11%. Fifty-two per cent of this saving is
related to improved water productivities in the Sebou basin alone. Largest potential water savings are associated
with the benchmarking of the water productivities of cereals, especially wheat. Blue water savings are estimated
at 0.42 Gm³/yr and are largest in the basins of Sebou and Oum Er Rbia.
Table 23. Green plus blue water footprint benchmarks (in m³/ton).
Loukkos Boure-greg Sebou
Oum Er Rbia Tensift
Moulou-ya
Souss Massa
Sud Atlas
Almonds 9,295 9,295 9,295 10,061 10,061 9,450 9,450 10,309
Barley 3,043 3,043 3,043 3,882 3,882 2,498 2,498 1,451
Dates 4,716 4,716 4,716 7,295 7,295 5,917 5,917 4,222
Grapes 655 655 655 1,420 1,420 1,002 1,002 1,366
Maize 3,178 3,178 3,178 5,746 5,746 1,219 1,219 3,015
Olives 4,651 4,651 4,651 5,063 5,063 4,756 4,756 5,209
Oranges 487 487 487 532 532 502 502 545
Sugar beets 65 65 65 124 - 106 - -
Sugar cane 105 105 105 - - 175 - -
Tang.Mand. 471 471 471 515 515 486 486 528
Tomatoes 89 89 89 97 97 92 92 100
Wheat 2,329 2,329 2,329 3,079 3,079 2,595 2,595 1,088
ET0 (mm/yr) 1,212 1,239 1,266 1,387 1,389 1,409 1,450 1,652
Column separators indicate which basins are considered comparable based on reference evapotranspiration (ET0), see also section 2.8. For each crop, the water footprint in the basin that sets the benchmark for comparable basins is printed bold. Source: ET0 from FAO (2013e).
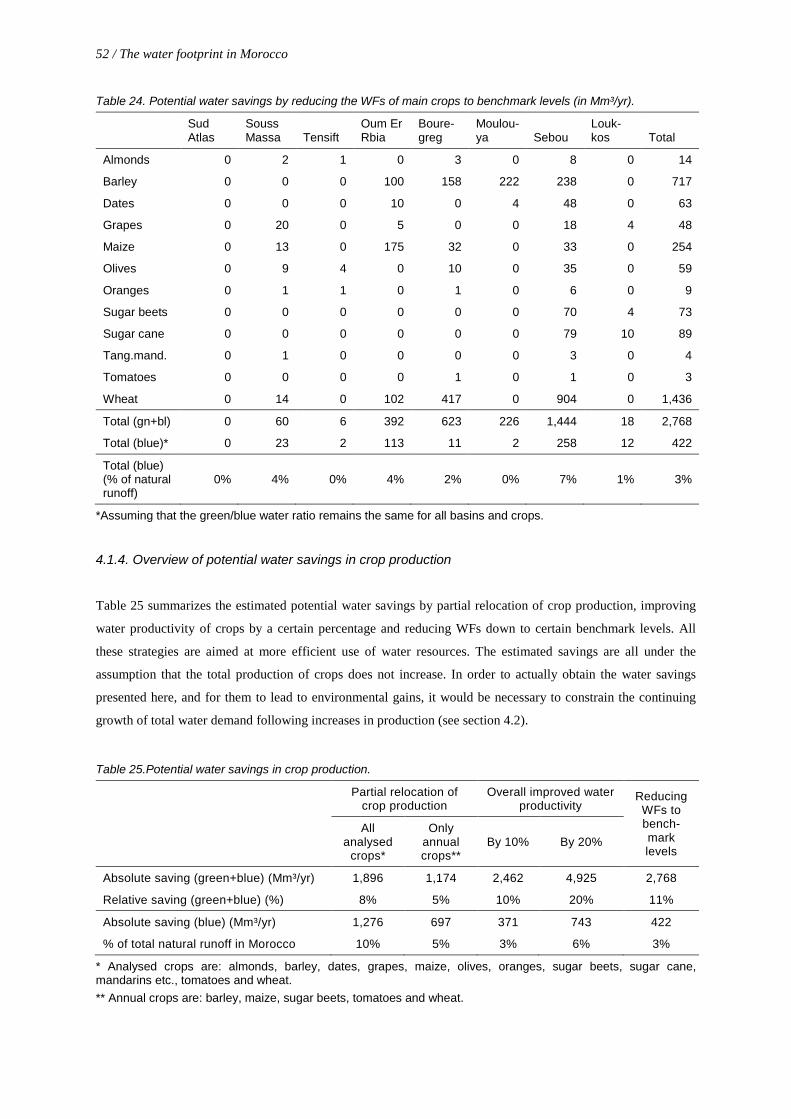
52 / The water footprint in Morocco
Table 24. Potential water savings by reducing the WFs of main crops to benchmark levels (in Mm³/yr).
Sud Atlas
Souss Massa Tensift
Oum Er Rbia
Boure-greg
Moulou-ya Sebou
Louk-kos Total
Almonds 0 2 1 0 3 0 8 0 14
Barley 0 0 0 100 158 222 238 0 717
Dates 0 0 0 10 0 4 48 0 63
Grapes 0 20 0 5 0 0 18 4 48
Maize 0 13 0 175 32 0 33 0 254
Olives 0 9 4 0 10 0 35 0 59
Oranges 0 1 1 0 1 0 6 0 9
Sugar beets 0 0 0 0 0 0 70 4 73
Sugar cane 0 0 0 0 0 0 79 10 89
Tang.mand. 0 1 0 0 0 0 3 0 4
Tomatoes 0 0 0 0 1 0 1 0 3
Wheat 0 14 0 102 417 0 904 0 1,436
Total (gn+bl) 0 60 6 392 623 226 1,444 18 2,768
Total (blue)* 0 23 2 113 11 2 258 12 422
Total (blue) (% of natural runoff)
0% 4% 0% 4% 2% 0% 7% 1% 3%
*Assuming that the green/blue water ratio remains the same for all basins and crops.
4.1.4. Overview of potential water savings in crop production
Table 25 summarizes the estimated potential water savings by partial relocation of crop production, improving
water productivity of crops by a certain percentage and reducing WFs down to certain benchmark levels. All
these strategies are aimed at more efficient use of water resources. The estimated savings are all under the
assumption that the total production of crops does not increase. In order to actually obtain the water savings
presented here, and for them to lead to environmental gains, it would be necessary to constrain the continuing
growth of total water demand following increases in production (see section 4.2).
Table 25.Potential water savings in crop production.
Partial relocation of crop production
Overall improved water productivity
Reducing WFs to bench-mark levels
All analysed
crops*
Only annual crops**
By 10% By 20%
Absolute saving (green+blue) (Mm³/yr) 1,896 1,174 2,462 4,925 2,768
Relative saving (green+blue) (%) 8% 5% 10% 20% 11%
Absolute saving (blue) (Mm³/yr) 1,276 697 371 743 422
% of total natural runoff in Morocco 10% 5% 3% 6% 3%
* Analysed crops are: almonds, barley, dates, grapes, maize, olives, oranges, sugar beets, sugar cane, mandarins etc., tomatoes and wheat. ** Annual crops are: barley, maize, sugar beets, tomatoes and wheat.
The water footprint in Morocco / 53
4.2. Water footprint caps per river basin
In all studied river basins natural runoff is seriously modified during a significant period of the year. In order to
move towards sustainable use of blue water in these basins, discussing and agreeing on a blue WF cap would be
useful. A ‘WF cap’ is to be understood as a maximum WF not to be exceeded (Hoekstra, 2013). Such a cap is
needed in addition to WF reducing measures as discussed in section 4.1, because these measures might not be
achieved as quickly as needed and, in case of increased water productivity of crops, it is likely that farmers will
increase their production volume once they require less water per unit of production (Hoekstra, 2013).
Ideally, a blue WF cap is set for each river basin in Morocco (and sub-basins) and for each month of the year.
The urge for a cap on the blue WF seems large for all Moroccan river basins given the high water scarcity levels
(section 3.6). Caps should also be defined for dry, humid and wet years separately. The danger of defining a cap
for an average year is that it becomes an impossible target in drier years (Hoekstra, 2013). Therefore the level of
the cap should be considered carefully on a regular basis, also taking into account climate change. In defining
the maximum sustainable level of blue water consumption, it should be taken into account that part of the
natural runoff needs to be reserved to maintain minimally required flows in the river (Poff et al., 2010). Local
case studies are necessary to determine these environmental flow requirements for each of the Moroccan rivers
and the effects of violating them. Moreover, the maximum sustainable level of blue water consumption would
need to be defined for surface and groundwater bodies separately. Based on observations for the Murray-Darling
basin in Australia, Hoekstra (2013) points out that if the cap is only set for one of them, it may lead to an
accelerated exploitation of the other. The current national water strategy of Morocco’s Ministerial Department
of Water already proposes to limit the pumping from overexploited aquifers by revision of the pricing system,
reduction of allowed withdrawal thresholds, cancelling subsidies that provide incentive for overexploitation and
designating areas of prohibited or restricted pumping (Ministry EMWE, 2011). These plans are also adopted in
the river basin plans.
Setting a cap is a political matter and the level of the cap will depend on negotiations and trading off different
interests (Hoekstra, 2013). Morocco’s High Council for Water and Climate seems an appropriate forum for
discussing and agreeing on the proposed caps. All national actors concerned by water issues have a seat in the
Council, where they debate on the national policy and main policy directions in water resource management
(INECO, 2009). One of the Council’s tasks is to elaborate and formulate an opinion on the allocation of water
among the various user sectors and the diverse regions of the country or of a single basin (Official State Gazette,
1995). Since overexploitation of Morocco’s water resources is severe at this moment, it is more realistic to agree
on blue WF caps that gradually move in time from the current blue WFs in the basins to levels that can be
regarded as sustainable (Hoekstra, 2013), at which natural surface runoff is less modified and groundwater
levels are maintained on the long-term.
The Moroccan government will need to put regulations in place to ensure that the actual total blue WF in each
river basin remains below the cap. Reinforcement of the control and sanction system for overexploitation,
particularly by reinforcing the water police and encouraging satellite monitoring and aerial surveillance, is part
54 / The water footprint in Morocco
of the national water strategy (Ministry EMWE, 2011). In order to adequately control whether the actual total
blue WF in each river basin remains below the cap, the WF of activities in the basin would need to be estimated
on a regular basis. A close cooperation between the river basins agencies and the regional offices for agricultural
development (Office Régional de Mise en Valeur Agricole – ORMVA) would be suitable for this task. The
ORMVA of the irrigated perimeter of Tadla in the Oum Er Rbia basin already estimates daily reference
evapotranspiration in their region and determines the water allocation to the farmers based on calculations of
crop water requirements.
It would be wise to cap the grey WF as well. In section 3.7 is shown that nitrate pollution by excessive use of
fertilizers is large in most river basins and exceeds waste assimilation capacity of groundwater in the basins of
Bouregreg, Tensift and Oum Er Rbia. In Morocco, ambient water quality standards for nitrates (and other
chemicals) in surface and groundwater bodies already exist (ABH Oum Er Rbia, 2009). These would have to be
translated to critical loads and regulations should be put in place to make sure these are not exceeded. When
critical loads are reached, the grey WF equals the waste assimilation capacity (total runoff in case of the water
system as a whole, or groundwater runoff in case of aquifers). Currently, there are plans to reduce pollution by
agriculture. The river basin agency of Oum Er Rbia, for example, has a quite elaborate (and funded) plan to gain
knowledge about the behaviour of agricultural pollutants in Moroccan and local conditions (e.g. soil type) and
how they contaminate the water, develop best practices in fertilizer use and conduct demonstration projects and
campaigns to raise awareness among farmers and policy makers to extend the best practices (ABH Oum Er
Rbia, 2011). In addition to these plans, a cap on the grey WF of agriculture should be agreed upon to make sure
pollution does not exceed the waste assimilation capacity of the rivers and aquifers. This is necessary, because
best practices in fertilizer use can lead to increased yields, which might give incentive for extension of the area
on which fertilizers are applied, possibly leading to an increase in the total load of pollutants that reaches water
bodies.
4.3. Resource allocation to different crops
Next to looking at the improvement of physical water productivities (i.e. more crop per drop; see section 4.1), it
is useful to consider the potential to improve economic water productivity (i.e. more value per drop) (Hoekstra,
2013). Similarly, one can argue to consider economic land productivity (Chouchane et al., 2013). In Appendix
VII we therefore show the estimated economic water and land productivity per crop and per basin.
In the period 1996-2005, Morocco’s water resources have been mainly used to produce relatively low-value
water-intensive (in US$/m³) crops such as cereals, olives and almonds. These crops also took the largest share in
the country’s harvested area, although they had the lowest value per hectare of cultivated land (in US$/ha).
Higher economic returns per drop of water and per hectare of land cultivated are generated by production of
grapes, sugar beets, citrus fruits (oranges, mandarins, etc.) and tomatoes.
A different allocation of water and land resources to crops that yield more value per drop and per hectare of land
cultivated could be desirable. It would be worthwhile to consider a different mix of crops to grow, which uses
The water footprint in Morocco / 55
land and water resources more efficiently from a purely economic point of view, for example by producing
more citrus fruits and tomatoes instead of cereals, olives and almonds. From a water resources point of view, it
is wise to base such choices also on the timing of crop water requirements. For example, wheat (with low
economic water productivity) has no blue WF in the severely water scarce month of July, whereas citrus fruits
(with high economic water productivity) have a large blue WF in this month.
The Green Morocco Plan to strengthen the position and increase the importance of Moroccan agriculture
includes plans to transform current production systems, essentially dominated by cereal production, into high
value-added crops, such as olives (77%), almonds (9%) and figs (ADA, 2013). Looking at the value of these
crops per unit of water and cultivated land (see section 3.3), producing olives and almonds instead of cereals
does not seem to be a step towards more economically efficient use of water and land.
Greenhouse cultivation of tomatoes (and other crops) should be encouraged, particularly in combination with
rainwater harvesting. Yields in greenhouses are generally higher than on open fields and greenhouse cultivation
allows for off-season cultivation. From a water resources perspective, it would be useful to optimize the latter in
such a way that the moments when crops need water better coincide with rainfall and natural runoff, thereby
improving use of rainwater and modifying the natural flow regime less severe than currently. Of course, the
choice for the cultivation season is also influenced by other production factors (light and temperature) and, for
export products, trade barriers during certain periods of the year.
Wheat, barley, sugar beets and sugar cane are currently subsidized per unit of production and subsidies exist for
seed handling and storage units for cereals and sugar beets (Ministry of Agriculture and Fisheries of Morocco,
2011). Acquisition of olive plants and date palms is also subsidized as well as the creation of new citrus fruit
plantations (per hectare) (Ministry of Agriculture and Fisheries of Morocco, 2011). The current subsidy system
therefore still provides incentives for the production of relatively low-value water-intensive (in US$/m³) cereals
and olives.
The Green Morocco Plan is built on the principle of aggregation, which is a form of organization based on
bringing together agriculturists for the implementation of agricultural investment projects (ADA, 2013).
However, subsidies for these aggregation projects regarding cereals and olives production are higher for projects
concerning irrigated production than the same projects regarding rain-fed production. For example, aggregation
projects regarding rain-fed production of olives around a complex for trituration and bottling are subsidized for
450 Moroccan Dirham/ha, while the same projects regarding irrigated production of olives are subsidized for
1,100 Moroccan Dirham /ha (Ministry of Agriculture and Fisheries of Morocco, 2011). Of course, aggregation
projects in irrigated agriculture can lead to more efficient use of irrigation water thanks to modern technology
brought by the aggregator. Nevertheless, this difference in subsidy may provide an incentive for aggregators to
invest in and develop irrigated production instead of rain-fed production. Given the high pressure on Moroccan
blue water resources, wise use of rainwater should be encouraged. Increasing green water productivities in
Morocco’s rain-fed areas reduces the need for irrigated production in water-scarce basins, and thus helps to
reduce the blue WF (Hoekstra, 2013). This is relevant for modern agriculture in favourable rain-fed lands, but
56 / The water footprint in Morocco
also for traditional agriculture located in non-irrigated, unfavourable and mountainous areas or oases, which
remains strongly dependent on rainfall (ADA, 2013). The Green Morocco Plan also proposes the experimental
use of semi-desert zones to increase the usable agricultural surface area (ADA, 2013), which will inevitably
increase pressure on blue water resources, because crop growing in the semi-desert is likely to fully rely on
irrigation water.
It should be noted that the choice of which crops to produce (i.e. the cropping pattern) is closely linked to the
demand for crops (national and global) and significant changes in the amount of crops produced are likely to
influence the prices and thus economic water and land productivities. Moreover, the cropping pattern is part of
the national strategy regarding food security. Although the cropping pattern in the large irrigated perimeters of
Morocco is officially liberalized (Ait Kadi, 2002), the previously discussed subsidies influence the farmers’
choices on what to plant.
4.4. Wise virtual water trade
In this section, Morocco’s trade pattern – with its associated virtual water import and use of domestic water
resources for producing export products – is discussed from a water resources point of view. An important note
is that water cannot be used as the only indicator for judging the rationality of trade patterns, because
international trade in agricultural commodities depends on a great variety of factors, including for instance the
availability and cost of land, labour, capital, technology and other endowments, available infrastructure and
costs of engaging in trade, national food policies, taxes and subsidies, trade policies and international trade
agreements (Hoekstra and Chapagain, 2008; Kumar and Singh, 2005). However, given the fact that trade
patterns and policies are generally discussed without taking water into account at all, it is useful to add this
specific perspective to the usual discourse on trade (Hoekstra et al., 2011b).
4.4.1. Virtual water import
Morocco already achieved fairly large water savings by virtual water import in the period 1996-2005 (see
section 3.4.3). This is a result of Morocco’s agricultural strategy which has shifted from the food self-
sufficiency objective to the food security objective, meaning that domestic food needs are met through strategic
levels of national agricultural production and the gap is covered by relying on the international market (Ait
Kadi, 2002). Further externalizing the Moroccan WF through virtual water import could relieve pressure on
Moroccan water resources. There are, however, a number of drawbacks of virtual water import that need to be
considered (Hoekstra, 2013). First, Morocco should be able to generate sufficient foreign exchange to afford
import of water-intensive agricultural commodities. Second, food self-sufficiency might be reduced even further
when food imports increase. Moroccan agriculture is directly responsible for the food security of 30 million
consumers (ADA, 2013). Third, import of agricultural commodities affects the Moroccan agricultural sector: it
reduces employment in this sector and results in economic decline and worsening of land management in rural
areas. Agriculture currently accounts for 15% of GDP and employs 41% of the labour force (World Bank,
2012), the latter even being 80% in rural areas (Ministry of Agriculture and Fisheries of Morocco, 2010).
The water footprint in Morocco / 57
Fourth, since 80% of the 14 million rural inhabitants depend on revenues from the agricultural sector (ADA,
2013), promoting food imports might threaten the livelihoods of those people and reduce access to food for the
poor. Lastly, virtual water imports may reduce pressure on Moroccan water resources, but it may create extra
pressure in the countries where the imports come from. Increasing food (virtual water) imports to relieve
pressure on Moroccan water resources will thus increase food dependency and have negative effects on the
domestic agricultural sector, which plays a critical role in the economic and social stability of Morocco.
Decisions regarding import of water-intensive commodities should carefully take into account these drawbacks.
Moreover, increasing food imports seems to conflict with the aim of the Green Morocco Plan to strengthen the
Moroccan agricultural sector and make it a lever for social and economic development.
The question remains whether the virtual water import in the period 1996-2005 was efficient from a water-
economics point of view. In the period 1996-2005, the average cost of imports was 0.98 US/m³ (equivalent to
1.02 m³ of virtual water per US$ spent) and 0.17 US$/m³ for crop products (equivalent to 5.88 m³ of virtual
water per US$ spent). The average value of export products in the same period was 1.66 US$/m³ (equivalent to
0.60 m³ of virtual water per US$ earned) and 0.87 US$/m³ for crop products (equivalent to 1.15 m³ of virtual
water per US$ earned). It can be said that the imported products required relatively a lot of water per unit of
money spent, while the exported products produced required relatively little water per unit of money earned.
Since the largest part of imports comes from the United States, France, Argentina, Brazil, Canada, the Russian
Federation, China and the Ukraine, Morocco depends on these countries. This constitutes a risk given the chance
that food supplies from these countries could cease for whatever reason.
4.4.2. Virtual water export
About 4% of the water used in the Moroccan agricultural and industrial sector is used for making export
products. The remainder of the water is applied for producing products that are consumed by the Moroccan
population. As pointed out by Hoekstra and Chapagain (2007), it seems appropriate, from a water point of view,
that most of the scarcely available water in Morocco is being used for the production of commodities that are
consumed domestically and not for export.
From an economic point of view, the question is whether the exported commodities yield a relatively high
income of foreign currency per unit of water used. As shown in section 3.4.2, most of the virtual water export
from Moroccan resources relates to the export of products with a relatively low economic value per m³ water
exported, such as wheat (0.02 US$/m³), sugar beets (0.04 US$/m³) and olives (0.10 US$/m³). Oranges give
substantially higher economic value (0.84 US$/m³), but still little given the severe water scarcity in Morocco. Of
the main export crop products analysed in this study only mandarins (1.37 US$/m³) and tomatoes (7.13 US$/m³)
yielded a value larger than the average for crop products. These figures imply that it might be wise to use
Morocco’s scarce water resources to produce mandarins and tomatoes for export instead of low-value water-
intensive crops. However, it should be noted that demand for specific crop products on the world market is
58 / The water footprint in Morocco
limited and large-scale changes in the production for export are likely to have their effect on food prices (thus
affecting the economic value per m³ of water exported).
Part of the Green Morocco plan is to increase the export earnings by 5.5 fold in the upcoming 10 to 15 years in
the sectors where Morocco is competitive: citrus fruits, olives, fruits and vegetables (ADA, 2013). The current
system of state subsidies supports this by subsidizing the export of citrus fruits and tomatoes per ton exported
(Ministry of Agriculture and Fisheries of Morocco, 2011). Export of olive oil and strawberries are subsidized
similarly. Looking at its export value per unit of water consumed, olive production for export does not seem to
be the most beneficial purpose to allocate water to.
It remains unanswered whether the foreign currency earned by export products covers the costs of the water
consumption in Morocco for making these products. This might not be the case considering the costs of the
construction and maintenance of the large dams and intra- and inter-basin water transfers in the country.
Moreover, costs are even higher if one takes into account the costs associated with the negative externalities of
water (over)consumption, such as the salt-intrusion in Morocco’s coastal aquifers. An in-depth review of the
export policy from a water resources point of view is therefore recommended.
5. Added value of Water Footprint Assessment for national water policy
Several insights and response options emerged from the Water Footprint Assessment (WFA) that are currently
not considered in the national water strategy of Morocco and the country’s river basin plans. They include:
(i) New insights in the water balance of Morocco and the country’s main river basins:
• The evaporative losses from storage reservoirs account for a significant part of the blue WF within
Morocco. This sheds fresh light on the national water strategy that proposes to build another 60 large
and 1000 small dams by 2030.
• Blue water scarcity on a monthly scale is severe and hidden by annual analysis of demand versus
supply, which is the common scale of analysis in Morocco’s river basin plans.
(ii) New insights in how economically efficient water and land resources are used:
• Analysis of the economic value of crop products per unit of water and land used in the period 1996-
2005 indicate that agricultural policy may be better brought in line with water policy by reconsidering
which crops to grow.
• It is shown that the export policy in this period was not optimal from a water-economics point of view,
which raises the question whether the foreign income generated by export covers the direct and indirect
costs of mobilization and (over)exploitation of Morocco’s water resources. This might not be the case
considering the costs of the construction and maintenance of the large dams and intra- and inter-basin
water transfers in the country and the costs associated with the negative externalities of water
(over)consumption, such as the salt-intrusion in Morocco’s coastal aquifers.
(iii) New response options to reduce the WF of crop production:
• Analysis of the WF of the main crops in Morocco and its variation across the river basins offers new
ways of looking at reducing water consumption in the agricultural sector. The estimated potential water
savings by partial relocation of crops to basins where they consume less water and by reducing WFs of
crops down to benchmark levels are significant compared to demand reducing and supply increasing
measures considered in the national water strategy of Morocco.
Given these new insights and response options, it is concluded that understanding the WF of activities in
Morocco and the country’s virtual water trade has an added value for formulating national water policy. The
assessment provides a comprehensive water balance and allows critical analysis of the water allocation to
different purposes. The analysis offers a basis for comparing the water consumption of activities and crops
across different regions, which exposes new views on how and where to reduce WFs. In addition, the analysis of
economic water productivities forms a basis for considering if available water resources are used economically
efficient and if the production value per unit of water outweighs the (in)direct costs of water (over)exploitation.
Furthermore, while water resources studies usually focus on blue water scarcity, the study of green and grey
WFs proves to be a useful broadening of the scope of analysis, because more efficient use of green water and a
reduction of the grey WF will contribute to the reduction of the pressure on blue water resources.

6. Discussion
The water footprint (WF) in Morocco is mostly green (77%). This underlines the importance of green water
resources, also (or especially) in semi-arid countries with a high dependency on blue water, and is in line with
other studies showing the dominance of the green over the blue water flow in Africa (and most of the world)
(Rockström et al., 2009; Schuol et al., 2008). The relevance of the green WF should not be underestimated.
Although rain is free and evaporation happens anyway, green water that is used for one purpose cannot be used
for another purpose (Hoekstra, 2013).
Storage reservoir evaporation accounts for a significant share (13%) in the blue WF in Morocco. The need for
seasonal storage of water is evident given the large mismatch in time of natural runoff and water demand (see
Figure 14). However, the large evaporation from reservoirs shows that these should be seen as water consumers,
besides their role in water supply. This WF can ultimately be linked to the end-purpose of the reservoir, which
for most cases in Morocco is primarily serving irrigated agriculture. Therefore, to reduce the need for seasonal
storage and hence the WF of storage reservoirs, it would be worthwhile to take the timing of crop water
demands with respect to natural water availability into account in deciding which crops or crop varieties to
grow. Furthermore, local alternatives to the large surface water reservoirs are groundwater dams, which enhance
underground water storage in alluvial aquifers and thereby loose less water by evaporation (Al-Taiee, 2012).
Our analysis shows that from a strictly water-economics point of view it would be worthwhile to reconsider
which crops to grow in Morocco (due to the low value in US$/m³ and US$/ha for some crops compared to
others). In practice, the choice of which crops to produce is part of the national strategy regarding food security
and closely linked to the demand for crops (national and global). Nevertheless, we consider it useful and
important to analyse economic water and land productivities (as done in this study) in addition to these
considerations. Especially for water-short countries as Morocco it is relevant to evaluate the economic
efficiency of water allocation. This also relates to the question whether the foreign income generated by export
products, which have a footprint on national resources, outweighs the direct and indirect costs associated with
the resource use.
6.1. Uncertainties and limitations
The WF estimates presented in this study include uncertainties that reflect the uncertainties in input data and
assumptions used and the limitations of the study. Estimates from this study of the total WF of irrigation (i.e. the
blue WF of crop production plus the WF of the irrigation supply network, but excluding the WF of storage
reservoirs) are compared with the volume of water supplied to farmers for irrigation in the current situation
(2010, for most basins) as recorded in the river basin plans (Figure 17). They correlate quite well, but the
number of data points is limited. The WF of irrigation is consistently lower than the water supply to irrigation.
The precise reason for this cannot be pointed out, since the blue WF of crop production is largely influenced by
the input data used and assumptions made by Mekonnen and Hoekstra (2010b), but their blue WF estimates can
easily contain an uncertainty of ±20% (Hoff et al., 2010; Mekonnen and Hoekstra, 2010a,b). However, it is to
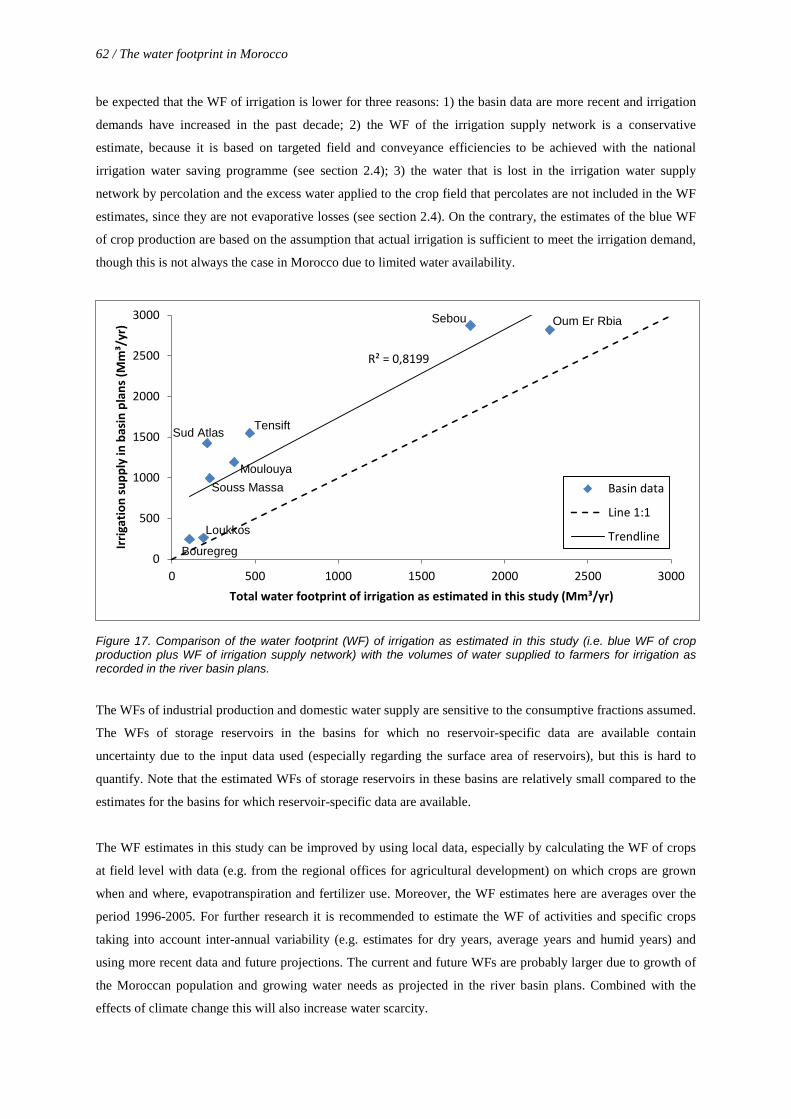
62 / The water footprint in Morocco
be expected that the WF of irrigation is lower for three reasons: 1) the basin data are more recent and irrigation
demands have increased in the past decade; 2) the WF of the irrigation supply network is a conservative
estimate, because it is based on targeted field and conveyance efficiencies to be achieved with the national
irrigation water saving programme (see section 2.4); 3) the water that is lost in the irrigation water supply
network by percolation and the excess water applied to the crop field that percolates are not included in the WF
estimates, since they are not evaporative losses (see section 2.4). On the contrary, the estimates of the blue WF
of crop production are based on the assumption that actual irrigation is sufficient to meet the irrigation demand,
though this is not always the case in Morocco due to limited water availability.
Figure 17. Comparison of the water footprint (WF) of irrigation as estimated in this study (i.e. blue WF of crop production plus WF of irrigation supply network) with the volumes of water supplied to farmers for irrigation as recorded in the river basin plans.
The WFs of industrial production and domestic water supply are sensitive to the consumptive fractions assumed.
The WFs of storage reservoirs in the basins for which no reservoir-specific data are available contain
uncertainty due to the input data used (especially regarding the surface area of reservoirs), but this is hard to
quantify. Note that the estimated WFs of storage reservoirs in these basins are relatively small compared to the
estimates for the basins for which reservoir-specific data are available.
The WF estimates in this study can be improved by using local data, especially by calculating the WF of crops
at field level with data (e.g. from the regional offices for agricultural development) on which crops are grown
when and where, evapotranspiration and fertilizer use. Moreover, the WF estimates here are averages over the
period 1996-2005. For further research it is recommended to estimate the WF of activities and specific crops
taking into account inter-annual variability (e.g. estimates for dry years, average years and humid years) and
using more recent data and future projections. The current and future WFs are probably larger due to growth of
the Moroccan population and growing water needs as projected in the river basin plans. Combined with the
effects of climate change this will also increase water scarcity.
R² = 0,8199
0
500
1000
1500
2000
2500
3000
0 500 1000 1500 2000 2500 3000
Irrig
atio
n su
pply
in b
asin
pla
ns (M
m³/
yr)
Total water footprint of irrigation as estimated in this study (Mm³/yr)
Basin data
Line 1:1
Trendline
Oum Er Rbia
Tensift
Bouregreg
Sebou
Moulouya Souss Massa
Loukkos
Sud Atlas
The water footprint in Morocco / 63
Although figures on water availability are obtained from the river basin plans or the Ministry of Energy, Mining,
Water and Environment (EMWE), the way they are precisely estimated is often unclear and so is the uncertainty
in them. River basin plans are developed by consultants in commission of the river basin agencies. The Water
Law prescribes that these plans should include, among others, an assessment of the quantitative evolution of the
hydrological resources in the basin (Official State Gazette, 1995). However, methods and definitions to do so
are not formally established.
In general, the river basin plans indicate larger pressure on groundwater resources than suggested in this study.
This might be caused by the fact that the river basin plans include more recent withdrawals and because the unit
of analysis in this study (river basin agency action zone) is larger than the unit used in the river basin plans
(individual aquifers), whereby in this study overexploitation of one aquifer might be masked by low exploitation
of another. Also local pollution according to the river basin plans is sometimes worse than the water pollution
level estimated here. This could be explained by the fact that the water quality measurements recorded in the
basin plans are partly more recent and are measured at specific points, whereas this study considered average
concentration levels of nitrates in the groundwater.
Given the uncertainties and limitations of the study, the presented WF estimates and water scarcity values
should be interpreted with care. Nevertheless, the order of magnitude of the estimates in this study gives a good
indication to which activities and crops Morocco’s water resources are allocated, in which months and basins
the WFs are relatively large or small and where and when this leads to highest water scarcity.
The economic water and land productivities of crops (EWP and ELP) are, apart from the WFs and yields,
dependent on the producer prices. Variations in these prices largely influence the EWP and ELP of crops. The
results presented in this study show that Moroccan water and land could have been used economically more
efficient in the period 1996-2005. Future decisions on what crops to grow in order to make more economically
efficient use of water and land resources should be based on an elaborate analysis of current (and future) WFs
and prices. Decisions that influence international crop trade should include considerations of the earnings per m³
of water exported (and costs per m³ water imported).
Uncertainties in the estimated potential water savings by partial relocation of crop production are closely linked
to the uncertainties in the estimates of the WFs of crop production. Details on the areas of land allocated to
specific crops and the associated production and WFs should be interpreted carefully. However, the order of
magnitude of the estimated savings gives a rough indication of the potential of this measure. When considering
relocation of crop production it is necessary to assess how the green and especially blue WFs of crops manifest
themselves on a monthly scale. This study looked at annual water savings, but the associated relocation of crops
might well aggravate monthly water scarcity in some river basins. Furthermore, the feasibility and desirability of
relocation of crop production are of course largely determined by social and economic factors that should be
taken into account as well. Besides, one should keep in mind that the estimated water savings by relocating crop
production depend on the spatial differences in water productivities found; the same water savings may be
obtained by increasing water productivities in the places where they are currently low.

7. Conclusions
Main results of the Water Footprint Assessment are:
• The total water footprint (WF) of Moroccan production in the period 1996-2005 was 38.8 Gm³/yr (77%
green, 18% blue, 5% grey). Crop production is the largest contributor to this WF, mainly related to the
production of wheat and barley, followed by olives and maize. Evaporation from storage reservoirs accounts
for the second largest form of blue water consumption nationally, after irrigated crop production. Largest
WFs are found in the basins Oum Er Rbia and Sebou, the main agricultural areas. The green WF is largest in
the rainy period December-May, whereas the blue WF is largest in the period April-September when
irrigation demands increase.
• In the period 1996-2005, Morocco’s water resources have been mainly used to produce relatively low-value
water-intensive (in US$/m³) crops such as cereals, olives and almonds. These crops also took the largest
share in the country’s harvested area in the same period, although they had the lowest value per hectare
cultivated (in US$/ha). More economic return per drop and per hectare of land cultivated was generated by
production of grapes, sugar beets, citrus fruits (oranges and mandarins etc.) and tomatoes.
• Morocco was a net virtual water importer in the period 1996-2005. Virtual water import was 12.6 Gm³/yr
with an average cost of 0.98 US$/m³ and virtual water export was 4.3 Gm³/yr with an average earning of
1.66 US$/m³. Only 31% of the virtual water export originated from Moroccan water resources (remainder
was re-export). Virtual water import and export were for 95% and 91% related to trade in crop products,
respectively. By import of products instead of producing them domestically, Morocco saved 27.8 Gm³/yr
(75% green, 21% blue and 4% grey) of domestic water, equivalent to 72% of the WF within Morocco.
• Blue water scarcity on a monthly scale is severe in all river basins. Seasonal shortages result in high
alteration of natural runoff. Also groundwater scarcity and pollution are significant in most basins, especially
in the basins of Bouregreg, Oum Er Rbia and Tensift. In order to move towards sustainable use of
Morocco’s blue water resources, discussing and agreeing on blue WF caps, per river basin, per month and
for surface and groundwater separately, would be useful.
• Potential green plus blue water savings by partial relocation of crop production across basins are in the order
of 1.9 and 1.2 billion m³ per year when all main crops or only annual crops are relocated, respectively.
Lowering the WFs of the main crops in each river basin down to benchmarks (which are defined as the
lowest water consumption of a crop in a comparable basin) can lead to estimated green plus blue water
savings of 2,768 Mm³/yr. When the water productivities of the twelve main water-consuming crops were to
be improved by 10% throughout Morocco, it could potentially save 2,462 Mm³/yr of water (green plus blue).
• Morocco obtained fairly large savings by food (virtual water) imports in the period 1996-2005 (27.8 Gm³/yr,
see above). Increasing food imports to relieve pressure on domestic water resources increases food
dependency and has negative effects on the domestic agricultural sector, which plays a critical role in the
economic and social stability of Morocco.
• About 4% of the water used in the Moroccan agricultural and industrial sector is used for making export
products (in the period 1996-2005). The remainder is applied for producing products that are consumed by
66 / The water footprint in Morocco
the Moroccan population. However, most of the virtual water export from Moroccan resources relates to the
export of products with a relatively low economic value per m³ water exported (in US$/m³).
On the basis of these new insights and response options it is concluded that Water Footprint Assessment has an
added value for national water policy in Morocco. Water Footprint Assessment forces to look at end-users and -
purposes of freshwater, which is key in determining efficient and equitable water allocation within the
boundaries of what is environmentally sustainable, both on the river basin and on the national level. This is
especially relevant for water-scarce countries such as Morocco. Furthermore, considering the green and grey
components of a WF provides new perspectives on blue water scarcity, because pressure on blue water
resources might be reduced by more efficient use of green water and by less pollution.
References
ABH Bouregreg et de la Chaouia (2007) PDAIRE Mission I.3: Evaluation qualitative des ressources en eau et
des écosystèmes aquatiques: Rapport définitif.
ABH Bouregreg et de la Chaouia (2008) PDAIRE Mission II: Evaluation des besoins en eau et des utilisations
potentielles des ressources en eau et des écosystèmes aquatiques: Volet demande Agricole.
ABH Bouregreg et de la Chaouia (2009) PDAIRE Mission II: Evaluation des besoins en eau et des utilisations
potentielles des ressources en eau et des écosystèmes aquatiques: Volet demande AEPI.
ABH Bouregreg et de la Chaouia (2012) Le plan directeur d’aménagement intégré des ressources en eau du
bassin hydraulique du Bouregreg et de la Chaouia: Rapport de synthèse.
ABH Loukkos (2011) Projet du plan directeur intégré des ressources en eau des bassins du Loukkos, du
Tangerois et côtiers méditerranéens: Rapport final.
ABH Moulouya (2011) Etude du plan directeur d’aménagement intégré des ressources en eau du bassin de la
Moulouya (PDAIRE): Rapport de synthèse.
ABH Oum Er Rbia (2009) PDAIRE Sous Mission I.3.3.
ABH Oum Er Rbia (2011) Etude du plan directeur d’aménagement intégré des ressources en eau du bassin de
l’Oum Er Rbia et des bassins côtiers atlantiques: Résumé synthétique.
ABH Sebou (2011) Etude d’actualisation du plan directeur d’amenagement integre ses ressources en eau du
bassin hydraulique de Sebou: Rapport du PDAIRE.
ABH Souss Massa Draa (n.d.a) PDAIRE Draa Arabic summary.
ABH Souss Massa Draa (n.d.b) PDAIRE Souss Massa Arabic summary.
ABH Tensift (2011) Etude de revision du plan directeur d’amenagement integre des ressources en eau
(PDAIRE) du bassin du Tensift Ksob et Iguezoullen: Note de synthese.
ADA (2013) Green Morocco Plan, www.ada.gov.ma/en/Plan_Maroc_Vert/plan-maroc-vert.php (consulted 12
July 2013).
Ait Kadi, M. (2002) Irrigation water pricing policy in Morocco's large scale irrigation projects, In: Hamdy A.,
Lacirignola C. and Lamaddalena N. (eds.) Water valuation and cost recovery mechanisms in the
developing countries of the Mediterranean region, Options Méditerranéennes: Série A Séminaires
Méditerranéens No. 49, Centre International de Hautes Etudes Agronomiques Méditerranéennes
(CIHEAM), Bari, Italy, pp. 51-71, http://om.ciheam.org/om/pdf/a49/02001533.pdf (retrieved 17 July
2013).
Aldaya, M.M., Garrido, A., Llamas, M.R., Varelo-Ortega, C., Novo, P., and Casado, R.R. (2010a) Water
footprint and virtual water trade in Spain, In: Garrido, A. and Llamas, M.R. (eds.) Water policy in Spain,
CRC Press, Leiden, the Netherlands, pp. 49-59.
Aldaya, M.M., Martinez-Santos, P. and Llamas, M.R. (2010b) Incorporating the water footprint and virtual
water into policy: Reflections from the Mancha Occidental Region, Spain, Water Resources
Management, 24(5): 941-958.
Al-Taiee, T. M. (2012) Groundwater dams: A promise option for sustainable development of water resources in
arid and semi-arid regions, In: UNESCO, Proceedings of the Second International Conference on
68 / The water footprint in Morocco
integrated water resources management and challenges of the sustainable development, Agadir, 24-26
March 2010, IHP-VII Series on Groundwater No. 4, UNESCO, pp. 35-41.
Chahed, J., Besbes, M. and Hamdane, A. (2011) Alleviating water scarcity by optimizing "Green Virtual-
Water": the case of Tunisia, In: Hoekstra, A.Y., Aldaya, M.M. and Avril, B. (eds.) Proceedings of the
ESF Strategic Workshop on accounting for water scarcity and pollution in the rules of international trade,
Amsterdam, 25-26 November 2010, Value of Water Research Report Series No. 54, UNESCO-IHE,
Delft, the Netherlands, pp. 99-113.
Chapagain, A.K. and Hoekstra, A.Y. (2003) Virtual water flows between nations in relation to trade in livestock
and livestock products, Value of Water Research Report Series No.13, UNESCO-IHE, Delft, the
Netherlands.
Chouchane, H., Hoekstra, A.Y., Krol, M.S. and Mekonnen, M.M. (2013) Water footprint of Tunisia from an
economic perspective, Value of Water Research Report Series No. 61, UNESCO-IHE, Delft, the
Netherlands.
Direction de la Region Hydraulique du Guir Rheris Ziz (2012) Actualisation du Plan Directeur Intégré des
Ressources en Eau des bassin de Guir Ziz Rhéris et Maîder: Resumé du PDAIRE.
EMWIS (2012) EMWIS Flash, N105, November 2012, www.emwis.net/thematicdirs/eflash/flash105 (retrieved
8 December 2012).
FAO (2003) Review of world water resources by country, Water Reports 23, Food and Agriculture
Organization, Rome, Italy, www.fao.org/docrep/005/y4473e/y4473e0c.gif (retrieved 4 June 2013).
FAO (2013a) AQUASTAT online database, Country fact sheet: Morocco, Food and Agriculture Organization,
Rome, Italy, www.fao.org/nr/aquastat/ (retrieved 22 February 2013).
FAO (2013b) AQUASTAT online database, Geo-referenced database of African dams, Food and Agriculture
Organization, Rome, Italy, www.fao.org/nr/water/aquastat/dams/region/D_Africa.xlsx (retrieved 28
March 2013).
FAO (2013c) AQUASTAT online database, Water balance sheet: Morocco, Food and Agriculture Organization,
Rome, Italy, www.fao.org/nr/aquastat/ (retrieved 22 February 2013).
FAO (2013d) FAOSTAT online database, Food and Agriculture Organization, Rome, http://faostat.fao.org
(retrieved 6 July 2013).
FAO (2013e) Global map of monthly reference evapotranspiration - 10 arc minutes. GeoNetwork: grid database,
Food and Agriculture Organization, Rome, Italy,
www.fao.org/geonetwork/srv/en/resources.get?id=7416&fname=ref_evap_fao_10min.zip&access=private
(retrieved 19 March 2013).
Hachimi, M. (2009) Agences de Bassins Hydrauliques & Gouvernance de l’eau [pdf document, presentation
slides], www.oecd.org/mena/governance/43316384.pdf (retrieved 8 December 2012).
Hoekstra, A.Y. (ed.) (2003) Virtual water trade: Proceedings of the International Expert Meeting on Virtual
Water Trade, Delft, The Netherlands, 12-13 December 2002, Value of Water Research Report Series
No.12, UNESCO-IHE, Delft, the Netherlands.
Hoekstra, A.Y. (2013) The water footprint of modern consumer society, Routledge, London, UK.
The water footprint in Morocco / 69
Hoekstra, A.Y. and Chapagain, A.K. (2007) The water footprints of Morocco and the Netherlands: Global water
use as a result of domestic consumption of agricultural commodities, Ecological Economics, 64(1): 143-
151.
Hoekstra, A.Y. and Chapagain, A.K. (2008) Globalization of water: Sharing the planet's freshwater resources,
Blackwell Publishing, Oxford, UK.
Hoekstra, A.Y., Chapagain, A.K., Aldaya, M.M. and Mekonnen, M.M. (2011a) The water footprint assessment
manual: Setting the global standard, Earthscan, London, UK.
Hoekstra, A.Y., Aldaya, M.M. and Avril, B. (eds.) (2011b) Proceedings of the ESF Strategic Workshop on
accounting for water scarcity and pollution in the rules of international trade, Amsterdam, 25-26
November 2010, Value of Water Research Report Series No. 54, UNESCO-IHE, Delft, the Netherlands.
Hoekstra, A.Y., Mekonnen, M.M., Chapagain, A.K., Mathews, R.E. and Richter, B.D. (2012) Global monthly
water scarcity: Blue water footprints versus blue water availability, PLoS ONE, 7(2): e32688.
Hoff, H., Falkenmark, M., Gerten, D., Gordon, L., Karlberg, L. and Rockström, J. (2010) Greening the global
water system, Journal of Hydrology, 384: 177–186.
INECO (2009) Institutional framework and decision-making practices for water management in the Oum Er
Rbia Basin, Morocco: Towards the development of a strategy for increasing efficiency in irrigation water
use, http://environ.chemeng.ntua.gr/ineco/UserFiles/File/Deliverables/Publishable%20Report%20-
%20Morocco.pdf (retrieved 14 November 2012).
ITC (2007) Statistics for International Trade Analysis (SITA) version 1996–2005, Standard International Trade
Classification (SITC), International Trade Centre, Geneva, Switzerland.
IUCN (2010) Integration of biodiversity in the decision-making process: Lessons learnt from the Moulouya
Projects, Data compiled by Professor Mohammed Melhaoui, University of Oujda, Morocco, 65 pages,
http://cmsdata.iucn.org/downloads/moulouya_lessons_learned.pdf (retrieved 18 July 2013).
JICA, MATEE and ABHT (2007) Etude du plan de gestion intégrée des ressources en eau dans la plaine du
Haouz, Royaume du Maroc, Rapport intermédiaire.
Kumar, M.D. and Singh, O.P. (2005) Virtual water in global food and water policy making: is there a need for
rethinking? Water Resources Management, 19: 759–789.
Laouina, A. (2001) Compétition irrigation/eau potable en region de stress hydrique: le cas de la region d'Agadir
(Maroc), In: Camarda D. and Grassini L. (eds.) Interdependency between agriculture and urbanization:
Conflicts on sustainable use of soil and water, Options Méditerranéennes: Série A Séminaires
Méditerranéens No. 44, Centre International de Hautes Etudes Agronomiques Méditerranéennes
(CIHEAM), Bari, Italy, pp. 17-31.
Mekonnen, M.M. and Hoekstra, A.Y. (2010a) A global and high-resolution assessment of the green, blue and
grey water footprint of wheat, Hydrology and Earth System Sciences, 14(7), 1259−1276.
Mekonnen, M.M. and Hoekstra, A.Y. (2010b) The green, blue and grey water footprint of crops and derived
crop products, Value of Water Research Report Series No.47, UNESCO-IHE, Delft, the Netherlands.
Mekonnen, M.M. and Hoekstra, A.Y. (2010c) The green, blue and grey water footprint of farm animals and
animal products, Value of Water Research Report Series No.48, UNESCO-IHE, Delft, the Netherlands.
70 / The water footprint in Morocco
Mekonnen, M.M. and Hoekstra, A.Y. (2011) National water footprint accounts: the green, blue and grey water
footprint of production and consumption, Value of Water Research Report Series No.50, UNESCO-IHE,
Delft, the Netherlands.
Ministry of Agriculture and Fisheries of Morocco (2010) l’Agriculture Marocaine en chiffres.
Ministry of Agriculture and Fisheries of Morocco (2011) Fonds de Developpement Agricole: Les Aides
Financières de l’Etat pour l’encouragement des investissements agricoles, Edition Avril 2011.
Ministry EMWE (2011) Stratégie Nationale de l’Eau, www.minenv.gov.ma/PDFs/EAU/strategie_eau.pdf
(retrieved 21 January 2013).
Ministry EMWE (2012a) Les eaux souterraines, www.water.gov.ma/index.cfm?gen=true&id=12&ID_PAGE=42
(consulted 8 December 2012).
Ministry EMWE (2012b) Présentation générale, www.water.gov.ma/index.cfm?gen=true&id=12 (consulted 8
December 2012).
Ministry EMWE (2013a) Data AEP modulation PWS: Version 9 [xls document].
Ministry EMWE (2013b) Historical runoff time series [RIBASIM data file], spreadsheet "Time series Inflow
V5.xls".
Ministry EMWE (2013c) Open water evaporation per reservoir (average values for each year) [RIBASIM data
file], spreadsheet "Rainfall and evaporation time series for dams V1.xlsx".
Minoia, P. (2012) Mega-irrigation and neoliberalism in postcolonial states: evolution and crisis in the Gharb
Plain (Morocco), Geografiska Annaler: Series B, Human Geography, 94 (3): 269-286.
NIMA (2013) Digital Terrain Elevation Data (DTED) Level 0 [Data file], GeoCommunity, GIS Depot,
http://data.geocomm.com/catalog/MO/group121.html (retrieved 8 March 2013).
Official State Gazette (1995) Royal Decree no. 1-95-154 promulgating Law no. 10-95 on water,
http://ebookbrowse.com/royal-decree-no-1-95-154-promulgating-law-on-water-en-pdf-d211458096
(retrieved 3 January 2013).
Poff, N.L., Richter, B.D., Aarthington, A.H., Bunn, S.E., Naiman, R.J., Kendy, E., Acreman, M., Apse, C.,
Bledsoe, B.P., Freeman, M.C., Henriksen, J., Jacobson, R.B., Kennen, J.G., Merritt, D.M., O’Keeffe,
J.H., Olden, J.D., Rogers, K., Tharme, R.E. and Warner, A. (2010) The ecological limits of hydrologic
alteration (ELOHA): A new framework for developing regional environmental flow standards,
Freshwater Biology, 55(1): 147-170.
Riad, S. (2003) Typologie et analyse hydrologique des eaux superficielles à partir de quelques bassins versants
représentatifs du Maroc, (Unpublished thesis), Université Lille1 - Sciences et Technologies, http://ori-
nuxeo.univ-lille1.fr/nuxeo/site/esupversions/e5d351a6-ce4c-4b64-b891-84d85f3d8f02 (retrieved 19 June
2013).
Schyns, J.F. and Hoekstra, A.Y. (2014) The added value of Water Footprint Assessment for national water
policy: A case study for Morocco, PLOS ONE, 9(6): e99705.
Self, J.R. and Waskom, R.M. (2013) Nitrates in drinking water: fact sheet no. 0.517, Colorado State University
Extension, www.ext.colostate.edu/pubs/crops/00517.pdf (retrieved 10 July 2013).
Shahin, M. (2007) Water resources and hydrometeorology of the Arab Region, Springer, Dordrecht, the
Netherlands, http://dx.doi.org/10.1007/1-4020-5414-9 (retrieved 14 December 2012).

The water footprint in Morocco / 71
Sperna Weiland, F. C., van Beek L. P. H., Kwadijk, J. C. J. and Bierkens, M. F. P. (2010) The ability of a GCM-
forced hydrological model to reproduce global discharge variability, Hydrology and Earth System
Sciences, 14: 1595-1621.
Tekken, V. and Kropp, J.P. (2012) Climate-driven or human-induced: Indicating severe water scarcity in the
Moulouya River Basin (Morocco), Water, 4: 959-982.
World Bank (2012) World DataBank online database, World Development Indicators & Global Development
Finance, http://databank.worldbank.org/ddp/home.do?Step=2&id=4 (retrieved 28 November 2012).

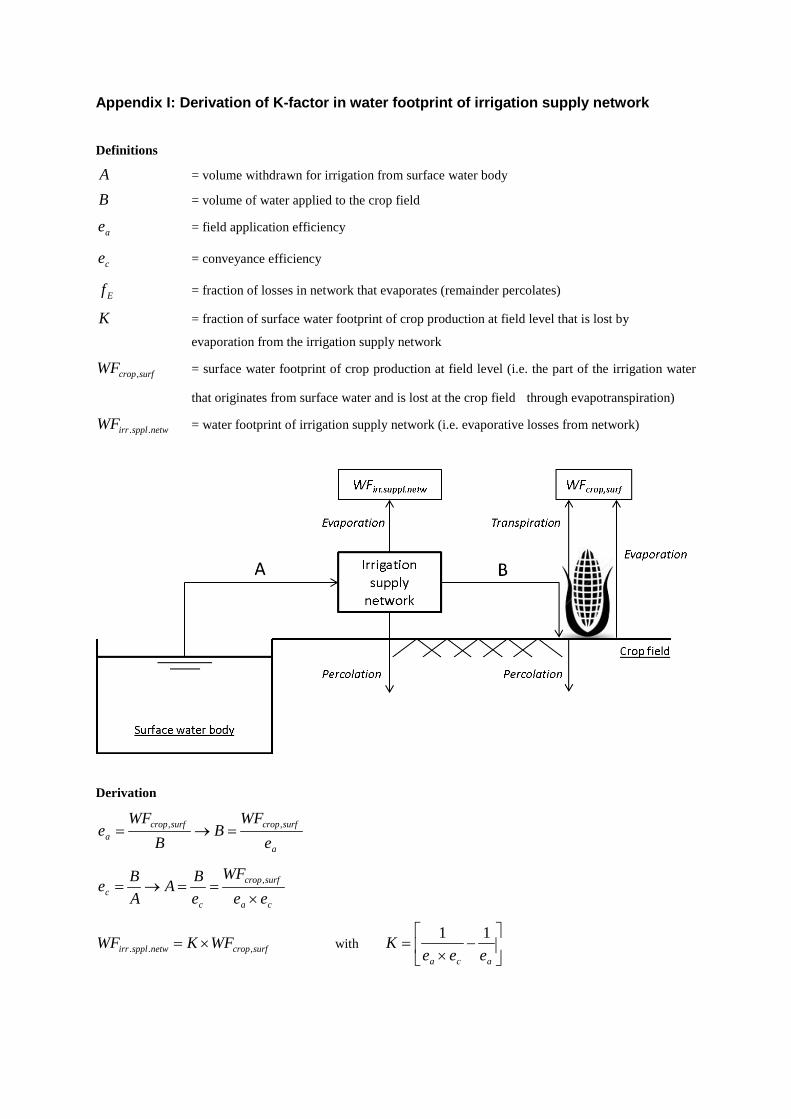
Appendix I: Derivation of K-factor in water footprint of irrigation supply network
Definitions
A = volume withdrawn for irrigation from surface water body
B = volume of water applied to the crop field
ae = field application efficiency
ce = conveyance efficiency
Ef = fraction of losses in network that evaporates (remainder percolates)
K = fraction of surface water footprint of crop production at field level that is lost by
evaporation from the irrigation supply network
surfcropWF , = surface water footprint of crop production at field level (i.e. the part of the irrigation water
that originates from surface water and is lost at the crop field through evapotranspiration)
netwspplirrWF .. = water footprint of irrigation supply network (i.e. evaporative losses from network)
Derivation
a
surfcropsurfcropa e
WFB
BWF
e ,, =→=
ca
surfcrop
cc ee
WFeBA
ABe
×==→= ,
surfcropnetwspplirr WFKWF ,.. ×= with
−
×=
aca eeeK 11

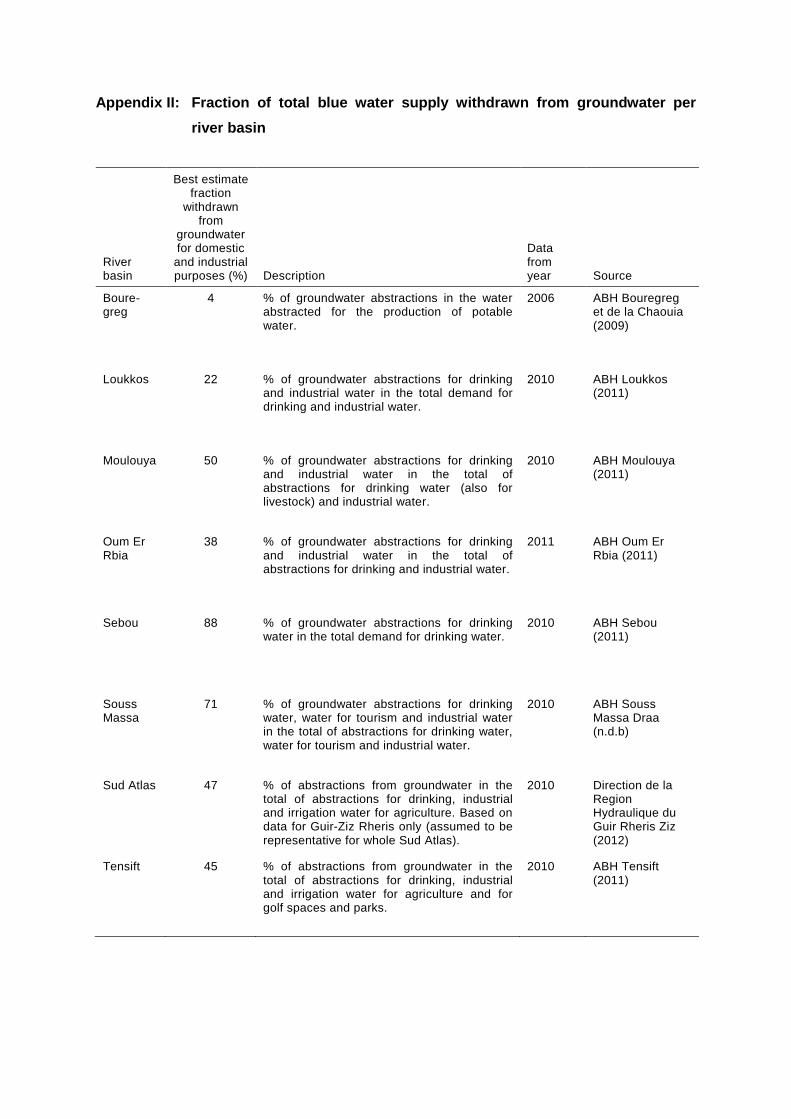
Appendix II: Fraction of total blue water supply withdrawn from groundwater per river basin
River basin
Best estimate fraction
withdrawn from
groundwater for domestic and industrial purposes (%) Description
Data from year Source
Boure-greg
4 % of groundwater abstractions in the water abstracted for the production of potable water.
2006 ABH Bouregreg et de la Chaouia (2009)
Loukkos 22 % of groundwater abstractions for drinking and industrial water in the total demand for drinking and industrial water.
2010 ABH Loukkos (2011)
Moulouya 50 % of groundwater abstractions for drinking and industrial water in the total of abstractions for drinking water (also for livestock) and industrial water.
2010 ABH Moulouya (2011)
Oum Er Rbia
38 % of groundwater abstractions for drinking and industrial water in the total of abstractions for drinking and industrial water.
2011 ABH Oum Er Rbia (2011)
Sebou 88 % of groundwater abstractions for drinking water in the total demand for drinking water.
2010 ABH Sebou (2011)
Souss Massa
71 % of groundwater abstractions for drinking water, water for tourism and industrial water in the total of abstractions for drinking water, water for tourism and industrial water.
2010 ABH Souss Massa Draa (n.d.b)
Sud Atlas 47 % of abstractions from groundwater in the total of abstractions for drinking, industrial and irrigation water for agriculture. Based on data for Guir-Ziz Rheris only (assumed to be representative for whole Sud Atlas).
2010 Direction de la Region Hydraulique du Guir Rheris Ziz (2012)
Tensift 45 % of abstractions from groundwater in the total of abstractions for drinking, industrial and irrigation water for agriculture and for golf spaces and parks.
2010 ABH Tensift (2011)
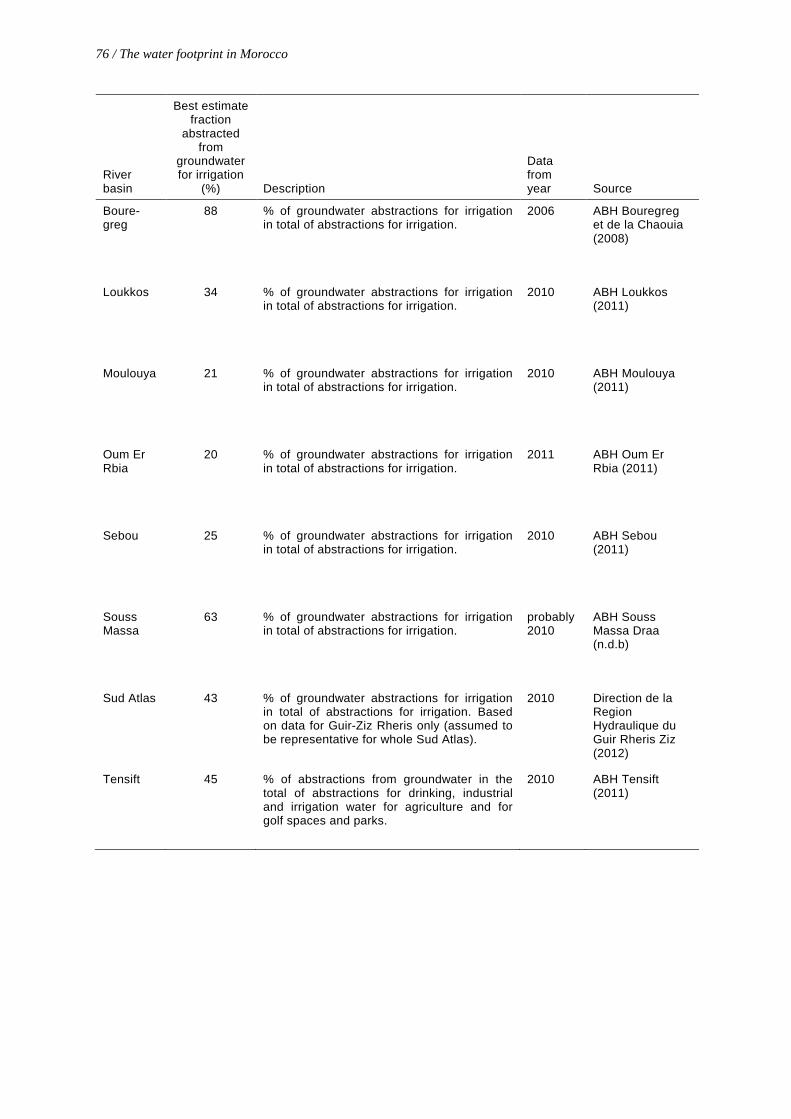
76 / The water footprint in Morocco
River basin
Best estimate fraction
abstracted from
groundwater for irrigation
(%) Description
Data from year Source
Boure-greg
88 % of groundwater abstractions for irrigation in total of abstractions for irrigation.
2006 ABH Bouregreg et de la Chaouia (2008)
Loukkos 34 % of groundwater abstractions for irrigation in total of abstractions for irrigation.
2010 ABH Loukkos (2011)
Moulouya 21 % of groundwater abstractions for irrigation in total of abstractions for irrigation.
2010 ABH Moulouya (2011)
Oum Er Rbia
20 % of groundwater abstractions for irrigation in total of abstractions for irrigation.
2011 ABH Oum Er Rbia (2011)
Sebou 25 % of groundwater abstractions for irrigation in total of abstractions for irrigation.
2010 ABH Sebou (2011)
Souss Massa
63 % of groundwater abstractions for irrigation in total of abstractions for irrigation.
probably 2010
ABH Souss Massa Draa (n.d.b)
Sud Atlas 43 % of groundwater abstractions for irrigation in total of abstractions for irrigation. Based on data for Guir-Ziz Rheris only (assumed to be representative for whole Sud Atlas).
2010 Direction de la Region Hydraulique du Guir Rheris Ziz (2012)
Tensift 45 % of abstractions from groundwater in the total of abstractions for drinking, industrial and irrigation water for agriculture and for golf spaces and parks.
2010 ABH Tensift (2011)
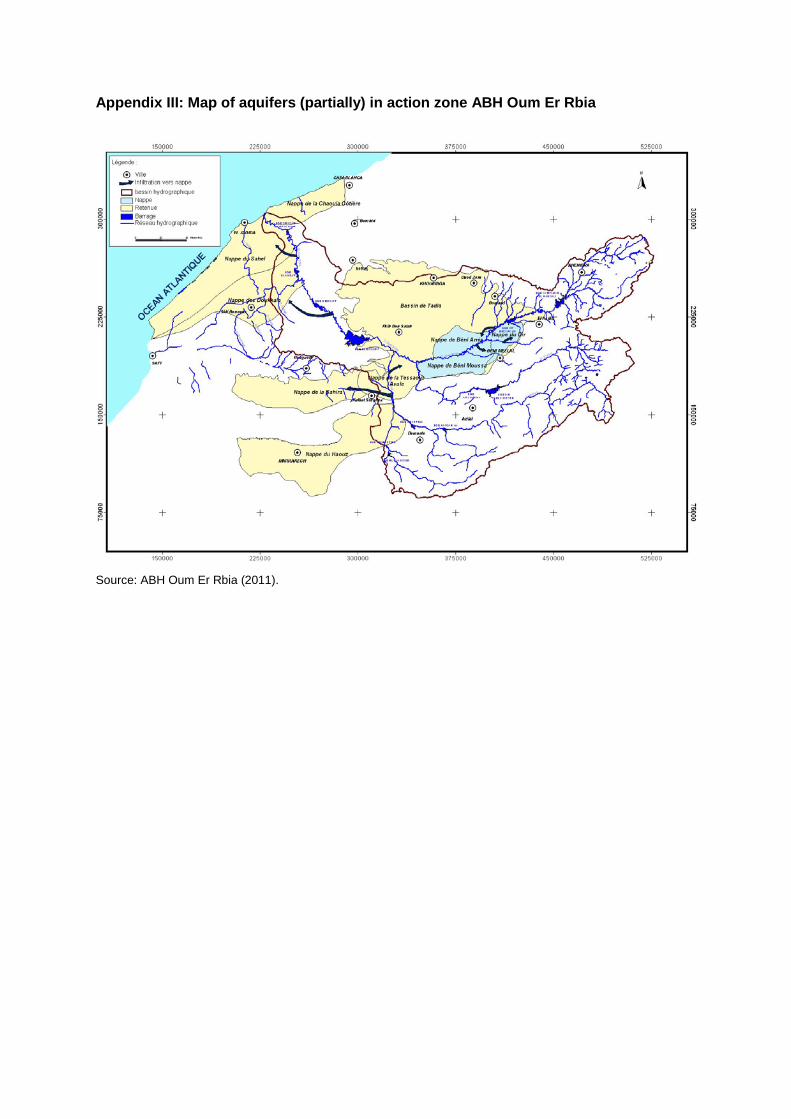
Appendix III: Map of aquifers (partially) in action zone ABH Oum Er Rbia
Source: ABH Oum Er Rbia (2011).

Appendix IV: Open water evaporation from different sources
The table below shows how the best estimates of open water evaporation in the river basins compare with each
other and with reference evapotranspiration by FAO (2013e). The first main column relates to the estimates used
in this study, namely reservoir specific data from the Ministry EMWE (2013c) for four basins and estimates
from the global hydrological model PCR-GLOBWB for the other basins (Sperna Weiland et al., 2010). The
second column shows the variation in estimates across the basins according to PCRGLOB-WB estimates only.
For comparison, the third column shows variation in reference evapotranspiration across the basins.
Ministry EMWE (1939-2011) (*) & PCRGLOB-WB (1961-1990) PCRGLOB-WB (1961-1990)
Reference evapotranspiration (1961-1990)
Rank Basin
EO (mm/ yr) Rank Basin
EO (mm/ yr) Rank Basin
ET0 (mm/ yr)
1 Souss Massa 2,193 1 Souss Massa 2,193 1 Sud Atlas 1,652
2 Oum Er Rbia* 1,956 2 Tensift 1,850 2 Souss Massa 1,450
3 Tensift 1,850 3 Sud Atlas 1,702 3 Moulouya 1,409
4 Sud Atlas 1,702 4 Oum Er Rbia 1,597 4 Tensift 1,389
5 Bouregreg* 1,529 5 Bouregreg 1,326 5 Oum Er Rbia 1,387
6 Loukkos* 1,472 6 Sebou 1,257 6 Sebou 1,266
7 Sebou* 1,390 7 Moulouya 1,228 7 Bouregreg 1,239
8 Moulouya 1,228 8 Loukkos 1,159 8 Loukkos 1,212
Sources: open water evaporation for basins with (*) from Ministry EMWE (2013c); open water evaporation from
PCRGLOB-WB simulation from Sperna Weiland et al. (2010); reference evapotranspiration from FAO (2013e).

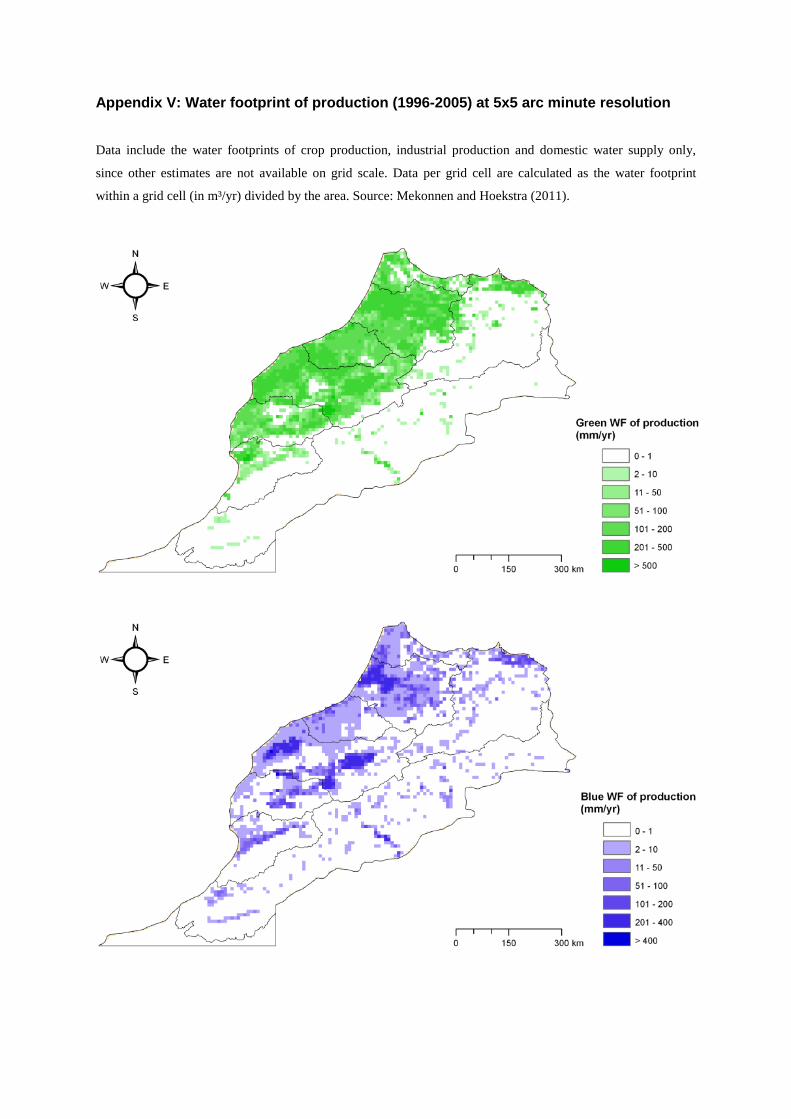
Appendix V: Water footprint of production (1996-2005) at 5x5 arc minute resolution
Data include the water footprints of crop production, industrial production and domestic water supply only,
since other estimates are not available on grid scale. Data per grid cell are calculated as the water footprint
within a grid cell (in m³/yr) divided by the area. Source: Mekonnen and Hoekstra (2011).
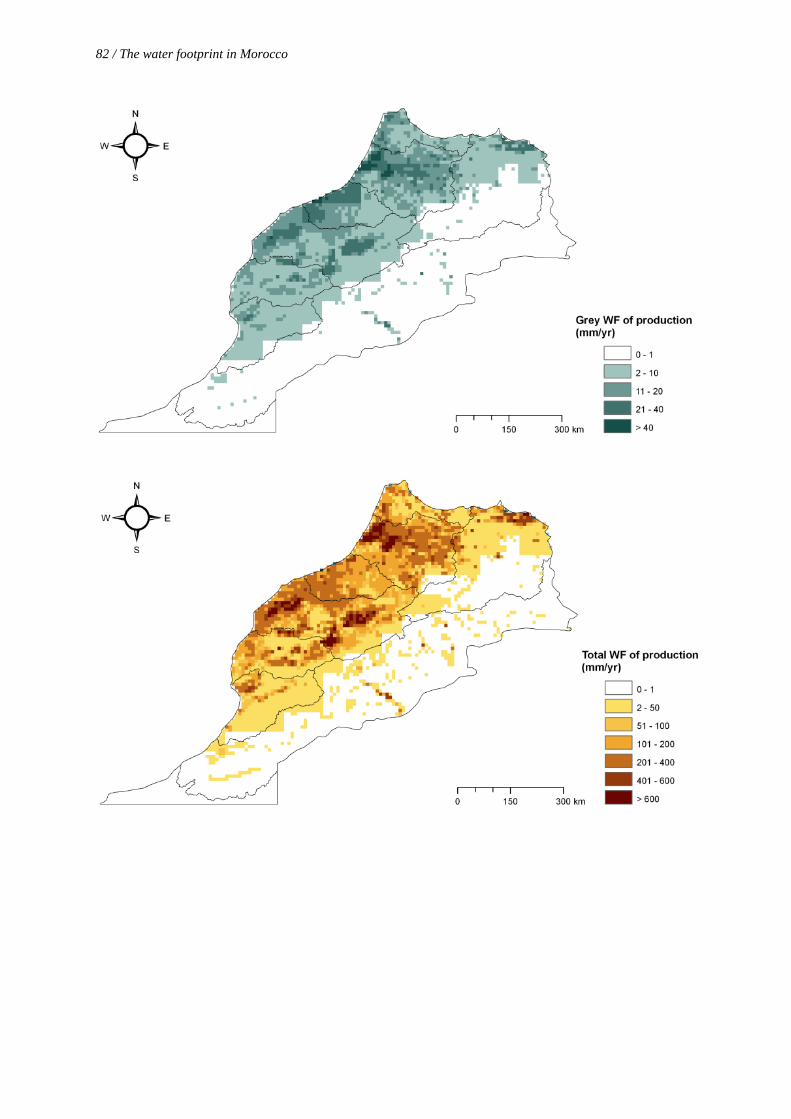
82 / The water footprint in Morocco
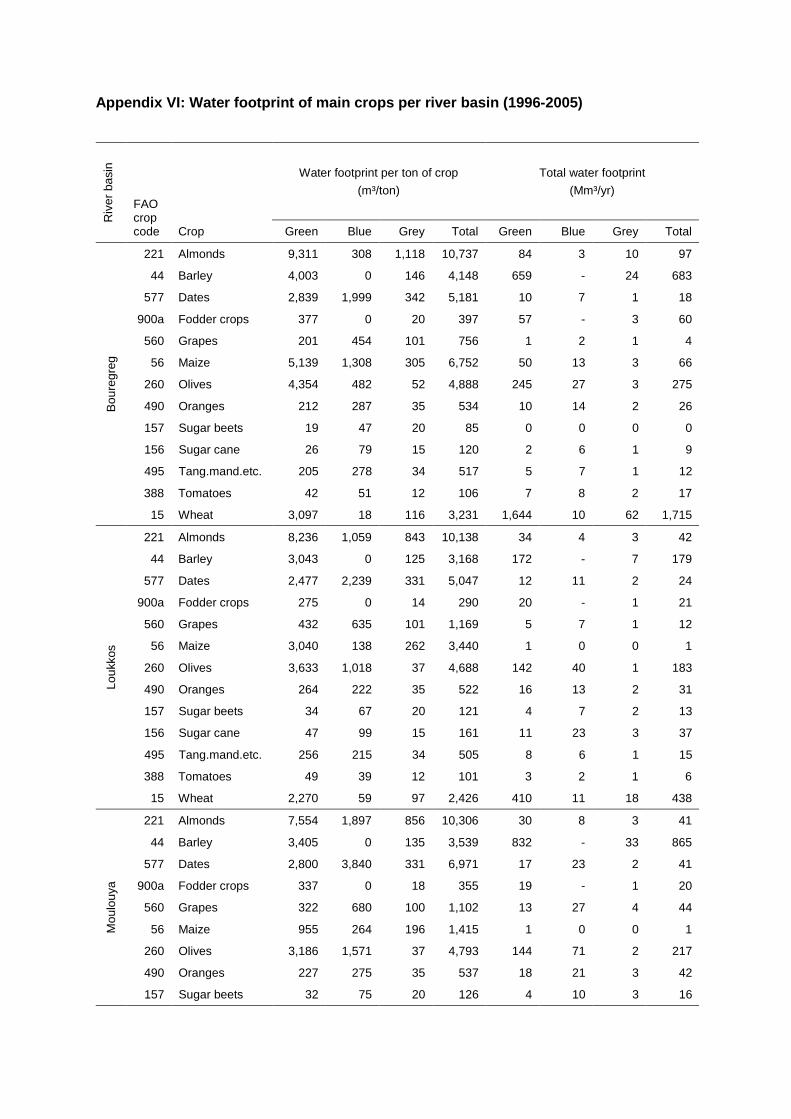
Appendix VI: Water footprint of main crops per river basin (1996-2005)
Riv
er b
asin
FAO crop code Crop
Water footprint per ton of crop (m³/ton)
Total water footprint (Mm³/yr)
Green Blue Grey Total Green Blue Grey Total
Bou
regr
eg
221 Almonds 9,311 308 1,118 10,737 84 3 10 97
44 Barley 4,003 0 146 4,148 659 - 24 683
577 Dates 2,839 1,999 342 5,181 10 7 1 18
900a Fodder crops 377 0 20 397 57 - 3 60
560 Grapes 201 454 101 756 1 2 1 4
56 Maize 5,139 1,308 305 6,752 50 13 3 66
260 Olives 4,354 482 52 4,888 245 27 3 275
490 Oranges 212 287 35 534 10 14 2 26
157 Sugar beets 19 47 20 85 0 0 0 0
156 Sugar cane 26 79 15 120 2 6 1 9
495 Tang.mand.etc. 205 278 34 517 5 7 1 12
388 Tomatoes 42 51 12 106 7 8 2 17
15 Wheat 3,097 18 116 3,231 1,644 10 62 1,715
Louk
kos
221 Almonds 8,236 1,059 843 10,138 34 4 3 42
44 Barley 3,043 0 125 3,168 172 - 7 179
577 Dates 2,477 2,239 331 5,047 12 11 2 24
900a Fodder crops 275 0 14 290 20 - 1 21
560 Grapes 432 635 101 1,169 5 7 1 12
56 Maize 3,040 138 262 3,440 1 0 0 1
260 Olives 3,633 1,018 37 4,688 142 40 1 183
490 Oranges 264 222 35 522 16 13 2 31
157 Sugar beets 34 67 20 121 4 7 2 13
156 Sugar cane 47 99 15 161 11 23 3 37
495 Tang.mand.etc. 256 215 34 505 8 6 1 15
388 Tomatoes 49 39 12 101 3 2 1 6
15 Wheat 2,270 59 97 2,426 410 11 18 438
Mou
louy
a
221 Almonds 7,554 1,897 856 10,306 30 8 3 41
44 Barley 3,405 0 135 3,539 832 - 33 865
577 Dates 2,800 3,840 331 6,971 17 23 2 41
900a Fodder crops 337 0 18 355 19 - 1 20
560 Grapes 322 680 100 1,102 13 27 4 44
56 Maize 955 264 196 1,415 1 0 0 1
260 Olives 3,186 1,571 37 4,793 144 71 2 217
490 Oranges 227 275 35 537 18 21 3 42
157 Sugar beets 32 75 20 126 4 10 3 16
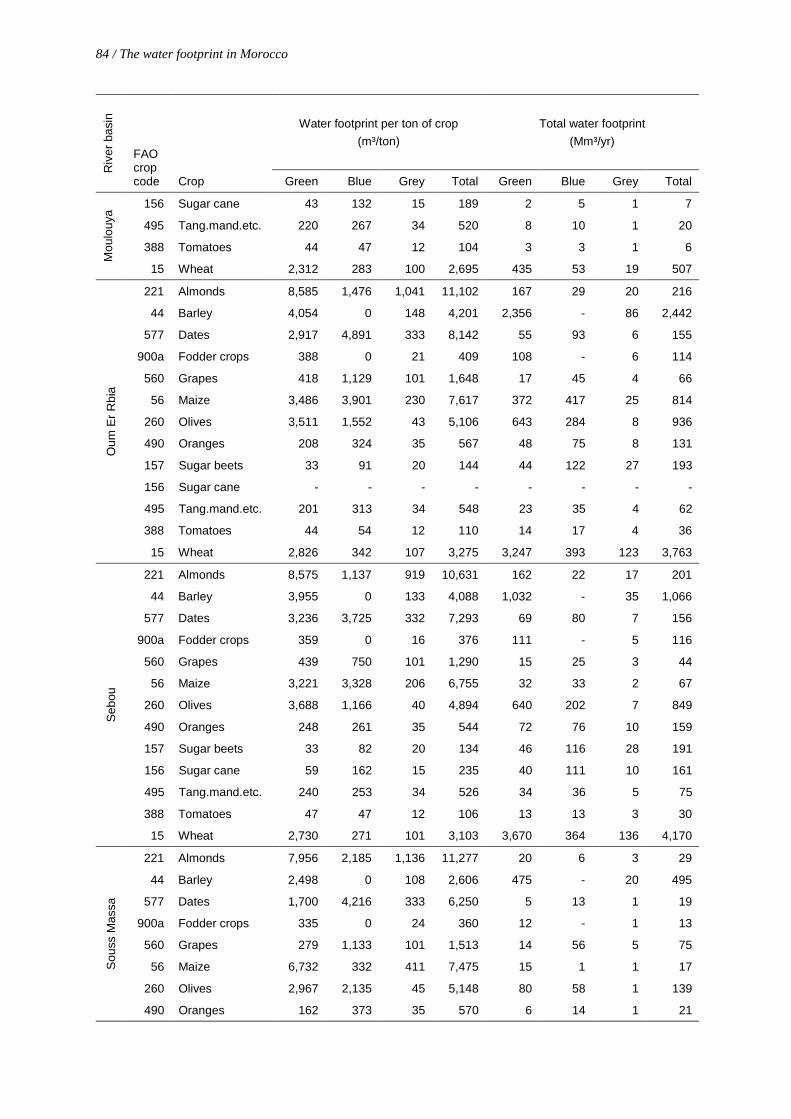
84 / The water footprint in Morocco
Riv
er b
asin
FAO crop code Crop
Water footprint per ton of crop (m³/ton)
Total water footprint (Mm³/yr)
Green Blue Grey Total Green Blue Grey Total
Mou
louy
a
156 Sugar cane 43 132 15 189 2 5 1 7
495 Tang.mand.etc. 220 267 34 520 8 10 1 20
388 Tomatoes 44 47 12 104 3 3 1 6
15 Wheat 2,312 283 100 2,695 435 53 19 507
Oum
Er R
bia
221 Almonds 8,585 1,476 1,041 11,102 167 29 20 216
44 Barley 4,054 0 148 4,201 2,356 - 86 2,442
577 Dates 2,917 4,891 333 8,142 55 93 6 155
900a Fodder crops 388 0 21 409 108 - 6 114
560 Grapes 418 1,129 101 1,648 17 45 4 66
56 Maize 3,486 3,901 230 7,617 372 417 25 814
260 Olives 3,511 1,552 43 5,106 643 284 8 936
490 Oranges 208 324 35 567 48 75 8 131
157 Sugar beets 33 91 20 144 44 122 27 193
156 Sugar cane - - - - - - - -
495 Tang.mand.etc. 201 313 34 548 23 35 4 62
388 Tomatoes 44 54 12 110 14 17 4 36
15 Wheat 2,826 342 107 3,275 3,247 393 123 3,763
Seb
ou
221 Almonds 8,575 1,137 919 10,631 162 22 17 201
44 Barley 3,955 0 133 4,088 1,032 - 35 1,066
577 Dates 3,236 3,725 332 7,293 69 80 7 156
900a Fodder crops 359 0 16 376 111 - 5 116
560 Grapes 439 750 101 1,290 15 25 3 44
56 Maize 3,221 3,328 206 6,755 32 33 2 67
260 Olives 3,688 1,166 40 4,894 640 202 7 849
490 Oranges 248 261 35 544 72 76 10 159
157 Sugar beets 33 82 20 134 46 116 28 191
156 Sugar cane 59 162 15 235 40 111 10 161
495 Tang.mand.etc. 240 253 34 526 34 36 5 75
388 Tomatoes 47 47 12 106 13 13 3 30
15 Wheat 2,730 271 101 3,103 3,670 364 136 4,170
Sou
ss M
assa
221 Almonds 7,956 2,185 1,136 11,277 20 6 3 29
44 Barley 2,498 0 108 2,606 475 - 20 495
577 Dates 1,700 4,216 333 6,250 5 13 1 19
900a Fodder crops 335 0 24 360 12 - 1 13
560 Grapes 279 1,133 101 1,513 14 56 5 75
56 Maize 6,732 332 411 7,475 15 1 1 17
260 Olives 2,967 2,135 45 5,148 80 58 1 139
490 Oranges 162 373 35 570 6 14 1 21
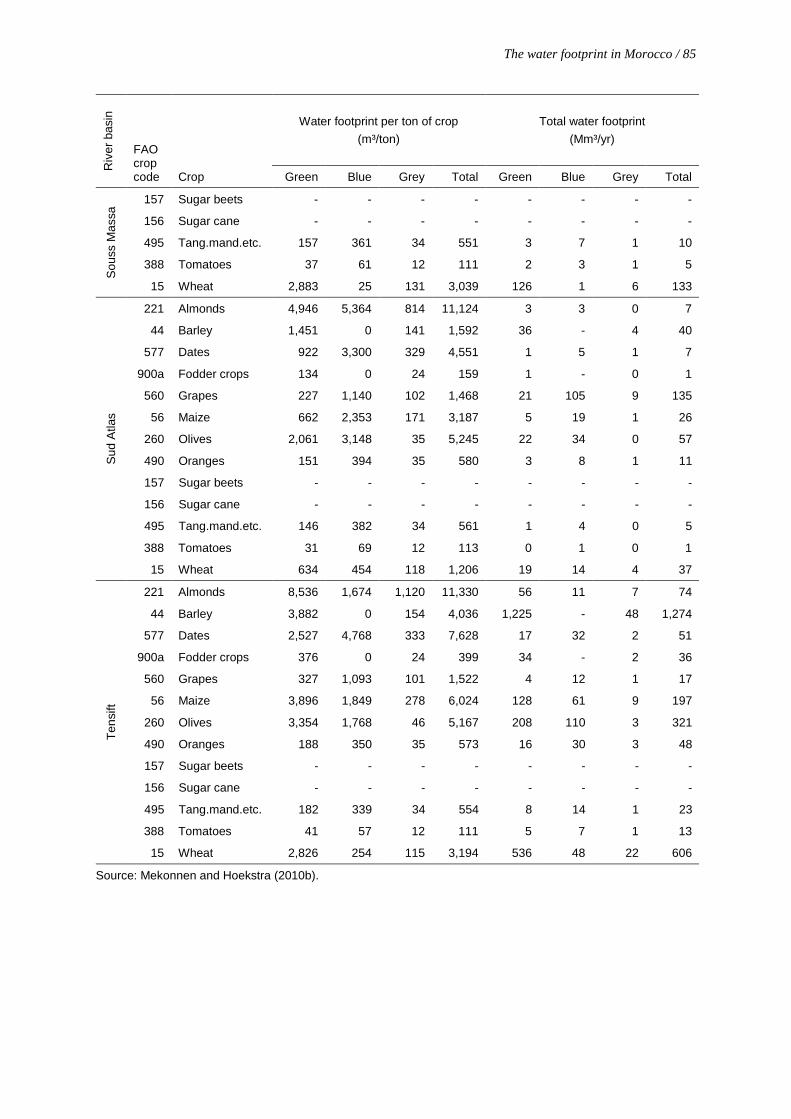
The water footprint in Morocco / 85
Riv
er b
asin
FAO crop code Crop
Water footprint per ton of crop (m³/ton)
Total water footprint (Mm³/yr)
Green Blue Grey Total Green Blue Grey Total
Sou
ss M
assa
157 Sugar beets - - - - - - - -
156 Sugar cane - - - - - - - -
495 Tang.mand.etc. 157 361 34 551 3 7 1 10
388 Tomatoes 37 61 12 111 2 3 1 5
15 Wheat 2,883 25 131 3,039 126 1 6 133
Sud
Atla
s
221 Almonds 4,946 5,364 814 11,124 3 3 0 7
44 Barley 1,451 0 141 1,592 36 - 4 40
577 Dates 922 3,300 329 4,551 1 5 1 7
900a Fodder crops 134 0 24 159 1 - 0 1
560 Grapes 227 1,140 102 1,468 21 105 9 135
56 Maize 662 2,353 171 3,187 5 19 1 26
260 Olives 2,061 3,148 35 5,245 22 34 0 57
490 Oranges 151 394 35 580 3 8 1 11
157 Sugar beets - - - - - - - -
156 Sugar cane - - - - - - - -
495 Tang.mand.etc. 146 382 34 561 1 4 0 5
388 Tomatoes 31 69 12 113 0 1 0 1
15 Wheat 634 454 118 1,206 19 14 4 37
Tens
ift
221 Almonds 8,536 1,674 1,120 11,330 56 11 7 74
44 Barley 3,882 0 154 4,036 1,225 - 48 1,274
577 Dates 2,527 4,768 333 7,628 17 32 2 51
900a Fodder crops 376 0 24 399 34 - 2 36
560 Grapes 327 1,093 101 1,522 4 12 1 17
56 Maize 3,896 1,849 278 6,024 128 61 9 197
260 Olives 3,354 1,768 46 5,167 208 110 3 321
490 Oranges 188 350 35 573 16 30 3 48
157 Sugar beets - - - - - - - -
156 Sugar cane - - - - - - - -
495 Tang.mand.etc. 182 339 34 554 8 14 1 23
388 Tomatoes 41 57 12 111 5 7 1 13
15 Wheat 2,826 254 115 3,194 536 48 22 606
Source: Mekonnen and Hoekstra (2010b).


Appendix VII: Economic water and land productivity of crops per river basin
Riv
er b
asin
FAO crop code Crop
Green plus blue water
footprint (m³/ton)
Yield (ton/ha)
Average annual
producer price (US$/ton)
Economic water
productivity (US$/m³)
Economic land
productivity (US$/ha)
Bou
regr
eg
221 Almonds 9,618 0.43 233 0.02 100
44 Barley 4,003 0.80 184 0.05 147
577 Dates 4,839 1.72 1,014 0.21 1,744
900a Fodder crops 377 - - - -
560 Grapes 655 5.65 337 0.51 1,904
56 Maize 6,447 0.50 209 0.03 104
260 Olives 4,835 0.94 321 0.07 302
490 Oranges 499 16.35 201 0.40 3,279
157 Sugar beets 65 50.99 33 0.51 1,706
156 Sugar cane 105 69.87 23 0.22 1,582
495 Tang.mand.etc. 483 16.90 271 0.56 4,582
388 Tomatoes 93 47.85 173 1.86 8,300
15 Wheat 3,115 1.16 254 0.08 296
Louk
kos
221 Almonds 9,295 0.57 233 0.03 132
44 Barley 3,043 0.93 184 0.06 172
577 Dates 4,716 1.78 1,014 0.22 1,802
900a Fodder crops 275 - - - -
560 Grapes 1,067 5.81 337 0.32 1,956
56 Maize 3,178 0.58 209 0.07 121
260 Olives 4,651 1.33 321 0.07 429
490 Oranges 487 16.80 201 0.41 3,368
157 Sugar beets 101 51.01 33 0.33 1,706
156 Sugar cane 146 69.84 23 0.16 1,581
495 Tang.mand.etc. 471 17.36 271 0.58 4,707
388 Tomatoes 89 47.87 173 1.95 8,304
15 Wheat 2,329 1.39 254 0.11 353
Mou
louy
a
221 Almonds 9,450 0.56 233 0.02 130
44 Barley 3,405 0.86 184 0.05 159
577 Dates 6,640 1.78 1,014 0.15 1,805
900a Fodder crops 337 - - - -
560 Grapes 1,002 5.78 337 0.34 1,945
56 Maize 1,219 0.77 209 0.17 161
260 Olives 4,756 1.35 321 0.07 433
490 Oranges 502 16.71 201 0.40 3,350
157 Sugar beets 106 51.14 33 0.31 1,711
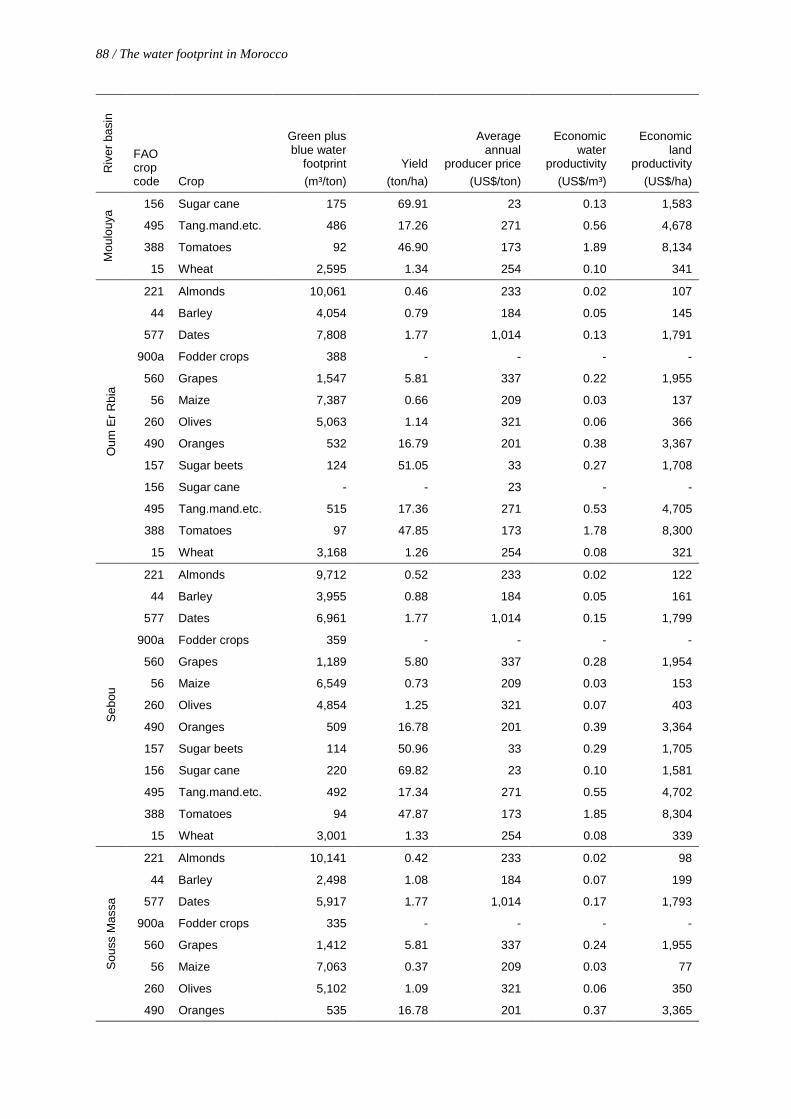
88 / The water footprint in Morocco
Riv
er b
asin
FAO crop code Crop
Green plus blue water
footprint (m³/ton)
Yield (ton/ha)
Average annual
producer price (US$/ton)
Economic water
productivity (US$/m³)
Economic land
productivity (US$/ha)
Mou
louy
a
156 Sugar cane 175 69.91 23 0.13 1,583
495 Tang.mand.etc. 486 17.26 271 0.56 4,678
388 Tomatoes 92 46.90 173 1.89 8,134
15 Wheat 2,595 1.34 254 0.10 341
Oum
Er R
bia
221 Almonds 10,061 0.46 233 0.02 107
44 Barley 4,054 0.79 184 0.05 145
577 Dates 7,808 1.77 1,014 0.13 1,791
900a Fodder crops 388 - - - -
560 Grapes 1,547 5.81 337 0.22 1,955
56 Maize 7,387 0.66 209 0.03 137
260 Olives 5,063 1.14 321 0.06 366
490 Oranges 532 16.79 201 0.38 3,367
157 Sugar beets 124 51.05 33 0.27 1,708
156 Sugar cane - - 23 - -
495 Tang.mand.etc. 515 17.36 271 0.53 4,705
388 Tomatoes 97 47.85 173 1.78 8,300
15 Wheat 3,168 1.26 254 0.08 321
Seb
ou
221 Almonds 9,712 0.52 233 0.02 122
44 Barley 3,955 0.88 184 0.05 161
577 Dates 6,961 1.77 1,014 0.15 1,799
900a Fodder crops 359 - - - -
560 Grapes 1,189 5.80 337 0.28 1,954
56 Maize 6,549 0.73 209 0.03 153
260 Olives 4,854 1.25 321 0.07 403
490 Oranges 509 16.78 201 0.39 3,364
157 Sugar beets 114 50.96 33 0.29 1,705
156 Sugar cane 220 69.82 23 0.10 1,581
495 Tang.mand.etc. 492 17.34 271 0.55 4,702
388 Tomatoes 94 47.87 173 1.85 8,304
15 Wheat 3,001 1.33 254 0.08 339
Sou
ss M
assa
221 Almonds 10,141 0.42 233 0.02 98
44 Barley 2,498 1.08 184 0.07 199
577 Dates 5,917 1.77 1,014 0.17 1,793
900a Fodder crops 335 - - - -
560 Grapes 1,412 5.81 337 0.24 1,955
56 Maize 7,063 0.37 209 0.03 77
260 Olives 5,102 1.09 321 0.06 350
490 Oranges 535 16.78 201 0.37 3,365
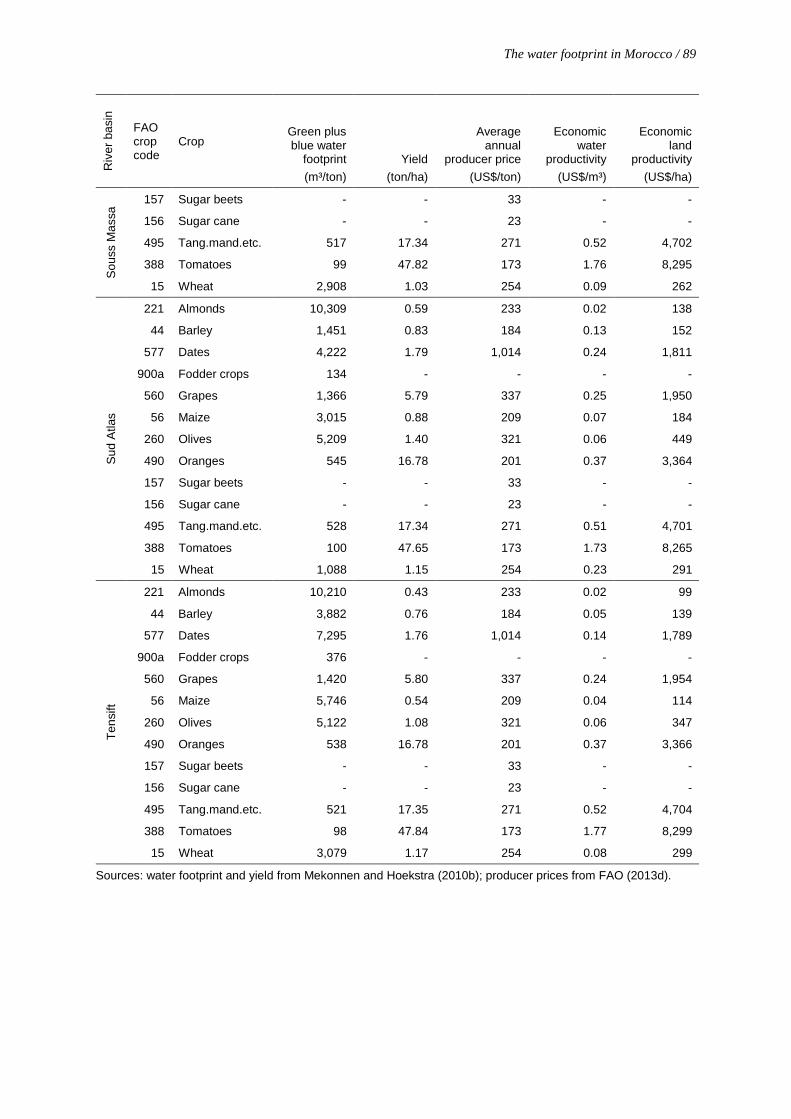
The water footprint in Morocco / 89
Riv
er b
asin
FAO crop code
Crop Green plus blue water
footprint (m³/ton)
Yield (ton/ha)
Average annual
producer price (US$/ton)
Economic water
productivity (US$/m³)
Economic land
productivity (US$/ha)
Sou
ss M
assa
157 Sugar beets - - 33 - -
156 Sugar cane - - 23 - -
495 Tang.mand.etc. 517 17.34 271 0.52 4,702
388 Tomatoes 99 47.82 173 1.76 8,295
15 Wheat 2,908 1.03 254 0.09 262
Sud
Atla
s
221 Almonds 10,309 0.59 233 0.02 138
44 Barley 1,451 0.83 184 0.13 152
577 Dates 4,222 1.79 1,014 0.24 1,811
900a Fodder crops 134 - - - -
560 Grapes 1,366 5.79 337 0.25 1,950
56 Maize 3,015 0.88 209 0.07 184
260 Olives 5,209 1.40 321 0.06 449
490 Oranges 545 16.78 201 0.37 3,364
157 Sugar beets - - 33 - -
156 Sugar cane - - 23 - -
495 Tang.mand.etc. 528 17.34 271 0.51 4,701
388 Tomatoes 100 47.65 173 1.73 8,265
15 Wheat 1,088 1.15 254 0.23 291
Tens
ift
221 Almonds 10,210 0.43 233 0.02 99
44 Barley 3,882 0.76 184 0.05 139
577 Dates 7,295 1.76 1,014 0.14 1,789
900a Fodder crops 376 - - - -
560 Grapes 1,420 5.80 337 0.24 1,954
56 Maize 5,746 0.54 209 0.04 114
260 Olives 5,122 1.08 321 0.06 347
490 Oranges 538 16.78 201 0.37 3,366
157 Sugar beets - - 33 - -
156 Sugar cane - - 23 - -
495 Tang.mand.etc. 521 17.35 271 0.52 4,704
388 Tomatoes 98 47.84 173 1.77 8,299
15 Wheat 3,079 1.17 254 0.08 299
Sources: water footprint and yield from Mekonnen and Hoekstra (2010b); producer prices from FAO (2013d).

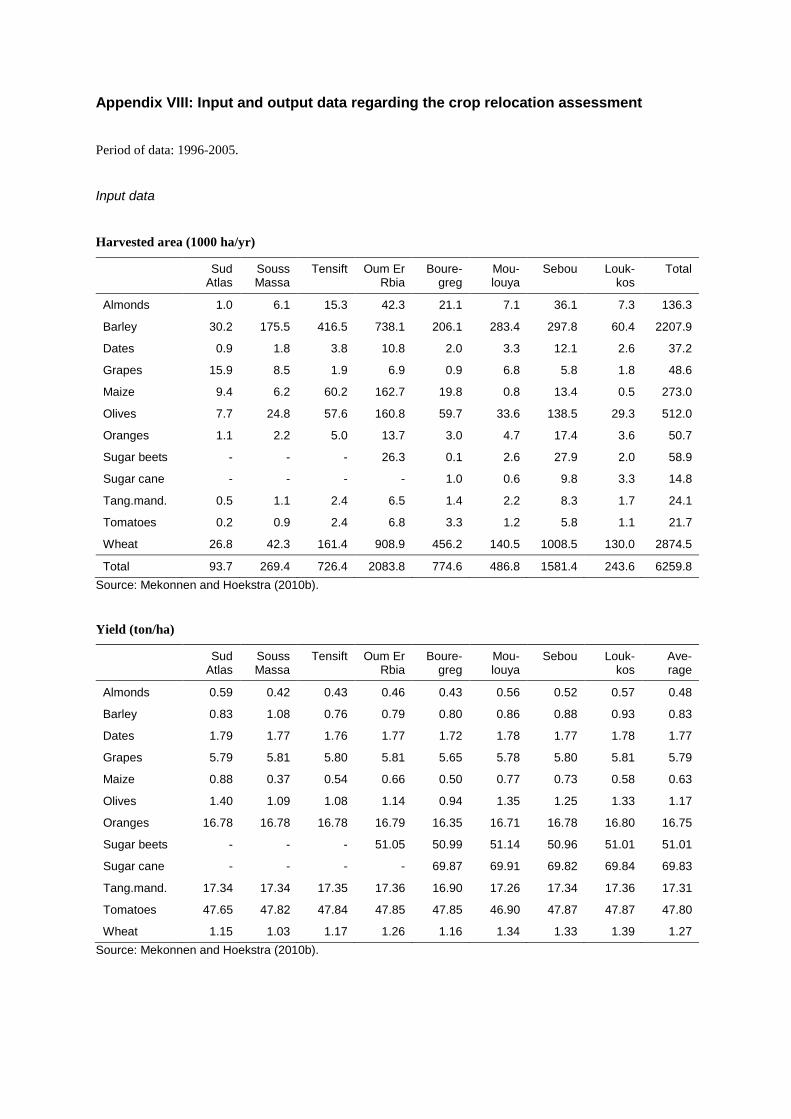
Appendix VIII: Input and output data regarding the crop relocation assessment
Period of data: 1996-2005.
Input data
Harvested area (1000 ha/yr)
Sud
Atlas Souss Massa
Tensift Oum Er Rbia
Boure-greg
Mou-louya
Sebou Louk-kos
Total
Almonds 1.0 6.1 15.3 42.3 21.1 7.1 36.1 7.3 136.3
Barley 30.2 175.5 416.5 738.1 206.1 283.4 297.8 60.4 2207.9
Dates 0.9 1.8 3.8 10.8 2.0 3.3 12.1 2.6 37.2
Grapes 15.9 8.5 1.9 6.9 0.9 6.8 5.8 1.8 48.6
Maize 9.4 6.2 60.2 162.7 19.8 0.8 13.4 0.5 273.0
Olives 7.7 24.8 57.6 160.8 59.7 33.6 138.5 29.3 512.0
Oranges 1.1 2.2 5.0 13.7 3.0 4.7 17.4 3.6 50.7
Sugar beets - - - 26.3 0.1 2.6 27.9 2.0 58.9
Sugar cane - - - - 1.0 0.6 9.8 3.3 14.8
Tang.mand. 0.5 1.1 2.4 6.5 1.4 2.2 8.3 1.7 24.1
Tomatoes 0.2 0.9 2.4 6.8 3.3 1.2 5.8 1.1 21.7
Wheat 26.8 42.3 161.4 908.9 456.2 140.5 1008.5 130.0 2874.5
Total 93.7 269.4 726.4 2083.8 774.6 486.8 1581.4 243.6 6259.8 Source: Mekonnen and Hoekstra (2010b).
Yield (ton/ha)
Sud
Atlas Souss Massa
Tensift Oum Er Rbia
Boure-greg
Mou-louya
Sebou Louk-kos
Ave-rage
Almonds 0.59 0.42 0.43 0.46 0.43 0.56 0.52 0.57 0.48
Barley 0.83 1.08 0.76 0.79 0.80 0.86 0.88 0.93 0.83
Dates 1.79 1.77 1.76 1.77 1.72 1.78 1.77 1.78 1.77
Grapes 5.79 5.81 5.80 5.81 5.65 5.78 5.80 5.81 5.79
Maize 0.88 0.37 0.54 0.66 0.50 0.77 0.73 0.58 0.63
Olives 1.40 1.09 1.08 1.14 0.94 1.35 1.25 1.33 1.17
Oranges 16.78 16.78 16.78 16.79 16.35 16.71 16.78 16.80 16.75
Sugar beets - - - 51.05 50.99 51.14 50.96 51.01 51.01
Sugar cane - - - - 69.87 69.91 69.82 69.84 69.83
Tang.mand. 17.34 17.34 17.35 17.36 16.90 17.26 17.34 17.36 17.31
Tomatoes 47.65 47.82 47.84 47.85 47.85 46.90 47.87 47.87 47.80
Wheat 1.15 1.03 1.17 1.26 1.16 1.34 1.33 1.39 1.27 Source: Mekonnen and Hoekstra (2010b).
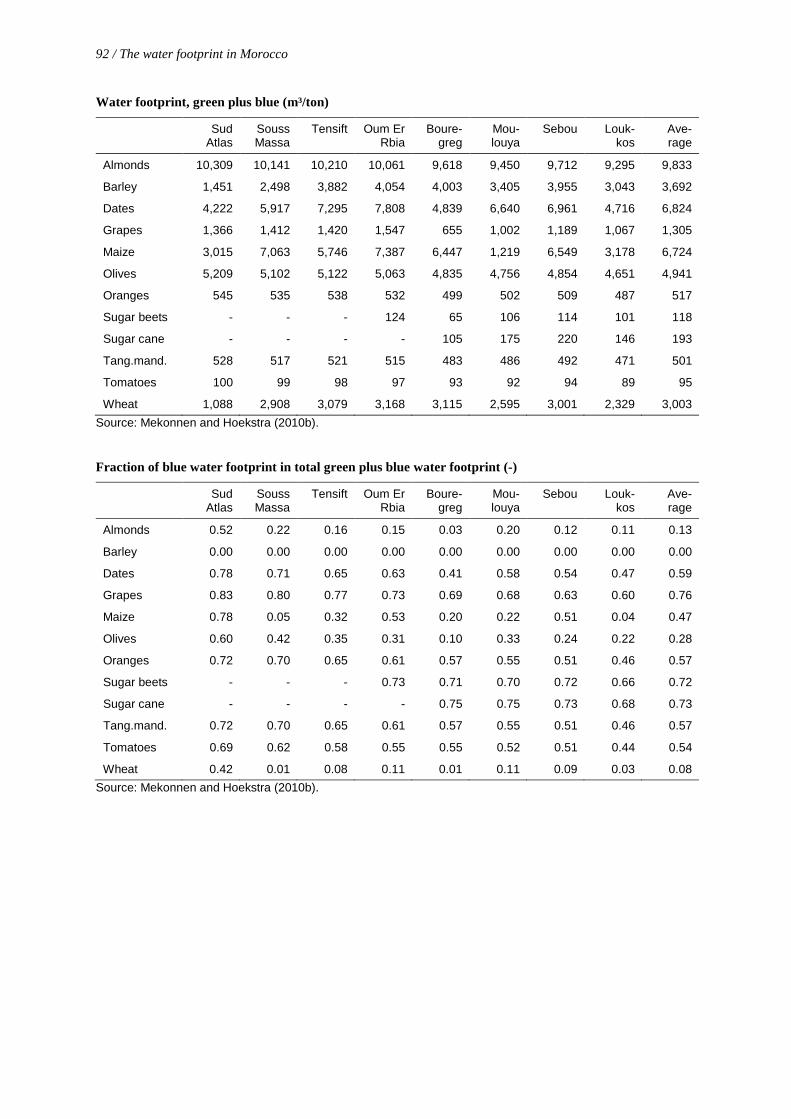
92 / The water footprint in Morocco
Water footprint, green plus blue (m³/ton)
Sud
Atlas Souss Massa
Tensift Oum Er Rbia
Boure-greg
Mou-louya
Sebou Louk-kos
Ave-rage
Almonds 10,309 10,141 10,210 10,061 9,618 9,450 9,712 9,295 9,833
Barley 1,451 2,498 3,882 4,054 4,003 3,405 3,955 3,043 3,692
Dates 4,222 5,917 7,295 7,808 4,839 6,640 6,961 4,716 6,824
Grapes 1,366 1,412 1,420 1,547 655 1,002 1,189 1,067 1,305
Maize 3,015 7,063 5,746 7,387 6,447 1,219 6,549 3,178 6,724
Olives 5,209 5,102 5,122 5,063 4,835 4,756 4,854 4,651 4,941
Oranges 545 535 538 532 499 502 509 487 517
Sugar beets - - - 124 65 106 114 101 118
Sugar cane - - - - 105 175 220 146 193
Tang.mand. 528 517 521 515 483 486 492 471 501
Tomatoes 100 99 98 97 93 92 94 89 95
Wheat 1,088 2,908 3,079 3,168 3,115 2,595 3,001 2,329 3,003 Source: Mekonnen and Hoekstra (2010b).
Fraction of blue water footprint in total green plus blue water footprint (-)
Sud
Atlas Souss Massa
Tensift Oum Er Rbia
Boure-greg
Mou-louya
Sebou Louk-kos
Ave-rage
Almonds 0.52 0.22 0.16 0.15 0.03 0.20 0.12 0.11 0.13
Barley 0.00 0.00 0.00 0.00 0.00 0.00 0.00 0.00 0.00
Dates 0.78 0.71 0.65 0.63 0.41 0.58 0.54 0.47 0.59
Grapes 0.83 0.80 0.77 0.73 0.69 0.68 0.63 0.60 0.76
Maize 0.78 0.05 0.32 0.53 0.20 0.22 0.51 0.04 0.47
Olives 0.60 0.42 0.35 0.31 0.10 0.33 0.24 0.22 0.28
Oranges 0.72 0.70 0.65 0.61 0.57 0.55 0.51 0.46 0.57
Sugar beets - - - 0.73 0.71 0.70 0.72 0.66 0.72
Sugar cane - - - - 0.75 0.75 0.73 0.68 0.73
Tang.mand. 0.72 0.70 0.65 0.61 0.57 0.55 0.51 0.46 0.57
Tomatoes 0.69 0.62 0.58 0.55 0.55 0.52 0.51 0.44 0.54
Wheat 0.42 0.01 0.08 0.11 0.01 0.11 0.09 0.03 0.08 Source: Mekonnen and Hoekstra (2010b).
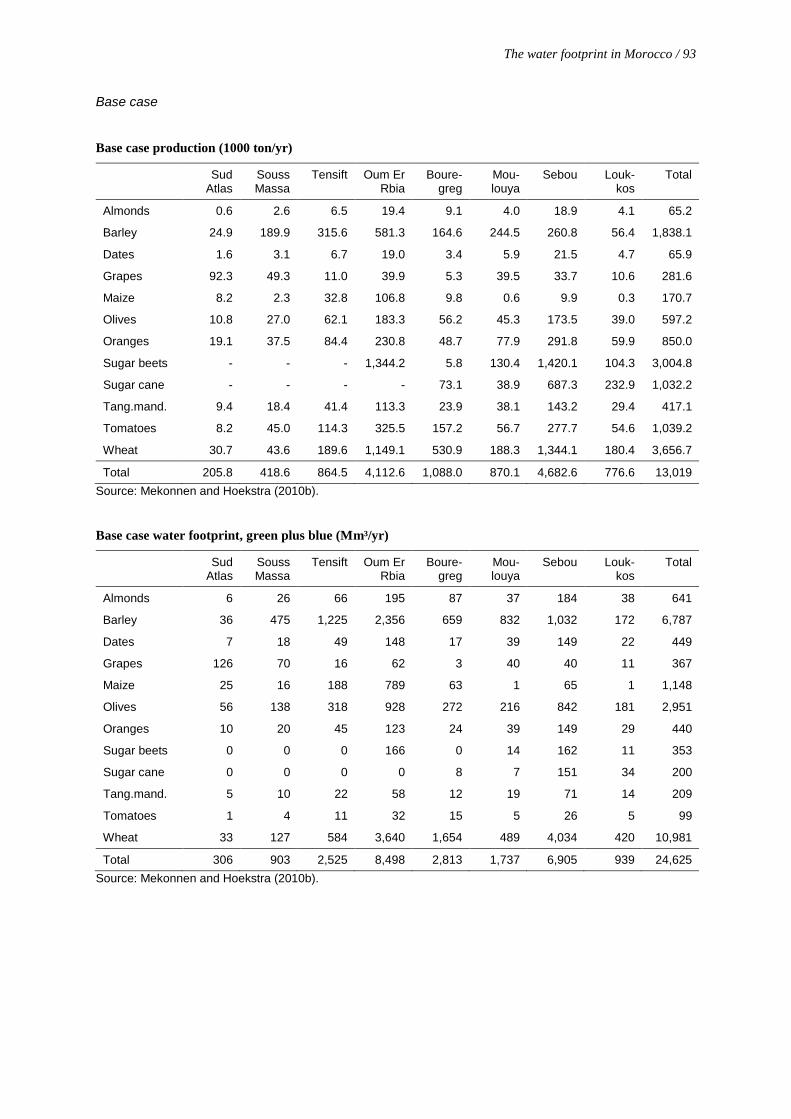
The water footprint in Morocco / 93
Base case
Base case production (1000 ton/yr)
Sud
Atlas Souss Massa
Tensift Oum Er Rbia
Boure-greg
Mou-louya
Sebou Louk-kos
Total
Almonds 0.6 2.6 6.5 19.4 9.1 4.0 18.9 4.1 65.2
Barley 24.9 189.9 315.6 581.3 164.6 244.5 260.8 56.4 1,838.1
Dates 1.6 3.1 6.7 19.0 3.4 5.9 21.5 4.7 65.9
Grapes 92.3 49.3 11.0 39.9 5.3 39.5 33.7 10.6 281.6
Maize 8.2 2.3 32.8 106.8 9.8 0.6 9.9 0.3 170.7
Olives 10.8 27.0 62.1 183.3 56.2 45.3 173.5 39.0 597.2
Oranges 19.1 37.5 84.4 230.8 48.7 77.9 291.8 59.9 850.0
Sugar beets - - - 1,344.2 5.8 130.4 1,420.1 104.3 3,004.8
Sugar cane - - - - 73.1 38.9 687.3 232.9 1,032.2
Tang.mand. 9.4 18.4 41.4 113.3 23.9 38.1 143.2 29.4 417.1
Tomatoes 8.2 45.0 114.3 325.5 157.2 56.7 277.7 54.6 1,039.2
Wheat 30.7 43.6 189.6 1,149.1 530.9 188.3 1,344.1 180.4 3,656.7
Total 205.8 418.6 864.5 4,112.6 1,088.0 870.1 4,682.6 776.6 13,019 Source: Mekonnen and Hoekstra (2010b).
Base case water footprint, green plus blue (Mm³/yr)
Sud
Atlas Souss Massa
Tensift Oum Er Rbia
Boure-greg
Mou-louya
Sebou Louk-kos
Total
Almonds 6 26 66 195 87 37 184 38 641
Barley 36 475 1,225 2,356 659 832 1,032 172 6,787
Dates 7 18 49 148 17 39 149 22 449
Grapes 126 70 16 62 3 40 40 11 367
Maize 25 16 188 789 63 1 65 1 1,148
Olives 56 138 318 928 272 216 842 181 2,951
Oranges 10 20 45 123 24 39 149 29 440
Sugar beets 0 0 0 166 0 14 162 11 353
Sugar cane 0 0 0 0 8 7 151 34 200
Tang.mand. 5 10 22 58 12 19 71 14 209
Tomatoes 1 4 11 32 15 5 26 5 99
Wheat 33 127 584 3,640 1,654 489 4,034 420 10,981
Total 306 903 2,525 8,498 2,813 1,737 6,905 939 24,625 Source: Mekonnen and Hoekstra (2010b).
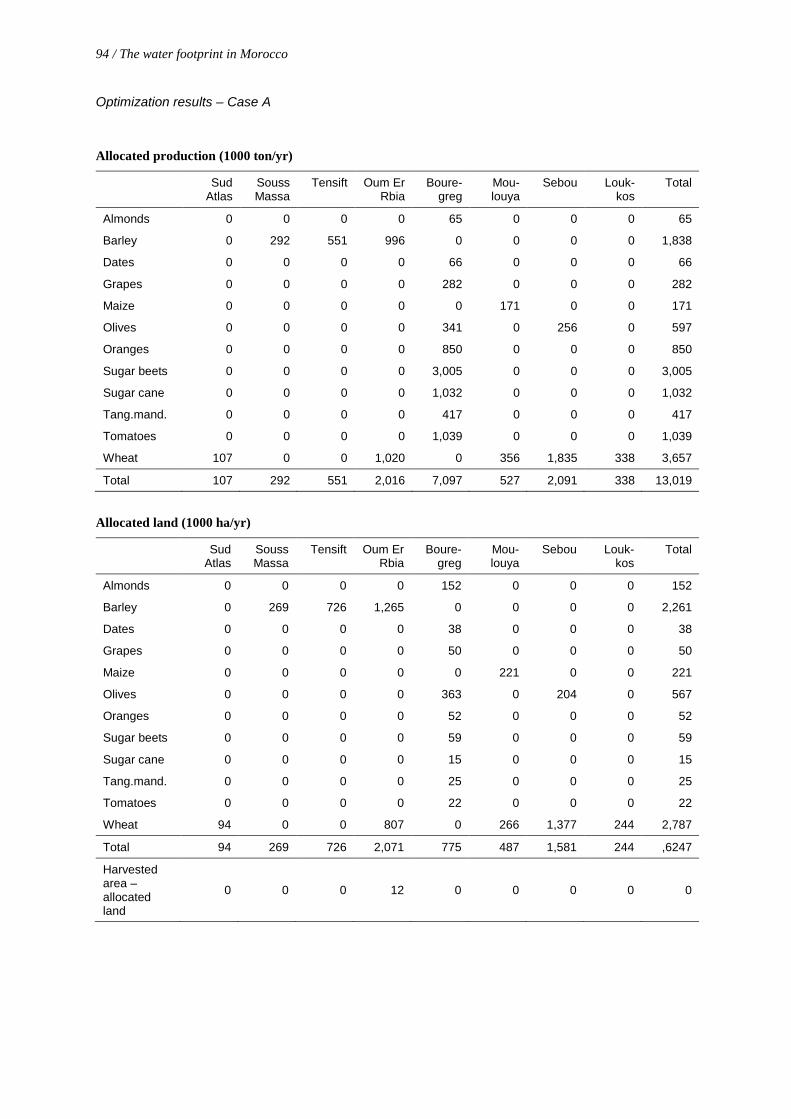
94 / The water footprint in Morocco
Optimization results – Case A
Allocated production (1000 ton/yr)
Sud
Atlas Souss Massa
Tensift Oum Er Rbia
Boure-greg
Mou-louya
Sebou Louk-kos
Total
Almonds 0 0 0 0 65 0 0 0 65
Barley 0 292 551 996 0 0 0 0 1,838
Dates 0 0 0 0 66 0 0 0 66
Grapes 0 0 0 0 282 0 0 0 282
Maize 0 0 0 0 0 171 0 0 171
Olives 0 0 0 0 341 0 256 0 597
Oranges 0 0 0 0 850 0 0 0 850
Sugar beets 0 0 0 0 3,005 0 0 0 3,005
Sugar cane 0 0 0 0 1,032 0 0 0 1,032
Tang.mand. 0 0 0 0 417 0 0 0 417
Tomatoes 0 0 0 0 1,039 0 0 0 1,039
Wheat 107 0 0 1,020 0 356 1,835 338 3,657
Total 107 292 551 2,016 7,097 527 2,091 338 13,019
Allocated land (1000 ha/yr)
Sud
Atlas Souss Massa
Tensift Oum Er Rbia
Boure-greg
Mou-louya
Sebou Louk-kos
Total
Almonds 0 0 0 0 152 0 0 0 152
Barley 0 269 726 1,265 0 0 0 0 2,261
Dates 0 0 0 0 38 0 0 0 38
Grapes 0 0 0 0 50 0 0 0 50
Maize 0 0 0 0 0 221 0 0 221
Olives 0 0 0 0 363 0 204 0 567
Oranges 0 0 0 0 52 0 0 0 52
Sugar beets 0 0 0 0 59 0 0 0 59
Sugar cane 0 0 0 0 15 0 0 0 15
Tang.mand. 0 0 0 0 25 0 0 0 25
Tomatoes 0 0 0 0 22 0 0 0 22
Wheat 94 0 0 807 0 266 1,377 244 2,787
Total 94 269 726 2,071 775 487 1,581 244 ,6247
Harvested area – allocated land
0 0 0 12 0 0 0 0 0
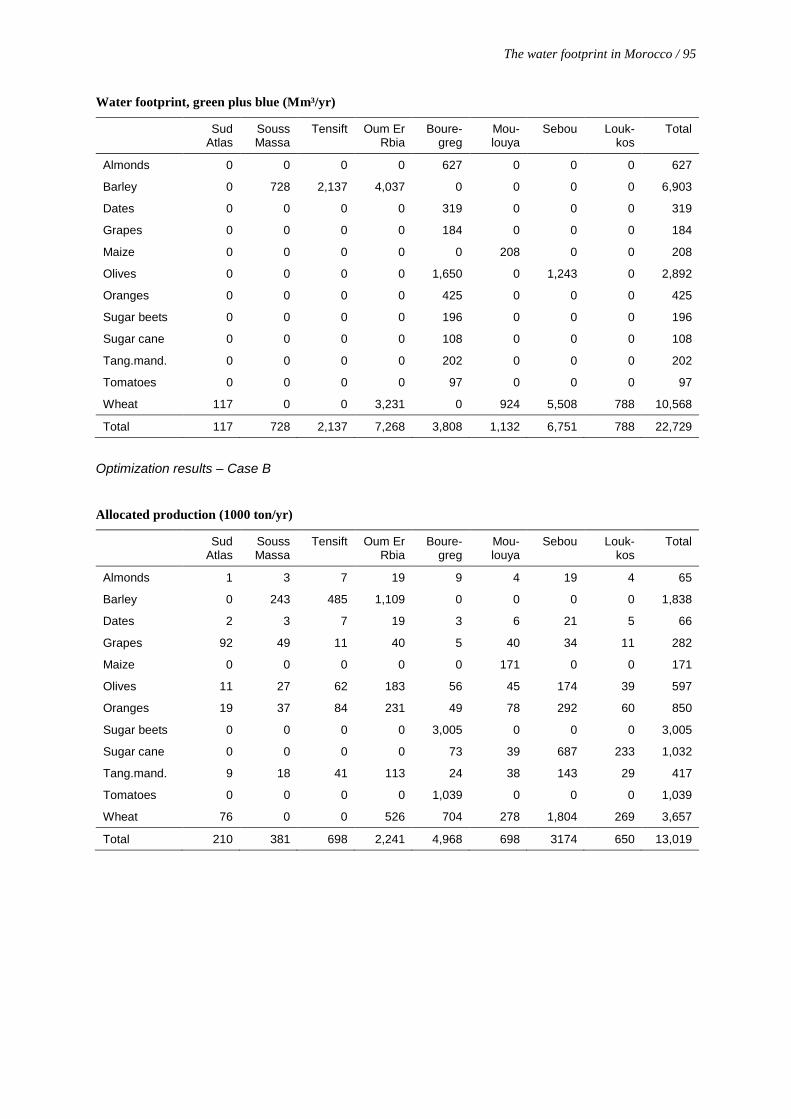
The water footprint in Morocco / 95
Water footprint, green plus blue (Mm³/yr)
Sud
Atlas Souss Massa
Tensift Oum Er Rbia
Boure-greg
Mou-louya
Sebou Louk-kos
Total
Almonds 0 0 0 0 627 0 0 0 627
Barley 0 728 2,137 4,037 0 0 0 0 6,903
Dates 0 0 0 0 319 0 0 0 319
Grapes 0 0 0 0 184 0 0 0 184
Maize 0 0 0 0 0 208 0 0 208
Olives 0 0 0 0 1,650 0 1,243 0 2,892
Oranges 0 0 0 0 425 0 0 0 425
Sugar beets 0 0 0 0 196 0 0 0 196
Sugar cane 0 0 0 0 108 0 0 0 108
Tang.mand. 0 0 0 0 202 0 0 0 202
Tomatoes 0 0 0 0 97 0 0 0 97
Wheat 117 0 0 3,231 0 924 5,508 788 10,568
Total 117 728 2,137 7,268 3,808 1,132 6,751 788 22,729
Optimization results – Case B
Allocated production (1000 ton/yr)
Sud
Atlas Souss Massa
Tensift Oum Er Rbia
Boure-greg
Mou-louya
Sebou Louk-kos
Total
Almonds 1 3 7 19 9 4 19 4 65
Barley 0 243 485 1,109 0 0 0 0 1,838
Dates 2 3 7 19 3 6 21 5 66
Grapes 92 49 11 40 5 40 34 11 282
Maize 0 0 0 0 0 171 0 0 171
Olives 11 27 62 183 56 45 174 39 597
Oranges 19 37 84 231 49 78 292 60 850
Sugar beets 0 0 0 0 3,005 0 0 0 3,005
Sugar cane 0 0 0 0 73 39 687 233 1,032
Tang.mand. 9 18 41 113 24 38 143 29 417
Tomatoes 0 0 0 0 1,039 0 0 0 1,039
Wheat 76 0 0 526 704 278 1,804 269 3,657
Total 210 381 698 2,241 4,968 698 3174 650 13,019
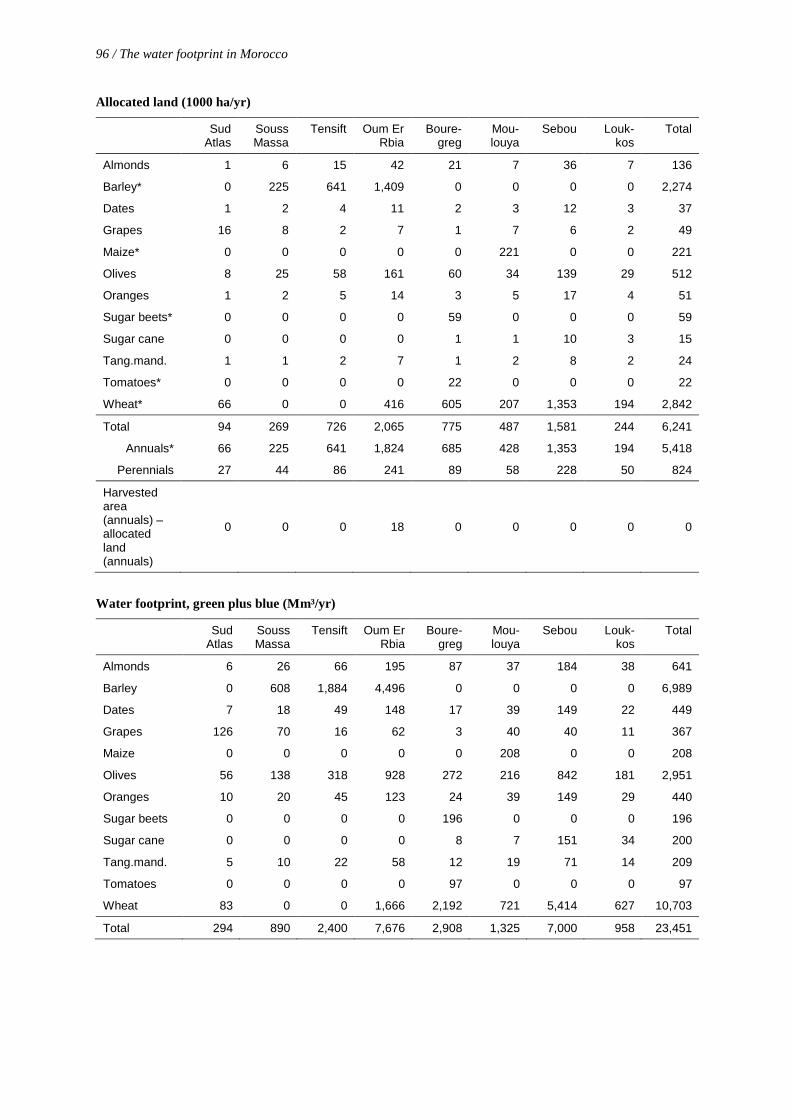
96 / The water footprint in Morocco
Allocated land (1000 ha/yr)
Sud
Atlas Souss Massa
Tensift Oum Er Rbia
Boure-greg
Mou-louya
Sebou Louk-kos
Total
Almonds 1 6 15 42 21 7 36 7 136
Barley* 0 225 641 1,409 0 0 0 0 2,274
Dates 1 2 4 11 2 3 12 3 37
Grapes 16 8 2 7 1 7 6 2 49
Maize* 0 0 0 0 0 221 0 0 221
Olives 8 25 58 161 60 34 139 29 512
Oranges 1 2 5 14 3 5 17 4 51
Sugar beets* 0 0 0 0 59 0 0 0 59
Sugar cane 0 0 0 0 1 1 10 3 15
Tang.mand. 1 1 2 7 1 2 8 2 24
Tomatoes* 0 0 0 0 22 0 0 0 22
Wheat* 66 0 0 416 605 207 1,353 194 2,842
Total 94 269 726 2,065 775 487 1,581 244 6,241
Annuals* 66 225 641 1,824 685 428 1,353 194 5,418
Perennials 27 44 86 241 89 58 228 50 824
Harvested area (annuals) – allocated land (annuals)
0 0 0 18 0 0 0 0 0
Water footprint, green plus blue (Mm³/yr)
Sud
Atlas Souss Massa
Tensift Oum Er Rbia
Boure-greg
Mou-louya
Sebou Louk-kos
Total
Almonds 6 26 66 195 87 37 184 38 641
Barley 0 608 1,884 4,496 0 0 0 0 6,989
Dates 7 18 49 148 17 39 149 22 449
Grapes 126 70 16 62 3 40 40 11 367
Maize 0 0 0 0 0 208 0 0 208
Olives 56 138 318 928 272 216 842 181 2,951
Oranges 10 20 45 123 24 39 149 29 440
Sugar beets 0 0 0 0 196 0 0 0 196
Sugar cane 0 0 0 0 8 7 151 34 200
Tang.mand. 5 10 22 58 12 19 71 14 209
Tomatoes 0 0 0 0 97 0 0 0 97
Wheat 83 0 0 1,666 2,192 721 5,414 627 10,703
Total 294 890 2,400 7,676 2,908 1,325 7,000 958 23,451
Appendix IX: Summary of national water strategy of Morocco
This appendix contains an English summary of the action plans in the national water strategy of Morocco,
originally in French (Ministry EMWE, 2011).
The national water strategy is based on three levers, namely:
1. Much more ambitious goals to meet water needs in a sustainable way, but also durable protection against
the effects of global warming.
2. Radical change in behaviour (use and management of water) through coordinated demand and resource
management on:
• Securing measures for the protection and replenishment of groundwater reserves and lakes.
• Rationalisation of water demand.
• Generalization of wastewater treatment and reuse.
• A diverse portfolio of innovative solutions for mobilization of water, combining all relevant local
solutions with better interconnection of regions.
• Pro-active protection measures (of the environment and the fight against flooding).
3. Real long-term water management:
• National visibility on long-term water needs and availability, regularly updated and improved.
• Political commitment and effort from all stakeholders, supported by a regulatory framework and
adapted governance.
• More ambitious public and private funding.
The main action plans of the national water strategy are grouped along 6 axes:
1. Demand management and valorisation of water
In the agricultural sector potential (irrigation) water savings are estimated at about 2.5 Gm³/yr by:
• Conversion to drip irrigation: potential of 2 Gm³/yr with a conversion rate of 44,000 ha/yr.
• Improved efficiency of irrigation supply networks: potential of about 400 Mm³/yr.
• Adoption of a water-pricing system based on volumes.
• Awareness raising and supervision of farmers for water saving techniques.
These efforts will be particularly significant in the four major agricultural areas of Morocco: Sebou, Oum
Er Rbia, Tensift and Souss-Massa.
In the sectors of public water supply, industry and tourism potential water savings are estimated at about
120 Mm³/yr by:
• Improving the efficiency of supply networks: national average of 80%.
• Standardization and encouragement of the use of appropriate technologies for water savings: pipes,
sanitary equipment, etc.
98 / The water footprint in Morocco
• Revision of the tariff system: pricing that gives incentive for more efficient use of water and better
cost recovery.
• Improving the efficiency of water use in industry and tourism sector and encourage the reuse of
water.
• Taking into account best practices in water-saving in construction standards.
2. Supply management and development
Continuation of large-scale mobilization of water by:
• Realisation of another 60 large dams by 2030: aimed capacity of 7 Gm³ in total, mobilizing an
additional amount of 1.7 Gm³/yr.
• North-South water transfer from basins Loukkos and Sebou to Bouregreg, Oum Er Rbia and
Tensift: 1st phase, 400 Mm³/yr from Sebou; 2nd phase, 400 Mm³/yr from Loukkos. The inter-basin
connection allows flexible allocation management to cope with sudden changes in inflow of the
basins.
Small-scale mobilization of new water resources is also planned, namely:
• Continuation of the program of small and medium dams: realisation of 1000 small dams by 2030.
These dams play an important role in local development of irrigation, livestock watering and
protection against flooding.
• Realise pilot projects on rainwater harvesting/capturing: a pilot in a basin before potential
implementation on a large-scale (as done in India and Australia).
Plans for unconventional mobilization of water resources are:
• Desalinisation of seawater and demineralization of brackish water: objective is to realize a
potential production of potable water of 400 Mm³/yr. On medium term it is expected to realize
facilities in Agadir and Laayoune. On long-term also in Tiznit- Sidi Ifni, Chtouka, Essaouira, Safi,
El Jadida, Casablanca, Al Hoceima and Saidia.
• Reuse of treated wastewater: 300 Mm³/yr of treated wastewater for reuse in irrigation of golf
courses, parks and crops in some cases, as well as for artificial recharge of groundwater.
Other supply-related plans are:
• Strengthening the maintenance of existing water infrastructure and interconnection systems. This
allows for the diversification of supply sources and therefore more secure and substantial gains in
efficiency and synergy.
• In rural areas, widespread access to potable water will be pursued through the upgrading of
existing public systems to secure their operation and realization of individual systems for isolated
and dispersed population.
3. Preservation and protection of water resources, the natural environment and sensitive areas
The strategy proposes the following for the protection and restoration of groundwater systems:
The water footprint in Morocco / 99
• Limitation of pumping from aquifers (revision of the pricing system, downward revision of
allowed withdrawal thresholds for overexploited aquifers, cancel subsidies that provide incentive
for overexploitation, areas of prohibited or restricted pumping, efficient techniques, establishment
of a drilling permit).
• Reinforcement of the control and sanction system for overexploitation, particularly by reinforcing
the water police and encouraging satellite monitoring and aerial surveillance.
• Reinforcement of the responsibility of the river basin agencies in management of aquifers and
generalisation of aquifer contracts:
• Systematic use of alternative, conventional and unconventional, water resources to relieve
pressure on groundwater resources.
• Programs of artificial groundwater recharge: storage of 180 Mm³/yr.
• Reinjection of treated wastewater to coastal aquifers used for irrigation (100 Mm³ by
2030).
• Substitution of groundwater by surface water as a source for water withdrawal by ONEP
(drinking water service) (90 Mm³ by 2030).
The strategy aims to prevent pollution and fight against it by:
• Acceleration of the implementation of the national program of sanitation and wastewater
treatment: target access level to sanitation of 90% by 2030.
• Establishment of a national program for rural sanitation: target access level to sanitation of 90% by
2030.
• Development of a national program of prevention and fight against industrial pollution.
• Establishment of a national management plan for domestic and similar waste.
Protection of fragile wetlands, natural lakes, oases and the coast by:
• Protection of watersheds upstream of dams against erosion.
• A protection program for springs.
• A protection program for wetlands and natural lakes.
• Preservation of oases and the fight against desertification.
• Protection of the coast.
• Limitation and control of pumping from aquifers that directly affect natural lakes.
• Improving the supply to lakes by diversion of rivers and development of thresholds and small
dams upstream.
4. Reduction of vulnerability to natural hazards related to water and climate change adaptation
Improving the protection of people and property against flooding by:
• Completion of the measures included in the national plan for protection against inundations: target
of 20 protected sites per year.
• Incorporation of the inundation risk in spatial, urban and watershed planning.
• Improving knowledge in the fields of weather forecasting and urban hydrology.
100 / The water footprint in Morocco
• Development of flood warning systems and emergency plans.
• Development of financial mechanisms (insurance and natural disaster funds).
Drought management plans at the river basin level, which aim for:
• Characterization of drought: identification and proposal of monitoring indicators.
• Implementation of structural measures: diversification of water supply sources.
• Elaboration of emergency plans.
• Development of financial mechanisms such as insurance and natural disasters funds.
5. Further regulatory and institutional reforms
Proposed further regulatory and institutional reforms, supplementing the advances made after the
establishment of the Water Law 10-95 in 1995, are:
• Completion of the legal framework necessary for the implementation of all provisions of Law 10-
95, related to:
• Prevention of and fight against flooding.
• Declaration of the state of water scarcity and management during periods of drought.
• Implementation of the principle “the polluter pays”.
• Review of the Water Law and its implementation regulations to incorporate the domains it does
not cover, namely:
• Wastewater discharges in sea.
• Desalination of sea water.
• Water conservation.
6. Modernisation of information systems and capacity building
To support the implementation of the national water strategy, parallel development of human and material
resources in the water sector by the administration should aim at:
• Modernisation of the administration and the development of information systems, particularly the
implementation of a water information system for professionals and the public.
• Modernisation of the network of measures.
• Reinforcement of research and development.
• Capacity building.
Value of Water Research Report Series Editorial board: A.Y. Hoekstra, University of Twente; H.H.G. Savenije, Delft University of Technology; P. van der Zaag, UNESCO-IHE. Reports can be downloaded from: www.waterfootprint.org and www.unesco-ihe.org/value-of-water-research-report-series. 1. Exploring methods to assess the value of water: A case study on the Zambezi basin A.K. Chapagain − February 2000 2. Water value flows: A case study on the Zambezi basin. A.Y. Hoekstra, H.H.G. Savenije and A.K. Chapagain − March 2000 3. The water value-flow concept I.M. Seyam and A.Y. Hoekstra − December 2000 4. The value of irrigation water in Nyanyadzi smallholder irrigation scheme, Zimbabwe G.T. Pazvakawambwa and P. van der Zaag – January 2001 5. The economic valuation of water: Principles and methods J.I. Agudelo – August 2001 6. The economic valuation of water for agriculture: A simple method applied to the eight Zambezi basin countries J.I. Agudelo and A.Y. Hoekstra – August 2001 7. The value of freshwater wetlands in the Zambezi basin I.M. Seyam, A.Y. Hoekstra, G.S. Ngabirano and H.H.G. Savenije – August 2001 8. ‘Demand management’ and ‘Water as an economic good’: Paradigms with pitfalls H.H.G. Savenije and P. van der Zaag – October 2001 9. Why water is not an ordinary economic good H.H.G. Savenije – October 2001 10. Calculation methods to assess the value of upstream water flows and storage as a function of downstream benefits I.M. Seyam, A.Y. Hoekstra and H.H.G. Savenije – October 2001 11. Virtual water trade: A quantification of virtual water flows between nations in relation to international crop trade A.Y. Hoekstra and P.Q. Hung – September 2002 12. Virtual water trade: Proceedings of the international expert meeting on virtual water trade, IHE Delft, the Netherlands, 12-13 December 2002 A.Y. Hoekstra (ed.) – February 2003 13. Virtual water flows between nations in relation to trade in livestock and livestock products A.K. Chapagain and A.Y. Hoekstra – July 2003 14. The water needed to have the Dutch drink coffee A.K. Chapagain and A.Y. Hoekstra – August 2003 15. The water needed to have the Dutch drink tea A.K. Chapagain and A.Y. Hoekstra – August 2003 16. Water footprints of nations, Volume 1: Main Report, Volume 2: Appendices A.K. Chapagain and A.Y. Hoekstra – November 2004 17. Saving water through global trade A.K. Chapagain, A.Y. Hoekstra and H.H.G. Savenije – September 2005 18. The water footprint of cotton consumption A.K. Chapagain, A.Y. Hoekstra, H.H.G. Savenije and R. Gautam – September 2005 19. Water as an economic good: the value of pricing and the failure of markets P. van der Zaag and H.H.G. Savenije – July 2006 20. The global dimension of water governance: Nine reasons for global arrangements in order to cope with local water problems A.Y. Hoekstra – July 2006 21. The water footprints of Morocco and the Netherlands A.Y. Hoekstra and A.K. Chapagain – July 2006 22. Water’s vulnerable value in Africa P. van der Zaag – July 2006 23. Human appropriation of natural capital: Comparing ecological footprint and water footprint analysis A.Y. Hoekstra – July 2007 24. A river basin as a common-pool resource: A case study for the Jaguaribe basin in Brazil P.R. van Oel, M.S. Krol and A.Y. Hoekstra – July 2007 25. Strategic importance of green water in international crop trade M.M. Aldaya, A.Y. Hoekstra and J.A. Allan – March 2008 26. Global water governance: Conceptual design of global institutional arrangements M.P. Verkerk, A.Y. Hoekstra and P.W. Gerbens-Leenes – March 2008 27. Business water footprint accounting: A tool to assess how production of goods and services impact on freshwater resources worldwide P.W. Gerbens-Leenes and A.Y. Hoekstra – March 2008 28. Water neutral: reducing and offsetting the impacts of water footprints A.Y. Hoekstra – March 2008 29. Water footprint of bio-energy and other primary energy carriers P.W. Gerbens-Leenes, A.Y. Hoekstra and Th.H. van der Meer – March 2008 30. Food consumption patterns and their effect on water requirement in China J. Liu and H.H.G. Savenije – March 2008 31. Going against the flow: A critical analysis of virtual water trade in the context of India’s National River Linking Programme S. Verma, D.A. Kampman, P. van der Zaag and A.Y. Hoekstra – March 2008 32. The water footprint of India D.A. Kampman, A.Y. Hoekstra and M.S. Krol – May 2008 33. The external water footprint of the Netherlands: Quantification and impact assessment P.R. van Oel, M.M. Mekonnen and A.Y. Hoekstra – May 2008 34. The water footprint of bio-energy: Global water use for bio-ethanol, bio-diesel, heat and electricity P.W. Gerbens-Leenes, A.Y. Hoekstra and Th.H. van der Meer – August 2008
35. Water footprint analysis for the Guadiana river basin M.M. Aldaya and M.R. Llamas – November 2008 36. The water needed to have Italians eat pasta and pizza M.M. Aldaya and A.Y. Hoekstra – May 2009 37. The water footprint of Indonesian provinces related to the consumption of crop products F. Bulsink, A.Y. Hoekstra and M.J. Booij – May 2009 38. The water footprint of sweeteners and bio-ethanol from sugar cane, sugar beet and maize P.W. Gerbens-Leenes and A.Y. Hoekstra – November 2009 39. A pilot in corporate water footprint accounting and impact assessment: The water footprint of a sugar-containing carbonated beverage A.E. Ercin, M.M. Aldaya and A.Y. Hoekstra – November 2009 40. The blue, green and grey water footprint of rice from both a production and consumption perspective A.K. Chapagain and A.Y. Hoekstra – March 2010 41. Water footprint of cotton, wheat and rice production in Central Asia M.M. Aldaya, G. Muñoz and A.Y. Hoekstra – March 2010 42. A global and high-resolution assessment of the green, blue and grey water footprint of wheat M.M. Mekonnen and A.Y. Hoekstra – April 2010 43. Biofuel scenarios in a water perspective: The global blue and green water footprint of road transport in 2030 A.R. van Lienden, P.W. Gerbens-Leenes, A.Y. Hoekstra and Th.H. van der Meer – April 2010 44. Burning water: The water footprint of biofuel-based transport P.W. Gerbens-Leenes and A.Y. Hoekstra – June 2010 45. Mitigating the water footprint of export cut flowers from the Lake Naivasha Basin, Kenya M.M. Mekonnen and A.Y. Hoekstra – June 2010 46. The green and blue water footprint of paper products: methodological considerations and quantification P.R. van Oel and A.Y. Hoekstra – July 2010 47. The green, blue and grey water footprint of crops and derived crop products M.M. Mekonnen and A.Y. Hoekstra – December 2010 48. The green, blue and grey water footprint of animals and derived animal products M.M. Mekonnen and A.Y. Hoekstra – December 2010 49. The water footprint of soy milk and soy burger and equivalent animal products A.E. Ercin, M.M. Aldaya and A.Y. Hoekstra – February 2011 50. National water footprint accounts: The green, blue and grey water footprint of production and consumption M.M. Mekonnen and A.Y. Hoekstra – May 2011 51. The water footprint of electricity from hydropower M.M. Mekonnen and A.Y. Hoekstra – June 2011 52. The relation between national water management and international trade: a case study from Kenya M.M. Mekonnen and A.Y. Hoekstra – June 2011 53. Global water scarcity: The monthly blue water footprint compared to blue water availability for the world’s major river basins A.Y. Hoekstra and M.M. Mekonnen – September 2011 54. Proceedings of the ESF Strategic Workshop on accounting for water scarcity and pollution in the rules of international trade A.Y. Hoekstra, M.M. Aldaya and B. Avril (eds.) – October 2011 55. A comparative study on the water footprint of poultry, pork and beef in different countries and production systems P.W. Gerbens-Leenes, M.M. Mekonnen and A.Y. Hoekstra – December 2011 56. The water footprint of France A.E. Ercin, M.M. Mekonnen and A.Y. Hoekstra – March 2012 57. The water footprint of Switzerland A.E. Ercin, M.M. Mekonnen and A.Y. Hoekstra – March 2012 58. Blue water footprint of agriculture, industry, households and water management in the Netherlands A.Y. Hoekstra, M.J. Booij, J.C Hunink and K.S. Meijer – June 2012 59. Water footprint scenarios for 2050: A global analysis and case study for Europe A.E. Ercin and A.Y. Hoekstra – September 2012 60. Proceedings of the session "Solving the Water Crisis: Common Action Toward a Sustainable Water Footprint", Planet under Pressure Conference,
London, 26 March 2012 G.P. Zhang, A.Y. Hoekstra and D. Tickner (eds.) – October 2012 61. Water footprint of Tunisia from an economic perspective H. Chouchane, A.Y. Hoekstra, M.S. Krol and M.M. Mekonnen – November 2013 62. Sensitivity and uncertainty in crop water footprint accounting: A case study for the Yellow River Basin L. Zhuo, M.M. Mekonnen and A.Y. Hoekstra – November 2013 63. Wise freshwater allocation: Water footprint caps by river basin, benchmarks by product and fair water footprint shares by community A.Y. Hoekstra – November 2013 64. Benchmarking the water footprint of crops M.M. Mekonnen and A.Y. Hoekstra – December 2013 65. Grey water footprint accounting: Tier 1 supporting guidelines N.A. Franke, H. Boyacioglu and A.Y. Hoekstra – December 2013 66. Water Footprint Assessment for Latin America and the Caribbean: An analysis of the sustainability, efficiency and equitability of water consumption and pollution M.M. Mekonnen, M., Pahlow, M.M. Aldaya, E. Zarate and A Y. Hoekstra – August 2014 67. The water footprint in Morocco: The added value of Water Footprint Assessment for national water policy J.F. Schyns and A.Y. Hoekstra – September 2014

UNESCO-IHEP.O. Box 30152601 DA DelftThe Netherlands
Website www.unesco-ihe.orgPhone +31 15 2151715
University of Twente
Delft University of Technology