hogback canal weir wall velocity mapping - fws
TRANSCRIPT
U.S. Department of the Interior Bureau of Reclamation Technical Service Center Denver, Colorado November 2016
Hogback Canal Weir Wall Velocity Mapping
Upper Colorado Region Upper Colorado Regional Office Salt Lake City, Utah Report SRH-2017-10

i
Mission Statements
The U.S. Department of the Interior protects America’s natural resources and
heritage, honors our cultures and tribal communities, and supplies the energy to
power our future.
The mission of the Bureau of Reclamation is to manage, develop, and protect water
and related resources in an environmentally and economically sound manner in the
interest of the American public.
DATE:
Caroline Ubing, M.S., T. Hydraulic Engineer Sedimentation and River Hydraulics Group (85-824000)
DATE: IL' A ci Tracy Vermeyen, M. Hydraulic Engineer Hydraulic Investigatio s & Laboratory Group (85-856000)
Peer Review Certification: This document has been peer reviewed and is believed to be in accordance with the service agreement and standards of the profession.
PREPARED BY:
PEER REVIEW BY:
DATE: / •,// /t Rebecca Kallio, M.S., P.E. Hydraulic Engineer Sedimentation and River Hydraulics Group (85-824000)
II
i
Table of Contents
page
1. Introduction ..................................................................................................... 4
2. Methods and Materials .................................................................................... 5
Data Collection ......................................................................................... 5
Data Post-processing ................................................................................ 6
3. Results ............................................................................................................. 7
Operating Conditions ............................................................................... 7
Angle Iron .............................................................................................. 14
4. Recommendations ......................................................................................... 17
5. References ..................................................................................................... 19
Appendix A – All Tabular Results........................................................................ 20
Appendix B – Velocity Mapping Figures ............................................................. 34
ii
Table of Figures
page
Figure 1. – Hogback Diversion Canal weir wall operation. ................................... 4
Figure 2.–Two rafts were deployed to position the ADV and collect ADV
measurements. ......................................................................................................... 5 Figure 3. – Field ADV and positioning mount used to collect velocity data along
the Hogback weir wall. ........................................................................................... 6 Figure 4.–3-D plots of approach velocities in ft/s near the weir wall. Note: negative
approach velocities are directed over the weir. ....................................................... 8 Figure 5.–3-D plots of sweeping velocities in ft/s near the weir wall. ................... 9
Figure 6.–3-D plots of vertical velocity contours in ft/s near the weir wall. ........ 10
Figure 7.–Velocity mapping in a horizontal plane at H = -0.33 ft. Contours represent
sweeping velocity in ft/s while the boxes contain the approach velocity magnitude
in ft/s. The vectors represent the resultant of the approach and sweeping velocity
components. Note how the vectors rotate toward the weir wall as the flow
approaches the weir............................................................................................... 11 Figure 8.–Sweeping velocity mapping in a vertical plane at offset = 2.50 ft.
Contours represent sweeping velocity (ft/s). ........................................................ 12 Figure 9.–Approach, sweeping, and vertical velocities measured by the
FlowTracker near the weir crest (H=0.0 and Offset =0.2 ft). ............................... 13 Figure 10.–Approach, sweeping, and vertical velocities 2.7 ft below and directly in
front of the weir crest ............................................................................................ 13
Figure 11.–Vertical velocity at Station 190 ft, varying head and offset. The black
bubble at Offset = 0.5 ft and H = -1.0 ft is included for scale for Vvert = 0.1 ft/s.14 Figure 12. - Velocity mapping at Station 190 ft. Contours represent vertical
velocities. Sweeping velocities are contained in the text boxes at each measurement
location. The figure on the left presents normal operating conditions, while the
angle iron retrofit results are present in the right plot. .......................................... 15
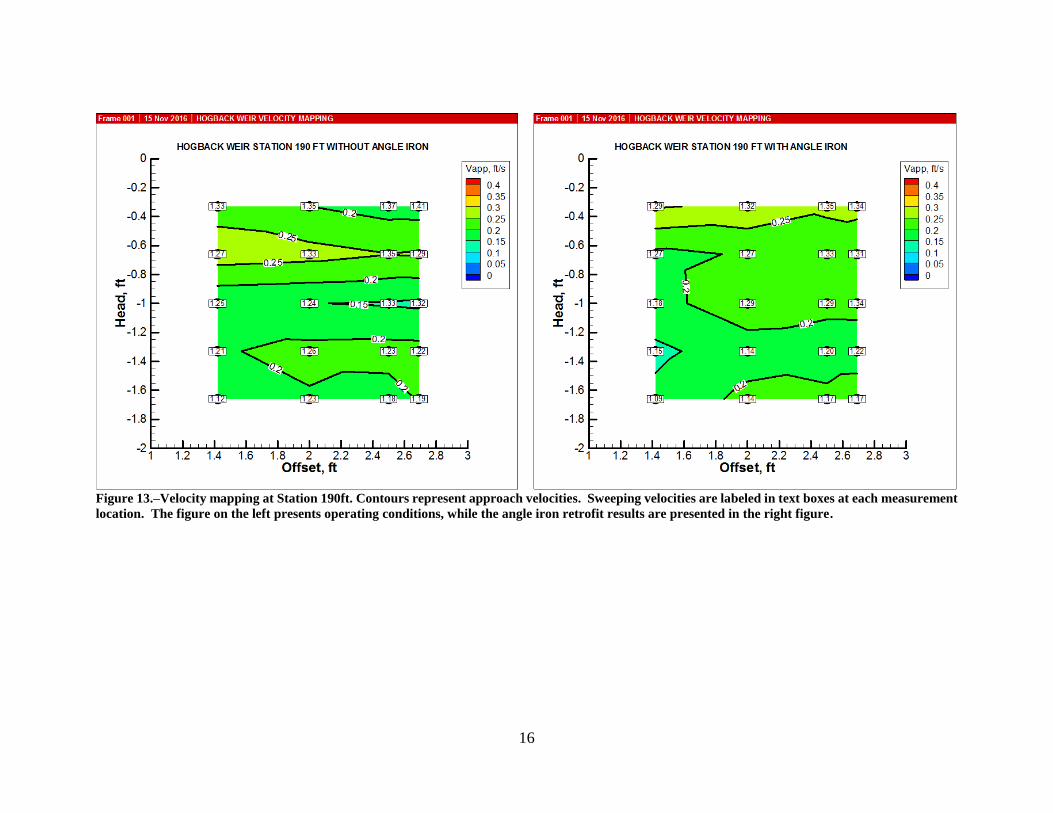
Figure 13.–Velocity mapping at Station 190ft. Contours represent approach
velocities. Sweeping velocities are labeled in text boxes at each measurement
location. The figure on the left presents operating conditions, while the angle iron
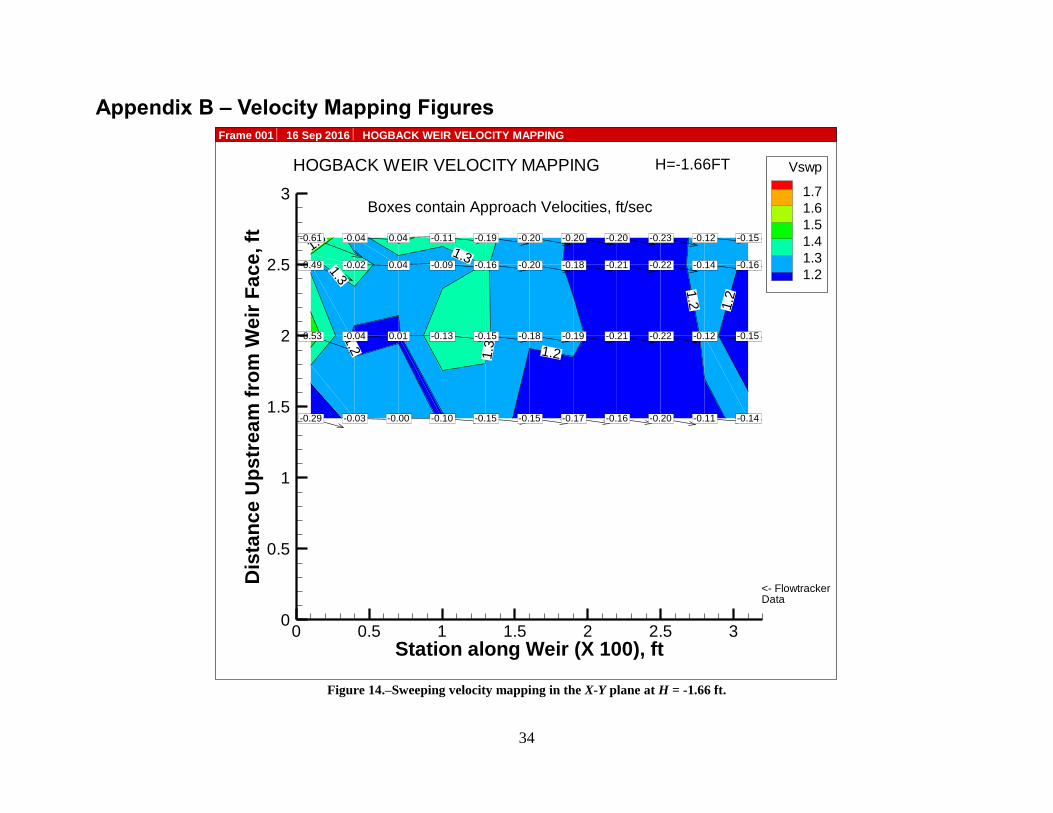
retrofit results are presented in the right figure. .................................................... 16 Figure 14.–Sweeping velocity mapping in the X-Y plane at H = -1.66 ft. ............ 34
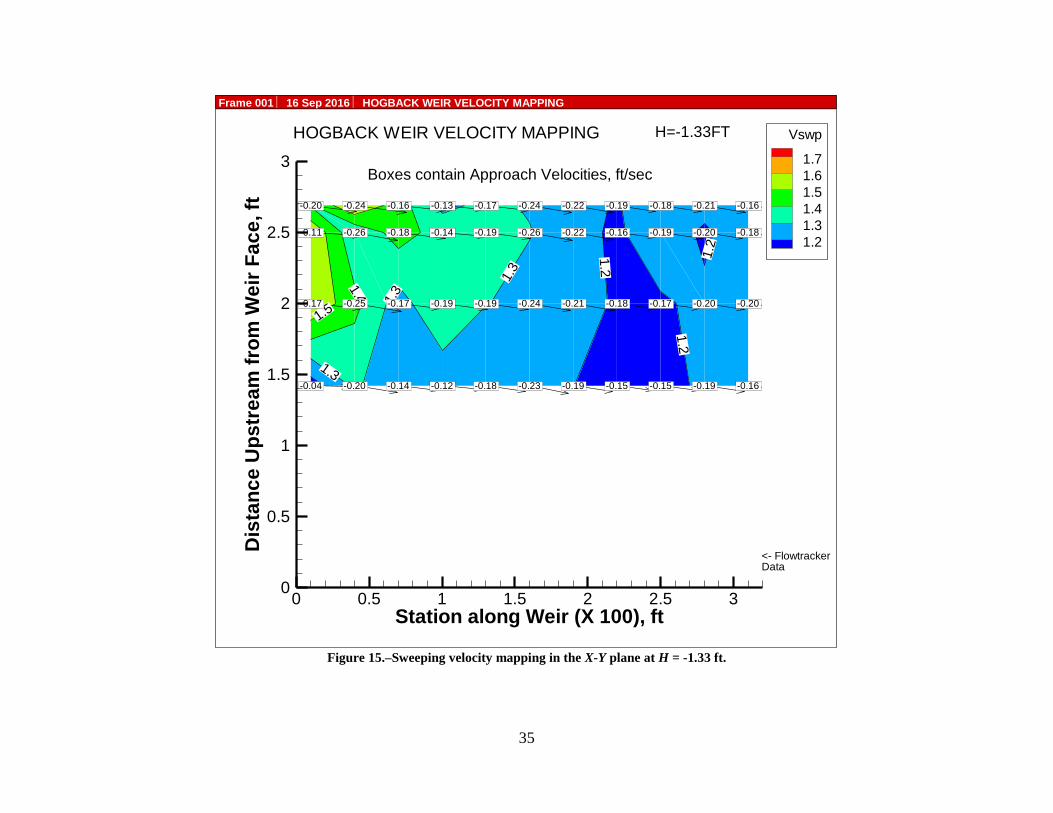
Figure 15.–Sweeping velocity mapping in the X-Y plane at H = -1.33 ft. ............ 35
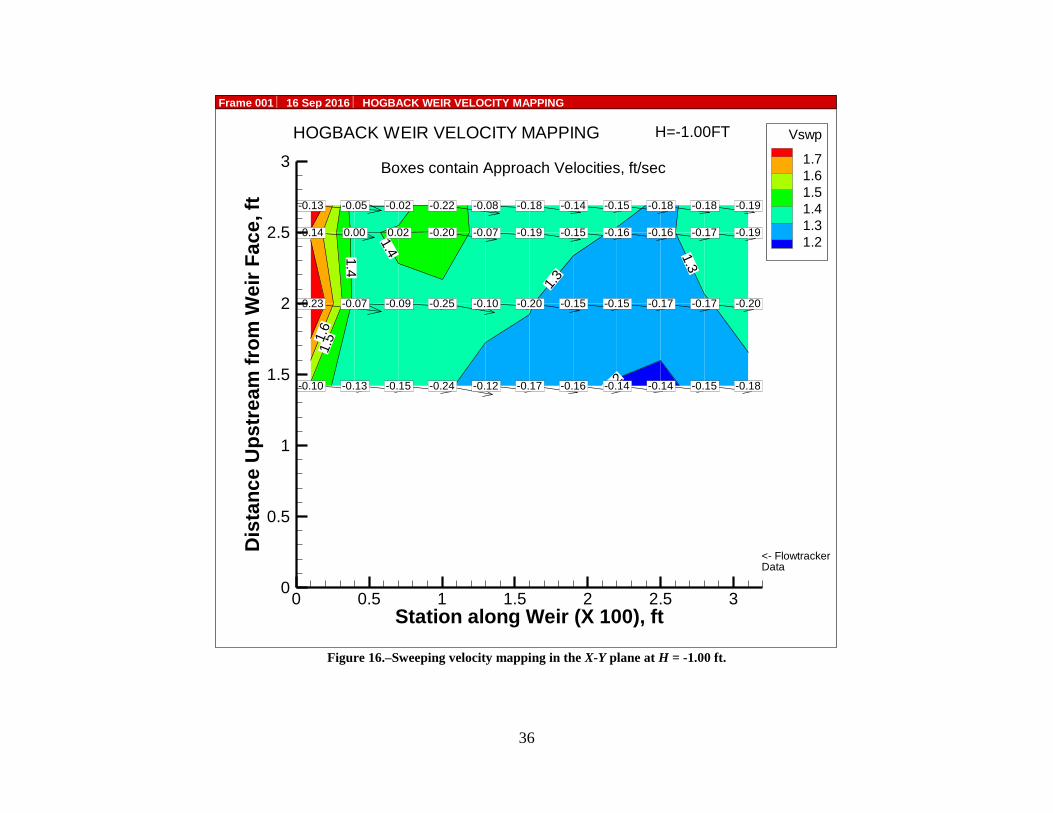
Figure 16.–Sweeping velocity mapping in the X-Y plane at H = -1.00 ft. ............ 36
Figure 17.–Sweeping velocity mapping in the X-Y plane at H = -0.66 ft. ............ 37 Figure 18.–Sweeping velocity mapping in the X-Y plane at H = -0.33 ft. ............ 38 Figure 19.–Approach velocity mapping in the X-Z plane at Y = 1.42 ft. .............. 39 Figure 20.–Sweeping velocity mapping in the X-Z plane at Y = 1.42 ft. .............. 40 Figure 21.–Vertical velocity mapping in the X-Z plane at Y = 1.42 ft. ................. 41
Figure 22.–Approach velocity mapping in the X-Z plane at Y = 2.00 ft. .............. 42 Figure 23.–Sweeping velocity mapping in the X-Z plane at Y = 2.00 ft. .............. 43 Figure 24.–Vertical velocity mapping in the X-Z plane at Y = 2.00 ft. ................. 44
Figure 25.–Approach velocity mapping in the X-Z plane at Y = 2.50 ft. .............. 45
iii
Figure 26.–Sweeping velocity mapping in the X-Z plane at Y = 2.50 ft. .............. 46
Figure 27.–Vertical velocity mapping in the X-Z plane at Y = 2.50 ft. ................. 47 Figure 28.–Approach velocity mapping in the X-Z plane at Y = 2.69 ft. .............. 48 Figure 29.–Sweeping velocity mapping in the X-Z plane at Y = 2.69 ft. .............. 49
Figure 30.–Vertical velocity mapping in the X-Z plane at Y = 2.69 ft. ................. 50 Figure 31.–Weir approach velocities are higher with the angle iron retrofit to the
weir crest. .............................................................................................................. 51 Figure 32.–Weir sweeping velocities are higher with the angle iron retrofit to the
weir crest. .............................................................................................................. 52
Table of Tables
page
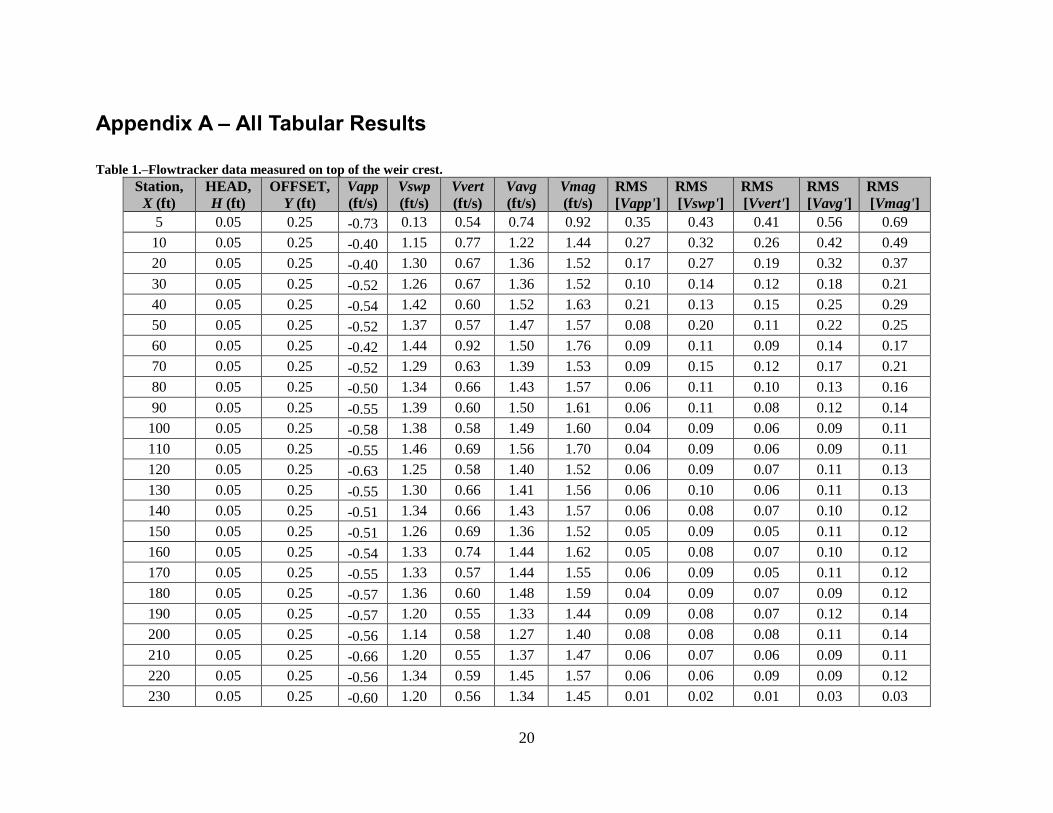
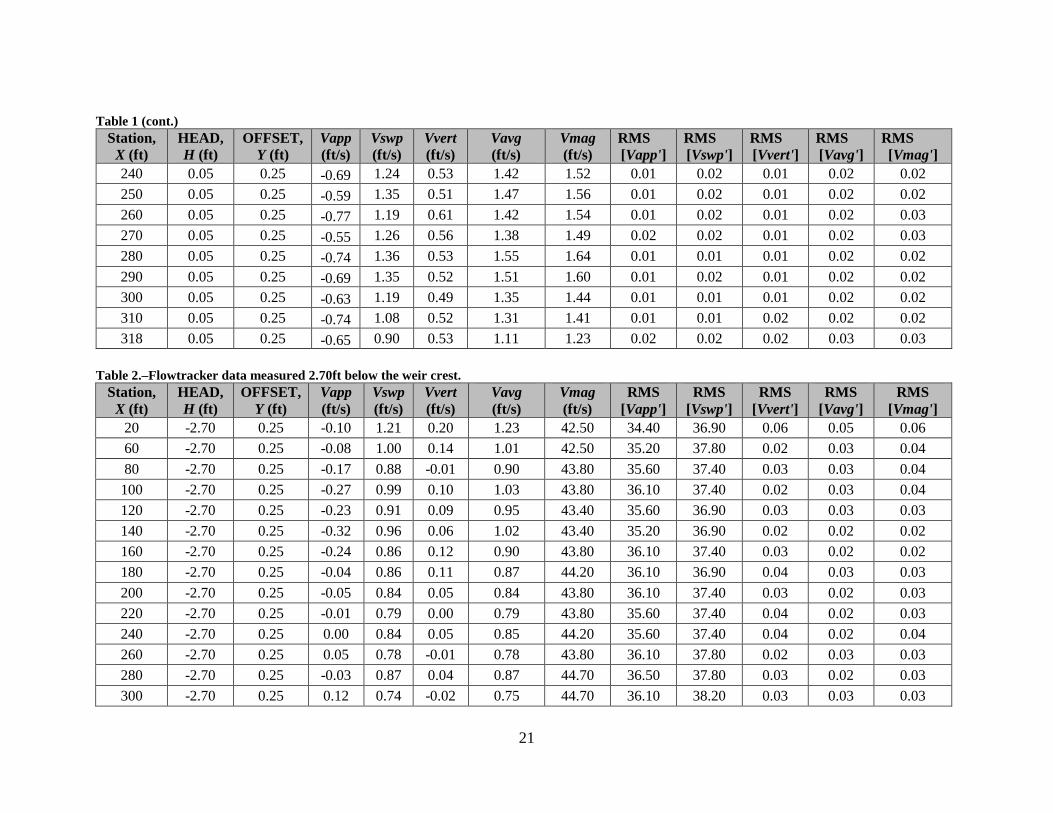
Table 1.–Flowtracker data measured on top of the weir crest. ............................. 20
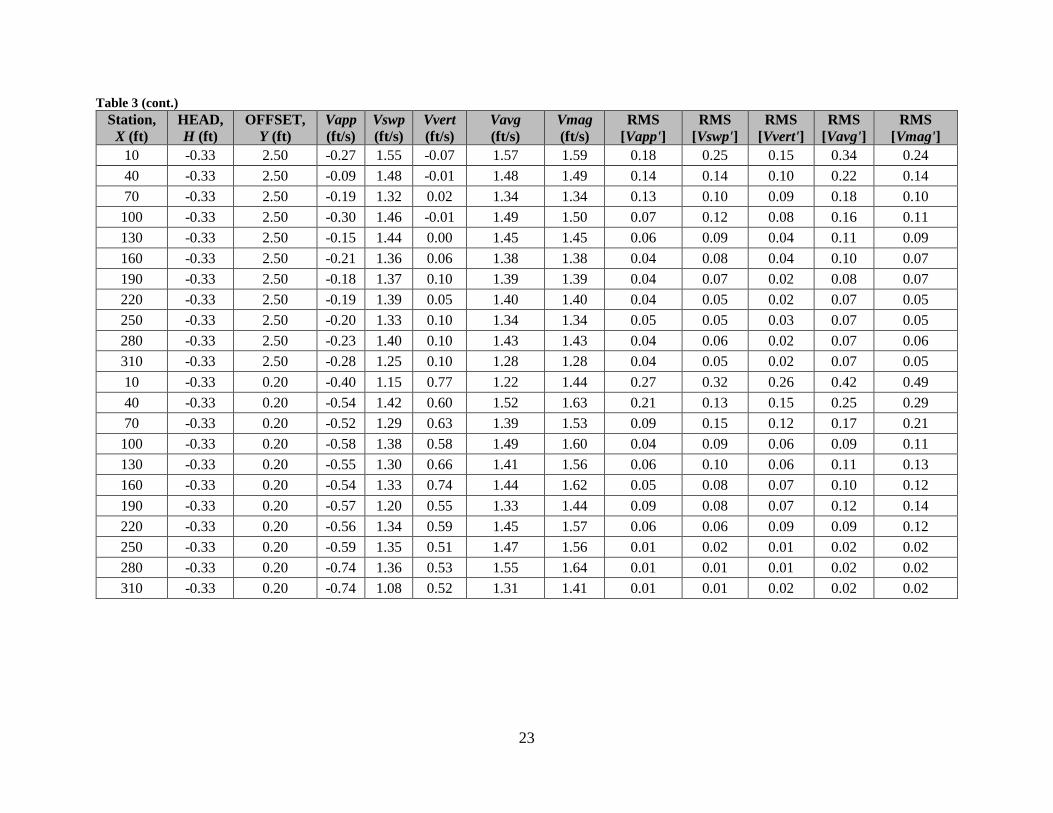
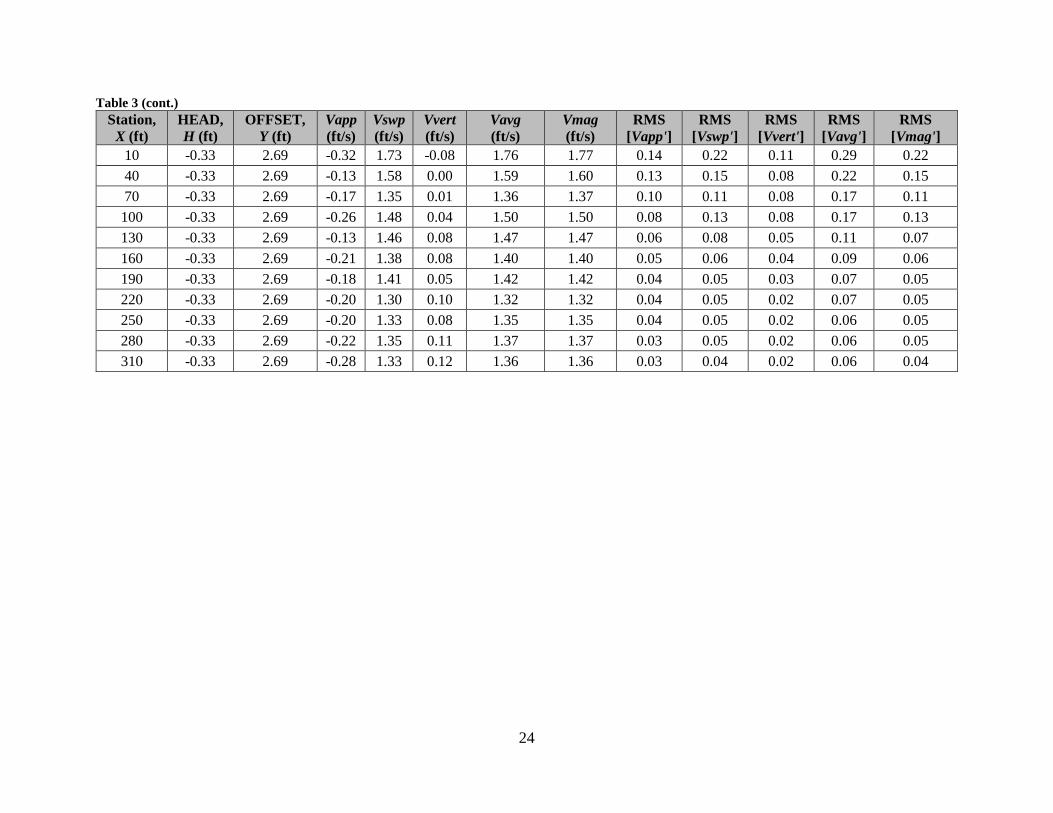
Table 2.–Flowtracker data measured 2.70ft below the weir crest. ....................... 21 Table 3.–Sontek ADV velocity data measured at H = - 0.33ft ............................. 22 Table 4.–Sontek ADV velocity data measured at H = - 0.66ft ............................. 25
Table 5.–Sontek ADV velocity data measured at H = - 1.00ft ............................. 27 Table 6.–Sontek ADV velocity data measured at H = - 1.33ft ............................. 29
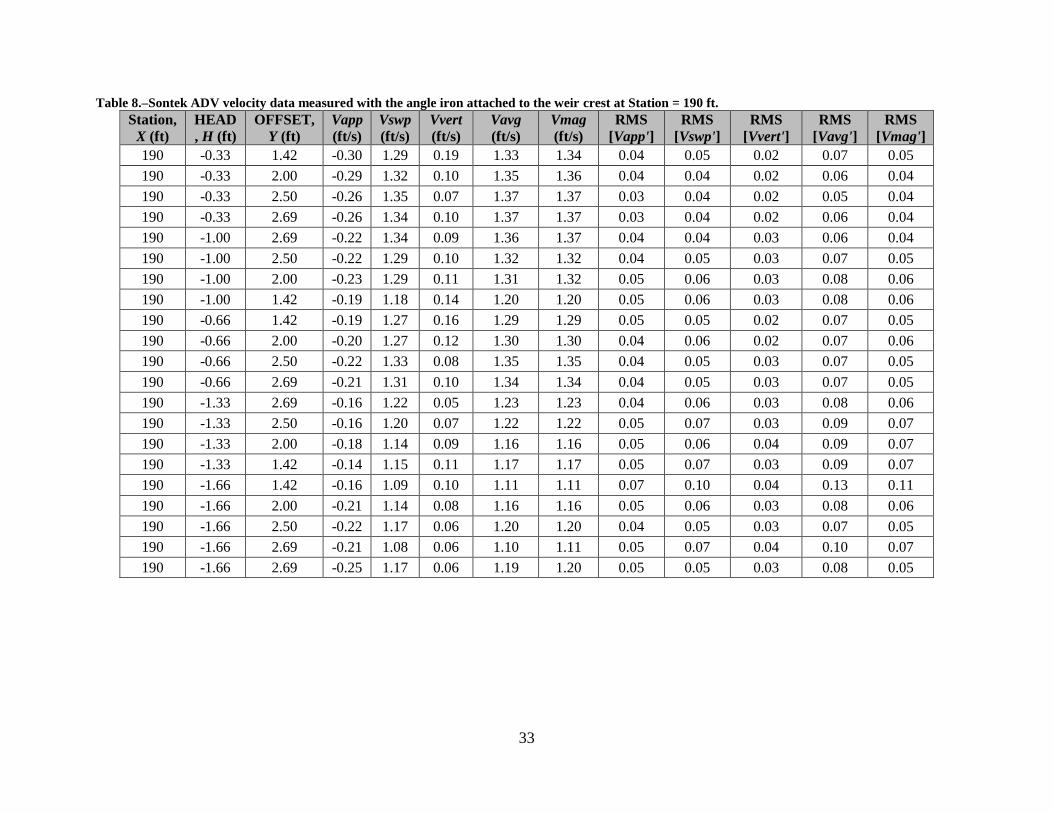
Table 7.–Sontek ADV velocity data measured at H = - 1.66ft ............................. 31 Table 8.–Sontek ADV velocity data measured with the angle iron attached to the
weir crest at Station = 190 ft. ................................................................................ 33
4
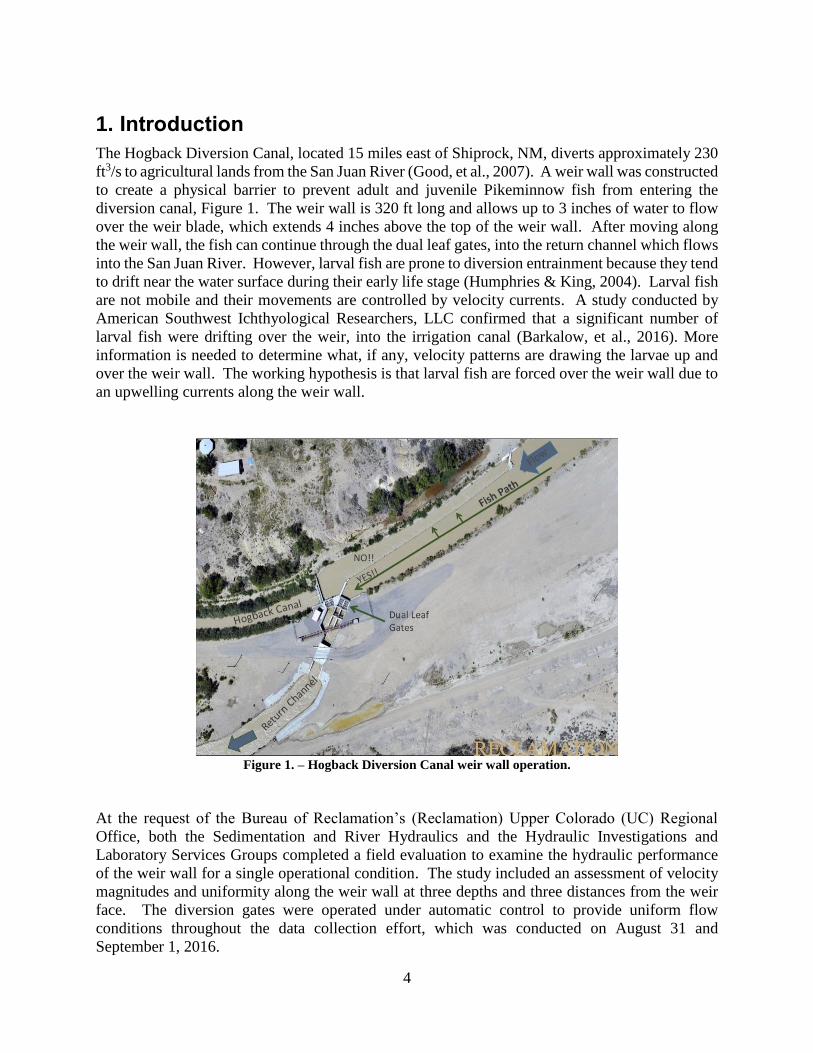
1. Introduction
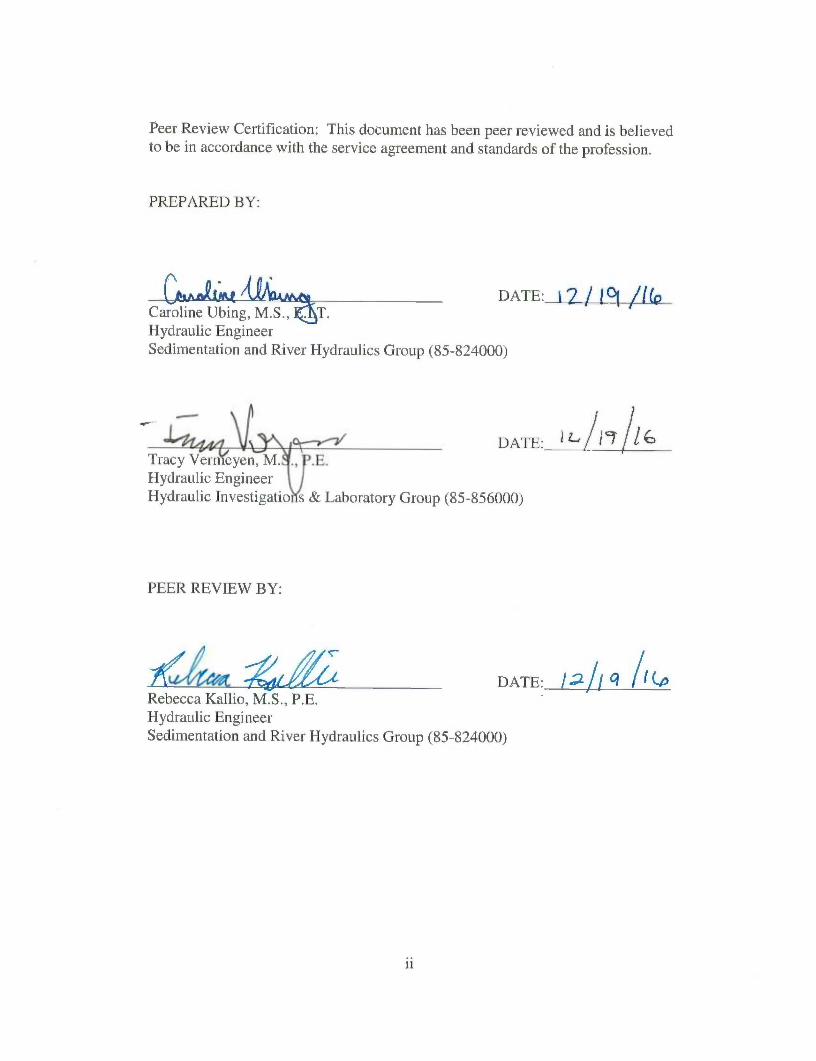
The Hogback Diversion Canal, located 15 miles east of Shiprock, NM, diverts approximately 230
ft3/s to agricultural lands from the San Juan River (Good, et al., 2007). A weir wall was constructed
to create a physical barrier to prevent adult and juvenile Pikeminnow fish from entering the
diversion canal, Figure 1. The weir wall is 320 ft long and allows up to 3 inches of water to flow
over the weir blade, which extends 4 inches above the top of the weir wall. After moving along
the weir wall, the fish can continue through the dual leaf gates, into the return channel which flows
into the San Juan River. However, larval fish are prone to diversion entrainment because they tend
to drift near the water surface during their early life stage (Humphries & King, 2004). Larval fish
are not mobile and their movements are controlled by velocity currents. A study conducted by
American Southwest Ichthyological Researchers, LLC confirmed that a significant number of
larval fish were drifting over the weir, into the irrigation canal (Barkalow, et al., 2016). More
information is needed to determine what, if any, velocity patterns are drawing the larvae up and
over the weir wall. The working hypothesis is that larval fish are forced over the weir wall due to
an upwelling currents along the weir wall.
Figure 1. – Hogback Diversion Canal weir wall operation.
At the request of the Bureau of Reclamation’s (Reclamation) Upper Colorado (UC) Regional
Office, both the Sedimentation and River Hydraulics and the Hydraulic Investigations and
Laboratory Services Groups completed a field evaluation to examine the hydraulic performance
of the weir wall for a single operational condition. The study included an assessment of velocity
magnitudes and uniformity along the weir wall at three depths and three distances from the weir
face. The diversion gates were operated under automatic control to provide uniform flow
conditions throughout the data collection effort, which was conducted on August 31 and
September 1, 2016.
5
2. Methods and Materials
Data Collection
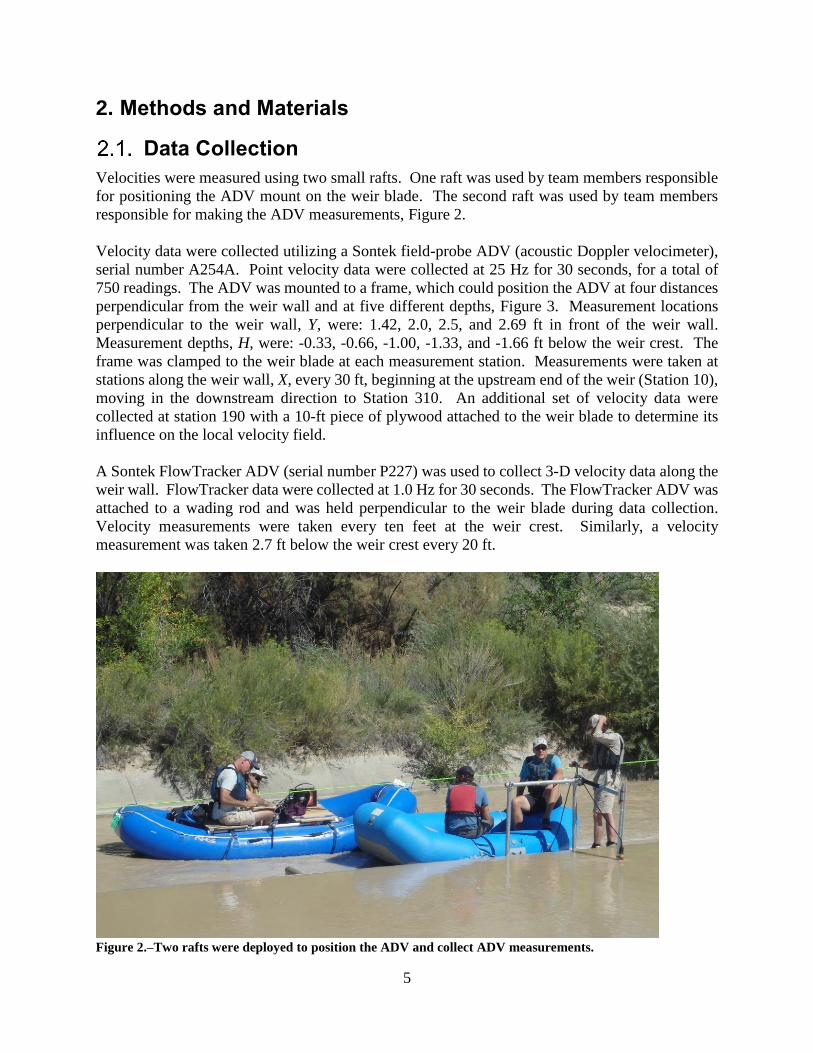
Velocities were measured using two small rafts. One raft was used by team members responsible
for positioning the ADV mount on the weir blade. The second raft was used by team members
responsible for making the ADV measurements, Figure 2.
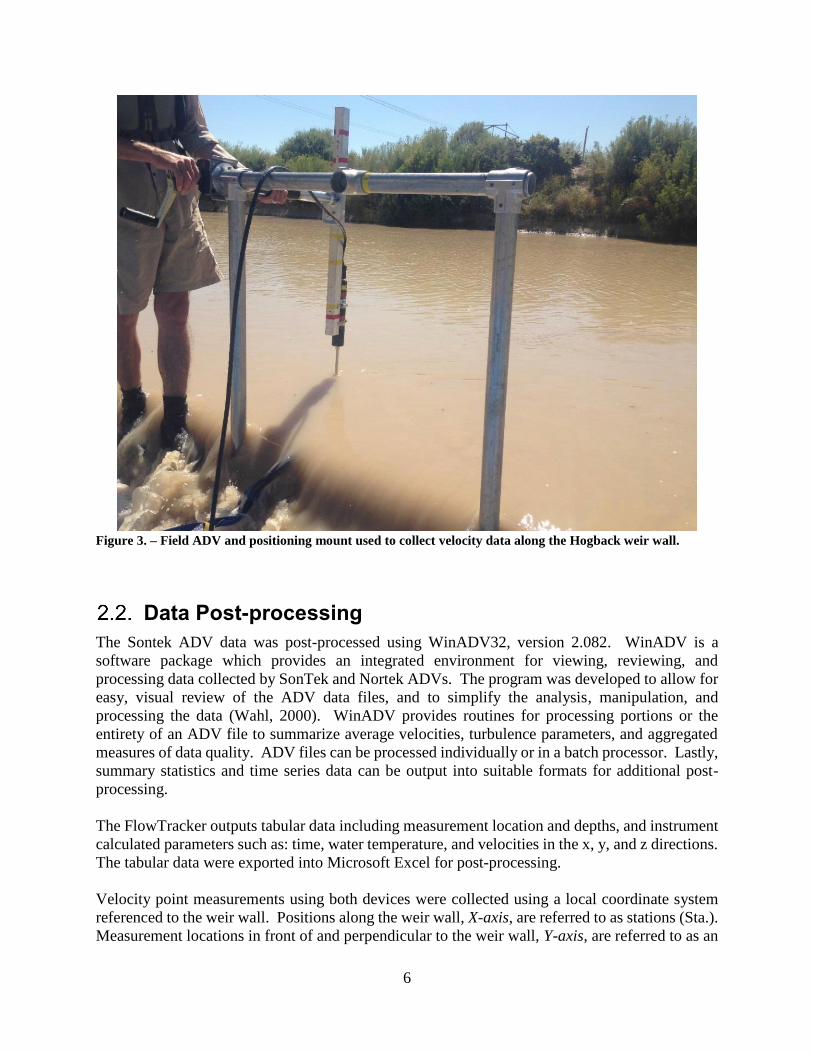
Velocity data were collected utilizing a Sontek field-probe ADV (acoustic Doppler velocimeter),
serial number A254A. Point velocity data were collected at 25 Hz for 30 seconds, for a total of
750 readings. The ADV was mounted to a frame, which could position the ADV at four distances
perpendicular from the weir wall and at five different depths, Figure 3. Measurement locations
perpendicular to the weir wall, Y, were: 1.42, 2.0, 2.5, and 2.69 ft in front of the weir wall.
Measurement depths, H, were: -0.33, -0.66, -1.00, -1.33, and -1.66 ft below the weir crest. The
frame was clamped to the weir blade at each measurement station. Measurements were taken at
stations along the weir wall, X, every 30 ft, beginning at the upstream end of the weir (Station 10),
moving in the downstream direction to Station 310. An additional set of velocity data were
collected at station 190 with a 10-ft piece of plywood attached to the weir blade to determine its
influence on the local velocity field.
A Sontek FlowTracker ADV (serial number P227) was used to collect 3-D velocity data along the
weir wall. FlowTracker data were collected at 1.0 Hz for 30 seconds. The FlowTracker ADV was
attached to a wading rod and was held perpendicular to the weir blade during data collection.
Velocity measurements were taken every ten feet at the weir crest. Similarly, a velocity
measurement was taken 2.7 ft below the weir crest every 20 ft.
Figure 2.–Two rafts were deployed to position the ADV and collect ADV measurements.
6
Figure 3. – Field ADV and positioning mount used to collect velocity data along the Hogback weir wall.
Data Post-processing
The Sontek ADV data was post-processed using WinADV32, version 2.082. WinADV is a
software package which provides an integrated environment for viewing, reviewing, and
processing data collected by SonTek and Nortek ADVs. The program was developed to allow for
easy, visual review of the ADV data files, and to simplify the analysis, manipulation, and
processing the data (Wahl, 2000). WinADV provides routines for processing portions or the
entirety of an ADV file to summarize average velocities, turbulence parameters, and aggregated
measures of data quality. ADV files can be processed individually or in a batch processor. Lastly,
summary statistics and time series data can be output into suitable formats for additional post-
processing.
The FlowTracker outputs tabular data including measurement location and depths, and instrument
calculated parameters such as: time, water temperature, and velocities in the x, y, and z directions.
The tabular data were exported into Microsoft Excel for post-processing.
Velocity point measurements using both devices were collected using a local coordinate system
referenced to the weir wall. Positions along the weir wall, X-axis, are referred to as stations (Sta.).
Measurement locations in front of and perpendicular to the weir wall, Y-axis, are referred to as an
7
offset from the weir wall. Lastly, measurement depths relative to the weir crest are referred to as
head (H). The weir crest is at H = 0.0 ft. Therefore, a measurement collected below the weir crest
is a negative head (-H).
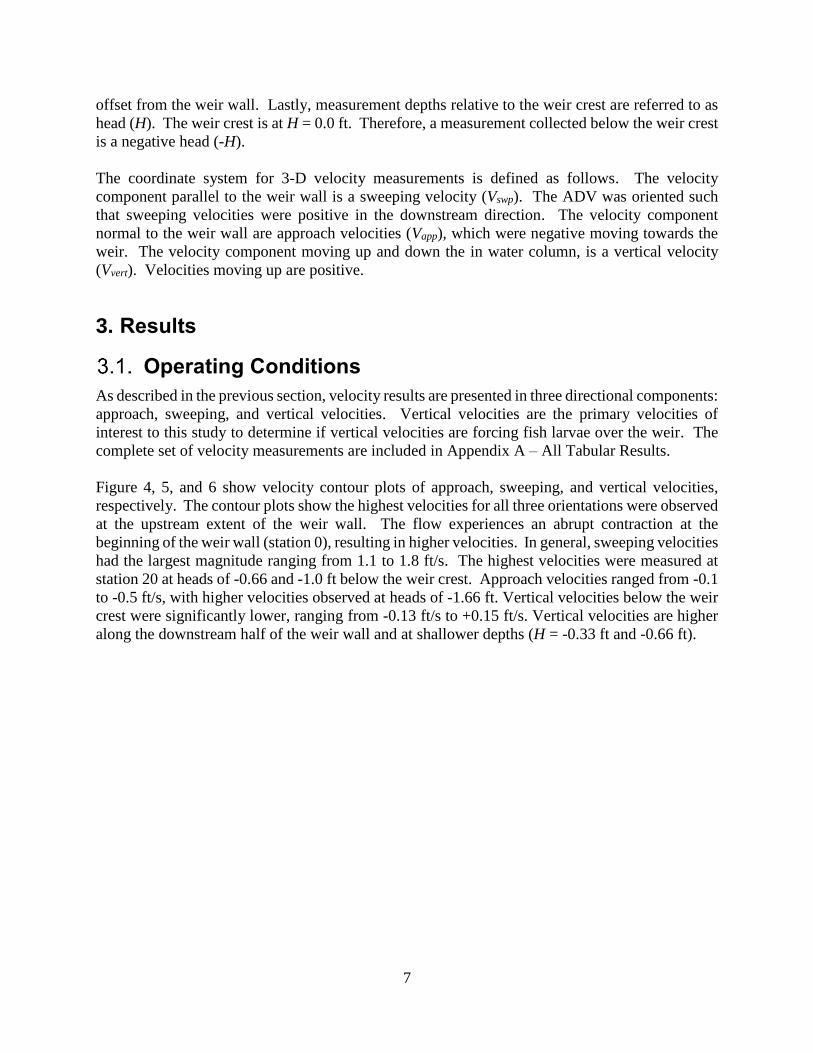
The coordinate system for 3-D velocity measurements is defined as follows. The velocity
component parallel to the weir wall is a sweeping velocity (Vswp). The ADV was oriented such
that sweeping velocities were positive in the downstream direction. The velocity component
normal to the weir wall are approach velocities (Vapp), which were negative moving towards the
weir. The velocity component moving up and down the in water column, is a vertical velocity
(Vvert). Velocities moving up are positive.
3. Results
Operating Conditions
As described in the previous section, velocity results are presented in three directional components:
approach, sweeping, and vertical velocities. Vertical velocities are the primary velocities of
interest to this study to determine if vertical velocities are forcing fish larvae over the weir. The
complete set of velocity measurements are included in Appendix A – All Tabular Results.
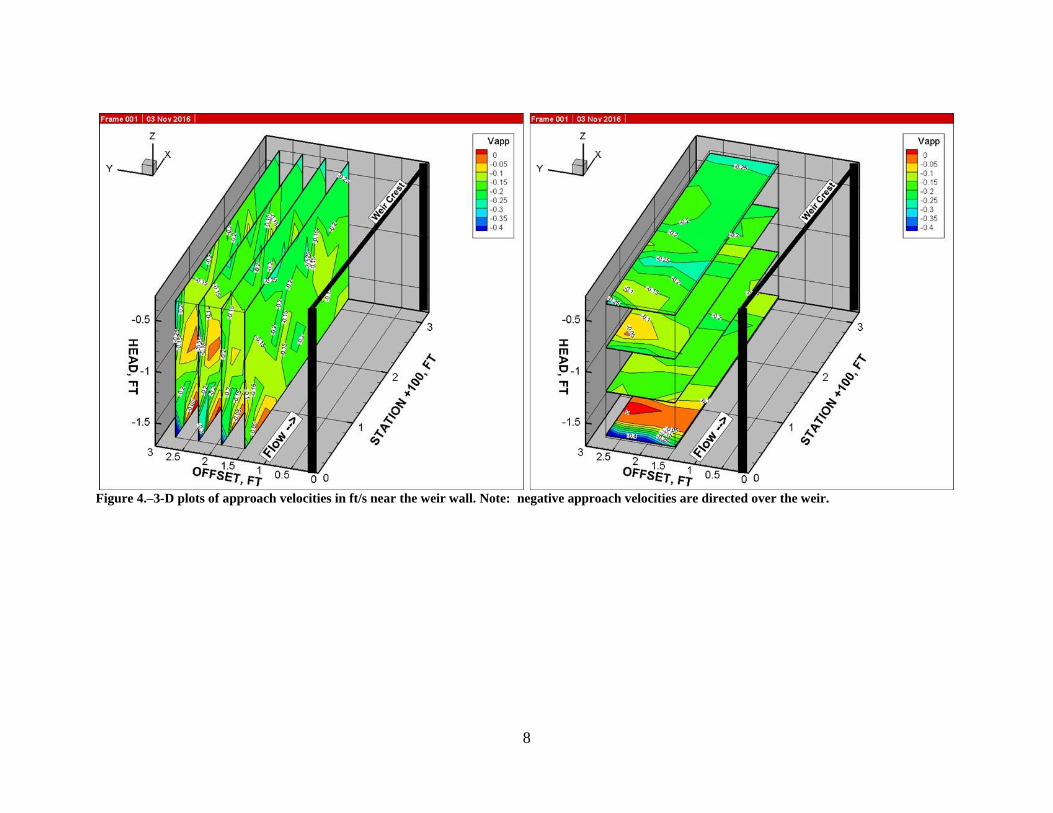
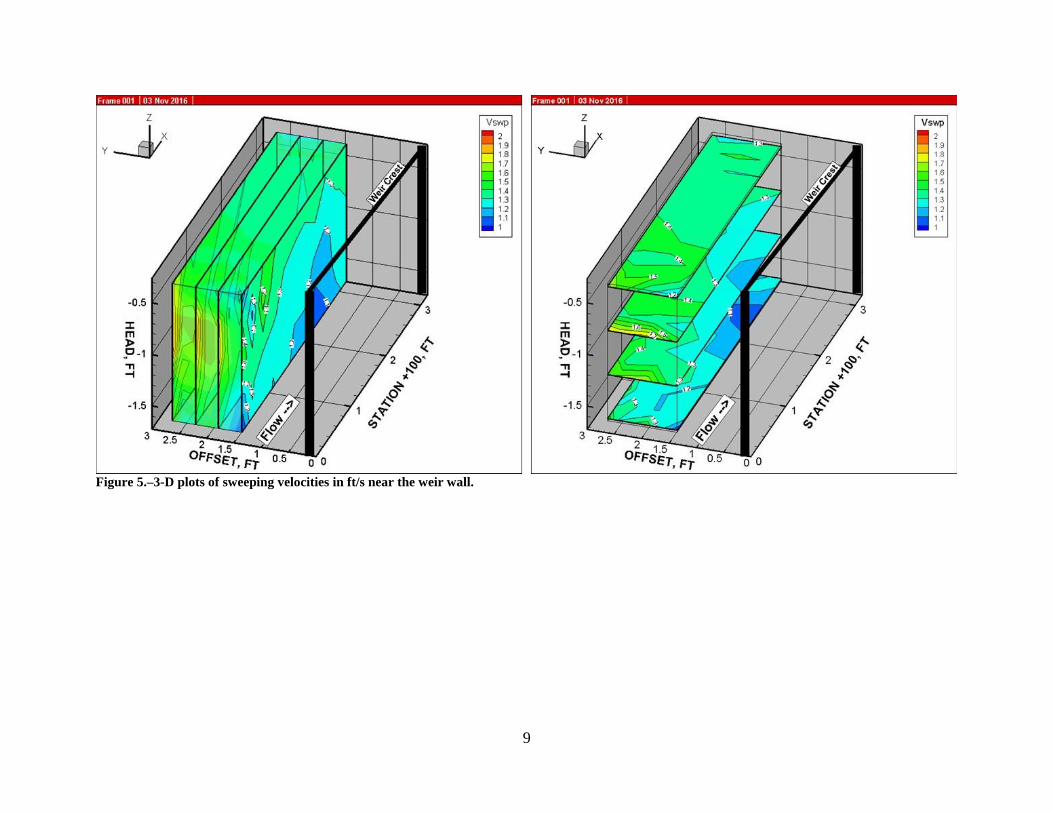
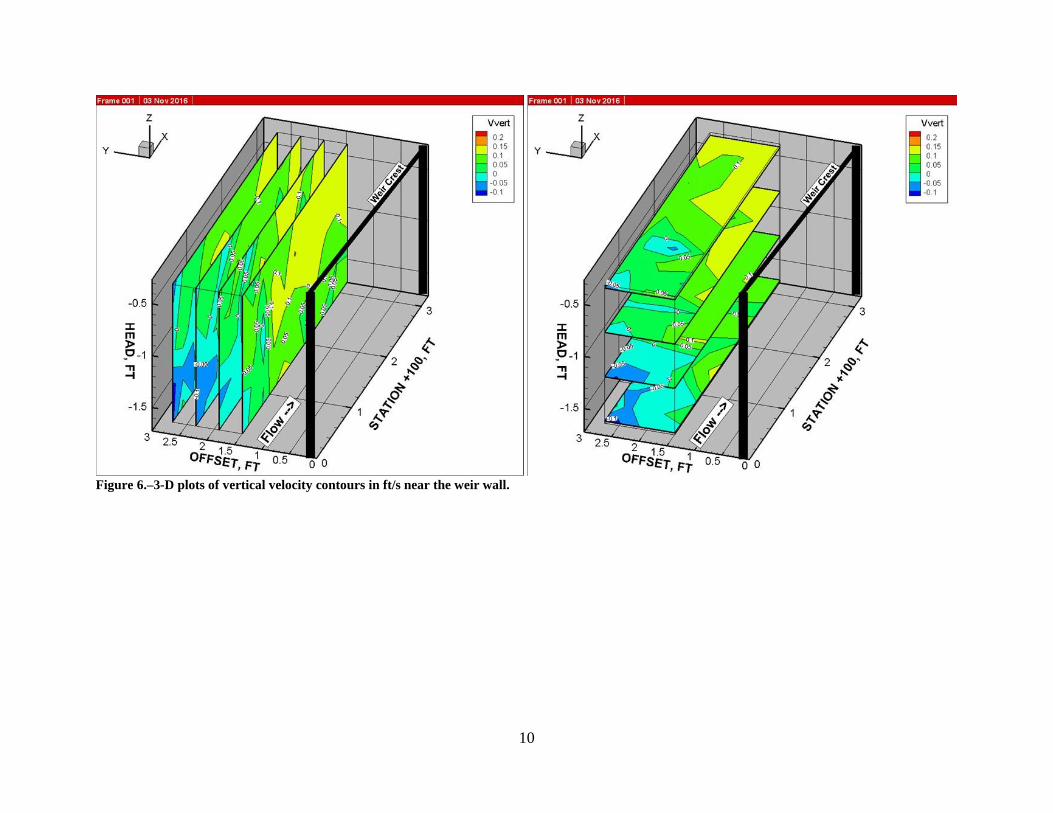
Figure 4, 5, and 6 show velocity contour plots of approach, sweeping, and vertical velocities,
respectively. The contour plots show the highest velocities for all three orientations were observed
at the upstream extent of the weir wall. The flow experiences an abrupt contraction at the
beginning of the weir wall (station 0), resulting in higher velocities. In general, sweeping velocities
had the largest magnitude ranging from 1.1 to 1.8 ft/s. The highest velocities were measured at
station 20 at heads of -0.66 and -1.0 ft below the weir crest. Approach velocities ranged from -0.1
to -0.5 ft/s, with higher velocities observed at heads of -1.66 ft. Vertical velocities below the weir
crest were significantly lower, ranging from -0.13 ft/s to +0.15 ft/s. Vertical velocities are higher
along the downstream half of the weir wall and at shallower depths (H = -0.33 ft and -0.66 ft).
8
Figure 4.–3-D plots of approach velocities in ft/s near the weir wall. Note: negative approach velocities are directed over the weir.
9
Figure 5.–3-D plots of sweeping velocities in ft/s near the weir wall.
10
Figure 6.–3-D plots of vertical velocity contours in ft/s near the weir wall.
11
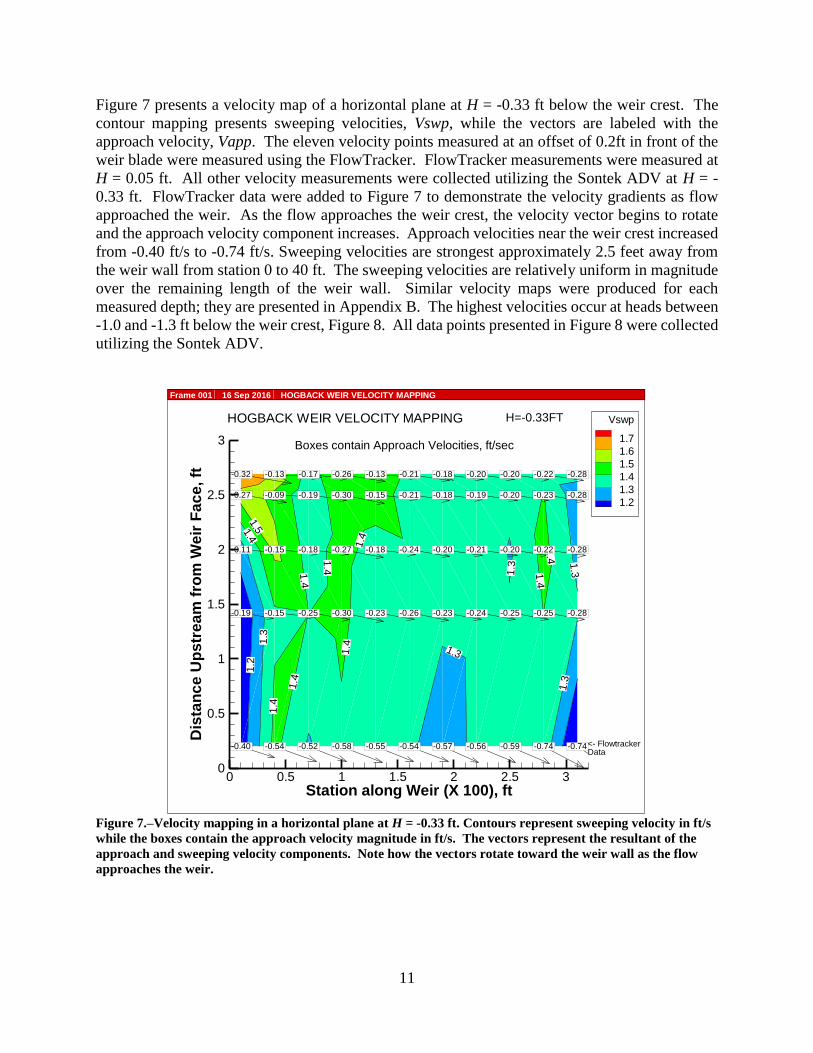
Figure 7 presents a velocity map of a horizontal plane at H = -0.33 ft below the weir crest. The
contour mapping presents sweeping velocities, Vswp, while the vectors are labeled with the
approach velocity, Vapp. The eleven velocity points measured at an offset of 0.2ft in front of the
weir blade were measured using the FlowTracker. FlowTracker measurements were measured at
H = 0.05 ft. All other velocity measurements were collected utilizing the Sontek ADV at H = -
0.33 ft. FlowTracker data were added to Figure 7 to demonstrate the velocity gradients as flow
approached the weir. As the flow approaches the weir crest, the velocity vector begins to rotate
and the approach velocity component increases. Approach velocities near the weir crest increased
from -0.40 ft/s to -0.74 ft/s. Sweeping velocities are strongest approximately 2.5 feet away from
the weir wall from station 0 to 40 ft. The sweeping velocities are relatively uniform in magnitude
over the remaining length of the weir wall. Similar velocity maps were produced for each
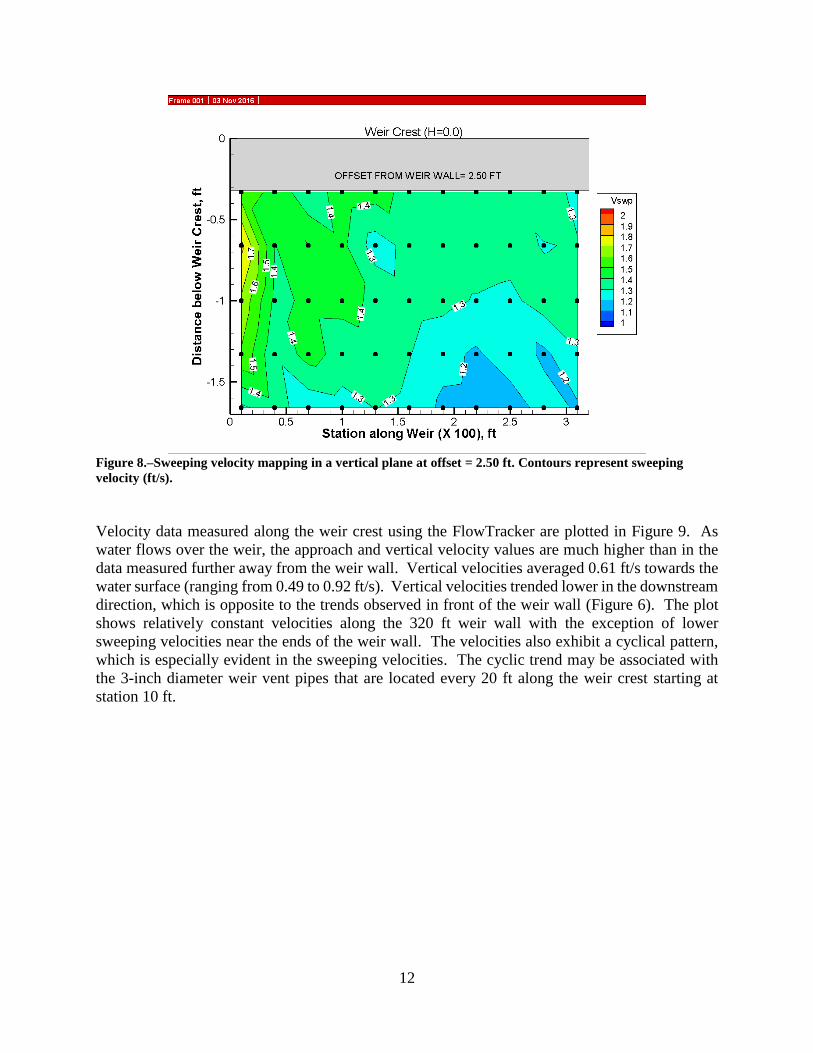
measured depth; they are presented in Appendix B. The highest velocities occur at heads between
-1.0 and -1.3 ft below the weir crest, Figure 8. All data points presented in Figure 8 were collected
utilizing the Sontek ADV.
Figure 7.–Velocity mapping in a horizontal plane at H = -0.33 ft. Contours represent sweeping velocity in ft/s
while the boxes contain the approach velocity magnitude in ft/s. The vectors represent the resultant of the
approach and sweeping velocity components. Note how the vectors rotate toward the weir wall as the flow
approaches the weir.
1.2
1.3
1.3
1.3
1.3
1.3
1.4
1.4
1.4
1.4
1.4
1.4
1.4 1
.41
.4
1.5
-0.19 -0.15 -0.25 -0.30 -0.23 -0.26 -0.23 -0.24 -0.25 -0.25 -0.28
-0.11 -0.15 -0.18 -0.27 -0.18 -0.24 -0.20 -0.21 -0.20 -0.22 -0.28
-0.27 -0.09 -0.19 -0.30 -0.15 -0.21 -0.18 -0.19 -0.20 -0.23 -0.28
-0.40 -0.54 -0.52 -0.58 -0.55 -0.54 -0.57 -0.56 -0.59 -0.74 -0.74
-0.32 -0.13 -0.17 -0.26 -0.13 -0.21 -0.18 -0.20 -0.20 -0.22 -0.28
Station along Weir (X 100), ft
Dis
tan
ce
Up
str
ea
mfr
om
We
irF
ac
e,ft
0 0.5 1 1.5 2 2.5 30
0.5
1
1.5
2
2.5
3
Vswp
1.7
1.6
1.5
1.4
1.3
1.2
H=-0.33FTHOGBACK WEIR VELOCITY MAPPING
Boxes contain Approach Velocities, ft/sec
<- FlowtrackerData
Frame 001 16 Sep 2016 HOGBACK WEIR VELOCITY MAPPING
12
Figure 8.–Sweeping velocity mapping in a vertical plane at offset = 2.50 ft. Contours represent sweeping
velocity (ft/s).
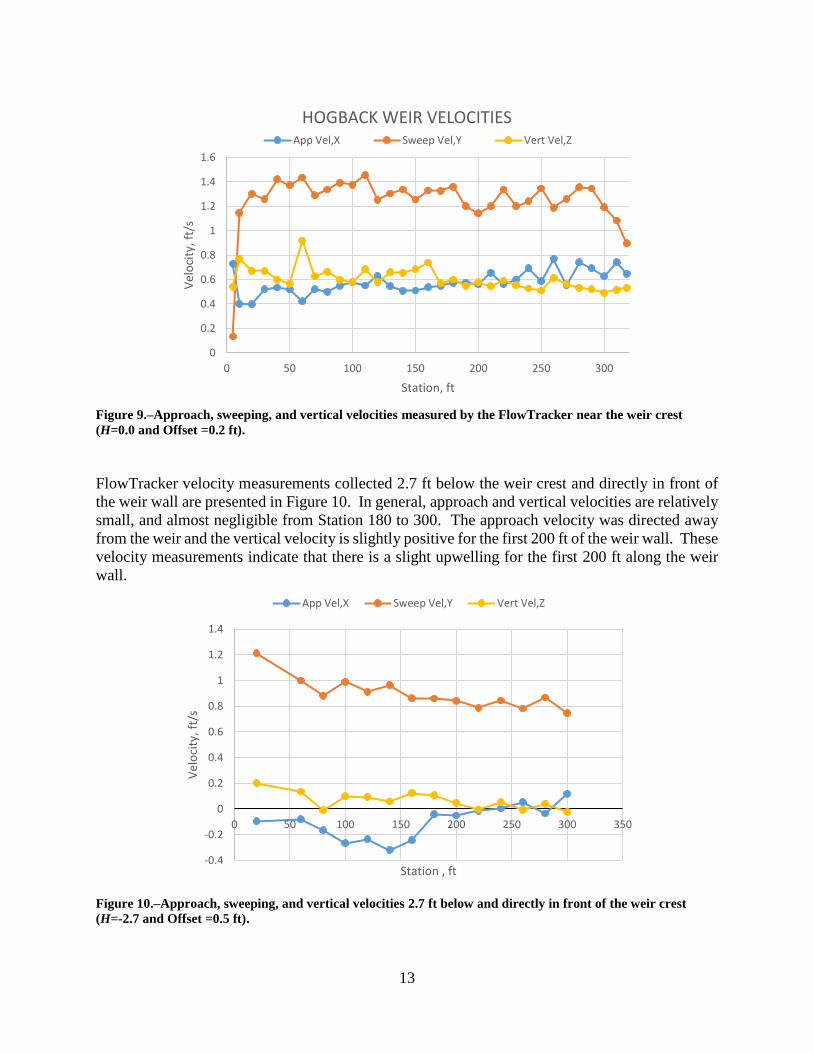
Velocity data measured along the weir crest using the FlowTracker are plotted in Figure 9. As
water flows over the weir, the approach and vertical velocity values are much higher than in the
data measured further away from the weir wall. Vertical velocities averaged 0.61 ft/s towards the
water surface (ranging from 0.49 to 0.92 ft/s). Vertical velocities trended lower in the downstream
direction, which is opposite to the trends observed in front of the weir wall (Figure 6). The plot
shows relatively constant velocities along the 320 ft weir wall with the exception of lower
sweeping velocities near the ends of the weir wall. The velocities also exhibit a cyclical pattern,
which is especially evident in the sweeping velocities. The cyclic trend may be associated with
the 3-inch diameter weir vent pipes that are located every 20 ft along the weir crest starting at
station 10 ft.
13
Figure 9.–Approach, sweeping, and vertical velocities measured by the FlowTracker near the weir crest
(H=0.0 and Offset =0.2 ft).
FlowTracker velocity measurements collected 2.7 ft below the weir crest and directly in front of
the weir wall are presented in Figure 10. In general, approach and vertical velocities are relatively
small, and almost negligible from Station 180 to 300. The approach velocity was directed away
from the weir and the vertical velocity is slightly positive for the first 200 ft of the weir wall. These
velocity measurements indicate that there is a slight upwelling for the first 200 ft along the weir
wall.
Figure 10.–Approach, sweeping, and vertical velocities 2.7 ft below and directly in front of the weir crest
(H=-2.7 and Offset =0.5 ft).
0
0.2
0.4
0.6
0.8
1
1.2
1.4
1.6
0 50 100 150 200 250 300
Vel
oci
ty, f
t/s
Station, ft
HOGBACK WEIR VELOCITIESApp Vel,X Sweep Vel,Y Vert Vel,Z
-0.4
-0.2
0
0.2
0.4
0.6
0.8
1
1.2
1.4
0 50 100 150 200 250 300 350
Vel
oci
ty, f
t/s
Station , ft
App Vel,X Sweep Vel,Y Vert Vel,Z

14
Angle Iron
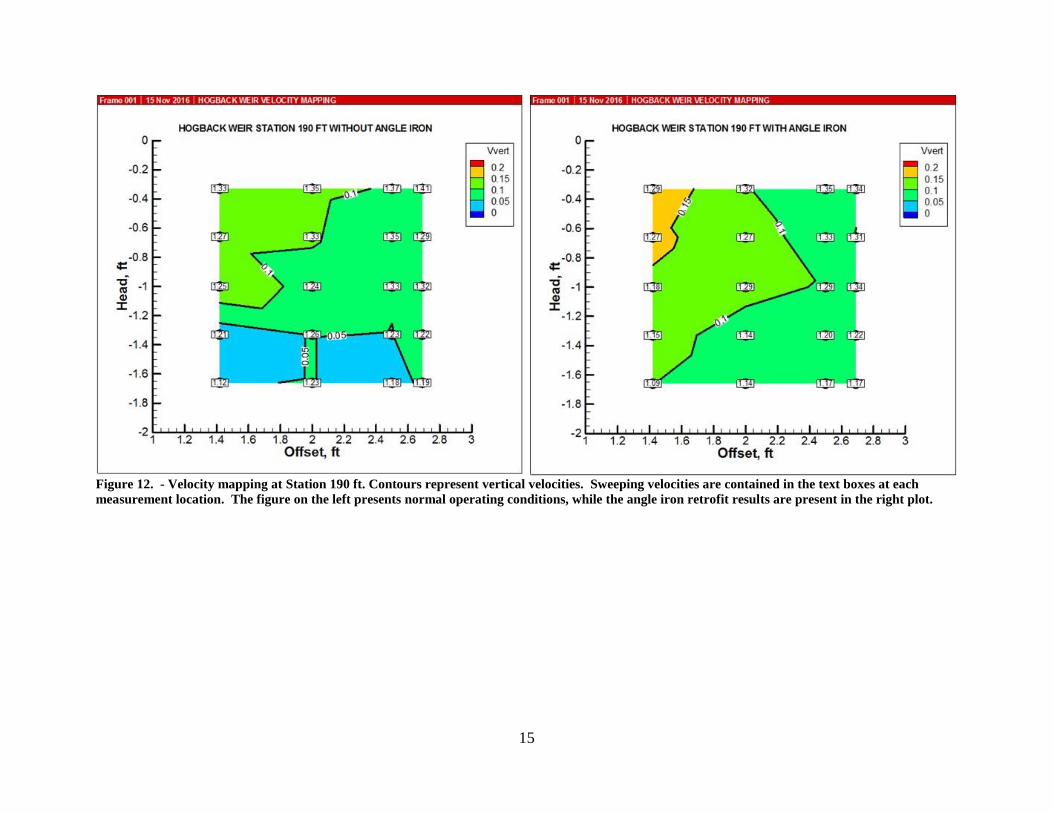
A 10-ft-long piece of plywood, constructed to simulate a length of angle iron, was clamped to the
weir crest at Station 190 to assess its hydraulic performance. The angle iron retrofit was intended
to serve as a barrier to prevent upwelling along the weir wall, to reduce the number of larvae being
drawn over the weir crest. Figure 11 and 12 present vertical velocities measured at Station 190.
Figure 11 is a bubble plot that illustrates how measured vertical velocities were generally higher
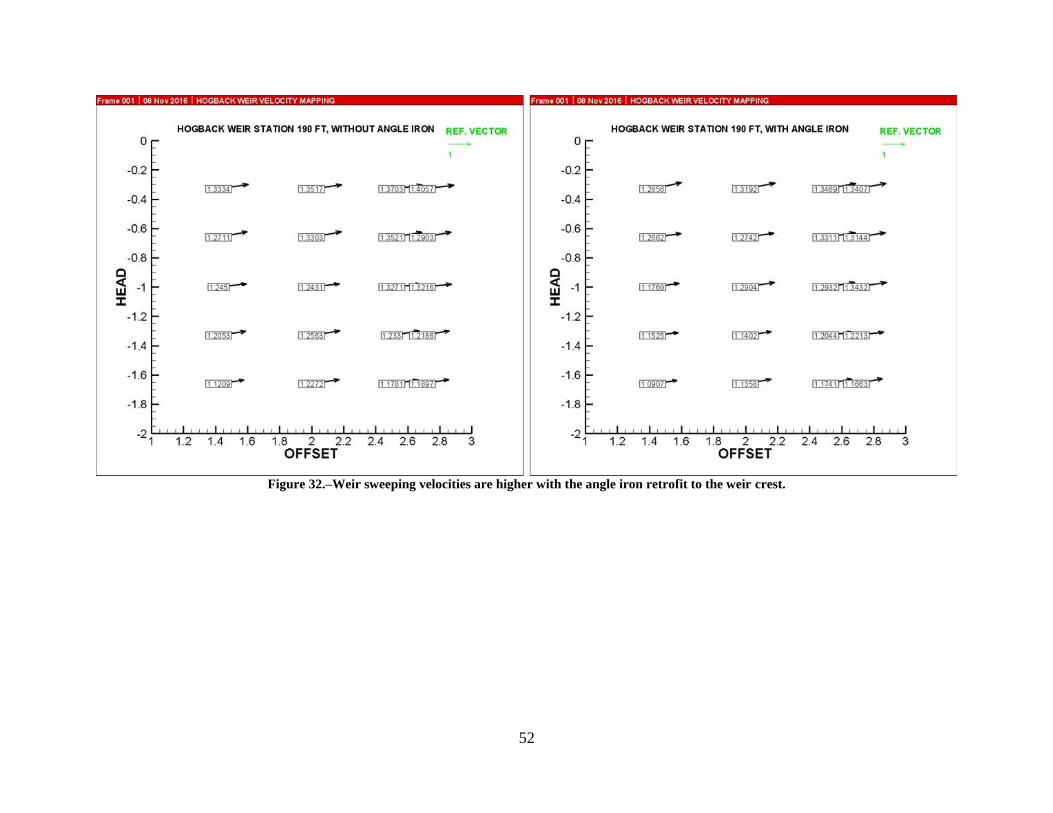
with the angle iron was in place. Figure 12 contains a comparison of velocity maps (in a vertical
plane normal to the weir wall) presenting vertical and sweeping velocities at Station 190 with and
without the angle iron retrofit. Vertical velocities at an offset of 1.42 ft from the weir wall were
more consistently higher with the angle iron installed, except at H = -1.00 ft where they were equal.
No ADV measurements were made closer than 1.42 ft from the weir wall. In addition, as shown
in Figure 10, vertical velocities near the weir wall were decreasing to near zero at station 200.
Therefore, the impacts of the angle iron retrofit on vertical velocities immediately upstream of the
weir wall are inconclusive for this location. It is possible that the angle iron retrofit might have
improved performance at stations with higher vertical velocities such as those measured from
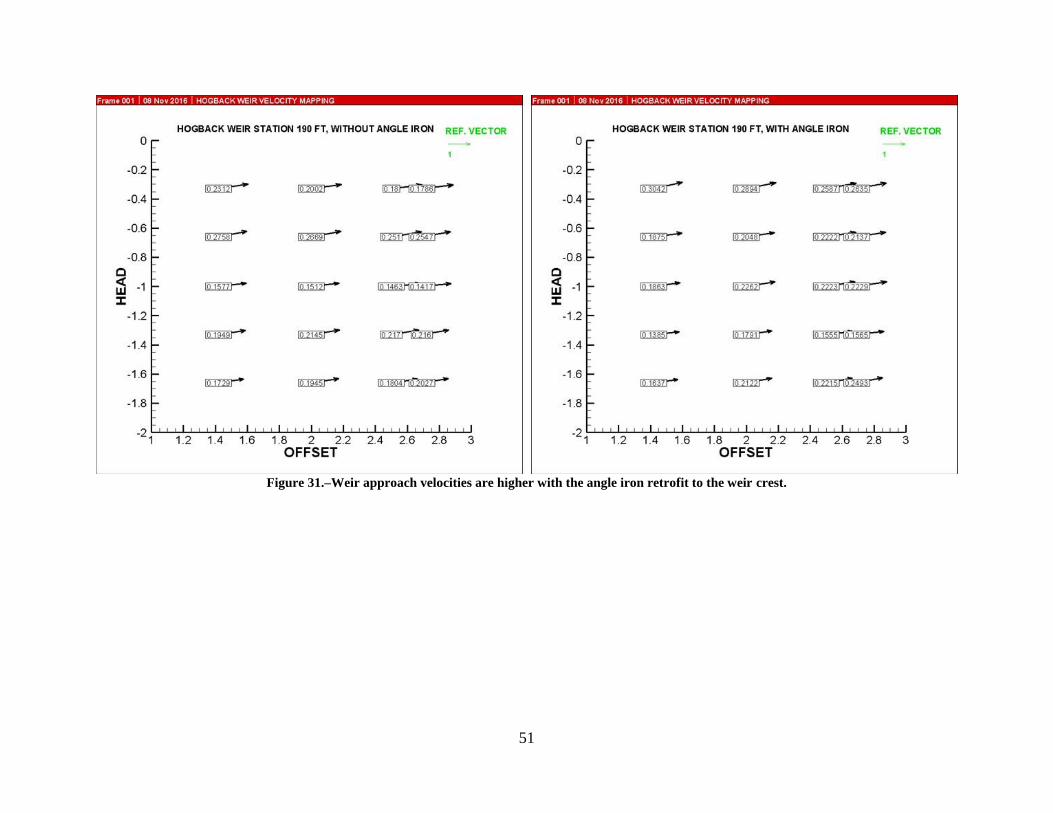
station 0 to 180 ft. Figure 13 contains a comparison of velocity maps (in a vertical plane normal
to the weir wall) presenting sweeping and approach velocities at Station 190 with and without the
angle iron retrofit.
Figure 11.–Vertical velocity at Station 190 ft, varying head and offset. The black bubble at Offset = 0.5 ft and
H = -1.0 ft is included for scale for Vvert = 0.1 ft/s.
-2
-1.8
-1.6
-1.4
-1.2
-1
-0.8
-0.6
-0.4
-0.2
0
0 0.5 1 1.5 2 2.5 3
HEA
D, F
T
OFFSET, FT
Angle Iron, Vz
Operating Conditions, Vz
Scale at Vz = 0.1 ft/s
Wei
rW
all
15
Figure 12. - Velocity mapping at Station 190 ft. Contours represent vertical velocities. Sweeping velocities are contained in the text boxes at each
measurement location. The figure on the left presents normal operating conditions, while the angle iron retrofit results are present in the right plot.
16
Figure 13.–Velocity mapping at Station 190ft. Contours represent approach velocities. Sweeping velocities are labeled in text boxes at each measurement
location. The figure on the left presents operating conditions, while the angle iron retrofit results are presented in the right figure.
17
4. Recommendations
Detailed velocity measurements collected along the Hogback Canal weir wall can be utilized to
determine if approach and vertical velocities are high enough and extend far enough to sweep fish
larvae over the weir crest. Results show that a weak upwelling current occurs along the majority
of the weir length, which could draw larval fish over the weir. A 10-ft-long piece of angle iron
was installed to test if it would decrease vertical and approach velocities at the weir wall. For
ADV measurements taken 1.42 ft to 2.69 ft from the weir wall, all three velocity components
increased slightly in magnitude with the angle iron installed. Even if this trend does not extend all
the way to the weir wall, it is likely that the increase in approach and vertical velocities near the
weir wall would increase larvae entrainment. However, this angle iron location was not ideal
because the approach and vertical velocities were relatively low at station 190. If the angle iron
concept is pursued further, an upstream location would be better suited for subsequent tests. A
few recommendations to prevent fish larvae from being drawn over the weir wall are presented
below:
Log booms are a common means of deflecting floating debris away from intake structures.
A log boom with barrier plate or curtain suspended some depth below the water surface
and secured upstream from the weir wall could provide a physical barrier to prevent larvae
drifting near the water surface from being entrained into the Hogback Canal.
A training wall beginning in between the two leaf gates and extending approximately 70 ft
upstream and parallel to the weir wall could provide another physical barrier to keep larvae
from flowing over the weir. The training wall would need to be tall enough to prevent flow
from overtopping. The wall would direct fish larvae towards the opposite bank, thereby
isolating the larvae from the strong approach velocities near the weir wall.
The dual leaf gates are currently operated by opening and closing the gate closest to the
weir wall. The other gate remains closed. Thus, the channel velocities are higher near the
open gate which moves larvae closer to the weir. Operating the other gate (closest to the
channel bank) may draw fish larvae towards the opposite bank, avoiding passage over the
weir wall and entrainment into the Hogback Canal.
18
5. Conclusion
A weir wall was installed as a physical barrier to prevent adult and juvenile Pikeminnow fish from
entering the division canal. However, larval fish are prone to entrainment as their movements are
controlled by velocity currents. A field evaluation was performed to examine the hydraulic
performance of the weir wall at the request of Reclamation’s Upper Colorado Regional Office.
The study included an assessment of velocity magnitudes and uniformity along the weir wall at
five depths and four distances from the weir face. Velocity data were collected utilizing a Sontek
field-probe ADV and a Sontek FlowTracker ADV. Results show that the sweeping velocities,
parallel to the weir, had the largest magnitudes. Approach velocities experienced the highest
magnitudes occurring -1.66 ft below the weir crest. Vertical velocities were significantly smaller
than both the sweeping and approach velocities, but were higher along the downstream half of the
weir. It is possible that larval fish are being drawn over the weir wall due to a weak upwelling.
To prevent upwelling currents, an angle iron retrofit was attached to the weir wall during the
investigation to serve as a physical barrier. The results of attaching the angle iron retrofit were
inconclusive. Other recommendations to prevent fish larvae from being drawn over the wall
include log booms, a training wall, or adjusting the operation of the dual leaf gates.
19
6. References
Barkalow, S., Brandenburg, W., Dudley, R., Platania, S., & McKinstry, M. (2016). Evaluation of
Larval Fish Entrainment in the Hogback Diversion Canal. American Southwest
Ichthyological Researchers, L.L.C.
Good, D., Moran, K., Brooks, J., Wernke, M., Sayer, K., Manzanares, E., & McKelvie, D. (2007).
Value Engineering Final Report Hogback Diversion Dam - Fish Screen Project. U.S.
Bureau of Reclamation.
Humphries, P., & King, A. (2004). Drifting fish larvae in Murray-Darling Basin rivers:
Compositions, spatial and temporal patterns and distance drifted. Canberra Workshop June
2003, pg 3-4.
Wahl, T. (2000). Analyzing ADV data using WinADV. joint conference on water resources
engineering and water resources planning and management. VA: American Society of
Civil Engineers.
20
Appendix A – All Tabular Results
Table 1.–Flowtracker data measured on top of the weir crest.
Station,
X (ft)
HEAD,
H (ft)
OFFSET,
Y (ft)
Vapp
(ft/s)
Vswp
(ft/s)
Vvert
(ft/s)
Vavg
(ft/s)
Vmag
(ft/s)
RMS
[Vapp']
RMS
[Vswp']
RMS
[Vvert']
RMS
[Vavg']
RMS
[Vmag']
5 0.05 0.25 -0.73 0.13 0.54 0.74 0.92 0.35 0.43 0.41 0.56 0.69
10 0.05 0.25 -0.40 1.15 0.77 1.22 1.44 0.27 0.32 0.26 0.42 0.49
20 0.05 0.25 -0.40 1.30 0.67 1.36 1.52 0.17 0.27 0.19 0.32 0.37
30 0.05 0.25 -0.52 1.26 0.67 1.36 1.52 0.10 0.14 0.12 0.18 0.21
40 0.05 0.25 -0.54 1.42 0.60 1.52 1.63 0.21 0.13 0.15 0.25 0.29
50 0.05 0.25 -0.52 1.37 0.57 1.47 1.57 0.08 0.20 0.11 0.22 0.25
60 0.05 0.25 -0.42 1.44 0.92 1.50 1.76 0.09 0.11 0.09 0.14 0.17
70 0.05 0.25 -0.52 1.29 0.63 1.39 1.53 0.09 0.15 0.12 0.17 0.21
80 0.05 0.25 -0.50 1.34 0.66 1.43 1.57 0.06 0.11 0.10 0.13 0.16
90 0.05 0.25 -0.55 1.39 0.60 1.50 1.61 0.06 0.11 0.08 0.12 0.14
100 0.05 0.25 -0.58 1.38 0.58 1.49 1.60 0.04 0.09 0.06 0.09 0.11
110 0.05 0.25 -0.55 1.46 0.69 1.56 1.70 0.04 0.09 0.06 0.09 0.11
120 0.05 0.25 -0.63 1.25 0.58 1.40 1.52 0.06 0.09 0.07 0.11 0.13
130 0.05 0.25 -0.55 1.30 0.66 1.41 1.56 0.06 0.10 0.06 0.11 0.13
140 0.05 0.25 -0.51 1.34 0.66 1.43 1.57 0.06 0.08 0.07 0.10 0.12
150 0.05 0.25 -0.51 1.26 0.69 1.36 1.52 0.05 0.09 0.05 0.11 0.12
160 0.05 0.25 -0.54 1.33 0.74 1.44 1.62 0.05 0.08 0.07 0.10 0.12
170 0.05 0.25 -0.55 1.33 0.57 1.44 1.55 0.06 0.09 0.05 0.11 0.12
180 0.05 0.25 -0.57 1.36 0.60 1.48 1.59 0.04 0.09 0.07 0.09 0.12
190 0.05 0.25 -0.57 1.20 0.55 1.33 1.44 0.09 0.08 0.07 0.12 0.14
200 0.05 0.25 -0.56 1.14 0.58 1.27 1.40 0.08 0.08 0.08 0.11 0.14
210 0.05 0.25 -0.66 1.20 0.55 1.37 1.47 0.06 0.07 0.06 0.09 0.11
220 0.05 0.25 -0.56 1.34 0.59 1.45 1.57 0.06 0.06 0.09 0.09 0.12
230 0.05 0.25 -0.60 1.20 0.56 1.34 1.45 0.01 0.02 0.01 0.03 0.03
21
Table 1 (cont.)
Station,
X (ft)
HEAD,
H (ft)
OFFSET,
Y (ft)
Vapp
(ft/s)
Vswp
(ft/s)
Vvert
(ft/s)
Vavg
(ft/s)
Vmag
(ft/s)
RMS
[Vapp']
RMS
[Vswp']
RMS
[Vvert']
RMS
[Vavg']
RMS
[Vmag']
240 0.05 0.25 -0.69 1.24 0.53 1.42 1.52 0.01 0.02 0.01 0.02 0.02
250 0.05 0.25 -0.59 1.35 0.51 1.47 1.56 0.01 0.02 0.01 0.02 0.02
260 0.05 0.25 -0.77 1.19 0.61 1.42 1.54 0.01 0.02 0.01 0.02 0.03
270 0.05 0.25 -0.55 1.26 0.56 1.38 1.49 0.02 0.02 0.01 0.02 0.03
280 0.05 0.25 -0.74 1.36 0.53 1.55 1.64 0.01 0.01 0.01 0.02 0.02
290 0.05 0.25 -0.69 1.35 0.52 1.51 1.60 0.01 0.02 0.01 0.02 0.02
300 0.05 0.25 -0.63 1.19 0.49 1.35 1.44 0.01 0.01 0.01 0.02 0.02
310 0.05 0.25 -0.74 1.08 0.52 1.31 1.41 0.01 0.01 0.02 0.02 0.02
318 0.05 0.25 -0.65 0.90 0.53 1.11 1.23 0.02 0.02 0.02 0.03 0.03
Table 2.–Flowtracker data measured 2.70ft below the weir crest.
Station,
X (ft)
HEAD,
H (ft)
OFFSET,
Y (ft)
Vapp
(ft/s)
Vswp
(ft/s)
Vvert
(ft/s)
Vavg
(ft/s)
Vmag
(ft/s)
RMS
[Vapp']
RMS
[Vswp']
RMS
[Vvert']
RMS
[Vavg']
RMS
[Vmag']
20 -2.70 0.25 -0.10 1.21 0.20 1.23 42.50 34.40 36.90 0.06 0.05 0.06
60 -2.70 0.25 -0.08 1.00 0.14 1.01 42.50 35.20 37.80 0.02 0.03 0.04
80 -2.70 0.25 -0.17 0.88 -0.01 0.90 43.80 35.60 37.40 0.03 0.03 0.04
100 -2.70 0.25 -0.27 0.99 0.10 1.03 43.80 36.10 37.40 0.02 0.03 0.04
120 -2.70 0.25 -0.23 0.91 0.09 0.95 43.40 35.60 36.90 0.03 0.03 0.03
140 -2.70 0.25 -0.32 0.96 0.06 1.02 43.40 35.20 36.90 0.02 0.02 0.02
160 -2.70 0.25 -0.24 0.86 0.12 0.90 43.80 36.10 37.40 0.03 0.02 0.02
180 -2.70 0.25 -0.04 0.86 0.11 0.87 44.20 36.10 36.90 0.04 0.03 0.03
200 -2.70 0.25 -0.05 0.84 0.05 0.84 43.80 36.10 37.40 0.03 0.02 0.03
220 -2.70 0.25 -0.01 0.79 0.00 0.79 43.80 35.60 37.40 0.04 0.02 0.03
240 -2.70 0.25 0.00 0.84 0.05 0.85 44.20 35.60 37.40 0.04 0.02 0.04
260 -2.70 0.25 0.05 0.78 -0.01 0.78 43.80 36.10 37.80 0.02 0.03 0.03
280 -2.70 0.25 -0.03 0.87 0.04 0.87 44.70 36.50 37.80 0.03 0.02 0.03
300 -2.70 0.25 0.12 0.74 -0.02 0.75 44.70 36.10 38.20 0.03 0.03 0.03

22
Table 3.–Sontek ADV velocity data measured at H = - 0.33ft
Station,
X (ft)
HEAD,
H (ft)
OFFSET
, Y (ft)
Vapp
(ft/s)
Vswp
(ft/s)
Vvert
(ft/s)
Vavg
(ft/s)
Vmag
(ft/s)
RMS
[Vapp']
RMS
[Vswp']
RMS
[Vvert']
RMS
[Vavg']
RMS
[Vmag']
10 -0.33 1.42 -0.19 1.10 0.06 1.12 1.20 0.26 0.34 0.31 0.52 0.32
40 -0.33 1.42 -0.15 1.39 -0.02 1.39 1.40 0.12 0.17 0.10 0.23 0.17
70 -0.33 1.42 -0.25 1.40 0.07 1.42 1.43 0.08 0.11 0.08 0.16 0.11
100 -0.33 1.42 -0.30 1.43 0.05 1.46 1.46 0.07 0.09 0.06 0.12 0.09
130 -0.33 1.42 -0.23 1.32 0.09 1.35 1.35 0.06 0.13 0.05 0.15 0.13
160 -0.33 1.42 -0.26 1.35 0.10 1.37 1.38 0.04 0.08 0.04 0.10 0.08
190 -0.33 1.42 -0.23 1.33 0.12 1.36 1.36 0.04 0.05 0.03 0.07 0.05
220 -0.33 1.42 -0.24 1.35 0.12 1.38 1.38 0.04 0.07 0.03 0.08 0.06
250 -0.33 1.42 -0.25 1.31 0.12 1.34 1.34 0.04 0.08 0.02 0.09 0.08
280 -0.33 1.42 -0.25 1.40 0.11 1.43 1.43 0.04 0.05 0.02 0.07 0.05
310 -0.33 1.42 -0.28 1.31 0.13 1.35 1.35 0.03 0.05 0.02 0.07 0.06
10 -0.33 2.00 -0.11 1.25 0.06 1.26 1.31 0.26 0.31 0.20 0.45 0.30
40 -0.33 2.00 -0.15 1.52 0.03 1.53 1.54 0.12 0.15 0.09 0.21 0.15
70 -0.33 2.00 -0.18 1.36 0.07 1.38 1.38 0.10 0.15 0.08 0.19 0.14
100 -0.33 2.00 -0.27 1.43 -0.07 1.46 1.46 0.08 0.14 0.07 0.18 0.15
130 -0.33 2.00 -0.18 1.37 0.07 1.38 1.38 0.06 0.07 0.04 0.10 0.07
160 -0.33 2.00 -0.24 1.39 0.09 1.41 1.41 0.05 0.09 0.03 0.10 0.09
190 -0.33 2.00 -0.20 1.35 0.11 1.37 1.37 0.04 0.05 0.03 0.07 0.06
220 -0.33 2.00 -0.21 1.39 0.10 1.41 1.41 0.04 0.06 0.02 0.07 0.06
250 -0.33 2.00 -0.20 1.29 0.11 1.31 1.31 0.05 0.07 0.03 0.09 0.08
280 -0.33 2.00 -0.22 1.43 0.09 1.45 1.45 0.04 0.05 0.02 0.07 0.05
310 -0.33 2.00 -0.28 1.28 0.14 1.32 1.32 0.04 0.04 0.01 0.05 0.04
23
Table 3 (cont.)
Station,
X (ft)
HEAD,
H (ft)
OFFSET,
Y (ft)
Vapp
(ft/s)
Vswp
(ft/s)
Vvert
(ft/s)
Vavg
(ft/s)
Vmag
(ft/s)
RMS
[Vapp']
RMS
[Vswp']
RMS
[Vvert']
RMS
[Vavg']
RMS
[Vmag']
10 -0.33 2.50 -0.27 1.55 -0.07 1.57 1.59 0.18 0.25 0.15 0.34 0.24
40 -0.33 2.50 -0.09 1.48 -0.01 1.48 1.49 0.14 0.14 0.10 0.22 0.14
70 -0.33 2.50 -0.19 1.32 0.02 1.34 1.34 0.13 0.10 0.09 0.18 0.10
100 -0.33 2.50 -0.30 1.46 -0.01 1.49 1.50 0.07 0.12 0.08 0.16 0.11
130 -0.33 2.50 -0.15 1.44 0.00 1.45 1.45 0.06 0.09 0.04 0.11 0.09
160 -0.33 2.50 -0.21 1.36 0.06 1.38 1.38 0.04 0.08 0.04 0.10 0.07
190 -0.33 2.50 -0.18 1.37 0.10 1.39 1.39 0.04 0.07 0.02 0.08 0.07
220 -0.33 2.50 -0.19 1.39 0.05 1.40 1.40 0.04 0.05 0.02 0.07 0.05
250 -0.33 2.50 -0.20 1.33 0.10 1.34 1.34 0.05 0.05 0.03 0.07 0.05
280 -0.33 2.50 -0.23 1.40 0.10 1.43 1.43 0.04 0.06 0.02 0.07 0.06
310 -0.33 2.50 -0.28 1.25 0.10 1.28 1.28 0.04 0.05 0.02 0.07 0.05
10 -0.33 0.20 -0.40 1.15 0.77 1.22 1.44 0.27 0.32 0.26 0.42 0.49
40 -0.33 0.20 -0.54 1.42 0.60 1.52 1.63 0.21 0.13 0.15 0.25 0.29
70 -0.33 0.20 -0.52 1.29 0.63 1.39 1.53 0.09 0.15 0.12 0.17 0.21
100 -0.33 0.20 -0.58 1.38 0.58 1.49 1.60 0.04 0.09 0.06 0.09 0.11
130 -0.33 0.20 -0.55 1.30 0.66 1.41 1.56 0.06 0.10 0.06 0.11 0.13
160 -0.33 0.20 -0.54 1.33 0.74 1.44 1.62 0.05 0.08 0.07 0.10 0.12
190 -0.33 0.20 -0.57 1.20 0.55 1.33 1.44 0.09 0.08 0.07 0.12 0.14
220 -0.33 0.20 -0.56 1.34 0.59 1.45 1.57 0.06 0.06 0.09 0.09 0.12
250 -0.33 0.20 -0.59 1.35 0.51 1.47 1.56 0.01 0.02 0.01 0.02 0.02
280 -0.33 0.20 -0.74 1.36 0.53 1.55 1.64 0.01 0.01 0.01 0.02 0.02
310 -0.33 0.20 -0.74 1.08 0.52 1.31 1.41 0.01 0.01 0.02 0.02 0.02
24
Table 3 (cont.)
Station,
X (ft)
HEAD,
H (ft)
OFFSET,
Y (ft)
Vapp
(ft/s)
Vswp
(ft/s)
Vvert
(ft/s)
Vavg
(ft/s)
Vmag
(ft/s)
RMS
[Vapp']
RMS
[Vswp']
RMS
[Vvert']
RMS
[Vavg']
RMS
[Vmag']
10 -0.33 2.69 -0.32 1.73 -0.08 1.76 1.77 0.14 0.22 0.11 0.29 0.22
40 -0.33 2.69 -0.13 1.58 0.00 1.59 1.60 0.13 0.15 0.08 0.22 0.15
70 -0.33 2.69 -0.17 1.35 0.01 1.36 1.37 0.10 0.11 0.08 0.17 0.11
100 -0.33 2.69 -0.26 1.48 0.04 1.50 1.50 0.08 0.13 0.08 0.17 0.13
130 -0.33 2.69 -0.13 1.46 0.08 1.47 1.47 0.06 0.08 0.05 0.11 0.07
160 -0.33 2.69 -0.21 1.38 0.08 1.40 1.40 0.05 0.06 0.04 0.09 0.06
190 -0.33 2.69 -0.18 1.41 0.05 1.42 1.42 0.04 0.05 0.03 0.07 0.05
220 -0.33 2.69 -0.20 1.30 0.10 1.32 1.32 0.04 0.05 0.02 0.07 0.05
250 -0.33 2.69 -0.20 1.33 0.08 1.35 1.35 0.04 0.05 0.02 0.06 0.05
280 -0.33 2.69 -0.22 1.35 0.11 1.37 1.37 0.03 0.05 0.02 0.06 0.05
310 -0.33 2.69 -0.28 1.33 0.12 1.36 1.36 0.03 0.04 0.02 0.06 0.04
25
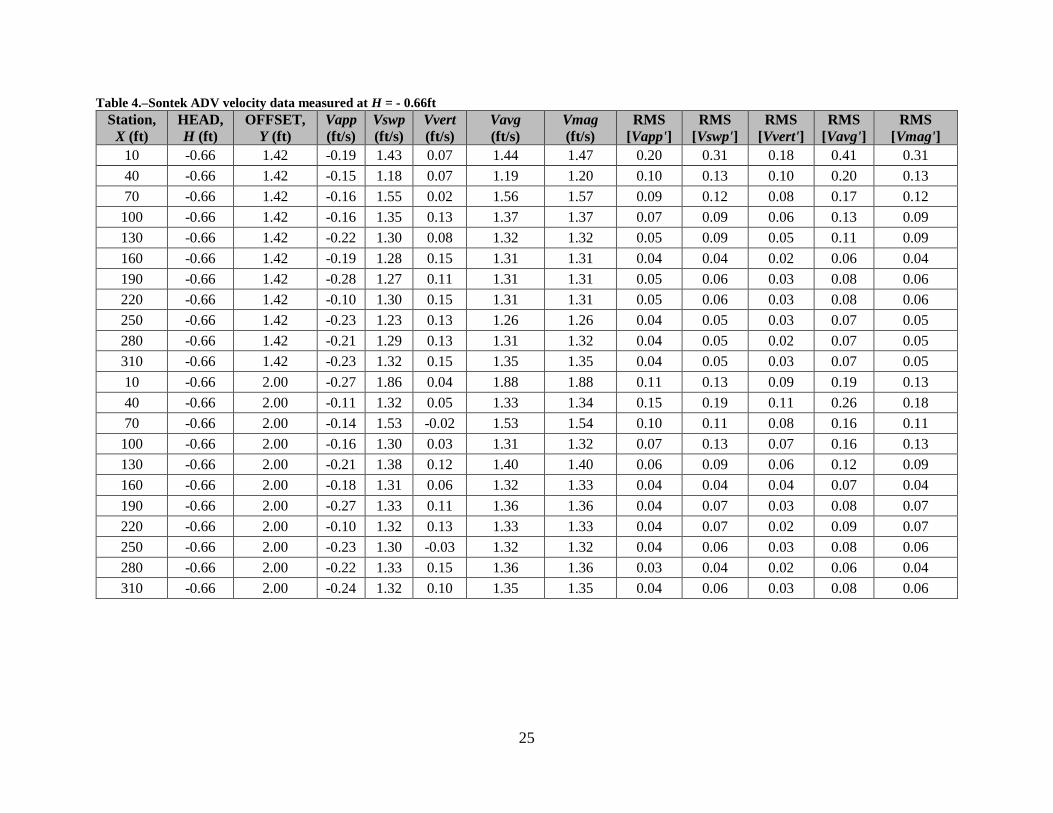
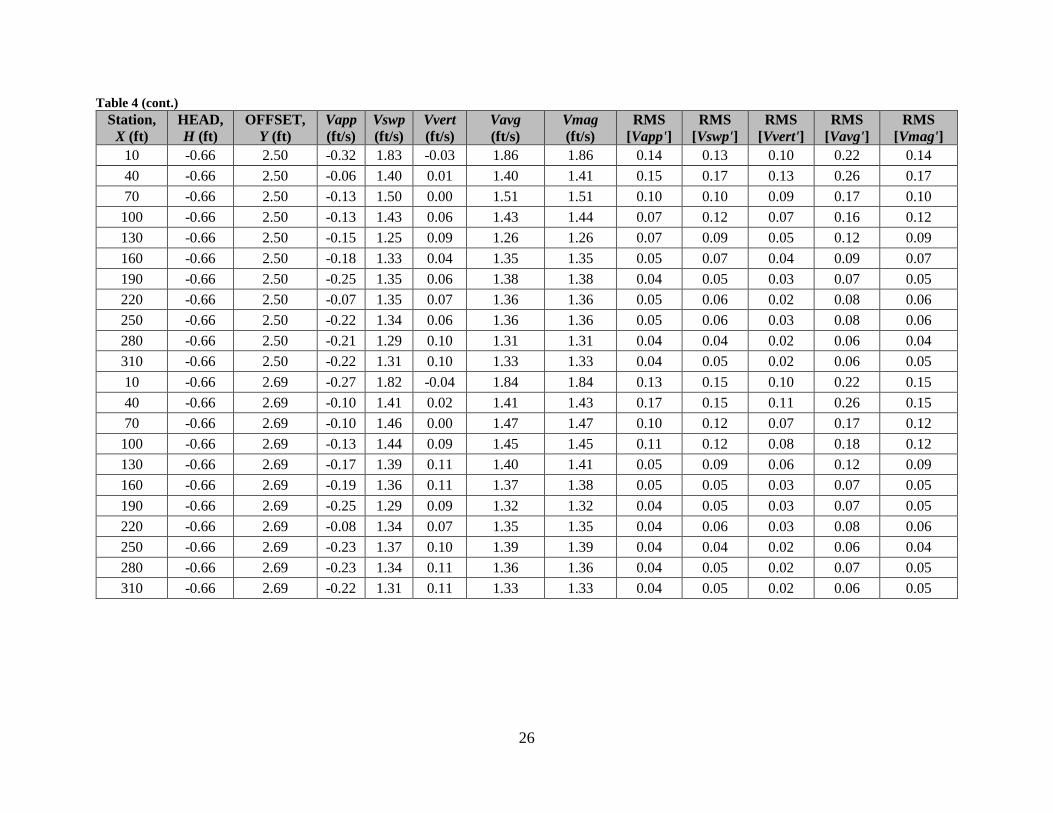
Table 4.–Sontek ADV velocity data measured at H = - 0.66ft
Station,
X (ft)
HEAD,
H (ft)
OFFSET,
Y (ft)
Vapp
(ft/s)
Vswp
(ft/s)
Vvert
(ft/s)
Vavg
(ft/s)
Vmag
(ft/s)
RMS
[Vapp']
RMS
[Vswp']
RMS
[Vvert']
RMS
[Vavg']
RMS
[Vmag']
10 -0.66 1.42 -0.19 1.43 0.07 1.44 1.47 0.20 0.31 0.18 0.41 0.31
40 -0.66 1.42 -0.15 1.18 0.07 1.19 1.20 0.10 0.13 0.10 0.20 0.13
70 -0.66 1.42 -0.16 1.55 0.02 1.56 1.57 0.09 0.12 0.08 0.17 0.12
100 -0.66 1.42 -0.16 1.35 0.13 1.37 1.37 0.07 0.09 0.06 0.13 0.09
130 -0.66 1.42 -0.22 1.30 0.08 1.32 1.32 0.05 0.09 0.05 0.11 0.09
160 -0.66 1.42 -0.19 1.28 0.15 1.31 1.31 0.04 0.04 0.02 0.06 0.04
190 -0.66 1.42 -0.28 1.27 0.11 1.31 1.31 0.05 0.06 0.03 0.08 0.06
220 -0.66 1.42 -0.10 1.30 0.15 1.31 1.31 0.05 0.06 0.03 0.08 0.06
250 -0.66 1.42 -0.23 1.23 0.13 1.26 1.26 0.04 0.05 0.03 0.07 0.05
280 -0.66 1.42 -0.21 1.29 0.13 1.31 1.32 0.04 0.05 0.02 0.07 0.05
310 -0.66 1.42 -0.23 1.32 0.15 1.35 1.35 0.04 0.05 0.03 0.07 0.05
10 -0.66 2.00 -0.27 1.86 0.04 1.88 1.88 0.11 0.13 0.09 0.19 0.13
40 -0.66 2.00 -0.11 1.32 0.05 1.33 1.34 0.15 0.19 0.11 0.26 0.18
70 -0.66 2.00 -0.14 1.53 -0.02 1.53 1.54 0.10 0.11 0.08 0.16 0.11
100 -0.66 2.00 -0.16 1.30 0.03 1.31 1.32 0.07 0.13 0.07 0.16 0.13
130 -0.66 2.00 -0.21 1.38 0.12 1.40 1.40 0.06 0.09 0.06 0.12 0.09
160 -0.66 2.00 -0.18 1.31 0.06 1.32 1.33 0.04 0.04 0.04 0.07 0.04
190 -0.66 2.00 -0.27 1.33 0.11 1.36 1.36 0.04 0.07 0.03 0.08 0.07
220 -0.66 2.00 -0.10 1.32 0.13 1.33 1.33 0.04 0.07 0.02 0.09 0.07
250 -0.66 2.00 -0.23 1.30 -0.03 1.32 1.32 0.04 0.06 0.03 0.08 0.06
280 -0.66 2.00 -0.22 1.33 0.15 1.36 1.36 0.03 0.04 0.02 0.06 0.04
310 -0.66 2.00 -0.24 1.32 0.10 1.35 1.35 0.04 0.06 0.03 0.08 0.06
26
Table 4 (cont.)
Station,
X (ft)
HEAD,
H (ft)
OFFSET,
Y (ft)
Vapp
(ft/s)
Vswp
(ft/s)
Vvert
(ft/s)
Vavg
(ft/s)
Vmag
(ft/s)
RMS
[Vapp']
RMS
[Vswp']
RMS
[Vvert']
RMS
[Vavg']
RMS
[Vmag']
10 -0.66 2.50 -0.32 1.83 -0.03 1.86 1.86 0.14 0.13 0.10 0.22 0.14
40 -0.66 2.50 -0.06 1.40 0.01 1.40 1.41 0.15 0.17 0.13 0.26 0.17
70 -0.66 2.50 -0.13 1.50 0.00 1.51 1.51 0.10 0.10 0.09 0.17 0.10
100 -0.66 2.50 -0.13 1.43 0.06 1.43 1.44 0.07 0.12 0.07 0.16 0.12
130 -0.66 2.50 -0.15 1.25 0.09 1.26 1.26 0.07 0.09 0.05 0.12 0.09
160 -0.66 2.50 -0.18 1.33 0.04 1.35 1.35 0.05 0.07 0.04 0.09 0.07
190 -0.66 2.50 -0.25 1.35 0.06 1.38 1.38 0.04 0.05 0.03 0.07 0.05
220 -0.66 2.50 -0.07 1.35 0.07 1.36 1.36 0.05 0.06 0.02 0.08 0.06
250 -0.66 2.50 -0.22 1.34 0.06 1.36 1.36 0.05 0.06 0.03 0.08 0.06
280 -0.66 2.50 -0.21 1.29 0.10 1.31 1.31 0.04 0.04 0.02 0.06 0.04
310 -0.66 2.50 -0.22 1.31 0.10 1.33 1.33 0.04 0.05 0.02 0.06 0.05
10 -0.66 2.69 -0.27 1.82 -0.04 1.84 1.84 0.13 0.15 0.10 0.22 0.15
40 -0.66 2.69 -0.10 1.41 0.02 1.41 1.43 0.17 0.15 0.11 0.26 0.15
70 -0.66 2.69 -0.10 1.46 0.00 1.47 1.47 0.10 0.12 0.07 0.17 0.12
100 -0.66 2.69 -0.13 1.44 0.09 1.45 1.45 0.11 0.12 0.08 0.18 0.12
130 -0.66 2.69 -0.17 1.39 0.11 1.40 1.41 0.05 0.09 0.06 0.12 0.09
160 -0.66 2.69 -0.19 1.36 0.11 1.37 1.38 0.05 0.05 0.03 0.07 0.05
190 -0.66 2.69 -0.25 1.29 0.09 1.32 1.32 0.04 0.05 0.03 0.07 0.05
220 -0.66 2.69 -0.08 1.34 0.07 1.35 1.35 0.04 0.06 0.03 0.08 0.06
250 -0.66 2.69 -0.23 1.37 0.10 1.39 1.39 0.04 0.04 0.02 0.06 0.04
280 -0.66 2.69 -0.23 1.34 0.11 1.36 1.36 0.04 0.05 0.02 0.07 0.05
310 -0.66 2.69 -0.22 1.31 0.11 1.33 1.33 0.04 0.05 0.02 0.06 0.05
27
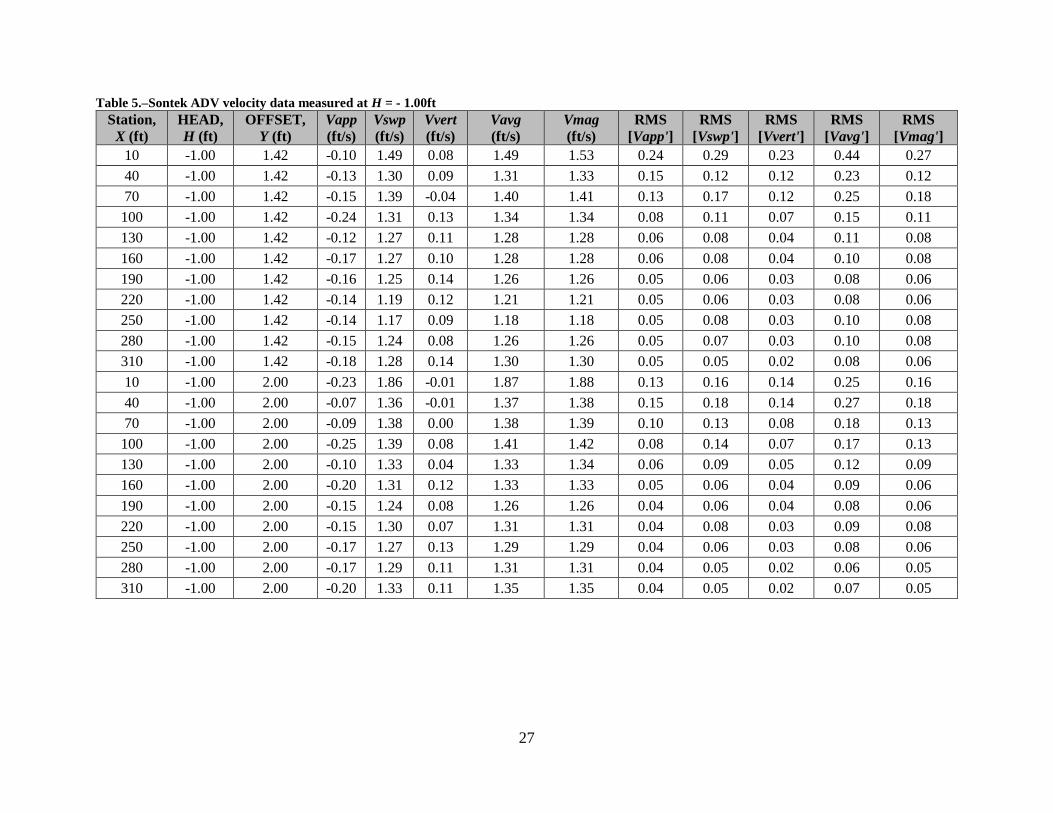
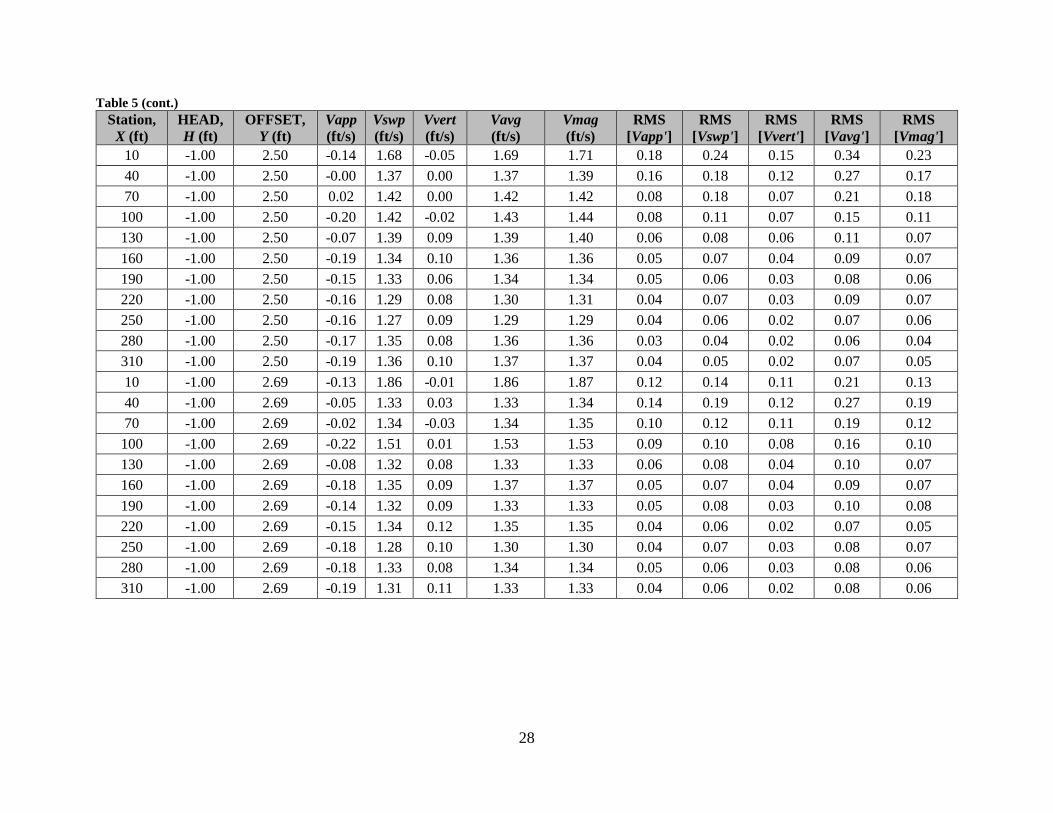
Table 5.–Sontek ADV velocity data measured at H = - 1.00ft
Station,
X (ft)
HEAD,
H (ft)
OFFSET,
Y (ft)
Vapp
(ft/s)
Vswp
(ft/s)
Vvert
(ft/s)
Vavg
(ft/s)
Vmag
(ft/s)
RMS
[Vapp']
RMS
[Vswp']
RMS
[Vvert']
RMS
[Vavg']
RMS
[Vmag']
10 -1.00 1.42 -0.10 1.49 0.08 1.49 1.53 0.24 0.29 0.23 0.44 0.27
40 -1.00 1.42 -0.13 1.30 0.09 1.31 1.33 0.15 0.12 0.12 0.23 0.12
70 -1.00 1.42 -0.15 1.39 -0.04 1.40 1.41 0.13 0.17 0.12 0.25 0.18
100 -1.00 1.42 -0.24 1.31 0.13 1.34 1.34 0.08 0.11 0.07 0.15 0.11
130 -1.00 1.42 -0.12 1.27 0.11 1.28 1.28 0.06 0.08 0.04 0.11 0.08
160 -1.00 1.42 -0.17 1.27 0.10 1.28 1.28 0.06 0.08 0.04 0.10 0.08
190 -1.00 1.42 -0.16 1.25 0.14 1.26 1.26 0.05 0.06 0.03 0.08 0.06
220 -1.00 1.42 -0.14 1.19 0.12 1.21 1.21 0.05 0.06 0.03 0.08 0.06
250 -1.00 1.42 -0.14 1.17 0.09 1.18 1.18 0.05 0.08 0.03 0.10 0.08
280 -1.00 1.42 -0.15 1.24 0.08 1.26 1.26 0.05 0.07 0.03 0.10 0.08
310 -1.00 1.42 -0.18 1.28 0.14 1.30 1.30 0.05 0.05 0.02 0.08 0.06
10 -1.00 2.00 -0.23 1.86 -0.01 1.87 1.88 0.13 0.16 0.14 0.25 0.16
40 -1.00 2.00 -0.07 1.36 -0.01 1.37 1.38 0.15 0.18 0.14 0.27 0.18
70 -1.00 2.00 -0.09 1.38 0.00 1.38 1.39 0.10 0.13 0.08 0.18 0.13
100 -1.00 2.00 -0.25 1.39 0.08 1.41 1.42 0.08 0.14 0.07 0.17 0.13
130 -1.00 2.00 -0.10 1.33 0.04 1.33 1.34 0.06 0.09 0.05 0.12 0.09
160 -1.00 2.00 -0.20 1.31 0.12 1.33 1.33 0.05 0.06 0.04 0.09 0.06
190 -1.00 2.00 -0.15 1.24 0.08 1.26 1.26 0.04 0.06 0.04 0.08 0.06
220 -1.00 2.00 -0.15 1.30 0.07 1.31 1.31 0.04 0.08 0.03 0.09 0.08
250 -1.00 2.00 -0.17 1.27 0.13 1.29 1.29 0.04 0.06 0.03 0.08 0.06
280 -1.00 2.00 -0.17 1.29 0.11 1.31 1.31 0.04 0.05 0.02 0.06 0.05
310 -1.00 2.00 -0.20 1.33 0.11 1.35 1.35 0.04 0.05 0.02 0.07 0.05
28
Table 5 (cont.)
Station,
X (ft)
HEAD,
H (ft)
OFFSET,
Y (ft)
Vapp
(ft/s)
Vswp
(ft/s)
Vvert
(ft/s)
Vavg
(ft/s)
Vmag
(ft/s)
RMS
[Vapp']
RMS
[Vswp']
RMS
[Vvert']
RMS
[Vavg']
RMS
[Vmag']
10 -1.00 2.50 -0.14 1.68 -0.05 1.69 1.71 0.18 0.24 0.15 0.34 0.23
40 -1.00 2.50 -0.00 1.37 0.00 1.37 1.39 0.16 0.18 0.12 0.27 0.17
70 -1.00 2.50 0.02 1.42 0.00 1.42 1.42 0.08 0.18 0.07 0.21 0.18
100 -1.00 2.50 -0.20 1.42 -0.02 1.43 1.44 0.08 0.11 0.07 0.15 0.11
130 -1.00 2.50 -0.07 1.39 0.09 1.39 1.40 0.06 0.08 0.06 0.11 0.07
160 -1.00 2.50 -0.19 1.34 0.10 1.36 1.36 0.05 0.07 0.04 0.09 0.07
190 -1.00 2.50 -0.15 1.33 0.06 1.34 1.34 0.05 0.06 0.03 0.08 0.06
220 -1.00 2.50 -0.16 1.29 0.08 1.30 1.31 0.04 0.07 0.03 0.09 0.07
250 -1.00 2.50 -0.16 1.27 0.09 1.29 1.29 0.04 0.06 0.02 0.07 0.06
280 -1.00 2.50 -0.17 1.35 0.08 1.36 1.36 0.03 0.04 0.02 0.06 0.04
310 -1.00 2.50 -0.19 1.36 0.10 1.37 1.37 0.04 0.05 0.02 0.07 0.05
10 -1.00 2.69 -0.13 1.86 -0.01 1.86 1.87 0.12 0.14 0.11 0.21 0.13
40 -1.00 2.69 -0.05 1.33 0.03 1.33 1.34 0.14 0.19 0.12 0.27 0.19
70 -1.00 2.69 -0.02 1.34 -0.03 1.34 1.35 0.10 0.12 0.11 0.19 0.12
100 -1.00 2.69 -0.22 1.51 0.01 1.53 1.53 0.09 0.10 0.08 0.16 0.10
130 -1.00 2.69 -0.08 1.32 0.08 1.33 1.33 0.06 0.08 0.04 0.10 0.07
160 -1.00 2.69 -0.18 1.35 0.09 1.37 1.37 0.05 0.07 0.04 0.09 0.07
190 -1.00 2.69 -0.14 1.32 0.09 1.33 1.33 0.05 0.08 0.03 0.10 0.08
220 -1.00 2.69 -0.15 1.34 0.12 1.35 1.35 0.04 0.06 0.02 0.07 0.05
250 -1.00 2.69 -0.18 1.28 0.10 1.30 1.30 0.04 0.07 0.03 0.08 0.07
280 -1.00 2.69 -0.18 1.33 0.08 1.34 1.34 0.05 0.06 0.03 0.08 0.06
310 -1.00 2.69 -0.19 1.31 0.11 1.33 1.33 0.04 0.06 0.02 0.08 0.06
29
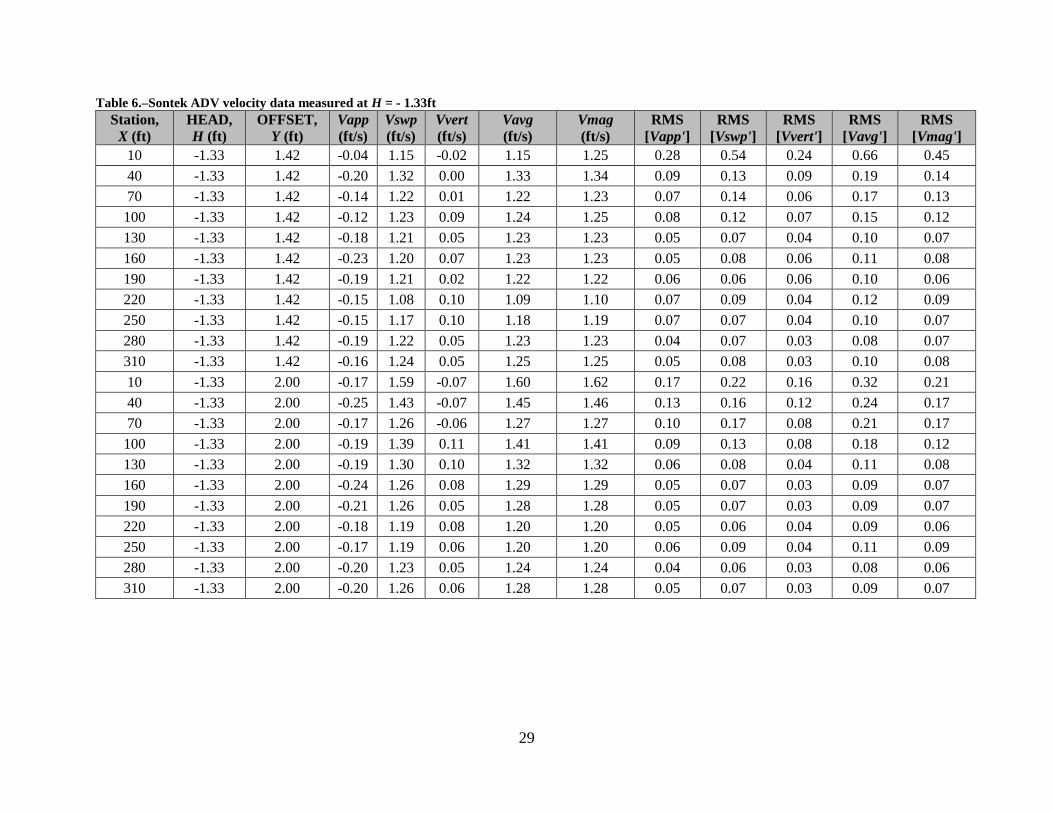
Table 6.–Sontek ADV velocity data measured at H = - 1.33ft
Station,
X (ft)
HEAD,
H (ft)
OFFSET,
Y (ft)
Vapp
(ft/s)
Vswp
(ft/s)
Vvert
(ft/s)
Vavg
(ft/s)
Vmag
(ft/s)
RMS
[Vapp']
RMS
[Vswp']
RMS
[Vvert']
RMS
[Vavg']
RMS
[Vmag']
10 -1.33 1.42 -0.04 1.15 -0.02 1.15 1.25 0.28 0.54 0.24 0.66 0.45
40 -1.33 1.42 -0.20 1.32 0.00 1.33 1.34 0.09 0.13 0.09 0.19 0.14
70 -1.33 1.42 -0.14 1.22 0.01 1.22 1.23 0.07 0.14 0.06 0.17 0.13
100 -1.33 1.42 -0.12 1.23 0.09 1.24 1.25 0.08 0.12 0.07 0.15 0.12
130 -1.33 1.42 -0.18 1.21 0.05 1.23 1.23 0.05 0.07 0.04 0.10 0.07
160 -1.33 1.42 -0.23 1.20 0.07 1.23 1.23 0.05 0.08 0.06 0.11 0.08
190 -1.33 1.42 -0.19 1.21 0.02 1.22 1.22 0.06 0.06 0.06 0.10 0.06
220 -1.33 1.42 -0.15 1.08 0.10 1.09 1.10 0.07 0.09 0.04 0.12 0.09
250 -1.33 1.42 -0.15 1.17 0.10 1.18 1.19 0.07 0.07 0.04 0.10 0.07
280 -1.33 1.42 -0.19 1.22 0.05 1.23 1.23 0.04 0.07 0.03 0.08 0.07
310 -1.33 1.42 -0.16 1.24 0.05 1.25 1.25 0.05 0.08 0.03 0.10 0.08
10 -1.33 2.00 -0.17 1.59 -0.07 1.60 1.62 0.17 0.22 0.16 0.32 0.21
40 -1.33 2.00 -0.25 1.43 -0.07 1.45 1.46 0.13 0.16 0.12 0.24 0.17
70 -1.33 2.00 -0.17 1.26 -0.06 1.27 1.27 0.10 0.17 0.08 0.21 0.17
100 -1.33 2.00 -0.19 1.39 0.11 1.41 1.41 0.09 0.13 0.08 0.18 0.12
130 -1.33 2.00 -0.19 1.30 0.10 1.32 1.32 0.06 0.08 0.04 0.11 0.08
160 -1.33 2.00 -0.24 1.26 0.08 1.29 1.29 0.05 0.07 0.03 0.09 0.07
190 -1.33 2.00 -0.21 1.26 0.05 1.28 1.28 0.05 0.07 0.03 0.09 0.07
220 -1.33 2.00 -0.18 1.19 0.08 1.20 1.20 0.05 0.06 0.04 0.09 0.06
250 -1.33 2.00 -0.17 1.19 0.06 1.20 1.20 0.06 0.09 0.04 0.11 0.09
280 -1.33 2.00 -0.20 1.23 0.05 1.24 1.24 0.04 0.06 0.03 0.08 0.06
310 -1.33 2.00 -0.20 1.26 0.06 1.28 1.28 0.05 0.07 0.03 0.09 0.07
30
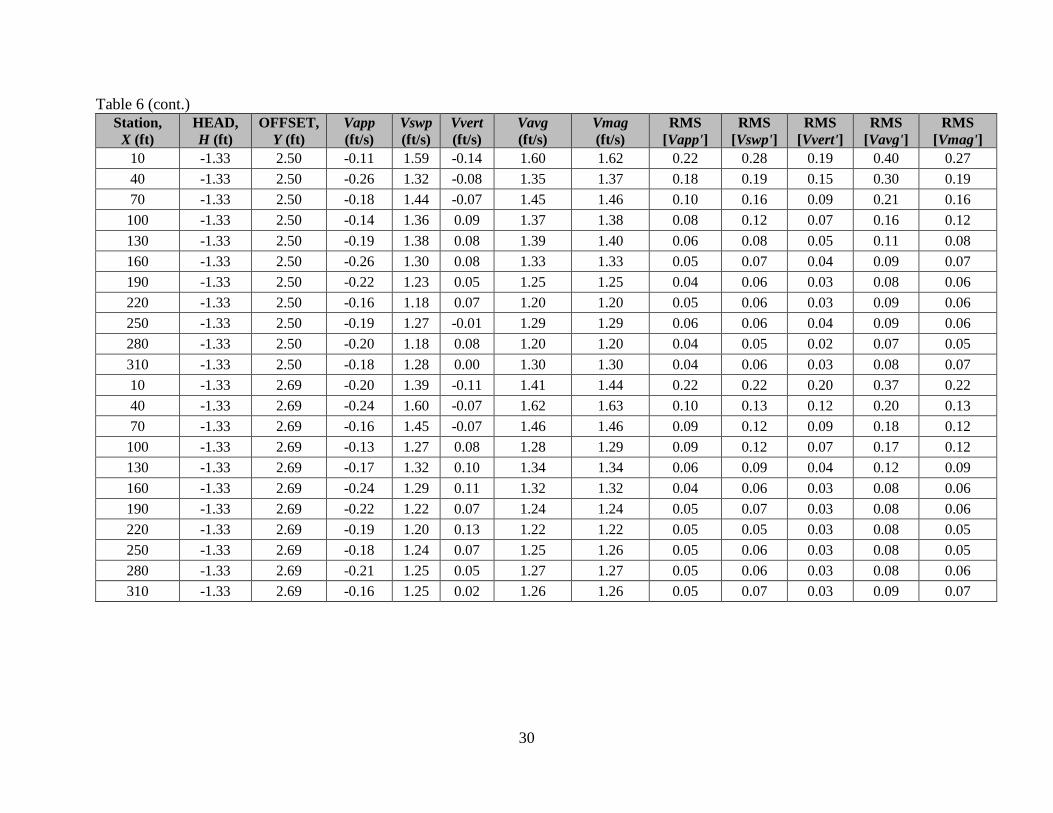
Table 6 (cont.)
Station,
X (ft)
HEAD,
H (ft)
OFFSET,
Y (ft)
Vapp
(ft/s)
Vswp
(ft/s)
Vvert
(ft/s)
Vavg
(ft/s)
Vmag
(ft/s)
RMS
[Vapp']
RMS
[Vswp']
RMS
[Vvert']
RMS
[Vavg']
RMS
[Vmag']
10 -1.33 2.50 -0.11 1.59 -0.14 1.60 1.62 0.22 0.28 0.19 0.40 0.27
40 -1.33 2.50 -0.26 1.32 -0.08 1.35 1.37 0.18 0.19 0.15 0.30 0.19
70 -1.33 2.50 -0.18 1.44 -0.07 1.45 1.46 0.10 0.16 0.09 0.21 0.16
100 -1.33 2.50 -0.14 1.36 0.09 1.37 1.38 0.08 0.12 0.07 0.16 0.12
130 -1.33 2.50 -0.19 1.38 0.08 1.39 1.40 0.06 0.08 0.05 0.11 0.08
160 -1.33 2.50 -0.26 1.30 0.08 1.33 1.33 0.05 0.07 0.04 0.09 0.07
190 -1.33 2.50 -0.22 1.23 0.05 1.25 1.25 0.04 0.06 0.03 0.08 0.06
220 -1.33 2.50 -0.16 1.18 0.07 1.20 1.20 0.05 0.06 0.03 0.09 0.06
250 -1.33 2.50 -0.19 1.27 -0.01 1.29 1.29 0.06 0.06 0.04 0.09 0.06
280 -1.33 2.50 -0.20 1.18 0.08 1.20 1.20 0.04 0.05 0.02 0.07 0.05
310 -1.33 2.50 -0.18 1.28 0.00 1.30 1.30 0.04 0.06 0.03 0.08 0.07
10 -1.33 2.69 -0.20 1.39 -0.11 1.41 1.44 0.22 0.22 0.20 0.37 0.22
40 -1.33 2.69 -0.24 1.60 -0.07 1.62 1.63 0.10 0.13 0.12 0.20 0.13
70 -1.33 2.69 -0.16 1.45 -0.07 1.46 1.46 0.09 0.12 0.09 0.18 0.12
100 -1.33 2.69 -0.13 1.27 0.08 1.28 1.29 0.09 0.12 0.07 0.17 0.12
130 -1.33 2.69 -0.17 1.32 0.10 1.34 1.34 0.06 0.09 0.04 0.12 0.09
160 -1.33 2.69 -0.24 1.29 0.11 1.32 1.32 0.04 0.06 0.03 0.08 0.06
190 -1.33 2.69 -0.22 1.22 0.07 1.24 1.24 0.05 0.07 0.03 0.08 0.06
220 -1.33 2.69 -0.19 1.20 0.13 1.22 1.22 0.05 0.05 0.03 0.08 0.05
250 -1.33 2.69 -0.18 1.24 0.07 1.25 1.26 0.05 0.06 0.03 0.08 0.05
280 -1.33 2.69 -0.21 1.25 0.05 1.27 1.27 0.05 0.06 0.03 0.08 0.06
310 -1.33 2.69 -0.16 1.25 0.02 1.26 1.26 0.05 0.07 0.03 0.09 0.07
31
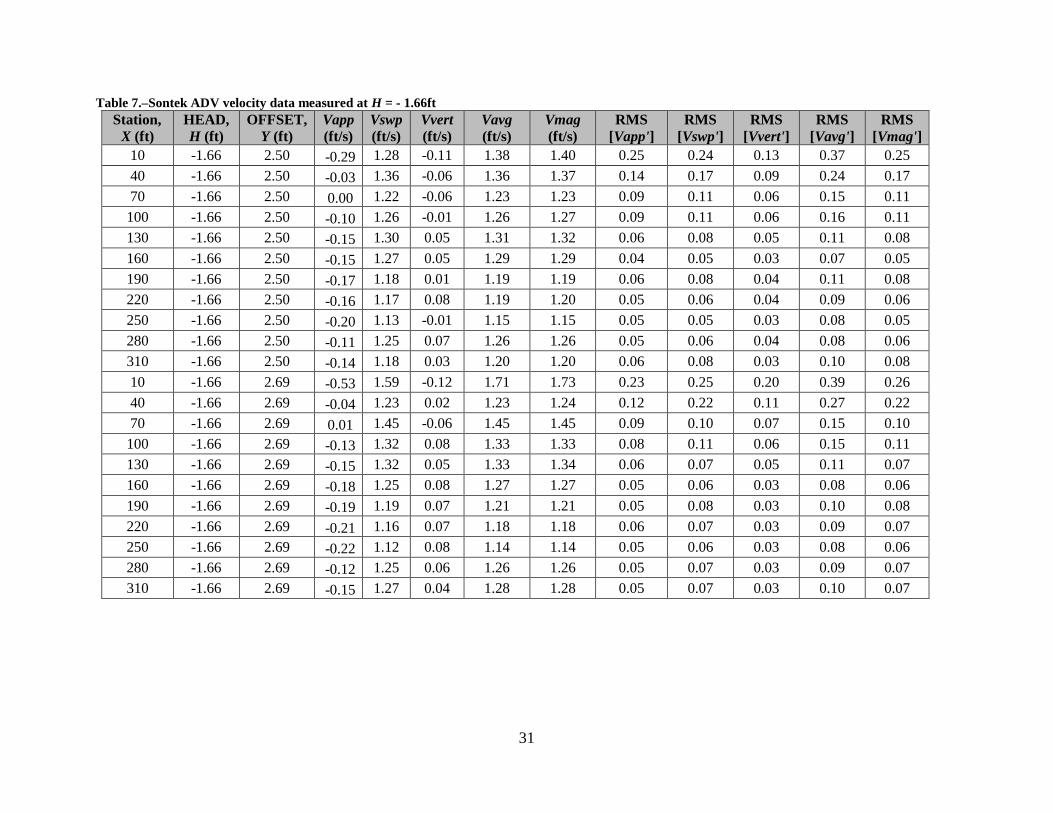
Table 7.–Sontek ADV velocity data measured at H = - 1.66ft
Station,
X (ft)
HEAD,
H (ft)
OFFSET,
Y (ft)
Vapp
(ft/s)
Vswp
(ft/s)
Vvert
(ft/s)
Vavg
(ft/s)
Vmag
(ft/s)
RMS
[Vapp']
RMS
[Vswp']
RMS
[Vvert']
RMS
[Vavg']
RMS
[Vmag']
10 -1.66 2.50 -0.29 1.28 -0.11 1.38 1.40 0.25 0.24 0.13 0.37 0.25
40 -1.66 2.50 -0.03 1.36 -0.06 1.36 1.37 0.14 0.17 0.09 0.24 0.17
70 -1.66 2.50 0.00 1.22 -0.06 1.23 1.23 0.09 0.11 0.06 0.15 0.11
100 -1.66 2.50 -0.10 1.26 -0.01 1.26 1.27 0.09 0.11 0.06 0.16 0.11
130 -1.66 2.50 -0.15 1.30 0.05 1.31 1.32 0.06 0.08 0.05 0.11 0.08
160 -1.66 2.50 -0.15 1.27 0.05 1.29 1.29 0.04 0.05 0.03 0.07 0.05
190 -1.66 2.50 -0.17 1.18 0.01 1.19 1.19 0.06 0.08 0.04 0.11 0.08
220 -1.66 2.50 -0.16 1.17 0.08 1.19 1.20 0.05 0.06 0.04 0.09 0.06
250 -1.66 2.50 -0.20 1.13 -0.01 1.15 1.15 0.05 0.05 0.03 0.08 0.05
280 -1.66 2.50 -0.11 1.25 0.07 1.26 1.26 0.05 0.06 0.04 0.08 0.06
310 -1.66 2.50 -0.14 1.18 0.03 1.20 1.20 0.06 0.08 0.03 0.10 0.08
10 -1.66 2.69 -0.53 1.59 -0.12 1.71 1.73 0.23 0.25 0.20 0.39 0.26
40 -1.66 2.69 -0.04 1.23 0.02 1.23 1.24 0.12 0.22 0.11 0.27 0.22
70 -1.66 2.69 0.01 1.45 -0.06 1.45 1.45 0.09 0.10 0.07 0.15 0.10
100 -1.66 2.69 -0.13 1.32 0.08 1.33 1.33 0.08 0.11 0.06 0.15 0.11
130 -1.66 2.69 -0.15 1.32 0.05 1.33 1.34 0.06 0.07 0.05 0.11 0.07
160 -1.66 2.69 -0.18 1.25 0.08 1.27 1.27 0.05 0.06 0.03 0.08 0.06
190 -1.66 2.69 -0.19 1.19 0.07 1.21 1.21 0.05 0.08 0.03 0.10 0.08
220 -1.66 2.69 -0.21 1.16 0.07 1.18 1.18 0.06 0.07 0.03 0.09 0.07
250 -1.66 2.69 -0.22 1.12 0.08 1.14 1.14 0.05 0.06 0.03 0.08 0.06
280 -1.66 2.69 -0.12 1.25 0.06 1.26 1.26 0.05 0.07 0.03 0.09 0.07
310 -1.66 2.69 -0.15 1.27 0.04 1.28 1.28 0.05 0.07 0.03 0.10 0.07
32
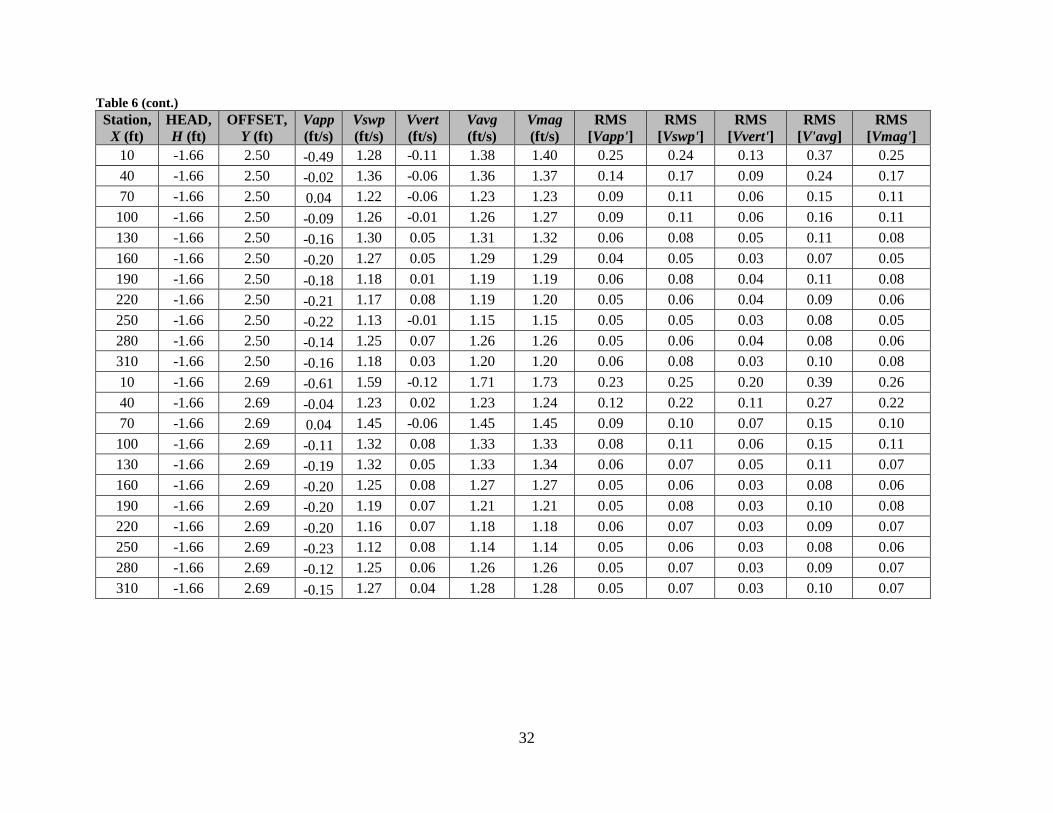
Table 6 (cont.)
Station,
X (ft)
HEAD,
H (ft)
OFFSET,
Y (ft)
Vapp
(ft/s)
Vswp
(ft/s)
Vvert
(ft/s)
Vavg
(ft/s)
Vmag
(ft/s)
RMS
[Vapp']
RMS
[Vswp']
RMS
[Vvert']
RMS
[V'avg]
RMS
[Vmag']
10 -1.66 2.50 -0.49 1.28 -0.11 1.38 1.40 0.25 0.24 0.13 0.37 0.25
40 -1.66 2.50 -0.02 1.36 -0.06 1.36 1.37 0.14 0.17 0.09 0.24 0.17
70 -1.66 2.50 0.04 1.22 -0.06 1.23 1.23 0.09 0.11 0.06 0.15 0.11
100 -1.66 2.50 -0.09 1.26 -0.01 1.26 1.27 0.09 0.11 0.06 0.16 0.11
130 -1.66 2.50 -0.16 1.30 0.05 1.31 1.32 0.06 0.08 0.05 0.11 0.08
160 -1.66 2.50 -0.20 1.27 0.05 1.29 1.29 0.04 0.05 0.03 0.07 0.05
190 -1.66 2.50 -0.18 1.18 0.01 1.19 1.19 0.06 0.08 0.04 0.11 0.08
220 -1.66 2.50 -0.21 1.17 0.08 1.19 1.20 0.05 0.06 0.04 0.09 0.06
250 -1.66 2.50 -0.22 1.13 -0.01 1.15 1.15 0.05 0.05 0.03 0.08 0.05
280 -1.66 2.50 -0.14 1.25 0.07 1.26 1.26 0.05 0.06 0.04 0.08 0.06
310 -1.66 2.50 -0.16 1.18 0.03 1.20 1.20 0.06 0.08 0.03 0.10 0.08
10 -1.66 2.69 -0.61 1.59 -0.12 1.71 1.73 0.23 0.25 0.20 0.39 0.26
40 -1.66 2.69 -0.04 1.23 0.02 1.23 1.24 0.12 0.22 0.11 0.27 0.22
70 -1.66 2.69 0.04 1.45 -0.06 1.45 1.45 0.09 0.10 0.07 0.15 0.10
100 -1.66 2.69 -0.11 1.32 0.08 1.33 1.33 0.08 0.11 0.06 0.15 0.11
130 -1.66 2.69 -0.19 1.32 0.05 1.33 1.34 0.06 0.07 0.05 0.11 0.07
160 -1.66 2.69 -0.20 1.25 0.08 1.27 1.27 0.05 0.06 0.03 0.08 0.06
190 -1.66 2.69 -0.20 1.19 0.07 1.21 1.21 0.05 0.08 0.03 0.10 0.08
220 -1.66 2.69 -0.20 1.16 0.07 1.18 1.18 0.06 0.07 0.03 0.09 0.07
250 -1.66 2.69 -0.23 1.12 0.08 1.14 1.14 0.05 0.06 0.03 0.08 0.06
280 -1.66 2.69 -0.12 1.25 0.06 1.26 1.26 0.05 0.07 0.03 0.09 0.07
310 -1.66 2.69 -0.15 1.27 0.04 1.28 1.28 0.05 0.07 0.03 0.10 0.07
33
Table 8.–Sontek ADV velocity data measured with the angle iron attached to the weir crest at Station = 190 ft.
Station,
X (ft)
HEAD
, H (ft)
OFFSET,
Y (ft)
Vapp
(ft/s)
Vswp
(ft/s)
Vvert
(ft/s)
Vavg
(ft/s)
Vmag
(ft/s)
RMS
[Vapp']
RMS
[Vswp']
RMS
[Vvert']
RMS
[Vavg']
RMS
[Vmag']
190 -0.33 1.42 -0.30 1.29 0.19 1.33 1.34 0.04 0.05 0.02 0.07 0.05
190 -0.33 2.00 -0.29 1.32 0.10 1.35 1.36 0.04 0.04 0.02 0.06 0.04
190 -0.33 2.50 -0.26 1.35 0.07 1.37 1.37 0.03 0.04 0.02 0.05 0.04
190 -0.33 2.69 -0.26 1.34 0.10 1.37 1.37 0.03 0.04 0.02 0.06 0.04
190 -1.00 2.69 -0.22 1.34 0.09 1.36 1.37 0.04 0.04 0.03 0.06 0.04
190 -1.00 2.50 -0.22 1.29 0.10 1.32 1.32 0.04 0.05 0.03 0.07 0.05
190 -1.00 2.00 -0.23 1.29 0.11 1.31 1.32 0.05 0.06 0.03 0.08 0.06
190 -1.00 1.42 -0.19 1.18 0.14 1.20 1.20 0.05 0.06 0.03 0.08 0.06
190 -0.66 1.42 -0.19 1.27 0.16 1.29 1.29 0.05 0.05 0.02 0.07 0.05
190 -0.66 2.00 -0.20 1.27 0.12 1.30 1.30 0.04 0.06 0.02 0.07 0.06
190 -0.66 2.50 -0.22 1.33 0.08 1.35 1.35 0.04 0.05 0.03 0.07 0.05
190 -0.66 2.69 -0.21 1.31 0.10 1.34 1.34 0.04 0.05 0.03 0.07 0.05
190 -1.33 2.69 -0.16 1.22 0.05 1.23 1.23 0.04 0.06 0.03 0.08 0.06
190 -1.33 2.50 -0.16 1.20 0.07 1.22 1.22 0.05 0.07 0.03 0.09 0.07
190 -1.33 2.00 -0.18 1.14 0.09 1.16 1.16 0.05 0.06 0.04 0.09 0.07
190 -1.33 1.42 -0.14 1.15 0.11 1.17 1.17 0.05 0.07 0.03 0.09 0.07
190 -1.66 1.42 -0.16 1.09 0.10 1.11 1.11 0.07 0.10 0.04 0.13 0.11
190 -1.66 2.00 -0.21 1.14 0.08 1.16 1.16 0.05 0.06 0.03 0.08 0.06
190 -1.66 2.50 -0.22 1.17 0.06 1.20 1.20 0.04 0.05 0.03 0.07 0.05
190 -1.66 2.69 -0.21 1.08 0.06 1.10 1.11 0.05 0.07 0.04 0.10 0.07
190 -1.66 2.69 -0.25 1.17 0.06 1.19 1.20 0.05 0.05 0.03 0.08 0.05
34
Appendix B – Velocity Mapping Figures
Figure 14.–Sweeping velocity mapping in the X-Y plane at H = -1.66 ft.
1.2 1.2
1.2
1.2
1.3
1.3
1.3
1.5
-0.29 -0.03 -0.00 -0.10 -0.15 -0.15 -0.17 -0.16 -0.20 -0.11 -0.14
-0.53 -0.04 0.01 -0.13 -0.15 -0.18 -0.19 -0.21 -0.22 -0.12 -0.15
-0.49 -0.02 0.04 -0.09 -0.16 -0.20 -0.18 -0.21 -0.22 -0.14 -0.16
-0.61 -0.04 0.04 -0.11 -0.19 -0.20 -0.20 -0.20 -0.23 -0.12 -0.15
Station along Weir (X 100), ft
Dis
tan
ce
Up
str
ea
mfr
om
We
irF
ac
e,ft
0 0.5 1 1.5 2 2.5 30
0.5
1
1.5
2
2.5
3
Vswp
1.7
1.6
1.5
1.4
1.3
1.2
H=-1.66FTHOGBACK WEIR VELOCITY MAPPING
Boxes contain Approach Velocities, ft/sec
<- FlowtrackerData
Frame 001 16 Sep 2016 HOGBACK WEIR VELOCITY MAPPING
35
Figure 15.–Sweeping velocity mapping in the X-Y plane at H = -1.33 ft.
1.2
1.2
1.2
1.31.
3
1.3
1.4
1.5
-0.04 -0.20 -0.14 -0.12 -0.18 -0.23 -0.19 -0.15 -0.15 -0.19 -0.16
-0.17 -0.25 -0.17 -0.19 -0.19 -0.24 -0.21 -0.18 -0.17 -0.20 -0.20
-0.11 -0.26 -0.18 -0.14 -0.19 -0.26 -0.22 -0.16 -0.19 -0.20 -0.18
-0.20 -0.24 -0.16 -0.13 -0.17 -0.24 -0.22 -0.19 -0.18 -0.21 -0.16
Station along Weir (X 100), ft
Dis
tan
ce
Up
str
ea
mfr
om
We
irF
ac
e,ft
0 0.5 1 1.5 2 2.5 30
0.5
1
1.5
2
2.5
3
Vswp
1.7
1.6
1.5
1.4
1.3
1.2
H=-1.33FTHOGBACK WEIR VELOCITY MAPPING
Boxes contain Approach Velocities, ft/sec
<- FlowtrackerData
Frame 001 16 Sep 2016 HOGBACK WEIR VELOCITY MAPPING
36
Figure 16.–Sweeping velocity mapping in the X-Y plane at H = -1.00 ft.
1.2
1.3
1.3
1.4
1.4
1.51
.6
-0.10 -0.13 -0.15 -0.24 -0.12 -0.17 -0.16 -0.14 -0.14 -0.15 -0.18
-0.23 -0.07 -0.09 -0.25 -0.10 -0.20 -0.15 -0.15 -0.17 -0.17 -0.20
-0.14 0.00 0.02 -0.20 -0.07 -0.19 -0.15 -0.16 -0.16 -0.17 -0.19
-0.13 -0.05 -0.02 -0.22 -0.08 -0.18 -0.14 -0.15 -0.18 -0.18 -0.19
Station along Weir (X 100), ft
Dis
tan
ce
Up
str
ea
mfr
om
We
irF
ac
e,ft
0 0.5 1 1.5 2 2.5 30
0.5
1
1.5
2
2.5
3
Vswp
1.7
1.6
1.5
1.4
1.3
1.2
H=-1.00FTHOGBACK WEIR VELOCITY MAPPING
Boxes contain Approach Velocities, ft/sec
<- FlowtrackerData
Frame 001 16 Sep 2016 HOGBACK WEIR VELOCITY MAPPING
37
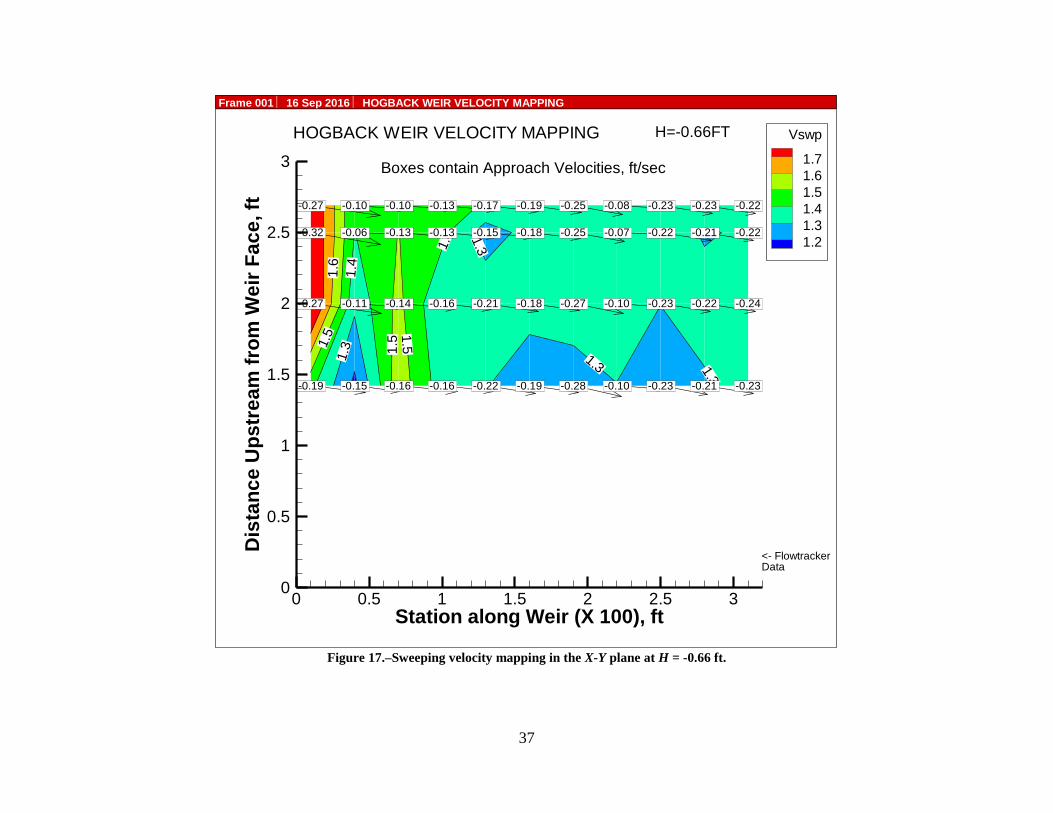
Figure 17.–Sweeping velocity mapping in the X-Y plane at H = -0.66 ft.
1.3
1.3 1.3
1.3
1.4
1.4
1.5
1.51
.51
.6
-0.19 -0.15 -0.16 -0.16 -0.22 -0.19 -0.28 -0.10 -0.23 -0.21 -0.23
-0.27 -0.11 -0.14 -0.16 -0.21 -0.18 -0.27 -0.10 -0.23 -0.22 -0.24
-0.32 -0.06 -0.13 -0.13 -0.15 -0.18 -0.25 -0.07 -0.22 -0.21 -0.22
-0.27 -0.10 -0.10 -0.13 -0.17 -0.19 -0.25 -0.08 -0.23 -0.23 -0.22
Station along Weir (X 100), ft
Dis
tan
ce
Up
str
ea
mfr
om
We
irF
ac
e,ft
0 0.5 1 1.5 2 2.5 30
0.5
1
1.5
2
2.5
3
Vswp
1.7
1.6
1.5
1.4
1.3
1.2
H=-0.66FTHOGBACK WEIR VELOCITY MAPPING
Boxes contain Approach Velocities, ft/sec
<- FlowtrackerData
Frame 001 16 Sep 2016 HOGBACK WEIR VELOCITY MAPPING
38
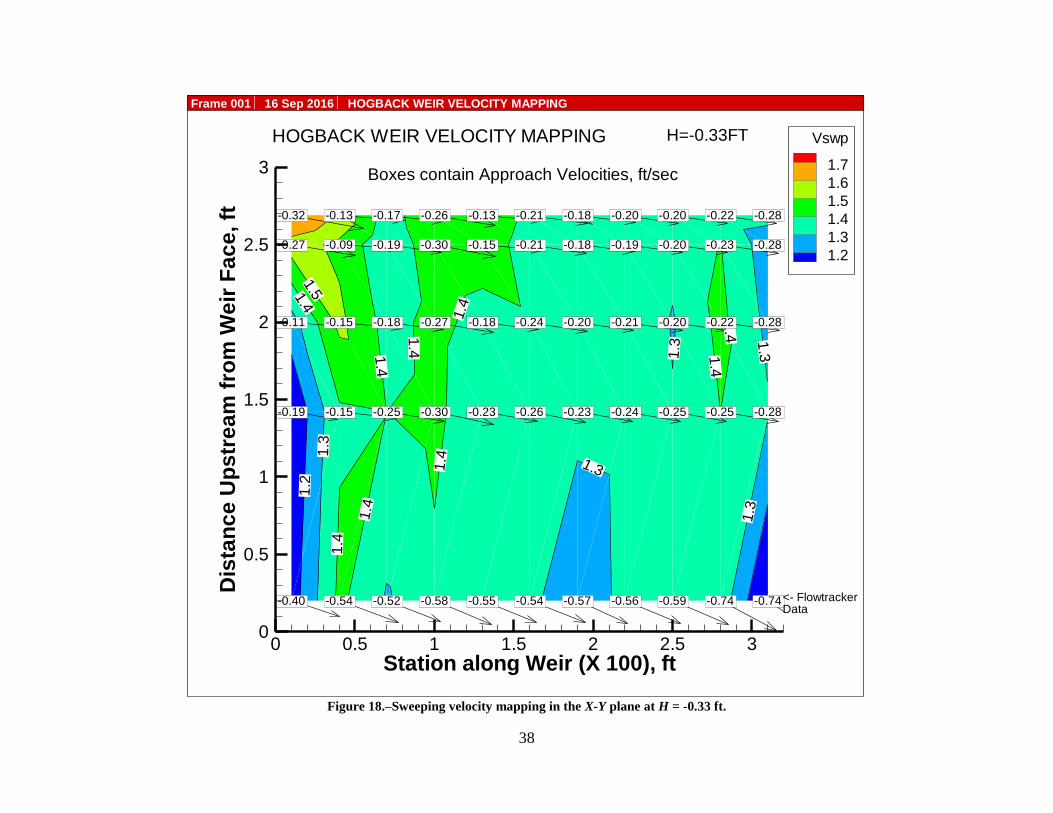
Figure 18.–Sweeping velocity mapping in the X-Y plane at H = -0.33 ft.
1.2
1.3
1.3
1.3
1.3
1.3
1.4
1.4
1.4
1.4
1.4
1.4
1.4 1
.41
.4
1.5
-0.19 -0.15 -0.25 -0.30 -0.23 -0.26 -0.23 -0.24 -0.25 -0.25 -0.28
-0.11 -0.15 -0.18 -0.27 -0.18 -0.24 -0.20 -0.21 -0.20 -0.22 -0.28
-0.27 -0.09 -0.19 -0.30 -0.15 -0.21 -0.18 -0.19 -0.20 -0.23 -0.28
-0.40 -0.54 -0.52 -0.58 -0.55 -0.54 -0.57 -0.56 -0.59 -0.74 -0.74
-0.32 -0.13 -0.17 -0.26 -0.13 -0.21 -0.18 -0.20 -0.20 -0.22 -0.28
Station along Weir (X 100), ft
Dis
tan
ce
Up
str
ea
mfr
om
We
irF
ac
e,ft
0 0.5 1 1.5 2 2.5 30
0.5
1
1.5
2
2.5
3
Vswp
1.7
1.6
1.5
1.4
1.3
1.2
H=-0.33FTHOGBACK WEIR VELOCITY MAPPING
Boxes contain Approach Velocities, ft/sec
<- FlowtrackerData
Frame 001 16 Sep 2016 HOGBACK WEIR VELOCITY MAPPING
39
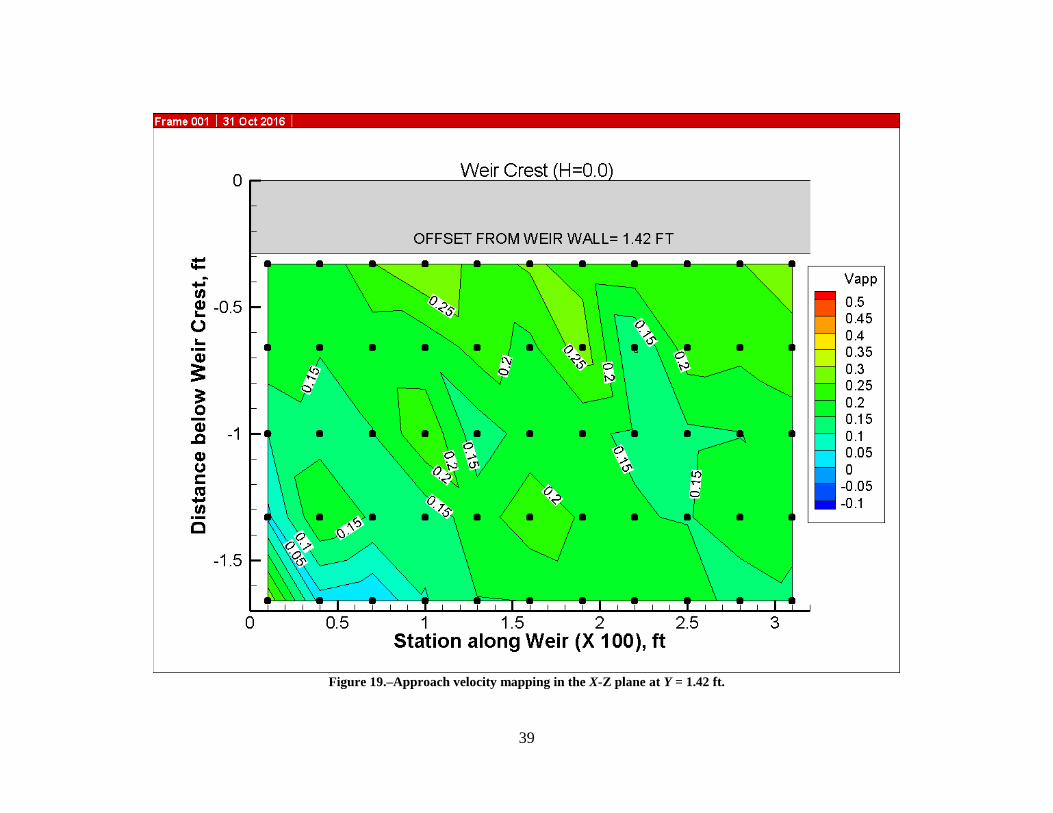
Figure 19.–Approach velocity mapping in the X-Z plane at Y = 1.42 ft.
40
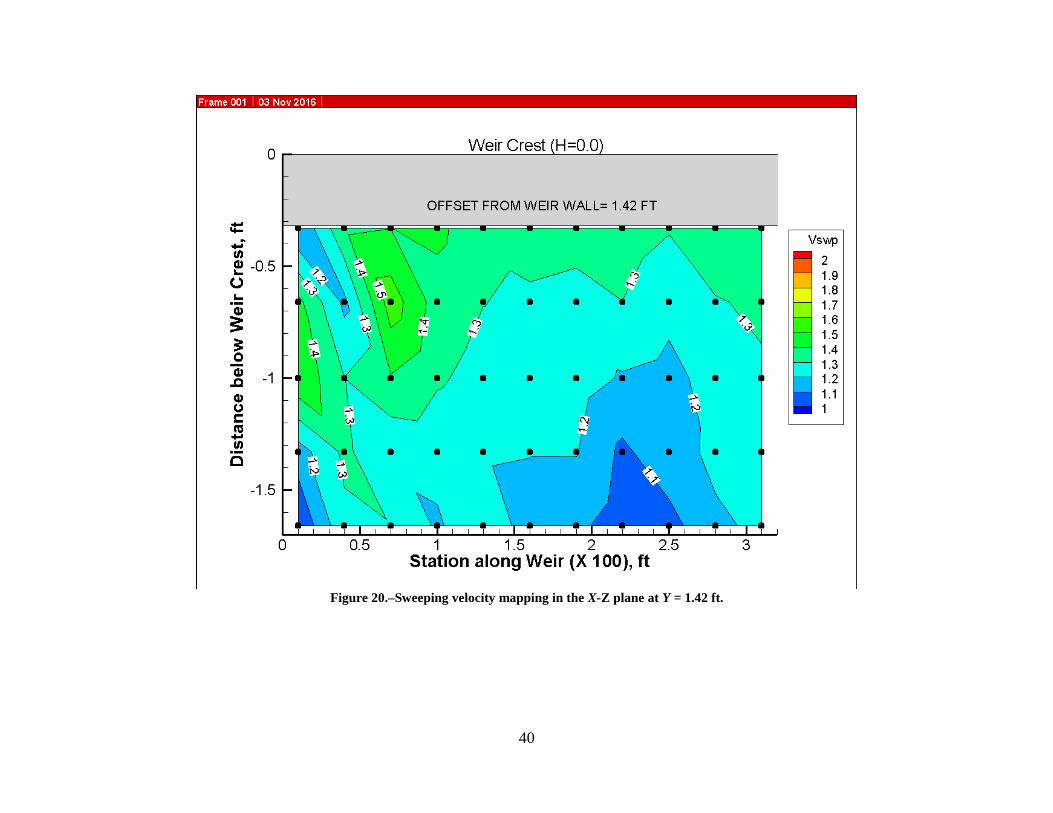
Figure 20.–Sweeping velocity mapping in the X-Z plane at Y = 1.42 ft.
41
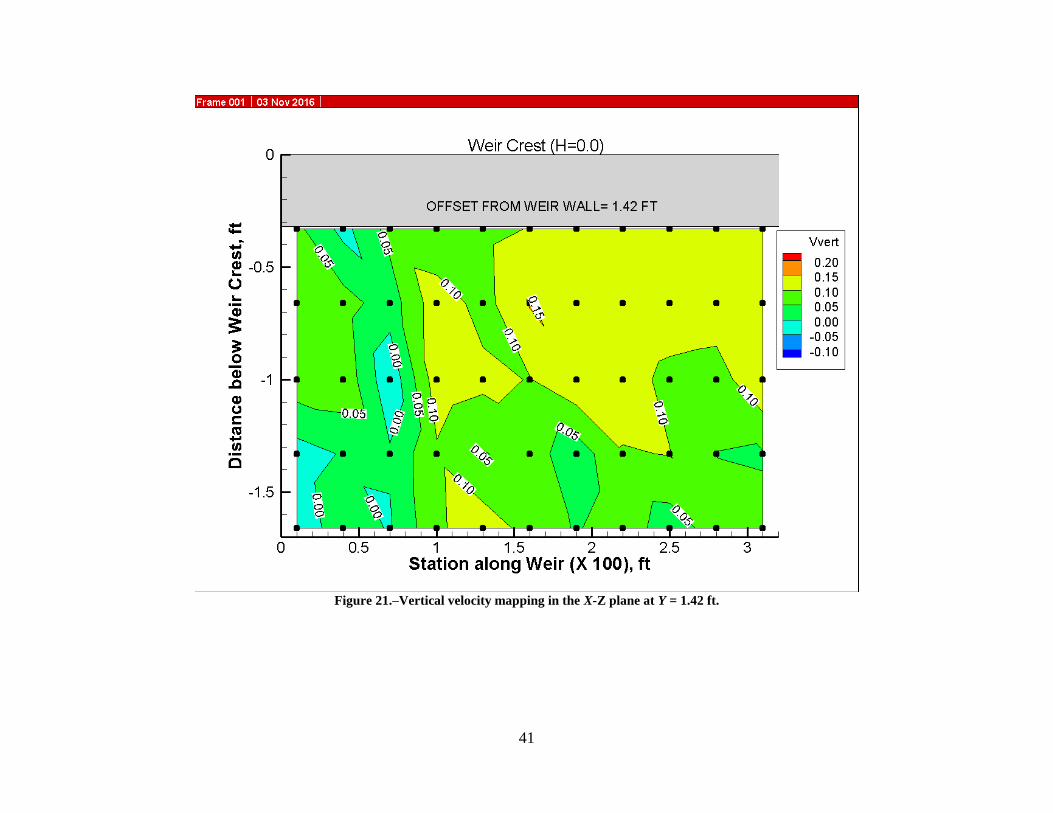
Figure 21.–Vertical velocity mapping in the X-Z plane at Y = 1.42 ft.
42
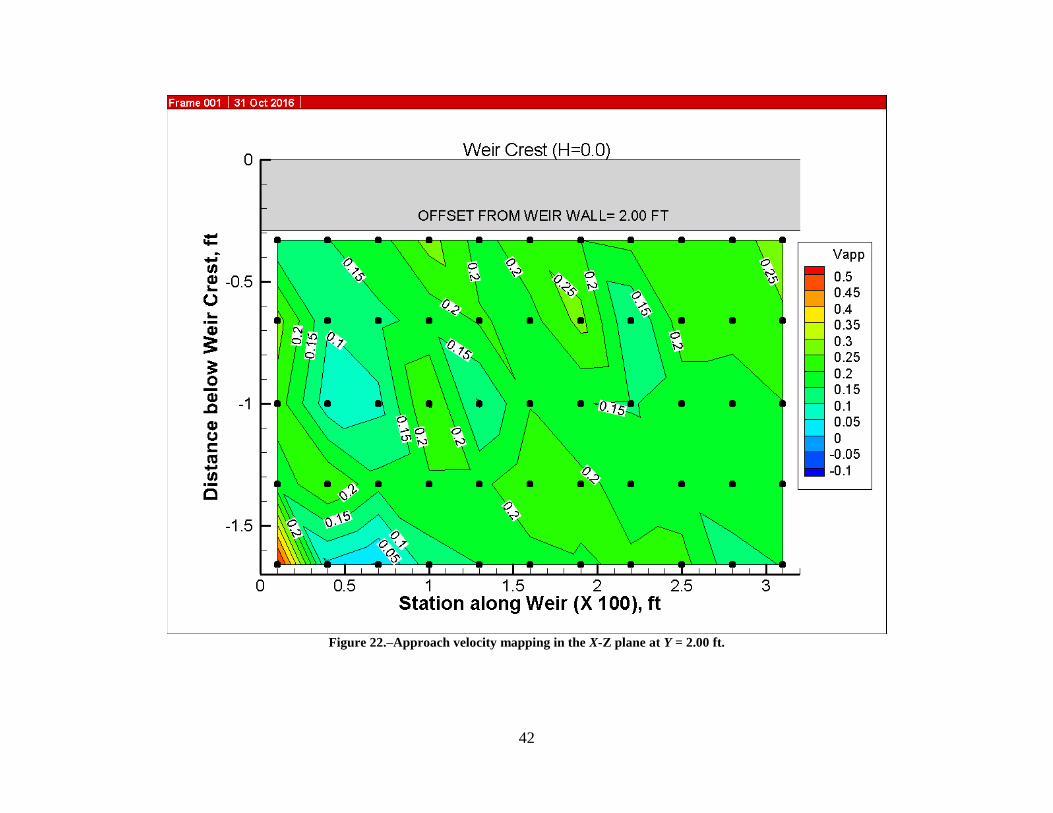
Figure 22.–Approach velocity mapping in the X-Z plane at Y = 2.00 ft.
43
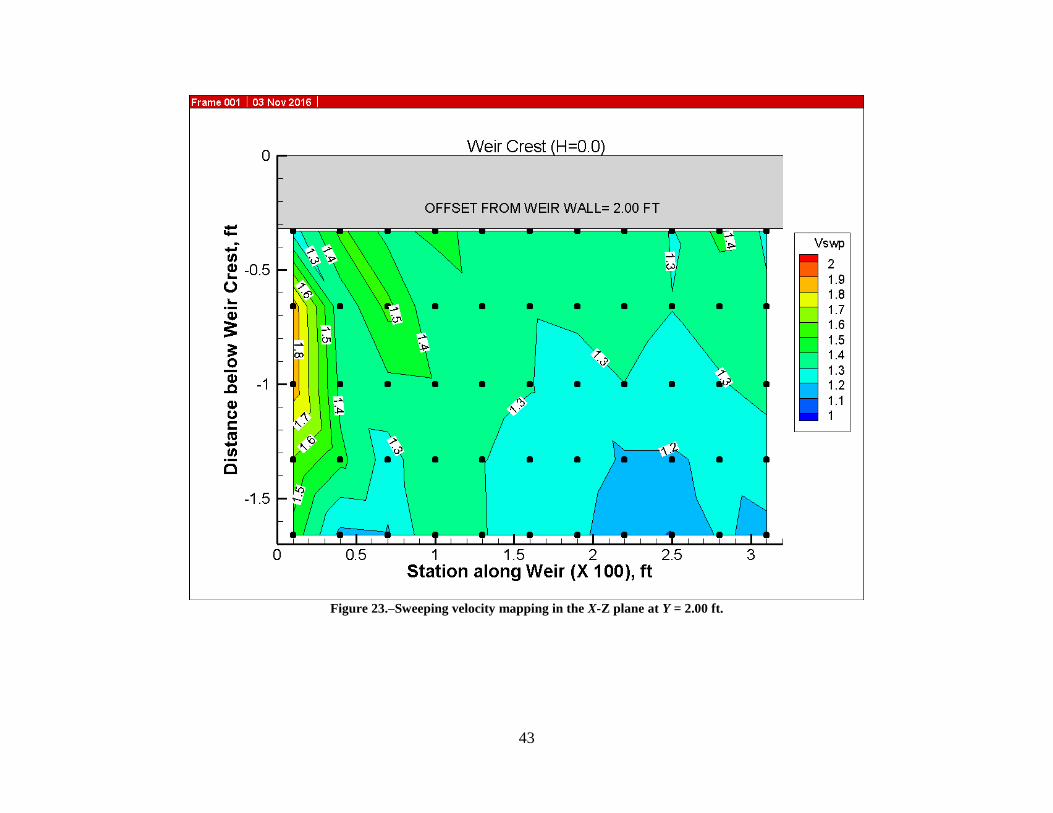
Figure 23.–Sweeping velocity mapping in the X-Z plane at Y = 2.00 ft.
44
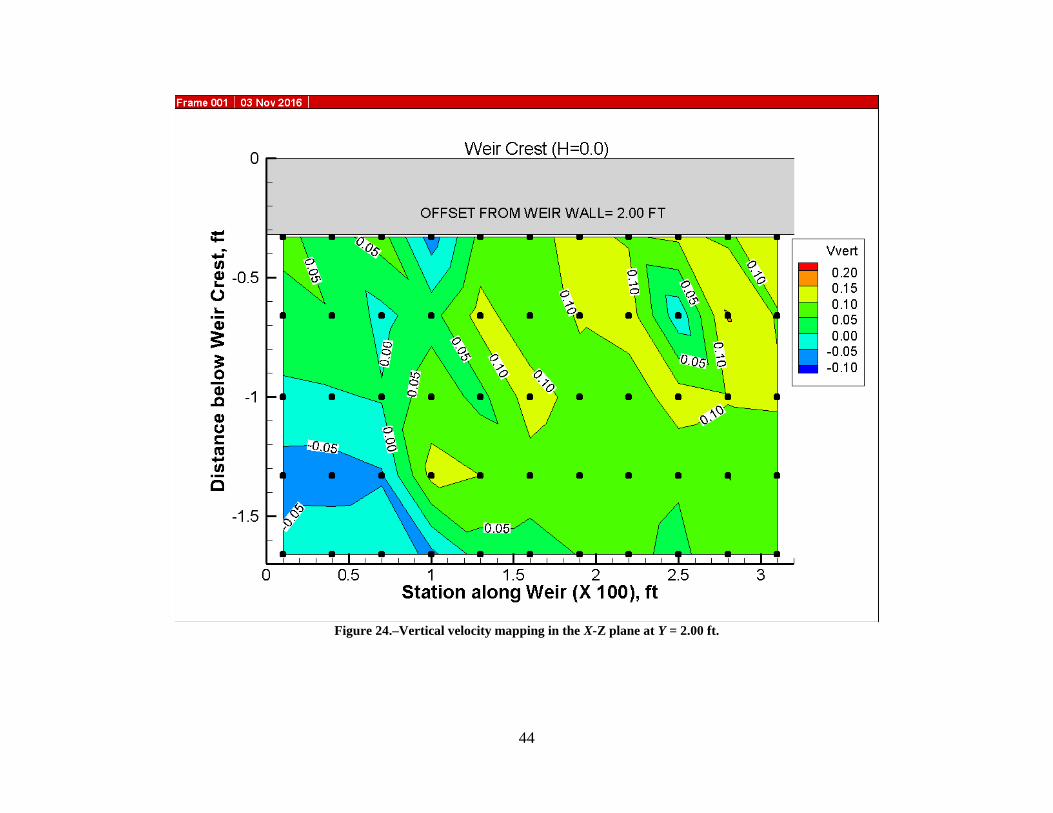
Figure 24.–Vertical velocity mapping in the X-Z plane at Y = 2.00 ft.
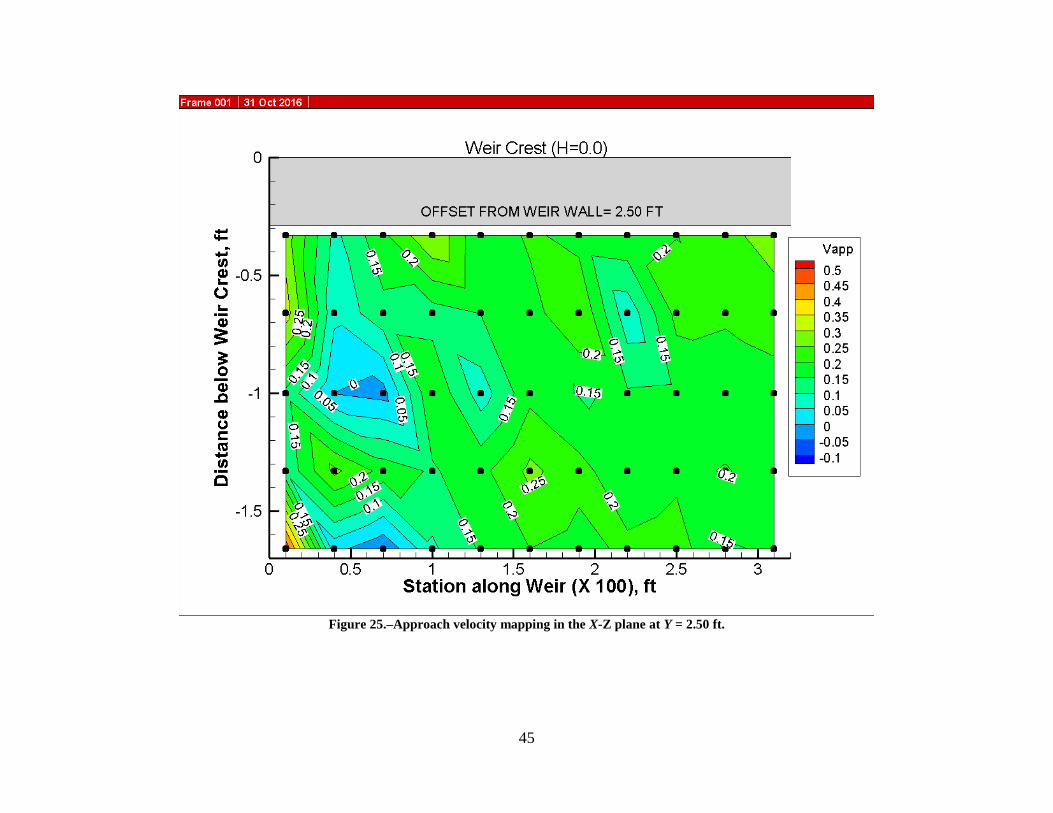
45
Figure 25.–Approach velocity mapping in the X-Z plane at Y = 2.50 ft.
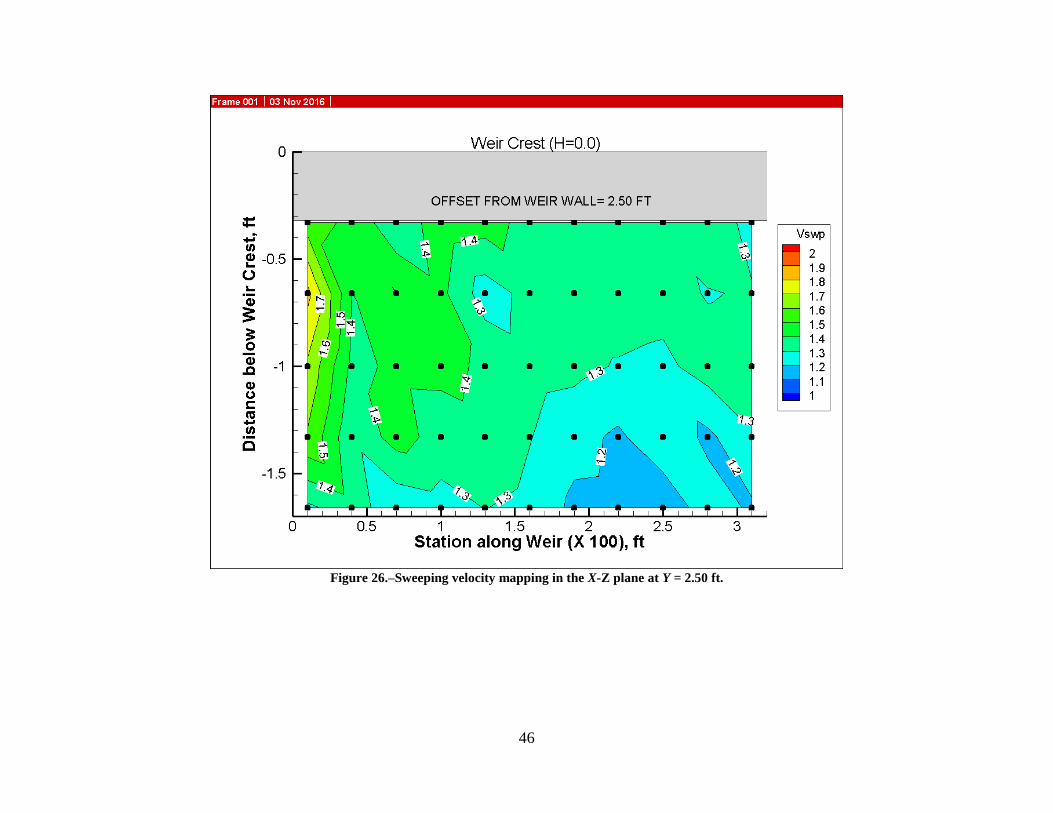
46
Figure 26.–Sweeping velocity mapping in the X-Z plane at Y = 2.50 ft.
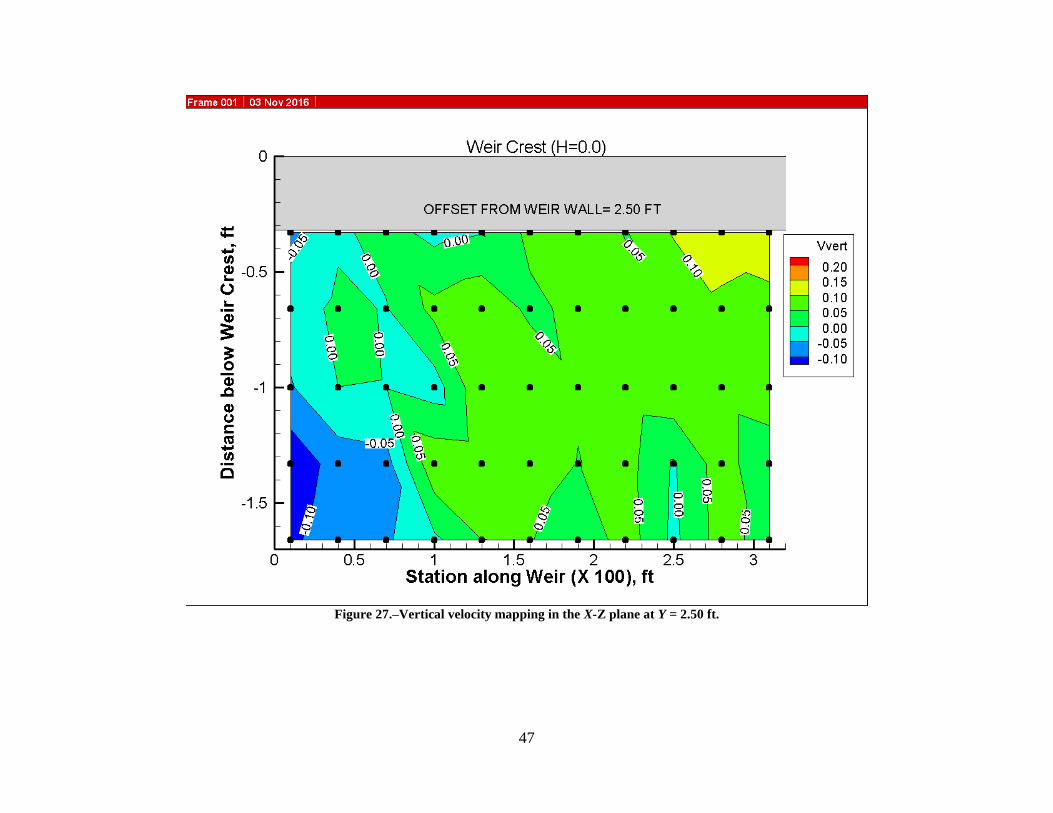
47
Figure 27.–Vertical velocity mapping in the X-Z plane at Y = 2.50 ft.
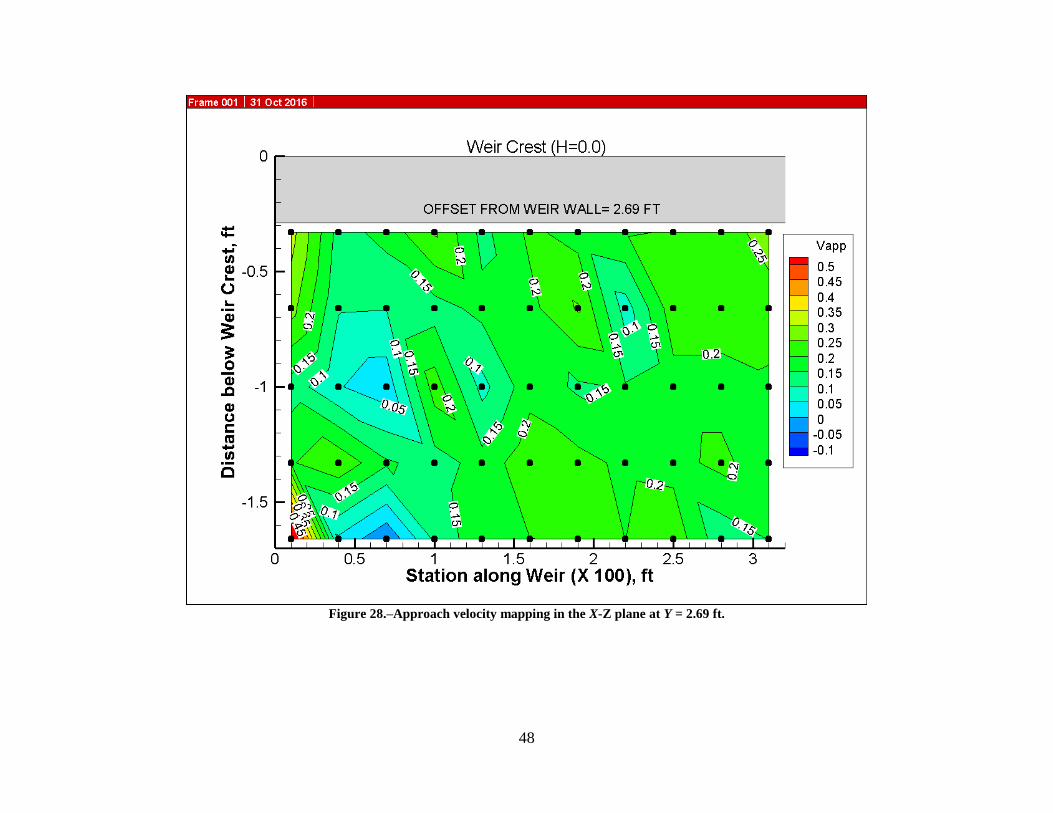
48
Figure 28.–Approach velocity mapping in the X-Z plane at Y = 2.69 ft.
49
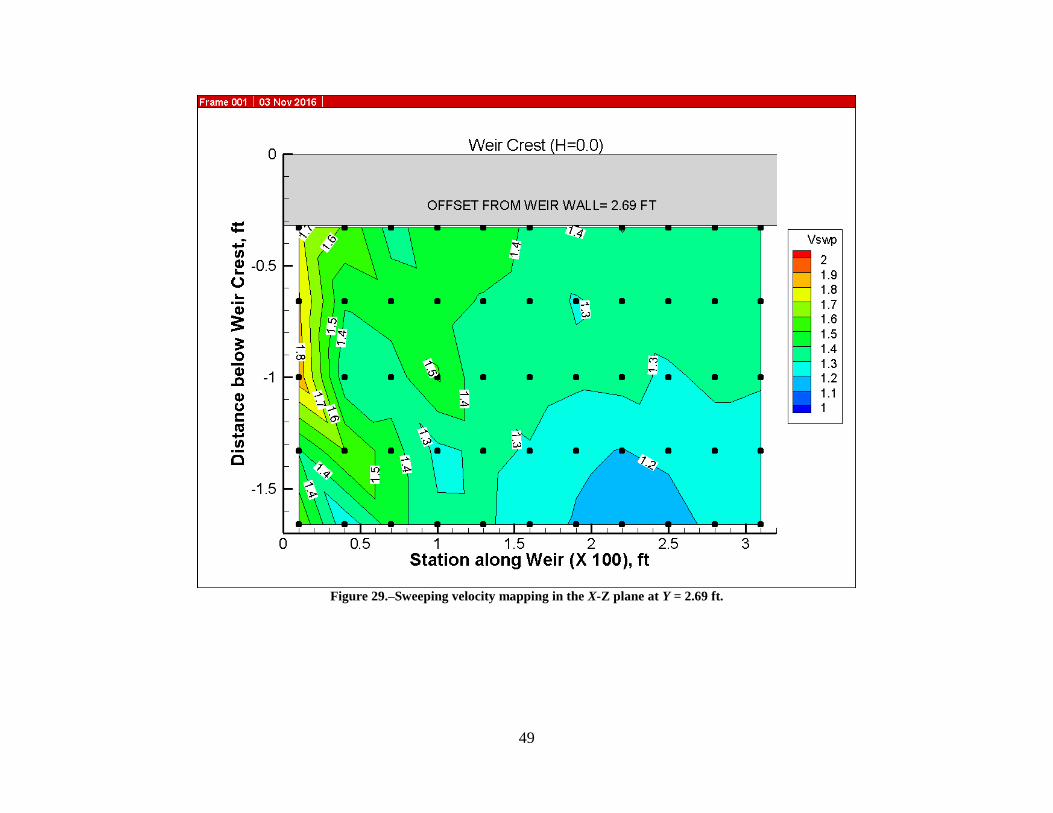
Figure 29.–Sweeping velocity mapping in the X-Z plane at Y = 2.69 ft.
50
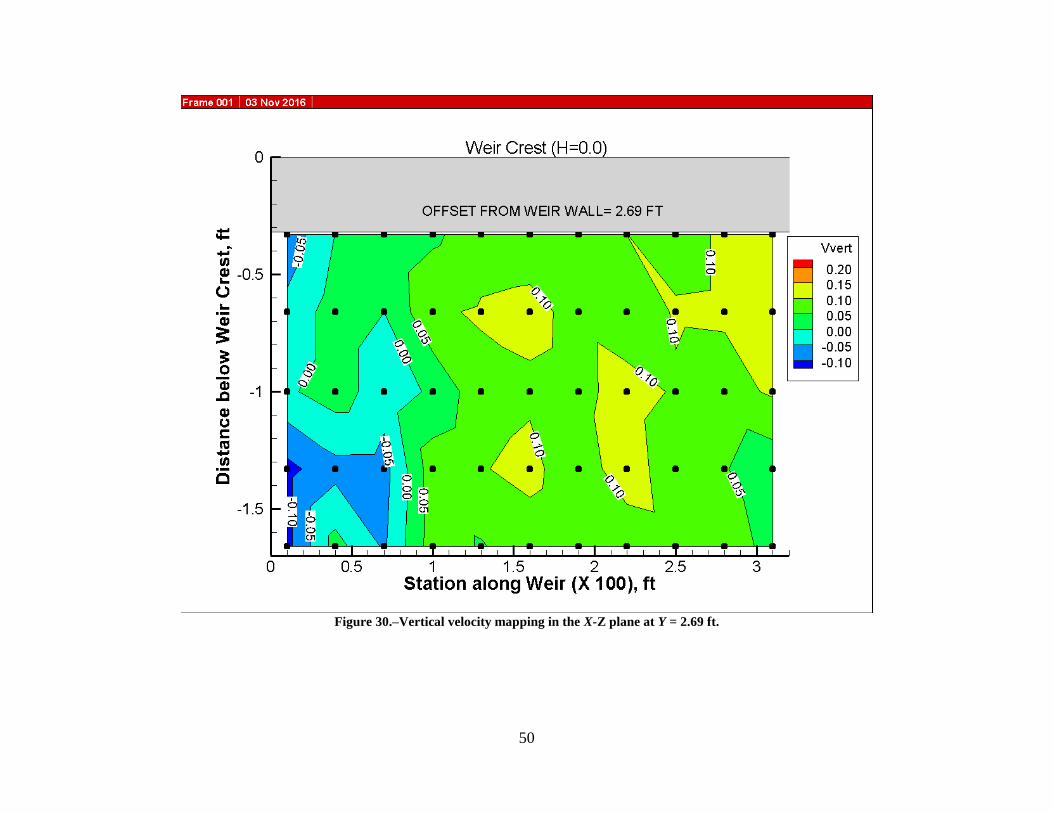
Figure 30.–Vertical velocity mapping in the X-Z plane at Y = 2.69 ft.
51
Figure 31.–Weir approach velocities are higher with the angle iron retrofit to the weir crest.
52
Figure 32.–Weir sweeping velocities are higher with the angle iron retrofit to the weir crest.