hole 1011a hole 1011c - texas a&m university
TRANSCRIPT

3UHYLRXV�&KDSWH3UHYLRXV�&KDSWH
Lyle, M., Koizumi, I., Richter, C., et al., 1997Proceedings of the Ocean Drilling Program, Initial Reports, Vol. 167
5. SITE 10111
Shipboard Scientific Party2
HOLE 1011A
Date occupied: 29 April 1996
Date departed: 29 April 1996
Time on hole: 05 hr, 30 min
Position: 31°16.823′N, 117°38.018′W
Drill pipe measurement from rig floor to seafloor (m): 2032.5
Distance between rig floor and sea level (m): 10.9
Water depth (drill pipe measurement from sea level, m): 2021.6
Total depth (from rig floor, m): 2043.9
Penetration (m): 11.4
Number of cores (including cores having no recovery): 1
Total length of cored section (m): 9.5
Total core recovered (m): 9.8
Core recovery (%): 103.0
Oldest sediment cored:Depth (mbsf): 9.50Nature: Clayey siltAge: Pleistocene
Comments: Missed the mudline
HOLE 1011B
Date occupied: 29 April 1996
Date departed: 1 May 1996
Time on hole: 1 day, 19 hr, 45 min
Position: 31°16.817′N, 117°38.008′W
Drill pipe measurement from rig floor to seafloor (m): 2032.5
Distance between rig floor and sea level (m): 10.9
Water depth (drill pipe measurement from sea level, m): 2021.6
Total depth (from rig floor, m): 2314.0
Penetration (m): 281.5
Number of cores (including cores having no recovery): 31
Total length of cored section (m): 281.5
Total core recovered (m): 271.1
Core recovery (%): 96.0
Oldest sediment cored:Depth (mbsf): 272.28Nature: Siltstone and sandstoneAge: late Miocene
1Lyle, M., Koizumi, I., Richter, C., et al., 1997. Proc. ODP, Init. Repts., 167: Col-lege Station, TX (Ocean Drilling Program).
2Shipboard Scientific Party is given in the list preceding the Table of Contents.
UU 7DEOH�RI�&7DEOH�RI�&
Measured velocity (km/s): 1.61 at Section 28X-6, 86−89 cmHard rock:Depth (mbsf): 272.28Nature: Basalt
Basement:Depth (mbsf): 281.50Nature: Basalt
HOLE 1011C
Date occupied: 1 May 1996
Date departed: 2 May 1996
Time on hole: 17 hr, 45 min
Position: 31°16.819′N, 117°38.014′W
Drill pipe measurement from rig floor to seafloor (m): 2033.2
Distance between rig floor and sea level (m): 10.9
Water depth (drill pipe measurement from sea level, m): 2022.3
Total depth (from rig floor, m): 2217.5
Penetration (m): 184.3
Number of cores (including cores having no recovery): 20
Total length of cored section (m): 184.3
Total core recovered (m): 190.0
Core recovery (%): 103.0
Oldest sediment cored:Depth (mbsf): 184.30Nature: Clayey nannofossil chalk, nannofossil chalkAge: late Miocene
HOLE 1011D
Date occupied: 2 May 1996
Date departed: 2 May 1996
Time on hole: 01 hr, 15 min
Position: 31°16.816′N, 117°38.019′W
Drill pipe measurement from rig floor to seafloor (m): 2031.1
Distance between rig floor and sea level (m): 10.9
Water depth (drill pipe measurement from sea level, m): 2020.2
Total depth (from rig floor, m): 2048.0
Penetration (m): 16.9
Number of cores (including cores having no recovery): 2
Total length of cored section (m): 16.9
Total core recovered (m): 17.2
Core recovery (%): 102.0
85
RQWHQWVRQWHQWV 1H[W�&KDSWHU1H[W�&KDSWHU

SITE 1011
icu
t
.u
o egob
o
t
f
a
e
T
s
one
lagess re-
ntsent-
in thetion,gen-n.
kms in022
elyent,
sec-ctiont to-tion,
rela-g in
andl. Itmentn on
herhly. 4). bebsl.
010,osi-
ater
g the theepthres-r pa-ring
or-istry
vi-3.
pri-ta-
thinand.en-ase-on-
this
Oldest sediment cored:Depth (mbsf): 16.90Nature: Clayey silt, silty clayAge: Pleistocene
HOLE 1011E
Date occupied: 2 May 1996
Date departed: 2 May 1996
Time on hole: 08 hr, 45 min
Position: 31°16.821′N, 117°38.015′W
Drill pipe measurement from rig floor to seafloor (m): 2030.8
Distance between rig floor and sea level (m): 10.9
Water depth (drill pipe measurement from sea level, m): 2019.9
Total depth (from rig floor, m): 2173.1
Penetration (m): 142.3
Number of cores (including cores having no recovery): 16
Total length of cored section (m): 142.3
Total core recovered (m): 148.5
Core recovery (%): 104.0
Oldest sediment cored:Depth (mbsf): 142.30Nature: Nannofossil silty clayAge: early Pliocene
Principal results: Site 1011 is the landward site of the Baja Transect, whcrosses the California Current at ~30°N. Site 1011 was drilled to stboth surface-water properties and water-column structure for the late Mcene to Quaternary interval. It was also drilled to sample a sedimensection to acoustic basement to determine the nature of the basemento gather information on the opening and subsidence of Animal Basin
Five holes were cored with the APC/XCB at Site 1011 to a maximdepth of 281.5 mbsf, recovering an apparently continuous interval of Qternary to upper Miocene sediments (Fig. 1). Hole 1011A is a 9.5-m-lmudline core, Hole 1011B was cored with the APC to 137.9 mbsf andtended with the XCB to 281.5 mbsf to basement. Hole 1011B was logwith the density-porosity combination tool and the combined sonic-Fmation MicroScanner. Hole 1011C was cored with the APC to 136.6 mand deepened with the XCB to 184.3 mbsf. Hole 1011D was cored wthe APC to 16.9 mbsf. Sixteen APC cores were taken at Hole 1011E dto 142.3 mbsf. Detailed comparisons between the magnetic susceptiband GRAPE density record generated on the MST, and high-resolucolor reflectance measured with the Oregon State University system, donstrated complete recovery of the sedimentary sequence down tombsf.
The uppermost part of the sedimentary section consists of ~25 m oliciclastic sediments with vitric ash layers and graded quartz sand bedupper Quaternary age (Fig. 1). The underlying (180 m thick) unit is chacterized by an increase in calcium carbonate and consists of silty claynannofossil ooze with volcanic ash layers and graded sand beds of latocene to Quaternary age. The section continues downward with aboum of late Miocene clayey diatomites and nannofossil diatomites, undlain by 14 m of poorly recovered indurated siltstone and sandstone. oldest sedimentary is middle upper Miocene (9 Ma) and is underlain bfine-grained vesicular basalt. Sedimentation rates throughout the secrange from 15 to 40 m/m.y., averaging 30 m/m.y.
Biostratigraphic age control was provided by calcareous nannofosand foraminifers and by siliceous diatoms and radiolarians (Fig. 1). Tmicrofossil assemblages show evidence for strong upwelling conditiduring the late Miocene and warm temperate to cool subtropical cotions with a weakening of the upwelling system in the early late Plioc
86
hdyio-aryt and
mua-ngx-edr-sfithwnilityionem-150
si-s ofr-
and Mi-t 60er-he
y ation
ilshensdi-ne
through early Pleistocene. The late Pliocene to Quaternary assembindicate cooler conditions with major sea-surface temperature changelated to glacial-interglacial episodes.
Diagenetic sulfate reduction in these highly organic-rich sedimecaused the dissolution of fine-grained magnetic minerals, which preved the establishment of a magnetostratigraphy. Chemical gradients interstitial waters reflect organic matter diagenesis via sulfate reducan increase in dissolved sulfate at greater depth, the dissolution of bioic opal, and the significant influence of authigenic mineral precipitatio
BACKGROUND AND OBJECTIVES
General Description
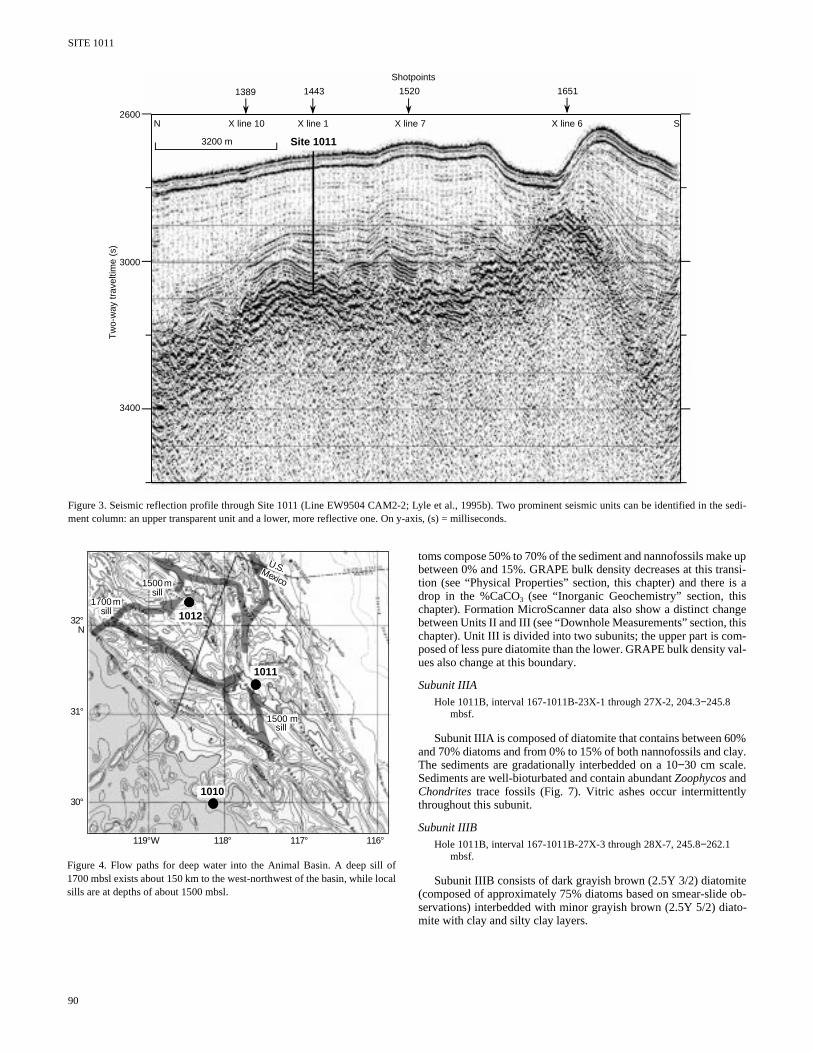
Site 1011 is the landward site of the Baja Transect, which crossesthe California Current at roughly 30°N. It is located about 100 from Ensenada, Mexico, in Animal Basin, one of the outer basinthe California Borderland (Fig. 2). Water depth at Site 1011 is 2mbsl, but the sill depth of the basin is about 1500−1700 mbsl. The sitewas surveyed in detail with the Maurice Ewing on cruise EW9504 in1995 (Lyle et al., 1995a, 1995b; Fig. 3). Animal Basin has relativuniform sedimentation over moderately rugged acoustic basemwhich forms occasional outcrops. At Site 1011, the sedimentarytion can be divided into upper and lower sections. The upper sehas relatively few reflectors that basically conform to basemenpography, and thus it appears to be hemipelagic. The lower sechowever, occasionally pinches and swells, and it appears to betively early basin fill. The acoustic signature of basement is stronamplitude and is typical of crystalline rock.
Site Objectives
Site 1011 was drilled to study both surface water propertieswater column structure for the late Miocene to Holocene intervawas also drilled to sample a sedimentary section to acoustic baseto determine the nature of the basement and to gather informatiothe formation and subsidence of Animal Basin.
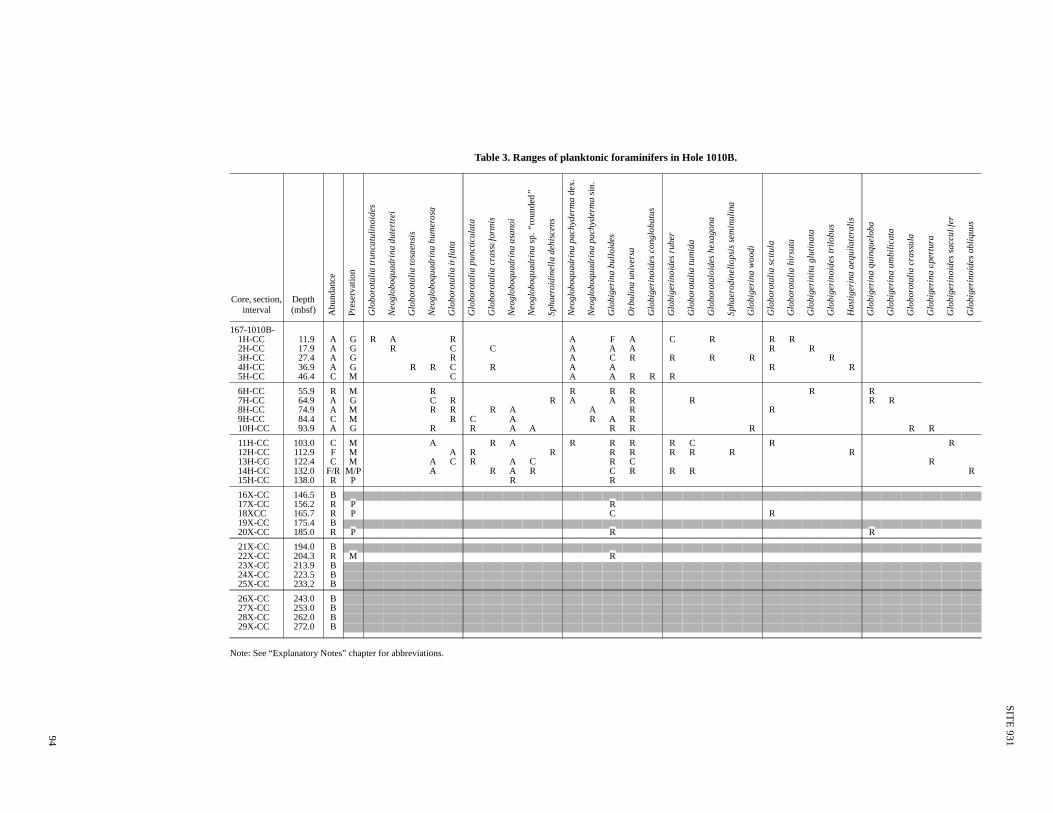
Deep water within Animal Basin at Site 1011 enters eitthrough sills to the west-northwest with a minimum depth of roug1700 mbsl or through more local sills about 1500 m deep (FigBenthic foraminiferal isotope data at Site 1011 should thereforeconditioned by intermediate waters between 1500 and 1700 mNot only does Site 1011 provide an inshore comparison to Site 1it will also be used to model changes in intermediate-water comption and will be useful in determining changes in the general wcolumn profile since about 5 Ma.
Site 1011, the southernmost site of the coastal transect alonCalifornia Margin, preserves the record of coastal upwelling onnorthern Baja California continental margin. Because the water dat this site is relatively shallow (2022 mbsl), calcium carbonate pervation should be good, and most intervals have foraminifers foleoceanographic study. It is the companion to Site 1010, compainshore conditions to those at the core of the California Current.
Site 1011 will also provide important new information about ganic carbon diagenesis and about minor element geochemthrough interstitial water profiles. The only long profiles that preously existed from the California Margin are from DSDP Leg 6During that leg only a few samples above 100 mbsf were taken,marily because of difficulties in obtaining pristine samples with rory cores. New interstitial water sampling at this site, especially withe upper 100 m, will better define the organic matter oxidation the removal of oxidants from the interstitial water and sediments
Another objective at Site 1011 was to sample the entire sedimtary column to acoustic basement (Fig. 3) so that the nature of bment can be identified and the history of basin filling can be recstructed. Animal Basin has a small amount of sedimentary fill, so

SITE 1011
or
4
e
fromm-the
eren- 100nt ofom-curs ashvitricence.itssolu-ig.itd si--
ent.se-
5/aytent silt toand
r- sed-ited
ici- the sub-f in-
objective was achieved. The southern California Borderland basinshave little concrete data concerning their tectonic history so drillingthe sedimentary section and sampling the basement provides impor-tant new information about the evolution of the California Border-land province.
OPERATIONS
Site 1010 to Site 1011
The 82.5-nmi transit from Site 1010 to Site 1011 was accom-plished in 7.5 hr at an average speed of 11.5 kt. A 3.5-kHz precisiondepth recorder (PDR) survey was performed while approaching Site1011. A Datasonics 354M beacon was dropped on Global Position-ing System coordinates at 1715 hr on 29 April.
Hole 1011A
Hole 1011A was spudded and a single APC Core 167-1011A-1Hwas taken from 0 to 9.5 mbsf (Table 1; see Table 2-CD on CD-ROMin the back pocket of this volume for a more detailed coring summa-ry). A full barrel prevented establishing an accurate mudline, and thehole was abandoned.
Hole 1011B
The drill pipe was raised 3 m and Hole 1011B was spudded at2245 hr on 29 April. The water depth was established at 2032.5 mbrfbased on recovery of the mudline core. APC Cores 167-1011B-1Hthrough 15H were taken from 0 to 137.9 mbsf with 103.8% recovery(Table 1). XCB Cores 167-1011B-16X through 31X were takendown to 281.5 mbsf with 89.1% recovery. Hole 1011B was terminat-ed based on the recovery of several sections of vesicular basalt. Awiper trip was made from 281.5 mbsf up to 78 mbsf and back to thebottom of the hole where 3 m of fill was encountered. The pipe wasraised to 78.5 mbsf and preparations for logging were made. Hole1011B was logged with the density-porosity tool string from 2310 to2113 mbrf (277.5−79.5 mbsf). The combined sonic-Formation Mi-croScanner tool string was run from 2310 to 2128 mbrf (277−95mbsf). Both logging runs obtained excellent results. The pipe waspulled clear of the seafloor at 1830 hr, 1 May, ending Hole 1011B.
Hole 1011C
Hole 1011C was spudded at 1900 hr on 1 May. APC Cores 167-1011C-1H through 15H were taken from 0 to 136.6 mbsf with103.8% recovery. XCB Cores 167-1011C-16X through 20X weretaken down to 184.3 mbsf with 101.2% recovery (Table 1). Adaratemperature measurements were taken on Cores 4H, 6H, 8H, 10H,and 12H (see “Physical Properties” section, this chapter). The pwas pulled clear of the seafloor at 1215 hr on 2 May, ending H1011C.
Hole 1011D
Hole 1011D was spudded at 1245 hr on 2 May. APC Cores 11011D-1H and 2H were taken from 0 to 16.9 mbsf with 102% recery (Table 1). The pipe was pulled clear of the seafloor at 1330 h2 May, ending Hole 1011D.
Hole 1011E
Hole 1011E was spudded at 1345 hr on 2 May. APC Cores 11011E-1H through 16H were taken down to 142.3 mbsf with 104.recovery (Table 1). The drill string was tripped back to the surfaand cleared the rotary table at 0130 hr on 3 May, ending Hole 101
ipeole
67-v- on
67-%ce1E.
The JOIDES Resolution was under way for the 7.5-hr transit to Sit1012 by 0145 hr, 3 May.
LITHOSTRATIGRAPHY
Introduction
A continuous late Miocene to Quaternary (~9.0−0.0 Ma) sedi-mentary sequence was recovered at Site 1011. Sediments vary siliciclastic to interbedded mixtures of biogenic and siliciclastic coponents (Fig. 5). Siliciclastic clay and silt are found throughout cored interval but are predominant in the upper portion. The lowportion consists of sediments containing variable mixtures of biogic and/or siliciclastic components interbedded on a scale of 10 tocm. Calcareous nannofossils dominate the calcareous componethe sediments, whereas a mixture of diatoms and radiolarians cposes the siliceous fraction. Volcanic glass is abundant and ocdisseminated throughout the dominant lithologies and as distinctlayers. Volcanic ash content decreases with depth, and discrete ash layers are common in the upper and lower parts of the sequ
The sediments were divided into four lithostratigraphic unbased on visual core descriptions, smear-slide estimates, high-retion GRAPE bulk density, and Formation MicroScanner data (F5). Unit I is a siliciclastic unit comprising mainly clays and silt. UnII contains an interbedded mixture of calcareous nannofossils anliciclastic material. Unit III predominantly consists of siliceous components interbedded and mixed with nannofossil and clay sedimUnit IV is a siliciclastic unit containing siltstone and sandstone. Bament lithology at this site, designated Unit V, is vesicular basalt.
Description of UnitsUnit I
Hole 1011A, interval 167-1011A-1H, 1.9 (top of core)−11.4 mbsf(base of core);
Hole 1011B, interval 167-1011B-1H-1 through 3H-5, 0−25.4 mbsf;Hole 1011C, interval 167-1011C-1H-1 through 3H-7, 0−22.3 mbsf;Hole 1011D, interval 167-1011D-1H and 2H, 0−16.9 mbsf (base of
core);Hole 1011E, interval 167-1011E-1H-1 through 3H-7, 0−24.2 mbsf.Age: Quaternary, 0.0−1.0 Ma.
Unit I is predominantly composed of dark gray (5Y 4/1 to 5Y 1) to gray (10Y 6/1) siliciclastic clay and silt with scattered dark grto black (N2 to N4) vitric ashes and graded sand layers. Clay convaries from 20% to 70% based on smear-slide observations. Thecomponent consists mainly of feldspar (0% to 15%), quartz (0%28%), fresh and altered volcanic glass fragments (0% to 15%), varying but minor components of biotite and amphibole.
Unit II
Hole 1011B, interval 167-1011B-3H-6 through 22X-7, 25.4−204.3 mbsf;Hole 1011C, interval 167-1011C-4H-1 through 20X-7, 22.3−184.3
mbsf (base of core);Hole 1011E, interval 167-1011E-4H-1 through 16H, 24.2−142.3 mbsf
(base of core).Age: Quaternary to late Miocene, 1.0−7.5 Ma.
The transition from Unit I to Unit II is marked by the first occurence of abundant biogenic components as noted by a change iniment color to olive gray (10Y 6/2) and light olive gray (5Y 6/2). UnII consists of moderately bioturbated, gradationally interbeddlithologies with varied mixtures of calcareous nannofossil and silclastic components. Unit II is divided into three subunits based onrelative abundance of the major components. Contacts betweenunits are not strictly defined because of the gradational nature o
87

SITE
1011
88
Ba
rre
n t
o f
ew
NP
D6
b
E.
ma
tuya
ma
i + S
. la
ng
iiB
arr
en
S. p
ere
grin
a
CN
12
aC
N1
0C
N9
–C
N1
0a
CN
9b
Ba
rre
nC
N9
a?
II
IIA
IIB
IIC
N2
1N
20
–N
19
Ba
rre
nB
arr
en
?
Ba
rre
n
?
?
late
Plio
cen
ela
te M
ioce
ne
ea
rly
Plio
cen
e
Biozones
Nan
no
foss
ils
Fo
ram
inif
ers
Un
it
Su
bu
nit
Ag
e
Rad
iola
rian
s
Dia
tom
s
Logging
40 60 80
PP
1.6 1.8 2.0
(g/cm3)
GRAPEbulk
density(API
units)
Naturalgamma
ray
CN
15B
arre
nC
N14
Bar
ren
CN
13b
CN
12d
Bar
ren
to fe
w
B. a
quilo
naris
+ S
. un
iver
sus
E. m
atuy
amai
+ S
. lan
gii
CN
12a–
CN
12c
1H
2H
3H
4H
5H
6H
7H
8H
9H
10H
11H
1H
2H
3H
4H
5H
6H
7H
8H
9H
10H
11H
12H
1H
2H
1H
2H
3H
4H
5H
6H
7H
8H
9H
10H
11H
I
II IIA
N22
N21
Ple
isto
cene
late
Plio
cene
Dep
th (
mbs
f)
Hole1011B
Hole1011C
Hole1011D
Hole1011E
Rec
ove
ry
Co
re
Rec
ove
ryC
ore
Rec
ove
ry
Co
re
Rec
ove
ryC
ore
Biozones
Nan
no
foss
ils
Fo
ram
inif
ers
Un
it
Su
bu
nit
20
40
60
80
100
0
Ag
e
Rad
iola
rian
s
Dia
tom
s
Lit
ho
log
y
12H
13H
14H
11H
12H
13H
14H
15H
16X
17X
18X
19X
20X
21X
22X
15H
16X
17X
18X
19X
20X
Hole1011B
Hole1011C
Hole1011E
Rec
ove
ry
Co
re
Rec
ove
ryC
ore
Rec
ove
ryC
ore
120
140
160
180
200
100
Lit
ho
log
y
Logging
40 60 80
PP
1.6 1.8 2.0
(g/cm3)
GRAPEbulk
density(API
units)
Naturalgamma
ray
Figure 1. Site 1011 master column.

SITE 1011
ox
4/the
nied
b
a-n
de-tion,edt
all-
e--
d-da-lky-ccur
ins di-10Yi-dia-
Rec
ove
ry
Co
re
Biozones
Nan
no
foss
ils
Fo
ram
inif
ers
Un
it
Su
bu
nit
Ag
e
Dep
th (
mbs
f)
Rad
iola
rian
s
Dia
tom
s
Lit
ho
log
y
Nannofossil chalk
Siltstone
Clay
Diatomite
Nannofossil ooze
Sandstone
Basalt
280
NP
D6b
NP
D6a
NP
D5d
Bar
ren
S. p
ereg
rina
D. p
enul
tima
D. a
ntep
enul
tima
CN9a?
Bar
ren
CN
9a–C
N8
Bar
ren
?
II IIC
III
IIIA
IIIB
IV
?
Bar
ren
late
Mio
cene
Hole1011B
22X
23X
24X
25X
26X
27X
28X
29X
30X
31X
PP
(g/cm3)
GRAPEbulk
density
40 60 801.6 1.8 2.0
Logging
Naturalgamma
ray(API units)
260
240
200
220
terbedding in this unit; thus, “intervals” given below are only apprimate.
Subunit IIAHole 1011B, interval 167-1011B-3H-6 through 14H-7, 25.4−131.9 mbsf;Hole 1011C, interval 167-1011C-4H-1 through 14H-7, 22.3−126.8 mbsf;Hole 1011E, interval 167-1011E-4H-1 through 16H, 24.2−142.3 mbsf
(base of core).Subunit IIA consists of interbedded olive gray (5Y 4/2 to 10Y
1) silty clay and light olive gray (5Y 6/2) nannofossil ooze on decimeter to meter scale. The percentage of CaCO3 increases down-core through this subunit inversely to silt content (see “InorgaGeochemistry” section, this chapter). Thin graded beds composquartz feldspar sand occur throughout the subunit down to 97.0 mVitric ash layers occur down to 118 mbsf.
Subunit IIBHole 1011B, interval 167-1011B-15H-1 through 16X-7, 131.9−146.5
mbsf;Hole 1011C, interval 167-1011C-15H-1 through 16X-7, 126.8−145.8
mbsf.The upper contact of Subunit IIB with the Subunit IIA is grad
tional, marked by a decrease in calcareous nannofossils and a
Figure 1 (continued).
1010
30°N
125°W
25°N
120°W
San A
ndreas Fault
Wagner
BasinDelphin
Basin
Guaymas Basin
San QuintinBasin
ColnettBasin
1011
469
470
-
c ofsf.
in-
crease in the silty clay component. This subunit corresponds tocreased porosity and void ratios (see “Physical Properties” secthis chapter). The lithology consists of gradationally interbeddgrayish olive to olive gray (10Y 4/2 to 5Y 4/2) silty clay and lighgray to pale olive (5Y 7/2) silty clay with nannofossils. The overpercentage of CaCO3 is low in this interval (see “Inorganic Geochemistry” section, this chapter).
Subunit IICHole 1011B, interval 167-1011B-17X-1 through 22X-7, 146.5−204.3
mbsf;Hole 1011C, interval 167-1011C-16X-7 through 20X-7, 145.8−184.3
mbsf (base of core).
The contact of Subunit IIC with Subunit IIB is gradational and dfined by increased lithification but is otherwise compositionally similar to Subunit IIA. The boundary is coincident with the corresponing change from APC to XCB coring. This subunit consists of grationally interbedded pale olive (10Y 4/2 to 5Y 4/2) nannofossil chaand olive gray to dark olive gray (5Y 4/2 to 5Y 3/2) nannofossil clastone on an ~1-m scale (Fig. 6). Ash and volcanic sand layers obelow 184.0 mbsf.
Unit III
Hole 1011B, interval 167-1011B-23X-1 through 28X-7, 204.3−262.1mbsf.
Age: late Miocene, 8.5−7.5 Ma.
The contact between Unit II and Unit III is marked by a changethe biogenic component from calcareous nannofossils to siliceouatoms and radiolarians and a change in color to dark olive gray (5/2) diatomite with silty clay and dark grayish brown (2.5Y 4/2) datomite with nannofossils. Based on smear-slide observations,
Figure 2. Location map for Site 1011. Crustal ages from Lonsdale (1991).Site 1011 is located about 100 km west of Ensenada, Mexico, in a basin oflate to middle Miocene age. Locations of ODP Site 1010 and DSDP Sites 469and 470 are shown for reference.
89
SITE 1011
Figure 3. Seismic reflection profile through Site 1011 (Line EW9504 CAM2-2; Lyle et al., 1995b). Two prominent seismic units can be identified in the sedi-ment column: an upper transparent unit and a lower, more reflective one. On y-axis, (s) = milliseconds.
1389 1443 1520
X line 10 X line 1 X line 7
3200 m Site 1011
X line 62600
3000
Tw
o-w
ay tr
avel
time
(s)
1651
3400
Shotpoints
N S
s a
geis-
al-
%ay.
eob-o-
Figure 4. Flow paths for deep water into the Animal Basin. A deep sill of1700 mbsl exists about 150 km to the west-northwest of the basin, while localsills are at depths of about 1500 mbsl.
1012
1011
1010
U.S.Mexico
32°N
31°
30°
119°W 118° 117° 116°
1700 msill
1500 msill
1500 msill
90
toms compose 50% to 70% of the sediment and nannofossils make upbetween 0% and 15%. GRAPE bulk density decreases at this transi-tion (see “Physical Properties” section, this chapter) and there idrop in the %CaCO3 (see “Inorganic Geochemistry” section, thischapter). Formation MicroScanner data also show a distinct chanbetween Units II and III (see “Downhole Measurements” section, thchapter). Unit III is divided into two subunits; the upper part is composed of less pure diatomite than the lower. GRAPE bulk density vues also change at this boundary.
Subunit IIIAHole 1011B, interval 167-1011B-23X-1 through 27X-2, 204.3−245.8
mbsf.
Subunit IIIA is composed of diatomite that contains between 60and 70% diatoms and from 0% to 15% of both nannofossils and clThe sediments are gradationally interbedded on a 10−30 cm scale.Sediments are well-bioturbated and contain abundant Zoophycos andChondrites trace fossils (Fig. 7). Vitric ashes occur intermittentlythroughout this subunit.
Subunit IIIBHole 1011B, interval 167-1011B-27X-3 through 28X-7, 245.8−262.1
mbsf.
Subunit IIIB consists of dark grayish brown (2.5Y 3/2) diatomit(composed of approximately 75% diatoms based on smear-slide servations) interbedded with minor grayish brown (2.5Y 5/2) diatmite with clay and silty clay layers.

SITE 1011
Table 1. Coring summary for Site 1011.
Note: Table 2, on the CD-ROM, back pocket, this volume, is a more detailed coring summary.
CoreDate
(1996) TimeTop
(mbsf)Bottom(mbsf)
Lengthcored(m)
Lengthrecovered
(m)Recovery
(%)
167-1011A-1H April 30 0520 1.9 11.4 9.5 9.84 103.0
167-1011B-1H April 30 0600 0.0 8.4 8.4 8.40 100.02H April 30 0645 8.4 17.9 9.5 9.83 103.03H April 30 0730 17.9 27.4 9.5 9.94 104.04H April 30 0810 27.4 36.9 9.5 9.85 103.05H April 30 0850 36.9 46.4 9.5 9.90 104.06H April 30 0930 46.4 55.9 9.5 10.03 105.67H April 30 1010 55.9 65.4 9.5 9.87 104.08H April 30 1045 65.4 74.9 9.5 9.82 103.09H April 30 1120 74.9 84.4 9.5 10.04 105.710H April 30 1220 84.4 93.9 9.5 9.98 105.011H April 30 1255 93.9 103.4 9.5 9.76 103.012H April 30 1335 103.4 112.9 9.5 9.72 102.013H April 30 1420 112.9 122.4 9.5 9.78 103.014H April 30 1515 122.4 131.9 9.5 9.96 105.015H April 30 1600 131.9 137.9 6.0 6.26 104.016X April 30 1755 137.9 146.5 8.6 8.09 94.017X April 30 1920 146.5 156.2 9.7 9.85 101.018X April 30 2035 156.2 165.7 9.5 9.95 105.019X April 30 2135 165.7 175.4 9.7 9.65 99.520X April 30 2235 175.4 185.0 9.6 9.58 99.821X April 30 2330 185.0 194.6 9.6 9.82 102.022X May 1 0035 194.6 204.3 9.7 9.76 100.023X May 1 0135 204.3 213.9 9.6 9.60 100.024X May 1 0230 213.9 223.5 9.6 9.66 100.025X May 1 0330 223.5 233.2 9.7 9.91 102.026X May 1 0415 233.2 242.8 9.6 9.87 103.027X May 1 0510 242.8 252.4 9.6 9.89 103.028X May 1 0630 252.4 262.1 9.7 9.69 99.929X May 1 0730 262.1 271.7 9.6 0.36 3.830X May 1 0910 271.7 276.4 4.7 0.62 13.231X May 1 1115 276.4 281.5 5.1 1.61 31.5
167-1011C-1H May 2 0215 0.0 3.3 3.3 3.34 101.02H May 2 0245 3.3 12.8 9.5 10.11 106.43H May 2 0325 12.8 22.3 9.5 9.53 100.04H May 2 0430 22.3 31.8 9.5 10.15 106.85H May 2 0500 31.8 41.3 9.5 9.88 104.06H May 2 0550 41.3 50.8 9.5 10.06 105.97H May 2 0615 50.8 60.3 9.5 9.90 104.08H May 2 0700 60.3 69.8 9.5 10.03 105.69H May 2 0745 69.8 79.3 9.5 9.97 105.010H May 2 0845 79.3 88.8 9.5 10.01 105.311H May 2 0915 88.8 98.3 9.5 9.45 99.512H May 2 1025 98.3 107.8 9.5 9.99 105.013H May 2 1110 107.8 117.3 9.5 9.82 103.014H May 2 1145 117.3 126.8 9.5 9.35 98.415H May 2 1240 126.8 136.3 9.5 9.92 104.016X May 2 1430 136.3 145.8 9.5 9.63 101.017X May 2 1530 145.8 155.5 9.7 9.70 100.018X May 2 1630 155.5 165.0 9.5 9.69 102.019X May 2 1720 165.0 174.7 9.7 9.67 99.720X May 2 1820 174.7 184.3 9.6 9.77 102.0
167-1011D-1H May 2 2000 0.0 7.4 7.4 7.38 99.72H May 2 2030 7.4 16.9 9.5 9.86 104.0
167-1011E-1H May 2 2100 0.0 5.2 5.2 5.17 99.42H May 2 2130 5.2 14.7 9.5 9.63 101.03H May 2 2200 14.7 24.2 9.5 10.00 105.24H May 2 2230 24.2 33.7 9.5 9.85 103.05H May 2 2300 33.7 43.2 9.5 9.84 103.06H May 2 2330 43.2 52.7 9.5 9.98 105.07H May 3 0000 52.7 62.2 9.5 10.07 106.08H May 3 0030 62.2 71.7 9.5 9.72 102.09H May 3 0100 71.7 81.2 9.5 10.07 106.010H May 3 0130 81.2 90.7 9.5 9.90 104.011H May 3 0145 90.7 100.2 9.5 10.11 106.412H May 3 0225 100.2 109.7 9.5 9.90 104.013H May 3 0250 109.7 119.2 9.5 10.05 105.814H May 3 0315 119.2 128.7 9.5 10.06 105.915H May 3 0345 128.7 138.2 9.5 10.06 105.916H May 3 0415 138.2 142.3 4.1 4.11 100.0
91

SITE 1011
Dep
th (
mbs
f)
50
100
Ho
le A
Ho
le B
Ho
le C
Ho
le D
1H
7H
1H
2H
3H
4H
5H
6H
8H
9H
10H
11H
12H
15H
13H
14H
16H
Co
reR
eco
v.C
ore
Rec
ov.
Co
reR
eco
v.C
ore
Rec
ov.
1H
2H
3H
4H
5H
6H
7H
8H
9H
10H
11H
12H
15H
13H
14H
16X
Clay SiltstoneSandstone
Ag
e (M
a)
Lit
ho
log
y
Lit
h. u
nit
Description
Qua
tern
ary
late
Plio
cene
Ep
och
e. P
lioce
ne
I
IIA
IIB
Nannofossil oozeNannofossil chalk DiatomiteBasalt
Ho
le E
1H
2H
Co
reR
eco
v.
1H
2H
3H
4H
5H
6H
7H
8H
9H
10H
11H
12H
15H
13H
14H
16H
Unit IClayey silt and siltyclay with abundant disseminated volcanic glass and ash layers.
Decreasing silt
Unit IIAInterbedded silty clay, silty nannofossil ooze, clayey nannofossil ooze, and nannofossil ooze on a deci-meter to meter scale with abundant vitric ash layers down to 118 m.
Decreasingsilt
Changeto XCB
Quartz-feldsparsands
Unit IIBInterbedded silty clay and clay with minor nannofossils.
4.6
3.8
1.0
1.77
150
200
250
31X
17X
18X
19X
20X
21X
22X
23X
24X
25X
26X
27X
28X
29X
30X
17X
18X
19X
20X
late
Mio
cene
IIC
III
A
B
IV
V
Unit IICInterbedded nannofossil claystone, clayey nannofossil chalk, and nannofossil chalk with clay on a meter scale. Ash and volcanic sand layers occur below 184 m.
Diatomite with clay, interbedded diatomite with silty clay, diatomitewith nannofossils, and clay and nannofossil diatomite on the 10–30 cm scale. Vitric ash layers occur intermittently throughout this unit.
Unit IIIA
Unit IVSiltstone, silty clay, and sandstone.
Unit VBasalt basement.
Diatomite. Unit IIIB
8.2
8.5
5.3
7.5
3.58
0
150 300H
ole
A
Ho
le B
Ho
le C
Ho
le D
Co
reR
eco
v.C
ore
Rec
ov.
Co
reR
eco
v.C
ore
Rec
ov.
Ag
e (M
a)
Lit
ho
log
y
Lit
h. u
nit
Description
Ep
och
Ho
le E
Co
reR
eco
v.
17X17X
Figure 5. Site 1011 lithostratigraphic summary (0−278.3 mbsf).
y atig-
and toganhearea).
d atrvals anra-
ande to
lateradicous
. Be-ia-
sedi-
Unit IV
Hole 1011B, interval 167-1011B-29X and 30X, 262.1−276.4 mbsf.Age: late Miocene, ~9.0−8.5 Ma.
The contact between Unit III and Unit IV is marked by a changefrom biogenic to indurated siliciclastic lithologies. The upper part ofthe unit is composed of black (5Y 2.5/1) silicified siltstone interbed-ded with olive gray (5Y 4/2) silty clay. The lower part of Unit IV iscomposed of silicified siltstone and coarse-grained quartz feldsparsandstone. Recovery of Unit IV was quite poor (13% to 31%), and therecovered rock was highly fractured.
Unit V
Hole 1011B, interval 167-1011B-31X, 276.4−281.5 mbsf.
Basement was reached at 276.4 mbsf, and 1.89 m of finely crys-talline, vesicular basalt was recovered.
Depositional History
Sediments at Site 1011 consist of interbedded siliciclastic clays,nannofossil ooze, and siliceous ooze. Volcanic ashes occur every 10−15 m in the upper part of the sedimentary sequence, are absent be-tween 118 and 184 mbsf, and occur intermittently in the lower part.Siliceous sediments dominate the older portion of the sequence fromabout 8.5 to 7.5 Ma. This interval is characterized by decimeter-scaleinterbedding of siliceous ooze dominated by diatoms with clay andminor nannofossil ooze, similar to shoreward basin deposits of the
92
Monterey Formation of California during this time (Ingle, 1981). Sil-iceous ooze deposition ceased in the late Miocene (7.5 Ma) and wasfollowed by an interval of interbedded nannofossil ooze and clayfrom about 7.5 to 1.0 Ma. A marked decrease in nannofossil contentand increase in silt and clay content occurred between 4.6 and 3.8Ma, accompanied by a decrease in sedimentation rate (~1.7 cm/k.y.;see “Biostratigraphy” section, this chapter). This was followed breturn to more rapid sedimentation rates (~4 cm/k.y.; see “Biostraraphy” section, this chapter) and interbedded nannofossil oozesilty clay until ~1.0 Ma (Quaternary) when sedimentation changedsiliciclastic clays and silt. The deposition of graded sand beds beat about 3.2−3.1 Ma, which may reflect tectonism associated with tonset of the tectonic uplift documented in the Santa Maria Basin of the central California Margin at this time (McCrory et al., 1995
BIOSTRATIGRAPHY
The sedimentary sequence recovered from the five holes coreSite 1011 consists of an apparently continuous 281.5-m-thick inteof upper Miocene to Quaternary sediments. The section includeupper 132-m-thick sequence containing abundant planktonic fominifers and calcareous nannofossils, few benthic foraminifers, rare to absent diatoms and radiolarians from the late early Pliocenthe Quaternary. This is underlain by a 48-m-thick sequence of late Miocene to early Pliocene age characterized by rare and spoassemblages of planktonic foraminifers, few to abundant calcarenannofossils, and generally uncommon diatoms and radiolarianslow this interval, a 110-m-thick sequence of rapidly deposited dtom-rich sediments of late Miocene age was recovered. These

SITE 1011
ments contain abundant diatoms and radiolarians. Calcareous nanno-fossils and planktonic foraminifers are rare or absent. Benthicforaminifers assemblages are less consistently present. The base ofthe sedimentary sequence is assigned to the middle late Miocene di-atom Denticulopsis dimorpha Zone, indicating an age of approxi-mately 9 Ma (last occurrence of D. dimorpha between 252 and 262mbsf).
A well-constrained biostratigraphy and chronology for Hole1011B is provided by the combination of all microfossil groups (Ta-bles 3−9). Assigned ages based on foraminifers, calcareous nanno-fossils, diatoms, and radiolarians are similar between Holes 1011Band 1011C. An age/depth plot at Hole 1011B (Fig. 8) shows an al-most continuous sedimentation rate in the sequence, with no hiatuses.
Dominant cold species of planktonic foraminifers, diatom, and ra-diolarian assemblages exhibit evidence of strong upwelling condi-tions during the late Miocene. The predominance of temperate fora-miniferal species in early late Pliocene through early Pleistocene as-semblages, and rare occurrences of diatoms and radiolarians, indicatewarm temperate to cool subtropical conditions with a weakening ofthe upwelling system. Late Pliocene to Quaternary planktonic fora-miniferal assemblages indicate cooler conditions with major sea-sur-face temperature changes related to glacial-interglacial episodes.Fewer occurrences of subtropical forms suggest generally coolerconditions than during the early and early late Pliocene.
The sequence at Site 1011 offers good opportunities for pale-oceanographic investigations on the weakening of the late Miocene
cm
20
50
40
30
10
03 4 5 6
Figure 6. Cyclic interbedding of nannofossil chalk and nannofossil claystonewith gradational, burrowed transitions (Samples 167-1011C-19X-3, 0−55 cm,19X-4, 0−55 cm, 19X-5, 0−55 cm, and 19X-6, 0−55 cm).
cm
130
142
138
134
126
122
extensive upwelling of cool waters and the establishment of Pleis-tocene glacial/interglacial variations of the California Current.
Planktonic Foraminifers
Site 1011 contains an excellent planktonic foraminiferal sequencedown to 132 mbsf of Quaternary to late early Pliocene age (Tables 3,4). Below this, assemblages are sporadic and poor. Planktonic fora-minifers are highly abundant to common throughout most of the Qua-ternary and Pliocene (0 to 132 mbsf; Samples 167-1011B-1H-CC to14H-CC), below which they are rare or absent. Preservation in gen-
Figure 7. Splendid Zoophycos trace fossil in diatomite with clay (Sample167-1011B-26X-5, 121−142 cm).
93
SIT
E 93194
s in Hole 1010B.
Glo
bige
rino
ides
rub
er
Glo
boro
tali
a tu
mid
a
Glo
boro
talo
ides
hex
agon
a
Spha
erod
inel
lops
is s
emin
ulin
a
Glo
bige
rina
woo
di
Glo
boro
tali
a sc
itul
a
Glo
boro
tali
a hi
rsut
a
Glo
bige
rini
ta g
lutina
ta
Glo
bige
rino
ides
trilob
us
Has
tige
rina
aeq
uila
tera
lis
Glo
bige
rina
qui
nque
loba
Glo
bige
rina
um
bilica
ta
Glo
boro
tali
a cr
assu
la
Glo
bige
rina
ape
rtur
a
Glo
bige
rino
ides
sac
culife
r
Glo
bige
rino
ides
obl
iquu
s
C R R RR R
R R R RR R
R
R RR R R
R
R R R
R C R RR R R R
RR R R
R
R
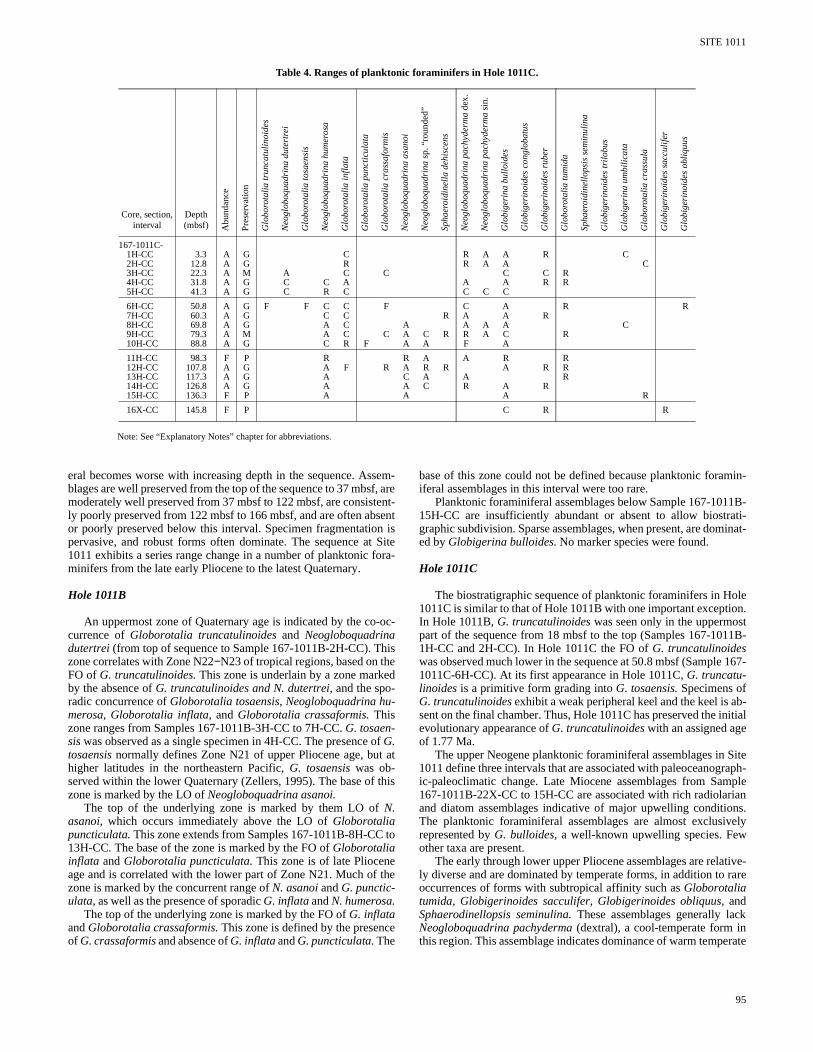
Table 3. Ranges of planktonic foraminifer
Note: See “Explanatory Notes” chapter for abbreviations.
Core, section, interval
Depth (mbsf) A
bund
ance
Pres
erva
tion
Glo
boro
tali
a tr
unca
tuli
noid
es
Neo
glob
oqua
drin
a du
tert
rei
Glo
boro
tali
a to
saen
sis
Neo
glob
oqua
drin
a hu
mer
osa
Glo
boro
tali
a in
flat
a
Glo
boro
tali
a pu
ncti
cula
ta
Glo
boro
tali
a cr
assa
form
is
Neo
glob
oqua
drin
a as
anoi
Neo
glob
oqua
drin
a sp
. “ro
unde
d”
Spha
eroi
dine
lla
dehi
scen
s
Neo
glob
oqua
drin
a pa
chyd
erm
a de
x.
Neo
glob
oqua
drin
a pa
chyd
erm
a si
n.
Glo
bige
rina
bul
loid
es
Orb
ulin
a un
iver
sa
Glo
bige
rino
ides
con
glob
atus
167-1010B-1H-CC 11.9 A G R A R A F A2H-CC 17.9 A G R C C A A A3H-CC 27.4 A G R A C R4H-CC 36.9 A G R R C R A A5H-CC 46.4 C M C A A R R
6H-CC 55.9 R M R R R R7H-CC 64.9 A G C R R A A R8H-CC 74.9 A M R R R A A R9H-CC 84.4 C M R C A R A R10H-CC 93.9 A G R R A A R R
11H-CC 103.0 C M A R A R R R12H-CC 112.9 F M A R R R R13H-CC 122.4 C M A C R A C R C14H-CC 132.0 F/R M/P A R A R C R15H-CC 138.0 R P R R
16X-CC 146.5 B17X-CC 156.2 R P R18XCC 165.7 R P C19X-CC 175.4 B20X-CC 185.0 R P R
21X-CC 194.0 B22X-CC 204.3 R M R23X-CC 213.9 B24X-CC 223.5 B25X-CC 233.2 B
26X-CC 243.0 B27X-CC 253.0 B28X-CC 262.0 B29X-CC 272.0 B
SITE 1011
Table 4. Ranges of planktonic foraminifers in Hole 1011C.
Note: See “Explanatory Notes” chapter for abbreviations.
Core, section, interval
Depth (mbsf) A
bund
ance
Pre
serv
atio
n
Glo
boro
tali
a tr
unca
tuli
noid
es
Neo
glob
oqua
drin
a du
tert
rei
Glo
boro
tali
a to
saen
sis
Neo
glob
oqua
drin
a hu
mer
osa
Glo
boro
tali
a in
flat
a
Glo
boro
tali
a pu
ncti
cula
ta
Glo
boro
tali
a cr
assa
form
is
Neo
glob
oqua
drin
a as
anoi
Neo
glob
oqua
drin
a sp
. “ro
unde
d”
Spha
eroi
dine
lla
dehi
scen
s
Neo
glob
oqua
drin
a pa
chyd
erm
a d
ex.
Neo
glob
oqua
drin
a pa
chyd
erm
a si
n.
Glo
bige
rina
bul
loid
es
Glo
bige
rino
ides
con
glob
atus
Glo
bige
rino
ides
rub
er
Glo
boro
tali
a tu
mid
a
Spha
eroi
dine
llop
sis
sem
inul
ina
Glo
bige
rino
ides
tril
obus
Glo
bige
rina
um
bili
cata
Glo
boro
tali
a cr
assu
la
Glo
bige
rino
ides
sac
culi
fer
Glo
bige
rino
ides
obl
iquu
s
167-1011C-1H-CC 3.3 A G C R A A R C2H-CC 12.8 A G R R A A C3H-CC 22.3 A M A C C C C R4H-CC 31.8 A G C C A A A R R5H-CC 41.3 A G C R C C C C
6H-CC 50.8 A G F F C C F C A R R7H-CC 60.3 A G C C R A A R8H-CC 69.8 A G A C A A A A C9H-CC 79.3 A M A C C A C R R A C R10H-CC 88.8 A G C R F A A F A
11H-CC 98.3 F P R R A A R R12H-CC 107.8 A G A F R A R R A R R13H-CC 117.3 A G A C A A R14H-CC 126.8 A G A A C R A R15H-CC 136.3 F P A A A R
16X-CC 145.8 F P C R R
eral becomes worse with increasing depth in the sequence. Assem-blages are well preserved from the top of the sequence to 37 mbsf, aremoderately well preserved from 37 mbsf to 122 mbsf, are consistent-ly poorly preserved from 122 mbsf to 166 mbsf, and are often absentor poorly preserved below this interval. Specimen fragmentation ispervasive, and robust forms often dominate. The sequence at Site1011 exhibits a series range change in a number of planktonic fora-minifers from the late early Pliocene to the latest Quaternary.
Hole 1011B
An uppermost zone of Quaternary age is indicated by the co-oc-currence of Globorotalia truncatulinoides and Neogloboquadrinadutertrei (from top of sequence to Sample 167-1011B-2H-CC). Thiszone correlates with Zone N22−N23 of tropical regions, based on theFO of G. truncatulinoides. This zone is underlain by a zone markedby the absence of G. truncatulinoides and N. dutertrei, and the spo-radic concurrence of Globorotalia tosaensis, Neogloboquadrina hu-merosa, Globorotalia inflata, and Globorotalia crassaformis. Thiszone ranges from Samples 167-1011B-3H-CC to 7H-CC. G. tosaen-sis was observed as a single specimen in 4H-CC. The presence of G.tosaensis normally defines Zone N21 of upper Pliocene age, but athigher latitudes in the northeastern Pacific, G. tosaensis was ob-served within the lower Quaternary (Zellers, 1995). The base of thiszone is marked by the LO of Neogloboquadrina asanoi.
The top of the underlying zone is marked by them LO of N.asanoi, which occurs immediately above the LO of Globorotaliapuncticulata. This zone extends from Samples 167-1011B-8H-CC to13H-CC. The base of the zone is marked by the FO of Globorotaliainflata and Globorotalia puncticulata. This zone is of late Plioceneage and is correlated with the lower part of Zone N21. Much of thezone is marked by the concurrent range of N. asanoi and G. punctic-ulata, as well as the presence of sporadic G. inflata and N. humerosa.
The top of the underlying zone is marked by the FO of G. inflataand Globorotalia crassaformis. This zone is defined by the presenceof G. crassaformis and absence of G. inflata and G. puncticulata. The
base of this zone could not be defined because planktonic foramin-iferal assemblages in this interval were too rare.
Planktonic foraminiferal assemblages below Sample 167-1011B-15H-CC are insufficiently abundant or absent to allow biostrati-graphic subdivision. Sparse assemblages, when present, are dominat-ed by Globigerina bulloides. No marker species were found.
Hole 1011C
The biostratigraphic sequence of planktonic foraminifers in Hole1011C is similar to that of Hole 1011B with one important exception.In Hole 1011B, G. truncatulinoides was seen only in the uppermostpart of the sequence from 18 mbsf to the top (Samples 167-1011B-1H-CC and 2H-CC). In Hole 1011C the FO of G. truncatulinoideswas observed much lower in the sequence at 50.8 mbsf (Sample 167-1011C-6H-CC). At its first appearance in Hole 1011C, G. truncatu-linoides is a primitive form grading into G. tosaensis. Specimens ofG. truncatulinoides exhibit a weak peripheral keel and the keel is ab-sent on the final chamber. Thus, Hole 1011C has preserved the initialevolutionary appearance of G. truncatulinoides with an assigned ageof 1.77 Ma.
The upper Neogene planktonic foraminiferal assemblages in Site1011 define three intervals that are associated with paleoceanograph-ic-paleoclimatic change. Late Miocene assemblages from Sample167-1011B-22X-CC to 15H-CC are associated with rich radiolarianand diatom assemblages indicative of major upwelling conditions.The planktonic foraminiferal assemblages are almost exclusivelyrepresented by G. bulloides, a well-known upwelling species. Fewother taxa are present.
The early through lower upper Pliocene assemblages are relative-ly diverse and are dominated by temperate forms, in addition to rareoccurrences of forms with subtropical affinity such as Globorotaliatumida, Globigerinoides sacculifer, Globigerinoides obliquus, andSphaerodinellopsis seminulina. These assemblages generally lackNeogloboquadrina pachyderma (dextral), a cool-temperate form inthis region. This assemblage indicates dominance of warm temperate
95

SITE
93196
Cer
atho
lith
us s
pp.
Cer
atho
lith
us te
lesm
us
Cer
atho
lith
us a
cutu
s
Cer
atol
ithu
s ru
gosu
s
Am
auro
lith
us a
mpl
ific
us
Am
auro
lith
us s
pp.
Dis
coas
ter
berg
gren
ii/q
uinq
uera
mus
Min
ylit
ha c
onva
llis
Coc
coli
thus
pel
agic
us
Cal
cidi
scus
mac
inty
rei >
11 µ
m
Cal
cidi
scus
lept
opor
us
R R
F R
C CF R R
C CPF C
C CCC
C
R R CR F C C
CC cf
C RC RRR R/F
R/F
P
RF
F/C
R RR
FR R R
FC/F
R FR R R C
F
P
Table 5. Abundance of calcareous nannofossils at Site 1011.
Zone Core, section, interval (cm)
Depth(mbsf) P
rese
rvat
ion
Abu
ndan
ce
Em
ilia
nia
huxl
eyi
Pse
udoe
mil
iani
a la
cuno
sa
Hel
icos
phae
ra c
arte
ri
Hel
icos
phae
ra s
elli
i
Gep
hyro
caps
a oc
eani
ca s
.l.
Gep
hyro
caps
a sp
. 3
Gep
hyro
caps
a sm
all
Gep
hyro
caps
a la
rge
Dis
coas
ter
brou
wer
i
Dis
coas
ter
trir
adia
tus
Dis
coas
ter
pent
arad
iatu
s
Dis
coas
ter
surc
ulus
Dis
coas
ter
tam
alis
Dis
coas
ter
asym
met
ricu
s
Sphe
noli
thus
spp
.
Ret
icul
ofen
estr
a ps
eudo
umbi
licu
s
167-1011A-CN15–CN14b 1H-CC 11.4 M/G C C P F C
167-1011B-CN15 1H-CC 8.4 M C A C F R ACN15 2H-CC 12.9 G A A C 3H-CC 27.4 BCN14 4H-CC 36.9 G A C R ACN13b 5H-CC 46.4 G A C R C R R
6H-CC 55.9 BCN13a–CN12d 7H-CC 65.4 G A C C R RCN12d 8H-1, 40 65.8 M A C F FCN12d 8H-CC 74.9 G A F/CCN12d 9H-CC 84.4 M C R RCN12a–c 10H-CC 93.9 G A C C R/F FCN12a–c 11H-CC 103.4 G C/A C F/C C/FCN12a 12H-CC 112.9 P C C C CCN12a 13H-CC 122.4 G A C F/C F/CCN12a 14H-CC 131.9 M A C R/FCN10b–CN10c 15H-CC 137.9 P/M F/C C CCN10a? 16X-CC 146.5 P/M F/C C CCN10a–CN9 17X-CC 156.2 G A R F/CCN9b? 18X-CC 165.7 G/M A R RCN9b 19X-CC 175.4 P/M F/C CCN9b 20X-CC 185.0 M/G A C 21X-CC 194.6 BCN9a? 22X-CC 204.3 P C R/F
23X-CC 213.9 B24X-CC 223.5 B
CN8–CN9a 25X-1, 118 224.7 P R25X-2, 90 225.9 B25X-3, 102 227.5 B25X-4, 102 229.0 B
25X-5, 120 230.8 BCN8–CN9a 25X-6, 120 233.2 P C CCN8–CN9a 25X-CC 233.2 P C CCN8–CN9a 26X-CC 242.8 P R/F
27X-CC 252.4 B28X-CC 262.1 B29X-CC 271.7 P R P
167-1011C-CN15 1H-CC 3.3 M F/C C/A R CCN15 2H-CC 12.8 M/G C P R R/F ACN14a 3H-CC 22.3 G A P R C R ACN14a 4H-CC 31.8 G A C C C C A 5H-CC 41.3 P R P P RCN13b 6H-CC 50.8 G A C C R F/C A CCN13a? 7H-CC 60.3 G A C P C RRCN12d 8H-CC 69.8 G A R/F F FCN12d 9H-CC 79.3 G A R FCN12a–c 10H-CC 88.8 G A R/F R P F/R FCN12a–b 11H-CC 98.3 P R R F/C CCN12a 12H-CC 107.8 G A P C C C R

SITE
93197
Note
CN F F R FCN C F RR C R F R CCN cf C R R/F R R CCN R A F RCN A cf F/CCN R/F C/FCN C RCN A F/R
CN RCN P
RCN CCN RCN RCN RCN RCN P PCN R RCN FCN FCN F RCN C FCN F R/F RRCN R CCN R FCN C F R R F P
Dis
coas
ter
tam
alis
Dis
coas
ter
asym
met
ricu
s
Sphe
noli
thus
spp
.
Ret
icul
ofen
estr
a ps
eudo
umbi
licu
s
Cer
atho
lith
us s
pp.
Cer
atho
lith
us te
lesm
us
Cer
atho
lith
us a
cutu
s
Cer
atol
ithu
s ru
gosu
s
Am
auro
lith
us a
mpl
ific
us
Am
auro
lith
us s
pp.
Dis
coas
ter
berg
gren
ii/q
uinq
uera
mus
Min
ylit
ha c
onva
llis
Coc
coli
thus
pel
agic
us
Cal
cidi
scus
mac
inty
rei >
11 µ
m
Cal
cidi
scus
lept
opor
us
: See “Explanatory Notes” chapter for abbreviations.
12a 13H-CC 117.3 G A R R F12a 14H-CC 126.8 G C/A F10b–CN10c 15H-CC 136.3 P R/F10a–CN9 16X-CC 145.8 P/M A10a–CN9 17X-CC 155.5 P/M A RR10a–CN9 18X-CC 165.0 P A10a–CN9 19X-CC 174.7 P/M A10a–CN9 20X-CC 189.3 M A
167-1011D-15 1H-CC 7.4 G A P RR C R A15 2H-CC 16.9 G C P C R A
167-1011E-1H-CC 5.2 P F P R P
15 2H-CC 14.7 G A P C C A14a 3H-CC 24.2 M/G A C C P P A14a 4H-CC 33.7 G A C C P P A13 5H-CC 43.2 G A C C13b 6H-CC 52.7 M C C C P13a? 7H-CC 62.2 M C/A C R13a? 8H-CC 71.7 P F C F R RR12d 9H-CC 81.2 P C F12 10H-CC 90.7 P F F R R12a–c 11H-CC 100.0 M/G A F R12 12H-CC 109.7 M/G A F/C R F/R12a 13H-CC 119.2 P F P R12 14H-CC 128.0 M/P C12 15H-CC 138.2 M A P C10c 16H-CC 142.3 P A
Zone Core, section, interval (cm)
Depth(mbsf) P
rese
rvat
ion
Abu
ndan
ce
Em
ilia
nia
huxl
eyi
Pse
udoe
mil
iani
a la
cuno
sa
Hel
icos
phae
ra c
arte
ri
Hel
icos
phae
ra s
elli
i
Gep
hyro
caps
a oc
eani
ca s
.l.
Gep
hyro
caps
a sp
. 3
Gep
hyro
caps
a sm
all
Gep
hyro
caps
a la
rge
Dis
coas
ter
brou
wer
i
Dis
coas
ter
trir
adia
tus
Dis
coas
ter
pent
arad
iatu
s
Dis
coas
ter
surc
ulus
Table 5 (continued).

SITE
93198
Coc
cone
is c
alif
orni
ca
Cos
cino
disc
us m
argi
natu
s
Cos
cino
disc
us m
argi
natu
s fo
ssil
is
Cos
cino
disc
us (
Az.
) no
duli
fer
Cos
cino
disc
us s
p.
Den
ticu
lops
is la
uta
s.l.
Den
ticu
lops
is d
imor
pha
Den
ticu
lops
is h
uste
dtii
Den
ticu
lops
is h
yali
na
Den
ticu
lops
is k
atay
amae
Den
ticu
lops
is p
raed
imor
pha
Dip
lone
is s
mit
hii
T
T
TT C F C F FT T T TT R R R T TT T T
T C T T TC P F T PA T TC R C F R
C
F C F FF A F
T P P P PP P
PP P P
T
T T TP T C
R R R F RF R
F F F F
Table 6. Abundance of diatoms at Site 1011.
Core, section, interval
Sample depth (mbsf)
Numeric age
(Ma) Geologic ageDiatom
zone Abu
ndan
ce
Pres
erva
tion
Env
iron
men
t
Frag
men
tal d
iato
ms
Act
inoc
yclu
s eh
renb
ergi
i var
.
Act
inoc
yclu
s in
gens
Act
inoc
yclu
s in
gens
inge
ns
Act
inoc
yclu
s in
gens
nod
us
Act
inoc
yclu
s cf
. ocu
latu
s
Act
inoc
yclu
s oc
hote
nsis
Act
inoc
yclu
s ts
ugar
uens
is
Act
inop
tych
us s
enar
ius
Am
phor
a sp
.
Aul
acos
ira
gran
ulat
a
167-1011A-1H-CC 11.4 T T
167-1011B-1H-CC 8.4 T T2H-CC 17.9 B3H-CC 27.4 T T4H-CC 36.9 T T5H-CC 46.4 R P R6H-CC 55.9 T R T7H-CC 65.4 T F8H-CC 74.9 T R9H-CC 84.4 T R10H-CC 93.9 T P F11H-CC 103.4 T R12H-CC 112.9 T P R13H-CC 122.4 T T14H-CC 131.9 T P R15H-CC 137.9 B16X-CC 146.5 B17X-CC 156.2 R P R18X-CC 165.7 R P R19X-CC 175.4 late Miocene−late Pleistocene F M R20X-CC 185.0 late Miocene F P T R21X-CC 194.6 7.1−8.4 late Miocene NPD 6b C M T22X-CC 204.3 7.1−8.4 late Miocene NPD 6b F P23X-CC 213.9 7.1−8.4 late Miocene NPD 6b A G Upwelling T R24X-CC 223.5 7.1−8.4 late Miocene NPD 6b A G T T25X-CC 233.2 7.1−8.4 late Miocene NPD 6b A G Upwelling26X-CC 242.8 7.1−8.4 late Miocene NPD 6b A G T R
27X-CC 252.4 8.4−9.0 late Miocene NPD 6a A G Upwelling R
28X-CC 262.1 9.0−9.8 late Miocene NPD 5d A G Upwelling29X-CC 271.7 9.0−9.8 late Miocene NPD 5d A G Upwelling
167-1011C-1H-CC 3.3 T P R2H-CC 12.8 B3H-CC 22.3 B4H-CC 31.8 Quaternary T P5H-CC 41.3 Quaternary R P P6H-CC 50.8 R P7H-CC 60.3 R P8H-CC 69.8 T T9H-CC 79.3 T P10H-CC 88.8 B11H-CC 98.3 Pliocene T P12H-CC 107.8 T P R13H-CC 117.3 late Miocene R P T14H-CC 126.8 F P15H-CC 136.3 B16X-CC 145.8 T17X-CC 155.5 F P R R18X-CC 165.0 R P19X-CC 174.7 F P-M

SITE
93199
Notes: P = present; more d tions.
20X-CC 184.3 F R F F F F
167-1011D-1H-CC 7.42H-CC 16.9
167-1011E-1H-CC 5.22H-CC 14.73H-CC 24.2 P P P P P4H-CC 33.75H-CC 43.2 P P P6H-CC 52.7 P P P7H-CC 62.2 P8H-CC 71.7 P P9H-CC 81.210H-CC 90.711H-CC 100.0 T12H-CC 109.7 T T13H-CC 119.214H-CC 128.015H-CC 138.2 P16H-CC 142.3
Core, section, interval
Sample depth (mbsf) A
ctin
ocyc
lus
cf. o
cula
tus
Act
inoc
yclu
s oc
hote
nsis
Act
inoc
yclu
s ts
ugar
uens
is
Act
inop
tych
us s
enar
ius
Am
phor
a sp
.
Aul
acos
ira
gran
ulat
a
Coc
cone
is c
alif
orni
ca
Cos
cino
disc
us m
argi
natu
s
Cos
cino
disc
us m
argi
natu
s fo
ssil
is
Cos
cino
disc
us (
Az.
) no
duli
fer
Cos
cino
disc
us s
p.
Den
ticu
lops
is la
uta
s.l.
Den
ticu
lops
is d
imor
pha
Den
ticu
lops
is h
uste
dtii
Den
ticu
lops
is h
yali
na
Den
ticu
lops
is k
atay
amae
Den
ticu
lops
is p
raed
imor
pha
Dip
lone
is s
mit
hii
etailed abundance information not available. See “Explanatory Notes” chapter for other abbrevia
late Miocene C M
T P R PB
BBR P
T P PT PT PT PT PBR P CR P
T PT P TT P PT PB
Numeric age
(Ma) Geologic ageDiatom
zone Abu
ndan
ce
Pres
erva
tion
Env
iron
men
t
Frag
men
tal d
iato
ms
Act
inoc
yclu
s eh
renb
ergi
i var
.
Act
inoc
yclu
s in
gens
Act
inoc
yclu
s in
gens
inge
ns
Act
inoc
yclu
s in
gens
nod
us
Table 6 (continued).

SITE
931
100
oles 1011B, 1011C, and 1011E.
Notes: Shaded ar r for abbreons.
Geo
logi
c ag
e
Dia
tom
zon
e
Abu
ndan
ce
Pres
erva
tion
Env
iron
men
t
Cor
e, s
ectio
n, in
terv
al
Sam
ple
dep
th (
mbs
f)
Num
eric
age
(m
a)
Geo
logi
c ag
e
Dia
tom
zon
e
Abu
ndan
ce
Pres
erva
tion
Env
iron
men
t
167-1 167-1011E-1H- T P 1H-CC 5.2 B2H- B 2H-CC 14.7 B3H- B 3H-CC 24.2 R P4H- uaternary T P 4H-CC 33.7 T P5H- Quaternary R P 5H-CC 43.2 T P6H- R P 6H-CC 52.7 T P7H- R P 7H-CC 62.2 T P8H- T 8H-CC 71.7 T P9H- T P 9H-CC 81.2 B10H B 10H-CC 90.7 R P11H liocene T P 11H-CC 100.0 R P12H T P 12H-CC 109.7 T P13H late Miocene R P 13H-CC 119.2 T P14H F P 14H-CC 128.0 T P15H B 15H-CC 138.2 T P16X T 16H-CC 142.3 B17X F P18X R P19X F P/M
185 mbsf 20X late Miocene C M 185 mbsf21X22X23X Diatomaceous sediments indicating
high oceanic productivityand upwelling condition
24X25X26X27X28X29X
Table 7. Biostratigraphic correlations using diatoms between H
eas represent zones where diatoms are absent or are in trace amounts. See “Explanatory Notes” chapteviati
Cor
e, s
ectio
n, in
terv
al
Sam
ple
dep
th (
mbs
f)
Num
eric
age
(M
a)
Geo
logi
c ag
e
Dia
tom
zon
e
Abu
ndan
ce
Pres
erva
tion
Env
iron
men
t
Cor
e, s
ectio
n, in
terv
al
Sam
ple
dep
th (
mbs
f)
Num
eric
age
(M
a)
011B- 167-1011C-CC 8.4 T 1H-CC 3.3CC 17.9 B 2H-CC 12.8CC 27.4 T 3H-CC 22.3CC 36.9 T 4H-CC 31.8 QCC 46.4 R P 5H-CC 41.3CC 55.9 T 6H-CC 50.8CC 65.4 T 7H-CC 60.3CC 74.9 T 8H-CC 69.8CC 84.4 T P 9H-CC 79.3-CC 93.9 T P 10H-CC 88.8-CC 103.4 T 11H-CC 98.3 P-CC 112.9 T P 12H-CC 107.8-CC 122.4 T 13H-CC 117.3-CC 131.9 T P 14H-CC 126.8-CC 137.9 B 15H-CC 136.3-CC 146.5 B 16X-CC 145.8-CC 156.2 R P 17X-CC 155.5-CC 165.7 R P 18X-CC 165.0-CC 175.4 late Pliocene F M 19X-CC 174.7-CC 185.0 late Miocene F P 20X-CC 184.3-CC 194.6 7.1–8.4 late Miocene NPD 6b C M-CC 204.3 7.1–8.4 late Miocene NPD 6b F P-CC 213.9 7.1–8.4 late Miocene NPD 6b A G Upwelling-CC 223.5 7.1–8.4 late Miocene NPD 6b A G-CC 233.2 7.1–8.4 late Miocene NPD 6b A G Upwelling-CC 242.8 7.1–8.4 late Miocene NPD 6b A G-CC 252.4 8.4–9.0 late Miocene NPD 6a A G Upwelling-CC 262.1 9.0–9.8 late Miocene NPD 5d A G Upwelling-CC 271.7 9.0–9.8 late Miocene NPD 5d A G Upwelling

SITE 1011
ttath
n
p
iblvn
r
10
f
56
eb
e
1
od toostnti-us-
thecif-les
by--
lly
e-
les
thandi-
e–
n-h,eco-lu-
di- toati-oc--ies.ic-
this
oB-
9 to
-ate
-
to cool subtropical conditions during the late early through early latePliocene. The assemblages of late Pliocene through Quaternary ageindicate cooler conditions by the nearly consistent abundant occur-rence of either or both sinistral and dextral N. pachyderma, beginningwith Samples 167-1011B-7H-CC and 167-1011C-9H-CC and ex-tending to the top of the sequence. Clear oscillations occur through-out this interval between assemblages dominated by sinistrally ordextrally coiled N. pachyderma. This provides evidence for major os-cillations in sea-surface temperatures related to glacial/interglacialepisodes. We are surprised at the magnitude of the cooling duringglacial episodes at the latitude of Site 1011 suggested by the characterof the planktonic foraminiferal assemblages. The Pliocene–Quanary planktonic foraminifer assemblages in Site 1011 also condistinctly fewer tropical to warm subtropical forms compared withose of Site 1010, indicating much reduced tropical influence.
Benthic foraminifers consistently occur throughout the Plioceand Quaternary sequence in variable abundances. Uvigerina is con-sistently present. Other taxa that occur more sporadically in samof this age are Globobulimina, Gyroidina, Oridorsalis, Cibicides,Hoeglundina, and Pyrgo. This assemblage suggests the presencerelatively well-oxygenated bottom water during this interval. Benthforaminifers are less consistently present in the late Miocene, most samples contain a small well-preserved assemblage. Aggnated forms and nodosariids are more conspicuous than in the olying Pliocene−Quaternary assemblages, and there is a suggestiolower oxygenation of the benthic environment.
Calcareous Nannofossils
Nannofossils are generally common to abundant and well-pserved through the Quaternary and Pliocene, but the preservatiopoor and several samples are barren in the late Miocene. A timeterval spanning late Miocene Zone CN9a−CN8 to late PleistoceneZone CN15 (Okada and Bukry, 1980) was recognized in Hole 101(Table 5). The lowest zone recorded in Hole 1011C is Zone CN1−CN9. Hole 1011E represents an interval ranging from the lowPliocene Zone CN10 to the late Pleistocene CN 15.
In the Quaternary, nannofossil assemblages are marked bypresence of Emiliania huxleyi, Pseudoemiliania lacunosa, Calcidis-cus leptoporus, Helicosphaera carteri, and several morphotypes oGephyrocapsa spp. and Ceratolithoides spp.
The Pliocene/Pleistocene boundary is placed by the FO of Gephy-rocapsa oceanica s.l. Pliocene nannofossil assemblages are markby an association of Helicosphaera carteri, Discoaster brouweri,Discoaster tamalis, Discoaster pentaradiatus, Discoaster surculus,Amaurolithus delicatus, and several morphotypes of Reticulofenestraand Ceratolithus. The upper/lower Pliocene boundary is recognizeclose to the LO of Reticulofenestra pseudoumbilicus (base ofCN12a), and occurs between Samples 167-1011B-14H-CC and 1CC, between 167-1011C-14H-CC and 15H-CC, and between 11011E-15H-CC and 16H-CC. Presence of Amaurolithus spp. andCeratolithus acutus allows assignment of the lower Pliocene to ZonCN10c/CN10b. The Miocene/Pliocene boundary was placed tween Samples 167-1011B-17X-CC and 18X-CC by the LO of Dis-coaster quinqueramus/berggrenii. The co-occurrence of Discoasterquinqueramus/berggrenii and Amaurolithus spp. in Samples 167-1011B-18X-CC to 167-1011B-23X-CC allows the assignment of thinterval to Zone CN9b. In Hole 1011C, the Miocene/Pliocene bounary was not recognized because Discoaster quinqueramus/berggreniiis absent. In the interval, calcareous nannofossils are strongly etcand a precise biostratigraphic assignment is difficult. Only a fspecimens of Minylitha convallis, which is characteristic of ZonesCN8 and CN9a, were observed in sediments between Samples 1011B-25X-1, 118 cm, and 167-1011B-26X-CC.
er-in
e
les
ofcut
uti-er- of
e-n is in-
Baer
the
ed
d
H-7-
e-
isd-
hedw
67-
Diatoms
Diatoms are abundant to common and display excellent to gopreservation in the lowermost nine cores of Hole 1011B (194.6271.7 mbsf). Above 185 mbsf in all holes, throughout the uppermMiocene to Quaternary, diatoms are few to barren, and large quaties of clay, clastic material, and calcareous nannofossils continuoly dominate the lithostratigraphic succession.
Diatom assemblages are typical of the subarctic region of north Pacific and can be zoned readily using the Leg 167 north Paic diatom zonation (Table 6). Assemblages examined from Samp167-1011B-21X-CC through 26X-CC are commonly dominated Coscinodiscus marginatus, a large, robust centric diatom that is resistant to dissolution.This horizon falls just below Core 167-1011C20X.
A complete sequence from the Thalassionema schraderi Zone(NPD 6b) to the Denticulopsis dimorpha Zone (NPD 5d) was recov-ered through Samples 167-1011B-21X-CC to 29X-CC, and whofall within the middle late Miocene (~7.1−9.8 Ma; Tables 6, 7). TheLCO of the Denticulopsis hustedtii group involving Denticulopsiskatayamae in Sample 167-1011B-27X-CC marks the boundary btween the Thalassionema schraderi Zone (NPD 6b) and the underly-ing Denticulopsis katayamae Zone (NPD 6a). The top of the Dentic-ulopsis dimorpha Zone (NPD 5d) has been placed between Samp167-1011B-27X-CC and 28X-CC by the LO of D. dimorpha. Thepresence of D. dimorpha in Sample 167-1011B-29X-CC indicatesthat the base of the cored section at Site 1011 may be younger 9.8 Ma, an assignment that is more consistent with that of the raolarians (Tables 6, 7).
Persistent reworking of middle Miocene forms of D. hustedtii andD. dimorpha occur in the Pliocene and Quaternary. The PliocenQuaternary assemblages are dominated by cold-water Neodenticulaspecies of middle-to-high latitudes (Akiba, 1986; Koizumi and Taimura, 1985; Barron, 1992). The scarcity of diatoms in the clay-ricupper part of the sequence in Sites 1010 and 1011 results from logical exclusion from the relatively warm coastal waters or dissotion.
Radiolarians
Rare and poorly preserved radiolarians were found in the sements of the upper lithostratigrahic Unit I of Quaternary age. Rarefew representatives of radiolarians were recognized in the lithostrgraphic Unit II. Rare to abundant and well-preserved radiolarians cur in the lower lithostratigraphic Unit III of late Miocene age. Assemblages of this site are made up of mid-latitude and Arctic specTropical forms were not found. Common to abundant species indative of upwelling areas such as Collosphaera huxleyi, Eucyrtidiumerythromystax, and Phormostichoartus crustula suggest a persistentupwelling system during the late Miocene to early Pleistocene at Site (Tables 8, 9).
Presence of morphotypes transitional between Lamprocyrtis ni-griniae and L. neoheteroporos gives an early Pleistocene age (1.2 t0.9 Ma) to Sample 167-1011B-3H-CC (27.4 mbsf). Samples 10111H-CC to 3H-CC (8.4 to 27.4 mbsf) are thus placed in the B. aqui-lonaris and S. universus Zones, although the LO of E. matuyamai at 1.0Ma was not observed. Samples 167-1011B-4H-CC to 13H-CC (55.122.4 mbsf) are tentatively placed in the E. matuyamai and S. langiiZones since consistent occurrence of S. peregrina was not observed.Consistent occurrence of S. peregrina places the interval between Samples 167-1011B-18X-CC and 23X-CC (165.7 to 213.9 mbsf) in the lMiocene to early Pliocene S. peregrina Zone. The evolutionary transi-tion between S. delmontensis and S. peregrina, which indicates thebase of the S. peregrina Zone, was observed in Sample 167-1011B
101

SITE 1011
1
Table 8. Range of stratigraphically important radiolarians in Hole 1011B.
Notes: P = present; more detailed abundance information not available. See “Explanatory Notes” chapter for other abbreviations.
ZoneCore, section,
intervalDepth(mbsf) A
bund
ance
Pres
erva
tion
Ant
hocy
rtid
ium
ehr
enbe
rgi
Ant
hocy
rtid
ium
nos
icaa
e
Ant
hocy
rtid
ium
pli
ocen
ica
Bot
ryoc
ella
cri
bros
a
Bot
ryos
trob
us a
quil
onar
is
Bot
ryos
trob
us b
ram
lett
ei
Bot
ryos
trob
us p
raet
umid
ulus
Cir
codi
scus
ell
ipti
cus
Col
losp
haer
a hu
xley
i
Cyc
lado
phor
a bi
cinc
ta
Cyc
lado
phor
a co
sma
Cyc
lado
phor
a da
visi
ana
davi
sian
a
Cyr
toca
psel
la c
ornu
ta
Cyr
toca
psel
la ja
poni
ca
Dia
rtus
hug
hesi
Dic
tyop
him
us s
plen
dens
Did
ymoc
yrti
s an
tepe
nult
ima
Euc
yrti
dium
cal
vert
ense
Euc
yrti
dium
infl
atum
167-1011B-B. aquilonaris 1H-CC 8.40 R P
+ 2H-CC 17.40 R PS. universus 3H-CC 27.40 R G P P P
4H-CC 55.90 F G P P5H-CC 46.40 R P6H-CC 55.90 R P
E. matuyamai 7H-CC 49.60 F G P P P+ 8H-CC 74.90 F G P
S. langii 9H-CC 84.40 R M10H-CC 93.90 R P11H-CC 103.40 C M P P P P12H-CC 112.90 R P P13H-CC 122.40 B P14H-CC 131.90 R P P P P15H-CC 137.90 B
Unzoned 16X-CC 145.60 B17X-CC 156.20 B18X-CC 165.70 F M P19X-CC 175.40 C M P P
S. peregrina 20X-CC 185.00 A G P P P P P P21X-CC 194.60 A G P P P22X-CC 204.30 A G P P P P P23X-CC 213.90 A G P
24X-CC 223.50 A G P P P P P P25X-CC 233.20 A G P P P
D. penultima 26X-CC 242.80 A G P P P P27X-CC 252.40 A G
D. antepenultima 28X-CC 262.10 A G P P P29X-CC 271.70 A G P P P P P
o-t theter,in- in-iveides
e- be).
g-bsf
in- to
ho-e- andrity
the
23X-CC (213.9 mbsf). The base of the D. penultima Zone (late Mi-ocene) is well defined by the FO of D. hughesi in Sample 167-1011B-28X-CC (262.1 mbsf). Samples 167-1011B-28X-CC and 167-1011B-29X-CC are placed in the D. antepenultima Zone since D. petterssoniwas not found. Occurrence of rare representatives of C. cornuta withinthis interval are interpreted as reworking. The LO of L. n. magnacor-nuta at 8.8 Ma is also located in this interval. The interval between1011C-11H-CC and 14-CC (98.3 to 126.8 mbsf) is tentatively placedin the early Pleistocene E. matuyamai and S. langii Zones as indicatedby the presence of Lamprocyrtis neoheteroporos, L. heteroporos, andS. universus. The interval between Samples 167-1011C-18H-CC and20H-CC (165 to 184.3 mbsf) was placed in the S. peregrina Zone,based on the presence of rare and poorly to well-preserved S. peregrinaand the absence of L. neoheteroporos.
PALEOMAGNETISM
Laboratory Procedures
We measured the remanent magnetization of archive halves ofAPC cores from Site 1011 with the pass-through cryogenic magne-tometer. After measuring natural remanent magnetization (NRM), 15cores from Hole 1011B were demagnetized with a peak alternatingfield (AF) of 20 mT. Because the demagnetization at 20 mT reducedthe magnetic intensity of most sections in Hole 1011B to less than 1mA/m, we demagnetized four APC cores from the topmost part ofHole 1011C at 10 mT AF. A few discrete samples from Hole 1011Bwere stepwise AF demagnetized using the Schonstedt Alternating
02
Field Demagnetizer (GSD-1) and measured with the Minispin mag-netometer.
Results and Discussion
The NRM intensity of the APC cores from Hole 1011B was on theorder of 10 mA/m in most cores (Fig. 9). The direction of NRM is in-clined steeply downward with declinations around 0°. This compnent suggests a drilling-induced remanence, as noticed already aprevious site (see “Paleomagnetism” section, “Site 1010” chapthis volume). After AF demagnetization at 20 mT, the magnetic tensities were reduced to about 10% of their NRM values, and theclinations became shallower. Stepwise AF demagnetization of fdiscrete samples showed that the almost vertical component resin the coercivity range mostly below 5 mT (Fig. 10).
Although the bulk of the drilling-induced remanence was rmoved by AF demagnetization, a magnetostratigraphy could notdetermined for Hole 1011B from the magnetic inclinations (Fig. 9According to the nannofossil and planktonic foraminiferal biostratiraphy, the Pleistocene/Pliocene boundary is located at about 50 m(see “Biostratigraphy” section, this chapter). This suggests that anterval above 50 mbsf should correspond to Chron C1r. Cores 1H5H, however, had positive inclinations except for a few dispersed rizons with negative inclinations. Below 50 mbsf, a few short rversely magnetized horizons were found at around 56, 72, 74, 82,121 mbsf. These data suggest deposition during reversed polachrons, but the few reversals are not sufficient to be correlated tostandard polarity time scale.

SITE 1011
Table 8 (continued).
ZoneCore, section,
intervalDepth(mbsf) A
bund
ance
Pre
serv
atio
n
Gon
dwan
aria
dog
eli
Lam
proc
yrti
s ne
ohet
erop
oros
Lam
proc
yrti
s ni
grin
iae
Lar
cosp
ira
mos
chko
vski
i
Lych
noca
nom
a n.
sak
ai
Lych
noca
nom
a ni
ppon
ica
mag
naco
rnut
a
Lych
noca
nom
a ni
ppon
ica
nipp
onic
a
Pho
rmos
tich
oart
us c
rust
ula
Pru
nopy
le h
ayes
i
Spha
erop
yle
lang
ii
Spha
erop
yle
robu
sta
Spir
ema
circ
ular
is
Stau
roxi
phos
com
mun
is
Stic
hoco
rys
delm
onte
nsis
Stic
hoco
rys
pere
grin
a
Styl
acon
tari
um a
cqui
loni
um
Styl
atra
ctus
uni
vers
us
Styl
odic
tya
vali
disp
ina
The
ocor
ys r
edon
doen
sis
167-1011B-B. aquilonaris 1H-CC 8.40 R P
+ 2H-CC 17.40 R PS. universus 3H-CC 27.40 R G P P
4H-CC 55.90 F G P P P5H-CC 46.40 R P6H-CC 55.90 R P
E. matuyamai 7H-CC 49.60 F G P P+ 8H-CC 74.90 F G P P
S. langii 9H-CC 84.40 R M P P P10H-CC 93.90 R P11H-CC 103.40 C M P P P P12H-CC 112.90 R P P P P
13H-CC 122.40 B P P P P P14H-CC 131.90 R P P15H-CC 137.90 B
Unzoned 16X-CC 145.60 B17X-CC 156.20 B18X-CC 165.70 F M P P P19X-CC 175.40 C M P P P
S. peregrina 20X-CC 185.00 A G P P P P P P P21X-CC 194.60 A G P P P P P22X-CC 204.30 A G P P P P P P P P23X-CC 213.90 A G P P P P P P
24X-CC 223.50 A G P P P P P25X-CC 233.20 A G P P P P P
D. penultima 26X-CC 242.80 A G P P P P P P P P P27X-CC 252.40 A G P P P P P
D. antepenultima 28X-CC 262.10 A G P P P P P29X-CC 271.70 A G P P P P P P P
hyg T co r to aunl oa
simth1.
al coedos
ureho
pth.wasach
that on
ryboutuity
er-andheiteadeals
lkwnely.lap of
cd.67- gap
iteres.
An interesting feature of the paleomagnetic data at Site 1011 is thesteplike reduction in magnetic intensity from 1.5 to 2.5 mbsf (Fig.11). The intensity drop of remanent magnetization corresponds to adecrease in magnetic susceptibility in the same interval (see “Pcal Properties” section, this chapter; Fig. 11), because of a stroncrease in concentration of magnetic minerals within one meter.destruction of fine magnetic minerals has often been reported fortinental margin sediments characterized by high sedimentationand high organic matter content; the cause has been attributedagenetic change of magnetite with sulfate reduction (e.g., KarlinLevi, 1983; Canfield and Berner, 1987). Leslie et al. (1990) and Let al. (1992) demonstrated that dissolution of magnetic materiacurs in the deep basins of the California Borderland where the wdepths range between 500 and 1500 m. Our data suggest that diagenetic processes possibly occur in the Animal Basin at a dep2000 m, explaining the unclear magnetostratigraphy at Site 101
COMPOSITE DEPTHSAND SEDIMENTATION RATES
Multisensor track (MST) data, collected at 4- to 6-cm intervfrom Holes 1011A through 1011E, and color reflectance data,lected at 6-cm intervals from Holes 1011B and 1011C, were usdetermine depth offsets in the composite section. On the compdepth scale (expressed as mcd, meters composite depth), featthe plotted MST and color reflectance data present in adjacent
si-de-hen-
ate di-nddc-terilar of
sl- toites ofles
are aligned so that they occur at approximately the same deWorking from the top of the sedimentary sequence, a constant added to the mbsf (meters below seafloor) depth for each core in ehole to arrive at a mcd depth for that core. The depths offsets compose the composite depth section are given in Table 10 (alsoCD-ROM, back pocket, this volume). Continuity of the sedimentasequence was documented only for the upper 150 mcd. Below a150 mcd, the cores were placed into composite depth, but contincould not be verified.
Magnetic susceptibility was the primary parameter used for inthole correlation purposes. Color reflectance measurements GRAPE bulk density were used in a few intervals, particularly at tbottom of the section to provide additional support for composconstruction. Natural gamma-ray activity measurements were mthroughout the entire section at all holes, but the sampling intervof 12−15 cm were insufficient for interhole correlation.
The magnetic susceptibility, color reflectance, and GRAPE budensity records used to verify core overlap for Site 1011 are shoon a composite depth scale in Figures 12, 13, and 14, respectivThe cores from Holes 1011B and 1011C provide continuous overto about 150 mcd. The composite records suggest that up to 2 mmaterial is missing between cores in all holes down to about 150 mAs there are no data to fill possible core gaps below Cores 11011B-15H, 1011C-15H, and 1011E-15H, an assessment of corelength below about 150 mcd is not possible.
Following construction of the composite depth section for S1011, a single spliced record was assembled from the aligned co
103

SITE 1011
Table 9. Range of stratigraphically important radiolarians in Hole 1011C.
Note: P = present; more detailed abundance information not available. See “Explanatory Notes” chapter for other abbreviations.
Zone
Core, section, interval
Depth(mbsf) A
bund
ance
Pres
erva
tion
Acr
osph
aera
mur
raya
na
Act
inom
ma
popo
fski
i
Ant
hocy
rtid
ium
pli
ocen
ica
Bot
ryos
trob
us a
quil
onar
is
Bot
ryos
trob
us p
raet
umid
ulus
Bot
ryos
trob
us tu
mid
ulus
Dia
rtus
hug
hesi
Dic
tyop
him
us s
plen
dens
Euc
yrti
dium
cal
vert
ense
Euc
yrti
dium
ery
thro
mys
tax
Euc
yrti
dium
teus
cher
i
Gon
dwan
aria
his
ter
Lam
proc
ycla
s ju
noni
s
Lam
proc
yrti
s he
tero
poro
s
Lam
proc
yrti
s ne
ohet
erop
oros
Lar
cosp
ira
mos
chko
vski
i
Lit
heli
us s
p.
Pho
rmos
tich
oart
us c
orbu
la
Pho
rmos
tich
oart
us c
rust
ula
Stic
hoco
rys
delm
onte
nsis
Stic
hoco
rys
pere
grin
a
Styl
acon
tari
um a
cqui
loni
um
Styl
atra
ctus
uni
vers
us
Styl
odic
tya
vali
disp
ina
167-1011C-1H-CC 3.3 R P P P T T2H-CC 12.8 B3H-CC 22.3 B4H-CC 31.8 R P P P P
Unzoned 5H-CC 31.8 B6H-CC 50.8 B7H-CC 60.3 B8H-CC 69.8 B P9H-CC 79.3 R P P P P10H-CC 88.8 R P P P11H-CC 98.3 F M P P P P P P P
E. matuyamai/ 12H-CC 107.8 R PS. langii 13H-CC 117.3 C M P P P P
14H-CC 126.8 C M P P P P P15X-CC 136.3 R P
Unzoned 16X-CC 145.8 B17X-CC 155.5 B18X-CC 165.0 R P P P
S. peregrina 19X-CC 174.7 R P P P20X-CC 184.3 A G P P P P P P P P P P P P
a-wa-lfate
disso-re-
la-ity,o 35.tom-e bal-
Ms toease lim-.35ul- mM0 µM <10
singeasenga-es be-
luesen->170.o 40
bsf4.45
N2
N1
R1
R2
R3R4
D1
D2
D3
N3
N4N5
F1
F2
F3
D1 = LO of Denticulopsis spp.D2 = LCO of D. hustedtiiD3 = LO of D. dimorpha
R1 = Evolutionary transition L. neoheteroporos/L. nigriniae
R2 = Evolutionary transition S. delmontensis/S. peregrinaR3 = LO of D. hughesiR4 = LO of L. n. magnacornuta
F1 = LO of N. humerosaF2 = LO of N. asanoiF3 = FO of G. inflata
N1 = LO of P. lacunosaN2 = LO of D. brouweriN3 = LO of D. pentaradiatusN4 = LO of R. pseudoumbilicus / FO of C. acutusN5 = LO of D. quinqueramus/ berggreni
Age (Ma)
Dep
th (
mbs
f)
100
50
100
150
200
0
250
The Site 1011 splice (Table 11, also on CD-ROM, back pocket) canbe used as a sampling guide to recover a single sedimentary se-quence. The spliced record consists entirely of Hole 1011B and1011C cores. Hole 1011B was used as the backbone of the samplingsplice. The composite depths were aligned so that tie points betweenadjacent holes occurred at exactly the same depths in meters compos-ite depth. Intervals having significant disturbance or distortion wereavoided if possible.
A preliminary age model (Table 12) was constructed to estimatesedimentation rates (Fig. 15). The age model was applied to thespliced records of GRAPE, magnetic susceptibility, and color reflec-tance as shown in Figure 16.
Figure 8. Age/depth plot for Hole 1011B. FO = first occurrence, LO = lastoccurrence, LCO = last common occurrence.
104
INORGANIC GEOCHEMISTRY
We collected 13 interstitial water samples from Hole 1011B atdepths ranging from 4.45 to 247.25 mbsf. Interstitial water samplesare from lithostratigraphic Units I through III (see “Lithostratigrphy” section, this chapter). Chemical gradients in the interstitial ters at this site (Table 13) reflect organic matter diagenesis via sureduction, an increase in dissolved sulfate at greater depth, the lution of biogenic opal, and the influence of authigenic mineral pcipitation.
Chlorinity increases by >2% from 4.45 to 12.85 mbsf, with retively constant values after this initial increase (Fig. 17). Salinmeasured refractively as total dissolved solids, ranges from 32 tSodium concentrations measured by flame emission spectrophoetry were on average <4% higher than those estimated by chargance (Table 13).
Alkalinity increases from 8.3 mM at 4.45 mbsf to values >20 mfrom 30 to 90 m (lithostratigraphic Subunit IIA), then decrease5.0 mM at 247.25 mbsf (Fig. 17). Sulfate concentrations decrrapidly in the uppermost sediments to values below the detectionit (approximately 1 mM) by 41.35 mbsf and persisting to 136mbsf, with maximum alkalinity values in the depth zone of this sfate minimum. Sulfate concentrations then increase again to 23.5at 247.25 mbsf. Phosphate concentrations reach a maximum >4from 10 to 60 m, then decrease with increasing depth to valuesµM by 150 m. Ammonium concentrations increase with increadepth to plateau values >2500 µM from 50 to 150 m, then decrwith increasing depth to 974 µM at 247.25 mbsf. Dissolved manese concentrations decrease from 16.5 µM at 4.45 mbsf to valulow the detection limit (<5 µM) at 31.85 mbsf (Table 13).
Dissolved silicate concentrations increase with depth to va>1000 µM by 100 m (Fig. 17), indicative of the dissolution of biogic opal. Strontium concentrations increase to a broad maximum µM from 50 to 110 m, then decrease to 105 µM at 247.25 mbsf
Calcium concentrations decrease to values <4 mM from 30 tm, then increase with increasing depth to 16.5 mM at 247.25 m(Fig. 17). Magnesium concentrations decrease from 50.0 mM at

SITE 1011
1
con-ral-
onsmis-
inelytion andation Ataxi- zero
igherec-ane
sig-
ro-M,
e oc-
ub-snits
ilsIIA,li-
167-1011B-3H-5, 94–96 cm
0
2.5 5
1020 mT
S NW, up
E, down
Div. = 2.0e–7 J0 = 1.4e–6
167-1011B-4H-3, 19–21 cm
0
2.5
5
S N
10 mT
Div. = 2.0e–7 J0 = 1.0e–6
W, up
E, down
mbsf to 31.6 mM at 136.35 mbsf, then increase to 44.9 mM at 247.25mbsf. The decrease in dissolved calcium in the upper sediment is co-incident with the sulfate decrease and the alkalinity increase from sul-fate reduction. This, combined with the nonlinear relationship of cal-cium and magnesium, suggests that authigenic mineral precipitationmay be significant in influencing these profiles. Lithium concentra-tions increase to a broad maximum around 100 µM from 110 to
Figure 9. Plots of magnetic intensity and inclination of cores from Hole1011B. Small and large dots represent magnetic intensity and inclinationbefore and after AF demagnetization at 20 mT, respectively.
0
50
100
150
0.1 1 10 100 1000
Dep
th (
mbs
f)
Intensity (mA/m)–90 0 90
Inclination (°)Hole 1011B
Figure 10. Orthogonal vector projection (left) and equal-area projection(right) of AF demagnetization of two discrete samples of normal polarity.The intensity of magnetization decreases rapidly when a 10 mT AF isapplied. Jo is the magnetization before AF treatment.
0
5
10
0 20 40 60
Hole 1011B
Dep
th (
mbs
f)
Susceptibility (µSI)
0.1 1 10 100 1000
Hole 1011BMagnetic intensity
(mA/m)0.1 1 10 100 1000
Hole 1011CMagnetic intensity
(mA/m)
60
m, then decrease to 39 µM at 247.25 mbsf (Fig. 17). Potassium centrations increase slightly to 13.1 mM at 31.85 mbsf, then genely decrease with increasing depth.
ORGANIC GEOCHEMISTRY
We measured elemental compositions and volatile hydrocarbof sediments from Site 1011 (for methods see “Organic Geochetry” section, “Explanatory Notes” chapter, this volume).
Volatile Hydrocarbons
Concentrations of methane, ethane, and propane were routmonitored at Hole 1011B according to shipboard safety and polluprevention considerations. The results are displayed in Figure 18Table 14. Between 0 and 41 mbsf headspace methane concentris near the detection limit of the HP 5890 gas chromatograph.about 41 mbsf the concentration increases rapidly, reaching a mmum value of 6347 ppm at 89 mbsf, and decreases again to nearat about 150 mbsf. One single sample at 190 mbsf displayed a hconcentration (2505 ppm). No significant amounts of higher molular weight hydrocarbons were observed, indicating that the methwas derived from biogenic organic matter degradation and is notnificant for safety and pollution investigations.
Elemental Analysis
The concentrations of inorganic carbon, total carbon, total nitgen, and total sulfur are presented in Table 15 (also on CD-ROback pocket) and Figure 19.
The percentage of calcium carbonate (CaCO3) was calculated fromthe inorganic carbon concentrations by assuming that all carbonatcurs in the form of calcite. The concentration of CaCO3 varies between0 and 60 wt% and depends on lithology. Lithostratigraphy Unit I, Sunits IIIA and IIIB, and Unit IV (see “Lithostratigraphy” section, thichapter) generally show low carbonate concentrations, while SubuIIA and IIB are characterized by higher values. High CaCO3 contentsof Subunit IIA coincide with abundant well-preserved nannofoss(see “Biostratigraphy” section, this chapter). Compared to Subunit CaCO3 contents are lower in Subunit IIB and display a higher amp
Figure 11. Comparison of the intensity of magnetization before (open circles)and after AF demagnetization (solid symbols) in the upper 10 mbsf of Holes1011B and 1011C. Magnetic susceptibility (left) shows a similar depthdependence to magnetic intensity, dropping sharply between 1.5 and 2.5mbsf.
105

SITE 1011
106
tude varialution, as “Biostrati
Organ t tsedimen 2wt% (Ta cuVariation v
gh-nate thedi-car-
.395).is-ap-
ter-TNnic88).
tion. This is probably the result of increased carbonate disso-indicated by strongly corroded calcareous microfossils (seegraphy” section, this chapter).ic carbon concentrations are generally high throughou
t column, varying with high amplitude between 0.5 andble 15; Fig. 19). Some single spikes of up to 6 wt% oc of organic carbon occurs on a meter scale which is also
Table 10. Site 1011 composite depth section.
Note: This table is also on CD-ROM, back pocket, this volume.
Core, sectionDepth(mbsf)
Offset(m)
Depth(mcd)
167-1011A-1H-1 1.9 –0.34 1.56
167-1011B-1H-1 0 0 02H-1 8.4 0.53 8.933H-1 17.9 3.24 21.144H-1 27.4 4.04 31.445H-1 36.9 4.58 41.486H-1 46.4 5.28 51.687H-1 55.9 6.52 62.428H-1 65.4 6.32 71.729H-1 74.9 6.22 81.1210H-1 84.4 6.92 91.3211H-1 93.9 7.04 100.9412H-1 103.4 8.24 111.6413H-1 112.9 8.96 121.8614H-1 122.4 10.3 132.715H-1 131.9 10.94 142.8416X-1 137.9 10.94 148.8417X-1 146.5 10.56 157.0618X-1 156.2 10.56 166.7619X-1 165.7 12.12 177.8220X-1 175.4 14.44 189.8421X-1 185 14.44 199.4422X-1 194.6 14.44 209.0423X-1 204.3 14.44 218.7424X-1 213.9 14.44 228.3425X-1 223.5 14.44 237.9426X-1 233.2 14.44 247.6427X-1 242.8 14.44 257.2428X-1 252.4 14.44 266.84
167-1011C-1H-1 0 0 02H-1 3.3 –0.07 3.233H-1 12.8 0.6 13.44H-1 22.3 2.43 24.735H-1 31.8 3.76 35.566H-1 41.3 4.13 45.437H-1 50.8 5.7 56.58H-1 60.3 6.84 67.149H-1 69.8 7.76 77.5610H-1 79.3 8.1 87.411H-1 88.8 9.06 97.8612H-1 98.3 9.98 108.2813H-1 107.8 10.9 118.714H-1 117.3 11.26 128.5615H-1 126.8 12.72 139.5216X-1 136.3 12.42 148.7217X-1 145.8 12.52 158.3218X-1 155.5 12.56 168.0619X-1 165 12.46 177.4620X-1 174.7 12.5 187.2
167-1011D-1H-1 0 0.15 0.152H-1 7.4 0.61 8.01
167-1011E-1H-1 0 0.15 0.152H-1 5.2 0.33 5.533H-1 14.7 1.8 16.54H-1 24.2 2.13 26.335H-1 33.7 3.22 36.926H-1 43.2 3.42 46.627H-1 52.7 4.31 57.018H-1 62.2 4.76 66.969H-1 71.7 4.89 76.5910H-1 81.2 4.3 85.511H-1 90.7 5.3 9612H-1 100.2 6.17 106.3713H-1 109.7 6.59 116.2914H-1 119.2 7.61 126.8115H-1 128.7 9.06 137.7616H-1 138.13 10.72 148.85
0 40 800
20
40
60
80
100
Magnetic susceptibility
(10– 6 SI)
Dep
th (
mcd
)
A
BC
E
D
10 40 70100
120
140
160
180
200
Magnetic susceptibility
(10– 6 SI)
B C E
he.5r.is-
ible in the color of the sediment. Dark greenish intervals display hier organic carbon contents, whereas lighter intervals are carborich and organic-carbon lean. Further detailed investigations onquality of the organic matter will shed light on whether these sementary cycles correlate changes in the composition of organic bon.
Total nitrogen values at Site 1011 vary between 0.04 and 0wt%. Total sulfur content ranges from 0 to about 3.5 wt% (Table 1The majority of sulfur occurs as authigenic pyrite, which is finely dseminated in the sediment (see “Lithostratigraphy” section, this chter).
Total organic carbon/total nitrogen ratios were used to characize the type of organic matter in the sediments. Most of the TOC/values are below 12, indicating a predominance of marine orgamatter (Figs. 19, 20; Bordovskiy, 1965; Emerson and Hedges, 19
Figure 12. Smoothed (30-cm Gaussian) magnetic susceptibility data for theupper 200 m from Site 1011 on the mcd scale. Holes 1011A through 1011Eare offset from each other by a constant (10 × 10−6 SI).

SITE 1011
e). the
5 2 0 350
20
40
60
80
100
Reflectance (% 650–700 nm)
Dep
th (
mcd
)B C
5 20 35100
120
140
160
180
200
Reflectance (% 650–700 nm)
B C
A positive correlation between total organic carbon and TOC/TN ra-tio (Fig. 21) indicates that episodic supply of terrigenous organicmatter likely resulted in enhanced TOC values. Estimates of theamounts of marine and terrestrial organic carbon still have to be con-firmed by shore-based elemental and microscope analyses.
PHYSICAL PROPERTIES
Multisensor Track Measurements
The shipboard physical properties program at Site 1011 includednondestructive measurements of GRAPE bulk density, magnetic sus-ceptibility, P-wave velocity, and natural gamma-ray activity onwhole sections of all cores using the MST (Fig. 22). Magnetic sus-ceptibility was measured at 2-cm intervals at low sensitivity (1-smeasuring time). GRAPE and PWL measurements were measured at
Figure 13. Smoothed (30-cm Gaussian) color reflectance (% 650−700 nmband) data for the upper 200 m from Site 1011 on the mcd scale. Holes1011B and 1011C are offset from each other by a constant (10%).
1.6 2 2.40
20
40
60
80
100
GRAPE bulk density
(g/cm3 )
Dep
th (
mcd
)
A
B
C
D E
B C E
1.6 2 2.4100
120
140
160
180
200
GRAPE bulk density
(g/cm3 )
BC
E
BC
2-cm intervals for bulk density and velocity, respectively. Naturalgamma-ray activity was measured with a 10-s count every 12 cm.
Index Properties
Index properties measurements were made, on average, at onesample per working section in all cores of Hole 1011B and one sam-ple every 10 cm in Core 167-1011E-13H for a high-resolution cali-bration study of shipboard porosity with the downhole logging data.Samples usually were taken at intervals where color reflectivity mea-surements were made and where samples were collected for calciumcarbonate analysis with the objective of determining mass accumula-tion rates. Index properties were determined by the gravimetric meth-od using Method C (see “Explanatory Notes” chapter, this volumIndex property data are presented in Table 16 on CD-ROM in
Figure 14. Smoothed (30-cm Gaussian) GRAPE data for the upper 200 mfrom Site 1011 on the mcd scale. Holes 1011A through 1011E are offset fromeach other by a constant (0.1 g/cm3).
107
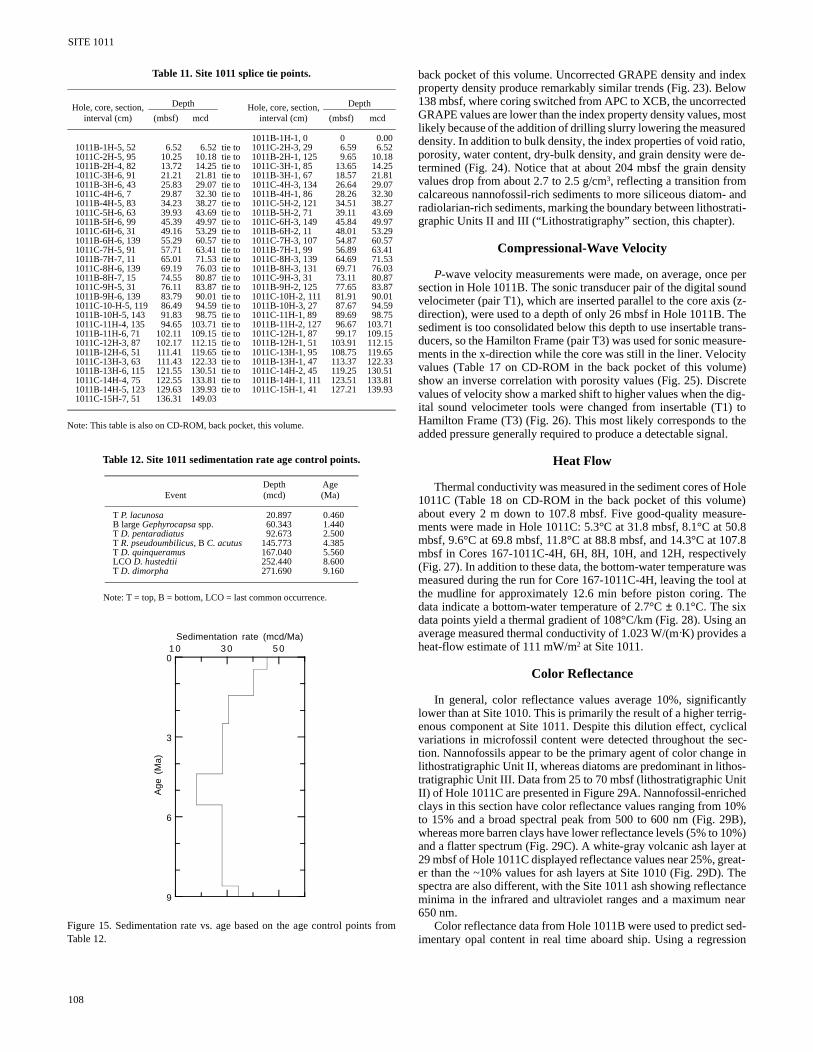
SITE 1011
perund (z-heans-ure-
itye)eteig-
) tohel.
olee)re-0.87.8
ely wasl athe
an
ntlyig-icalec-e ins-ited0%B),0%)r ateat-Thence
ear
ed-sion
Table 11. Site 1011 splice tie points.
Note: This table is also on CD-ROM, back pocket, this volume.
Hole, core, section, interval (cm)
Depth Hole, core, section, interval (cm)
Depth
(mbsf) mcd (mbsf) mcd
1011B-1H-1, 0 0 0.001011B-1H-5, 52 6.52 6.52 tie to 1011C-2H-3, 29 6.59 6.521011C-2H-5, 95 10.25 10.18 tie to 1011B-2H-1, 125 9.65 10.181011B-2H-4, 82 13.72 14.25 tie to 1011C-3H-1, 85 13.65 14.251011C-3H-6, 91 21.21 21.81 tie to 1011B-3H-1, 67 18.57 21.811011B-3H-6, 43 25.83 29.07 tie to 1011C-4H-3, 134 26.64 29.071011C-4H-6, 7 29.87 32.30 tie to 1011B-4H-1, 86 28.26 32.301011B-4H-5, 83 34.23 38.27 tie to 1011C-5H-2, 121 34.51 38.271011C-5H-6, 63 39.93 43.69 tie to 1011B-5H-2, 71 39.11 43.691011B-5H-6, 99 45.39 49.97 tie to 1011C-6H-3, 149 45.84 49.971011C-6H-6, 31 49.16 53.29 tie to 1011B-6H-2, 11 48.01 53.291011B-6H-6, 139 55.29 60.57 tie to 1011C-7H-3, 107 54.87 60.571011C-7H-5, 91 57.71 63.41 tie to 1011B-7H-1, 99 56.89 63.411011B-7H-7, 11 65.01 71.53 tie to 1011C-8H-3, 139 64.69 71.531011C-8H-6, 139 69.19 76.03 tie to 1011B-8H-3, 131 69.71 76.031011B-8H-7, 15 74.55 80.87 tie to 1011C-9H-3, 31 73.11 80.871011C-9H-5, 31 76.11 83.87 tie to 1011B-9H-2, 125 77.65 83.871011B-9H-6, 139 83.79 90.01 tie to 1011C-10H-2, 111 81.91 90.011011C-10-H-5, 119 86.49 94.59 tie to 1011B-10H-3, 27 87.67 94.591011B-10H-5, 143 91.83 98.75 tie to 1011C-11H-1, 89 89.69 98.751011C-11H-4, 135 94.65 103.71 tie to 1011B-11H-2, 127 96.67 103.711011B-11H-6, 71 102.11 109.15 tie to 1011C-12H-1, 87 99.17 109.151011C-12H-3, 87 102.17 112.15 tie to 1011B-12H-1, 51 103.91 112.151011B-12H-6, 51 111.41 119.65 tie to 1011C-13H-1, 95 108.75 119.651011C-13H-3, 63 111.43 122.33 tie to 1011B-13H-1, 47 113.37 122.331011B-13H-6, 115 121.55 130.51 tie to 1011C-14H-2, 45 119.25 130.511011C-14H-4, 75 122.55 133.81 tie to 1011B-14H-1, 111 123.51 133.811011B-14H-5, 123 129.63 139.93 tie to 1011C-15H-1, 41 127.21 139.931011C-15H-7, 51 136.31 149.03
Table 12. Site 1011 sedimentation rate age control points.
Note: T = top, B = bottom, LCO = last common occurrence.
EventDepth(mcd)
Age(Ma)
T P. lacunosa 20.897 0.460B large Gephyrocapsa spp. 60.343 1.440T D. pentaradiatus 92.673 2.500T R. pseudoumbilicus, B C. acutus 145.773 4.385T D. quinqueramus 167.040 5.560LCO D. hustedtii 252.440 8.600T D. dimorpha 271.690 9.160
Figure 15. Sedimentation rate vs. age based on the age control points fromTable 12.
10 30 500
3
6
9
Sedimentation rate (mcd/Ma)
Age
(M
a)
108
back pocket of this volume. Uncorrected GRAPE density and indexproperty density produce remarkably similar trends (Fig. 23). Below138 mbsf, where coring switched from APC to XCB, the uncorrectedGRAPE values are lower than the index property density values, mostlikely because of the addition of drilling slurry lowering the measureddensity. In addition to bulk density, the index properties of void ratio,porosity, water content, dry-bulk density, and grain density were de-termined (Fig. 24). Notice that at about 204 mbsf the grain densityvalues drop from about 2.7 to 2.5 g/cm3, reflecting a transition fromcalcareous nannofossil-rich sediments to more siliceous diatom- andradiolarian-rich sediments, marking the boundary between lithostrati-graphic Units II and III (“Lithostratigraphy” section, this chapter).
Compressional-Wave Velocity
P-wave velocity measurements were made, on average, oncesection in Hole 1011B. The sonic transducer pair of the digital sovelocimeter (pair T1), which are inserted parallel to the core axisdirection), were used to a depth of only 26 mbsf in Hole 1011B. Tsediment is too consolidated below this depth to use insertable trducers, so the Hamilton Frame (pair T3) was used for sonic measments in the x-direction while the core was still in the liner. Velocvalues (Table 17 on CD-ROM in the back pocket of this volumshow an inverse correlation with porosity values (Fig. 25). Discrvalues of velocity show a marked shift to higher values when the dital sound velocimeter tools were changed from insertable (T1Hamilton Frame (T3) (Fig. 26). This most likely corresponds to tadded pressure generally required to produce a detectable signa
Heat Flow
Thermal conductivity was measured in the sediment cores of H1011C (Table 18 on CD-ROM in the back pocket of this volumabout every 2 m down to 107.8 mbsf. Five good-quality measuments were made in Hole 1011C: 5.3°C at 31.8 mbsf, 8.1°C at 5mbsf, 9.6°C at 69.8 mbsf, 11.8°C at 88.8 mbsf, and 14.3°C at 10mbsf in Cores 167-1011C-4H, 6H, 8H, 10H, and 12H, respectiv(Fig. 27). In addition to these data, the bottom-water temperaturemeasured during the run for Core 167-1011C-4H, leaving the toothe mudline for approximately 12.6 min before piston coring. Tdata indicate a bottom-water temperature of 2.7°C ± 0.1°C. The sixdata points yield a thermal gradient of 108°C/km (Fig. 28). Usingaverage measured thermal conductivity of 1.023 W/(m·K) provides aheat-flow estimate of 111 mW/m2 at Site 1011.
Color Reflectance
In general, color reflectance values average 10%, significalower than at Site 1010. This is primarily the result of a higher terrenous component at Site 1011. Despite this dilution effect, cyclvariations in microfossil content were detected throughout the stion. Nannofossils appear to be the primary agent of color changlithostratigraphic Unit II, whereas diatoms are predominant in lithotratigraphic Unit III. Data from 25 to 70 mbsf (lithostratigraphic UnII) of Hole 1011C are presented in Figure 29A. Nannofossil-enrichclays in this section have color reflectance values ranging from 1to 15% and a broad spectral peak from 500 to 600 nm (Fig. 29whereas more barren clays have lower reflectance levels (5% to 1and a flatter spectrum (Fig. 29C). A white-gray volcanic ash laye29 mbsf of Hole 1011C displayed reflectance values near 25%, grer than the ~10% values for ash layers at Site 1010 (Fig. 29D). spectra are also different, with the Site 1011 ash showing reflectaminima in the infrared and ultraviolet ranges and a maximum n650 nm.
Color reflectance data from Hole 1011B were used to predict simentary opal content in real time aboard ship. Using a regres

SITE 1011
0 1 0 2 00
1
2
3
4
5
Reflectance
(% 650–700 nm)
Age
(M
a)
0 15 30
Magnetic susceptibility
(10– 6 SI)
1.5 1.7 1.9
GRAPE bulk density
(g/cm3 )
Figure 16. Spliced records of color reflectance, magnetic susceptibility, and GRAPE bulk density vs. age based on age control points from Table 12.
tion
tion andf the
99
equation generated from the Leg 167 site-survey reflectance and opaldata, we were able to simulate the major lithostratigraphic units iden-tified at Site 1011. Low opal content coincides with lithostratigraphicUnits I and II, which include silty clay and nannofossil ooze andchalk (Fig. 30A). Peaks and lows in opal in lithostratigraphic Unit IIIcorrespond to interbedded diatomite and clay, respectively. Opal lev-els are low in the siltstone, silty clay, and sandstone of lithostrati-graphic Unit IV. The highest predicted opal content at Site 1011(from 245 to 255 mbsf) matches the portion of lithostratigraphic UnitIII classified as a diatomite (Fig. 30B). Preliminary results indicatethat opal-rich sediments display a unique reflectance spectrum, withan absorbence peak near 650 nm and a steep positive slope in the redto infrared range (Fig. 30C). In contrast, sediments with low predict-ed opal content display a much flatter spectrum (Fig. 30D). Figure 30is qualitatively similar in shape, although not in absolute brightness,to the reflectance spectra of siliceous sediments at Leg 138 sites in theeastern equatorial Pacific (Mayer, Pisias, Janecek, et al., 1992).
Digital Color Video
Images from the ODP color digital imaging system at Holes1011B, 1011C, and 1011E were taken over 20-cm intervals to pro-vide a 0.25-mm pixel. The intensity of colors CIELAB L*, a*, and b*(“Explanatory Notes” chapter, this volume) shows a good correlabetween Holes 1011B and 1011C (Fig. 31).
DOWNHOLE MEASUREMENTS
Logging Operations and Log Quality
Hole 1011B was logged with the density-porosity combinaand sonic-FMS tool strings after the hole was flushed of debristhe drill pipe was set at 77 mbsf (Table 19). Two full passes odensity-porosity combination tool string (pass 1: 80−277 mbsf; pass2: 96−278 mbsf) and one full pass of the sonic-FMS tool string (−
109

SITE 1011
3811276587719
3811276587719
Table 13. Interstitial water geochemical data, Hole 1011B.
Core, section,interval (cm)
Depth(mbsf) pH
Alkalinity(mM) Salinity
Cl−
(mM)Na+
(mM)SO4
2−
(mM)HPO4
2−
(µM)NH4
+
(µM)H4SiO4
(µM)Mn2+
(µM)Ca2+
(mM)Mg2+
(mM)Sr2+
(µM)Li+
(µM)K+
(mM)
167-1011B-1H-3, 140–145 4.45 7.64 8.28 35.0 549 475 23.2 37 472 494 16.5 8.87 50.0 80 27 11.2H-3, 145–150 12.85 7.70 14.0 34.0 561 486 14.9 41 1148 500 7.0 6.14 47.3 88 33 11.3H-3, 145–150 22.35 7.72 17.7 34.0 563 488 8.0 49 1664 646 5.5 4.67 43.9 103 36 12.4H-3, 145–150 31.85 7.72 19.5 32.5 560 485 4.2 49 1933 678 <5 3.96 41.0 121 39 13.5H-3, 145–150 41.35 7.72 20.1 32.0 561 486 <1 45 2209 791 <5 3.36 38.4 144 43 11.6H-3, 145–150 50.85 7.64 21.6 32.0 559 485 <1 47 2471 823 <5 4.16 37.7 174 51 11.9H-3, 145–150 79.35 7.36 22.6 32.0 559 488 <1 30 2842 840 <5 5.93 35.7 191 74 10.12H-3, 145–150 107.85 7.30 19.2 32.0 556 485 <1 20 2587 1028 <5 6.61 33.6 174 98 9.15H-3, 145–150 136.35 7.26 14.9 32.0 558 486 <1 11 2616 918 <5 7.18 31.6 155 10 9.18X-3, 145–150 160.65 7.34 11.3 32.0 560 488 6.6 6 2195 1103 <5 9.15 34.8 144 99 8.21X-3, 145–150 189.45 7.24 8.62 33.0 556 487 16.1 5 1890 1216 <5 12.0 38.7 128 73 8.24X-3, 145–150 218.35 7.49 6.95 34.0 557 480 19.5 3 1345 1367 <5 14.8 42.9 113 54 8.27X-3, 145–150 247.25 7.41 5.05 34.5 559 478 23.5 2 974 1457 <5 16.5 44.9 105 39 9.
ig eanete
te aa
t ad- iithindloune FM-
siseefl
ae
tsd
e wa-ting
po-withn the
gam-ble
be-scaleata,nsionen-a rayheppar-t bulk
nat- forti-ata ishlyarate
the Cal-asinareav-r ob-ticents
imentd to foror athy.areh thel unit
282 mbsf) were conducted. The wireline heave compensator wasused on all passes although seas were calm.
Borehole caliper measurements conducted during the density-po-rosity combination and sonic-FMS passes indicate that the boreholewas nearly at drill-bit diameter (12−13 in.; Fig. 32) with few wash-outs. Overall log quality at this site was very good with the exceptionof the sonic velocity log, which was unable to measure formation ve-locities because of the unusually high porosity of the sediments andconsequent low-impedance contrast with respect to the borehole fluid(seawater). Shipboard processing of the sonic waveform data to ex-tract formation compressional wave velocities was also unsuccessful.Sonic velocity data from this hole are therefore considered unreli-able.
The TLT was run during both passes of the density-porosity com-bination tool string. The temperature logs were linked to the actuallogging depths using the time-depth log recorded at the logging unit.The TLT results show a downhole thermal gradient of 31°C/km (F33), although this is an underestimate resulting from the coolingfect of open-hole circulation during drilling. In situ temperature mesurements using the Adara probe indicate a thermal gradient 108°C/km at this site (see “Physical Properties” section, this chap
Lithology
The lithologic succession recovered at Hole 1011B is characized by large shifts in sediment composition and compaction thatreflected clearly in the log physical property measurements. In pticular, the increased lithification and reduced carbonate contensociated with the lithostratigraphic Subunit IIA/Subunit IIB bounary near 130 mbsf (Fig. 32) is identified in the log data as a sharpcrease in bulk density and resistivity and a reduction in porosSimilarly, the sharply increased diatom content of lithostratigrapSubunit IIIA is reflected by a reduction of density and resistivity aan increased porosity below 200 mbsf. Although the velocity measurements are not reliable at this site, these two lithologic boaries must have strong seismic impedance signatures. Fine-scalm) interbedding is apparent in the SFL data and the processed imagery in the portions of lithostratigraphic Subunit IIIA with a higher sedimentation rate (200−260 mbsf).
Comparison of Core and Log Physical Property Data
The core and log measurements of sediment bulk density are ilar over their common interval, whereas the core porosity data (“Physical Properties” section, this chapter) are significantly lowthan the log (neutron) measurements (Fig. 34). The log porosity (ntron) data are significantly higher because the data reflect the inence of molecularly bound water associated with abundant clayopal in Hole 1011B sediments, which contribute additional apparporosity in the log porosity measurement. Density measurementhe litho-density logging tool (HLDT) can be used to estimate se
110
.f--ar
r).
r-rer-s-
n-y.c
gd-(~1S
m-eeru-u-ndnt ofi-
ment porosity as well, using the assumption that pore spaces arter filled. Because this tool uses a different method for investigaformation density (gamma-ray emission from a 137Cs source), it pro-vides an alternative method to evaluate porosity. The log neutronrosity and litho-density porosity measurements are compared the core porosity data in Figure 35. Note the closer match betweelog litho-density porosity measurements and core porosity data.
Comparison of Core and Log Data
Core MST measurements and log measurements of natural ma ray and bulk density shown in Figure 36 exhibit comparalarge-scale variability, although fine-scale (<1 m) correlation tween the core and log data sets is difficult because of the fine-nature of the bedding cycles, lower vertical resolution of the log dand core disturbance resulting from gas expansion. Gas expaand XCB coring disturbance particularly affected the volume-depdent MST core measurements of bulk density and natural gammactivity. The switch from APC to XCB coring (~138 mbsf) and tconsequent development of sediment slurry in core liners are aent as a sharp decrease in the GRAPE measurement of sedimendensity (Fig. 36).
A more detailed comparison of core and log measurements ofural gamma-ray activity and bulk density is shown in Figure 37the 180−200 mbsf interval in Hole 1011B, spanning the lithostragraphic Subunit IIC/Subunit IIIA boundary. The core and log dshow similar large-scale variability, but finer scale correlationmore difficult to establish. Significantly, the log data appear higrepeatable both in absolute depth and value between the two seppasses.
SUMMARY
Site 1011, in the Animal Basin of the California Borderland, is shoreward site of the Baja Transect located 85 km west of Bajaifornia. Although the water depth at this site is 2033 mbsl, the bsill depth is ~1600 mbsl. The bottom waters within Animal Basin relatively pristine intermediate waters from offshore that have treled only a short distance from the open ocean. We achieved oujective to drill the entire 276-m-thick sediment column to acousbasement, which turned out to be basalt (Fig. 38). Oldest sedimare upper Miocene sandstones with an age of ~9.3 Ma. The sedcolumn was triple cored to 142 mbsf (~4.4 Ma), and double core184 mbsf (~6.7 Ma). A continuous section could only be verifiedthe triple-cored section. Paleomagnetic measurements are poSite 1011, and the only time control is provided by biostratigrapDistinctive features to note within the lithostratigraphic column the basalt basement, which may reflect volcanism associated witformation of the borderland basins, the terrigenous clastic basa

SITE 1011
100 20Alkalinity (mM)
1000 200Sr2+ (µM)
0 20SO4
2– (mM)
0 20Ca2+ and Mg2+ (mM)
40
0 30 60HPO4
2– (µM)
0 60Li+ (µM)
120
0 1500 3000NH4+ (mM)
560540 580Cl– (mM)
8000 1600H4SiO4 (µM)
0
100
200
Dep
th (
mbs
f)D
epth
(m
bsf)
0
100
200
Figure 17. Interstitial water geochemical data, Site1011. Solid circles = Ca, open circles = Mg.
IV
IIIA
IIA
IIB
I0
100
200
C1 (ppm)
Dep
th (
mbs
f)
0 5000Lith.unit
IIIB
older than 8.5 Ma, the abrupt change from diatomaceous to calcare-ous sediments at about 7.5 Ma (~2 m.y. older than at Site 1010), andthe abrupt drop in calcium carbonate burial younger than the Mio-cene/Pliocene boundary (~4.6 Ma, lithostratigraphic Unit IIB/UnitIIC transition). The Unit IIB/Unit IIC transition appears seismicallyas the boundary between the acoustically transparent sedimentsabove and the more distinctively layered sediments below (Fig. 38).High calcium carbonate content returns between 3.8 and 1.0 Ma, but
Figure 18. Concentration of methane (C1) vs. depth (mbsf) obtained by theheadspace technique from Holes 1011A and 1011B.
Table 14. Concentrations of methane (C1) and ethane/ethylene (C2)obtained by the headspace technique from Holes 1011A and 1011B.
Core, section,interval (cm)
Depth(mbsf)
C1(ppm)
C2(ppm) C1/C2
167-1011A-1H-4, 0–5 6.425 3
167-1011B-1H-4, 0–5 4.525 42H-4, 0–5 12.925 63H-4, 0–5 22.425 54H-4, 0–5 31.925 115H-4, 0–5 41.425 496H-4, 0–5 50.925 4247H-4, 0–5 60.425 15058H-4, 0–5 69.925 32699H-4, 0–5 79.425 285710H-4, 0–5 88.925 634711H-4, 0–5 98.425 433412H-4, 0–5 107.93 222613H-4, 0–5 117.43 295414H-4, 0–5 126.93 145215H-4, 0–5 136.43 29816X-4, 0–5 142.43 2717X-4, 0–5 151.03 1118X-4, 0–5 160.73 619X-4, 0–5 170.23 720X-4, 0–5 179.93 421X-4, 0–5 189.53 2505 6 43922X-4, 0–5 199.13 8823X-4, 0–5 208.83 824X-4, 0–5 218.43 6 1 625X-4, 0–5 228.03 726X-4, 0–5 237.73 727X-4, 0–5 247.33 628X-4, 0–5 256.93 5
111

SITE 1011
Table 15. Depth variations in concentration of inorganic carbon, calcium carbonate, total carbon, total organic carbon, total nitrogen, and total sulfurin weight percent (wt%) in Hole 1011B.
Only part of this table is produced here. The entire table is on CD-ROM, back pocket, this volume.
Core, section, interval (cm)
Depth (mbsf)
Inorganic carbon (wt%)
CaCO3 (wt%)
Total carbon (wt%)
Totalorganic carbon (wt%)
Total nitrogen (wt%)
Totalsulfur (wt%)
Total organic carbon/
total nitrogen
Total organic carbon/
totalsulfur
167-1011B-1H-1, 29–30 0.29 2.00 16.7 3.54 1.54 0.18 0.37 8.6 4.21H-2, 29–30 1.79 0.71 5.9 2.19 1.48 0.17 0.46 8.7 3.21H-3, 29–30 3.34 0.77 6.4 2.26 1.49 0.17 0.38 8.8 3.91H-4, 29–30 4.79 0.13 1.1 2.38 2.25 0.25 0.59 9.0 3.81H-5, 29–30 6.29 0.55 4.6 1.81 1.26 0.16 0.31 7.9 4.11H-6, 29–30 7.79 2.11 17.6 3.10 0.99 0.11 1.53 9.0 0.62H-2, 30–31 10.20 0.18 1.5 1.82 1.64 0.18 0.40 9.1 4.12H-3, 30–31 11.70 1.40 11.7 2.31 0.91 0.10 0.17 9.1 5.42H-4, 30–31 13.20 0.37 3.1 1.83 1.46 0.17 0.53 8.6 2.82H-5, 30–31 14.70 1.00 8.3 1.95 0.95 0.11 0.18 8.6 5.3
ce
t 8
enh.
-
r-
-
-
the subsequent upper Pleistocene sediment is very clay-rich and mi-crofossil-poor.
REFERENCES
Akiba, F., 1986. Middle Miocene to Quaternary diatom biostratigraphy in theNankai trough and Japan trench, and modified lower Miocene throughQuaternary diatom zones for middle-to-high latitudes of the NorthPacific. In Kagami, H., Karig, D.E., Coulbourn, W.T., et al., Init. Repts.DSDP, 87: Washington (U.S. Govt. Printing Office), 393−481.
Barron, J.A., 1992. Neogene diatom datum levels in the equatorial and NorthPacific. In Ishizaki, K., and Saito, T. (Eds.), The Centenary of JapaneseMicropaleontology: Tokyo (Terra Sci. Publ.), 413−425.
Bordovskiy, O.K., 1965. Accumulation and transformation of organic sub-stances in marine sediment, 2. Sources of organic matter in marinebasins. Mar. Geol., 3:5−31.
Canfield, D.E., and Berner, R.A., 1987. Dissolution and pyritization of mag-netite in anoxic marine sediments. Geochim. Cosmochim. Acta, 51:645−659.
Emerson, S., and Hedges, J.I., 1988. Processes controlling the organic carboncontent of open ocean sediments. Paleoceanography, 3:621−634.
Ingle, J.C., Jr., 1981. Origin of Neogene diatomites around the north Pacificrim. In Garrison, R.E, Douglas, R., Pisciotto, K., Isaacs, C., and Ingle,J.C. (Eds.), The Monterey Formation and Related Siliceous Rocks of Cal-ifornia. Spec. Publ.— Soc. Econ. Paleontol. Mineral., 15:159−179.
Karlin, R., and Levi, S., 1983. Diagenesis of magnetic minerals in rehemipelagic sediments. Nature, 303:327−330.
Koizumi, I., and Tanimura, Y., 1985. Neogene diatom biostratigraphy ofmiddle latitude western North Pacific, Deep Sea Drilling Project LegIn Heath, G.R., Burckle, L.H., et al., Init. Repts. DSDP, 86: Washington(U.S. Govt. Printing Office), 269−300.
Leslie, B.W., Lund S.P., and Hammond, D.E., 1990. Rock magnetic evidfor the dissolution and authigenic growth of magnetic minerals witanoxic marine sediments of the California continental borderlandJ.Geophys. Res., 95:4437−4452.
112
nt
he6.
cein
Lonsdale, P., 1991. Structural patterns of the Pacific floor offshore of Peninsular California. In Dauphin, J.P., and Simoneit, B.R.T. (Eds.), The Gulfand Peninsular Province of the Californias. Amer. Assoc. Petrol. Geol.Memoir 47, 87−125.
Lund, S.P., Gorsline, D.S., and Henyey, T.L., 1992. Rock magnetic characteistics of surficial marine sediments from the California Continental Bor-derland. Earth Planet. Sci. Lett., 108:93−107.
Lyle, M., Gallaway, P.J., Liberty, L.M., Mix, A., Stott, L., Hammond, D.,Gardner, J., Dean, W., and the EW9504 Scientific Party, 1995a. Data submission: W9406 and EW9504 site surveys of the California margin pro-posed drillsites, Leg 167. Volume 1: Site maps and descriptions. BoiseState Univ., CGISS Tech. Rept., 95−11.
Lyle, M., Gallaway, P.J., Liberty, L.M., Mix, A., Stott, L., Hammond, D.,Gardner, J., Dean, W., and the EW9504 Scientific Party, 1995b. Datasubmission: W9406 and EW9504 site surveys of the California marginproposed drillsites, Leg 167. Volume 2: Seismic profiles. Boise StateUniv., CGISS Tech. Rept., 95−12.
Mayer, L., Pisias, N., Janecek, T., et al., 1992. Proc. ODP, Init. Repts., 138(Pts. 1 and 2): College Station, TX (Ocean Drilling Program).
McCrory, P.A., Wilson, D.S., Ingle, J.C., Jr., and Stanley, R.G., 1995. Neo-gene geohistory analysis of Santa Maria Basin, California and its relationship to transfer of central California to the Pacific Plate. In Keller,M.A. (Ed.), Evolution of Sedimentary Basins/Onshore Oil and Gas Inves-tigations—Santa Maria Province. U.S. Geol. Surv. Bull., J:1−38.
Okada, H., and Bukry, D., 1980. Supplementary modification and introduc-tion of code numbers to the low-latitude coccolith biostratigraphic zona-tion (Bukry, 1973; 1975). Mar. Micropaleontol., 5:321−325.
Zellers, S.D., 1995. Foraminiferal biofacies, paleoenvironments, and bios-tratigraphy of Neogene−Quaternary sediments, Cascadia Margin. In Car-son, B., Westbrook, G.K., Musgrave, R.J., and Suess, E. (Eds.), Proc.ODP, Sci. Results, 146 (Pt. 1): College Station, TX (Ocean Drilling Pro-gram), 79−113.
Ms 167IR-105
e-ee
NOTE: For all sites drilled, core-description forms (“barrel sheets”) and core photographs canbe found in Section 3, beginning on page 499. Smear-slide data can be found in Section 4, bginning on page 1327. Thin section data can be found in Section 5, beginning on page 1375. STable of Contents for material contained on CD-ROM.

SITE 1011
0 10TOC/TN
I
IIA
IIB
IIIA
IIIB
I V
Lith.units0 2 4
TOC (wt%)
0
100
200
0 4 0 80D
epth
(m
bsf)
CaCO3 (wt%)
Figure 19. Calcium carbonate and total organic carbon data in weight percent(wt%) and TOC/TN vs. depth (mbsf) from sediments of Hole 1011B.
0
0.2
0.4
0 2 4
TN
(w
t%)
TOC (wt%)
5 10
20
Marine
Ter
rige
nous
Figure 20. Total nitrogen (TN) vs. total organic carbon (TOC) from sedi-ments of Hole 1011B. TOC/TN values below 10 suggest a predominance ofmarine organic matter. TOC/TN values above 10 suggest a predominance ofterrigenous organic matter.
0 1 2 3 4 50
5
10
15
TOC (wt%)
TO
C/T
N
Figure 21. Total organic carbon (TOC) vs. total organic carbon/total nitrogenvalues (TOC/TN) in sediments of Hole 1011B. Arrow indicates correlation ofhigher TOC values with increased TOC/TN ratios.
0 20 400
100
200
Magneticsusceptibility
De
pth
(m
bsf)
( × 10– 6 )1.5 1.7 1.9
GRAPEbulk density
(g/cm3)
1500 1560
PWL velocity(m/s)
15 25 35
Natural gamma-ray activity
(total counts)SI
Figure 22. MST data from Hole 1011B.
Figure 23. GRAPE bulk density (line) and index property bulk density (cir-cles) data from Hole 1011B.
1.36 1.60 1.840
50
100
150
200
Dep
th (
mbs
f)
Density (g/cm3)
113

SITE 1011
1.2 1.6 2.00
100
200
Bulk density
Dep
th (
mbs
f)
(g/cm3)0.8 2.4
Voidratio
50 70
Porosity(%)
20 40 60
Water content(%)
0.6 1.0 1.4
Dry density(g/cm3)
2.4 2.6 2.8
Grain density(g/cm3)
Figure 24. Index properties data from Hole 1011B.
1480 1540 1600
0
40
80
120
Dep
th (
mbs
f)
PWL velocity (m/s)
55 65 75PWL porosity (%)
Figure 25. PWL velocity (line) and index property porosity (dashed line) datafrom Hole 1011B.
114
1500 1580 16600
100
200
Velocity (m/s)
Dep
th (
mbs
f)T1
T3
Figure 26. Discrete velocity values from Hole 1011B determined using twodifferent transducer pairs. Pair T1 was used above 26 mbsf (solid horizontalline) and pair T3 was used at greater depths.

SITE 1011
0 200 400 600 800 10000
10
20
Tem
pera
ture
(°C
) Adara run 167-1011C-4H
Fit:532–654
0 200 400 600 8000
10
20
Tem
pera
ture
(°C
) Adara run 167-1011C-6HFit:
419–494
0 200 400 600 8000
10
20
Tem
pera
ture
(°C
) Adara run 167-1011C-8H Fit:414–507
0 200 400 600 800 10000
10
20
Tem
pera
ture
(°C
) Adara run 167-1011C-10HFit:
596–711
0 200 400 600 800 10000
10
20
Tem
pera
ture
(°C
) Adara run 167-1011C-12HFit:
758–884
Record number
1 5 9 130
40
80
120
Temperature (°C)
Dep
th (
mbs
f)
Figure 27. Hole 1011C downhole temperature vs. record number (5-s record-ing frequency) for each measurement run, showing the interval fitted to deter-mine the downhole temperature.
Figure 28. Downhole temperature gradient for Hole 1011C.
0 10 20 30
30
50
70
Reflectance (%)
Dep
th (
mbs
f)
Dash = 450–500 nmSolid = 650–700 nm
A
0
10
20
200 600 1000
Ref
lect
ance
(%
)
Wavelength (nm)B
Nannofossil ooze with foraminifers and silty clay
(44.50 mbsf)
0
10
20
Ref
lect
ance
(%
)
Clayey silt withnannofossils(45.75 mbsf)
C
0
10
20
30
Ref
lect
ance
(%
)
Volcanic ash(29.01 mbsf)
D
0 5 10 150
100
200
Estimated opal (wt%)
Dep
th (
mbs
f)
I V
I I
I
III
A0 5 10 15
240
250
260
Estimated opal (wt%)
Dep
th (
mbs
f)
B
0
10
20
200 600 1000
Ref
lect
ance
(%
)
Clayey diatomite(248.25 mbsf)
C Wavelength (nm)
0
10
20
Ref
lect
ance
(%
)
Diatomaceous clay(246.27 mbsf)
D
Figure 29. Summary of color reflectance data for Hole 1011C. A. Percentreflectance of two band averages (450−500 and 650−700 nm) from 25 to 70mbsf. B. Characteristic spectra of nannofossil ooze with silty clay. C. Spectraof a clayey silt with nannofossils. D. High-reflectance ash layer.
Figure 30. Summary of weight-percent opal prediction for Hole 1011C. A.Complete downhole opal prediction and corresponding major lithostratigraphicunits. B. Close-up of opal prediction for 240−260 mbsf. C. Characteristic spec-tra of a clayey diatomite at the 248.25-mbsf opal peak. D. Relatively flat spec-tra from opal low at 246.27 mbsf.
115

SITE 1011
30 50 700
50
100
150
200
250
Dep
th (
mbs
f)
A Hole1011B
L *30 50 70
B Hole1011C
L *–30–150
C Hole1011B
a *–30–150
D Hole1011C
a *0 20 40
E Hole1011B
b *0 20 40
F Hole1011C
b *
Figure 31. Digital color video data from Holes 1011B and 1011C. A. Intensity of color CIELAB L* from Hole 1011B. B. Intensity of color CIELAB L* from Hole 1011C. C. Intensity of color CIELAB a* from Hole 1011B. D. Intensity of color CIELAB a* from Hole 1011C. E. Intensity of color CIELAB b* from Hole 1011B. F. Intensity of color CIELAB b* from Hole 1011C. CIELAB data decimated to 2-cm inter-vals.
Table 19. Downhole measurements at Hole 1011B.
Note: RIH = run in hole, TD = total depth, FMS = Formation MicroScanner, POOH = pull out of hole.
Date, time Description
1 May 19960700 Set pipe at 77 mbsf, start wireline rig up, seas calm.0815 Finish wireline rig up, RIH density-porosity combination tool string.0950 At TD (277.5 mbsf), wireline heave compensator on, start density-porosity pass 1 (277−80 mbsf); 300 m/hr.1110 At TD (277.5 mbsf), wireline heave compensator on, start density-porosity pass 2 (278−96 mbsf), 300 m/hr continue log recording to mudline.1400 Rig down density-porosity combination tool string, rig up and RIH with sonic-FMS tool string.1500 At TD, wireline heave compensator on, begin sonic-FMS pass 1 (282−99 mbsf).1600 End sonic-FMS pass 1. FMS calipers not closing, circulate with mudpumps.1715 POOH sonic-FMS, rig down.
116

SITE 1011
10 15 20Caliper (in)
20 40 60 80 10050
100
150
200
250
Gamma ray (API)0.4 0.5 0.6 0.70.8 0.9
Resistivity (ohm•m)0.4 0.6 0.8 11.4 1.6 1.8 2
Density (g/cm3)
IIA
IIB
IIC
IIIA
IV
Lith.units
Porosity (decimal)D
epth
(m
bsf)
Figure 32. Downhole log data from the density-porosity combination tool string (pass 1) and a lithostratigraphic summary column at Hole 1011B (see “Litho-stratigraphy” section, this chapter).
ol.
0
150
300
Temperature (°C)0 5 10 15
Dep
th (
mbs
f)
Figure 33. Borehole temperature measurements from the Lamont-Doherty temperature logging to
117

SITE 1011
118
0
100
200
Bulk density (g/cm3)1.4 1.6 1.8 2 40 65 90
Porosity (%)1400 1600
Velocity (m/s)
Dep
th (
mbs
f)
I
IIA
IIB
IIC
IIIC
IV
Lith.units
Gamma ray (SGR)40 60 80 100
Figure 34. Comparison of core (open symbols) and log (line) physical property data.
40 60 80100
150
200
250
Porosity (%)
Dep
th (
mbs
f)
Neutronporosity
Densityporosity
Figure 35. Neutron and litho-density log measurements of formation porosity (lines) compared to core porosity (open symbols) measurements.

SITE 1011
40 60 80
200 3001.4 1.6 1.8
1.4 1.6 1.8
50
100
150
200
250
Natural gamma ray (cps)
Core
Log (HSGR)
Core
Log (RHOB)
Dep
th (
mbs
f)APC
XCB
Bulk density (g/cm3)
Bulk density (g/cm3) Natural gamma ray (API units)
Figure 36. Comparison of core (MST) with log natural gamma-ray and bulk density data at Hole 1011B. Note the reduced core bulk densities associated withthe switch from APC to XCB coring at ~138 mbsf.
50 70 90Gamma ray (API, log)
180
190
200
210
220
10 20 30Gamma ray (cps, core)
Pass 1 Pass 2
1.4 1.6 1.8 2 1.4 1.6 1.8
Pass 1 Pass 2
Bulk density (g/cm3, core) Bulk density (g/cm3, log)
IIC
IIIA
Dep
th (
mbs
f)
Lith.unit
Figure 37. Detail of the core and log natural gamma-ray and bulk density data at Hole 1011B, 180−220 mbsf. Log data from passes 1 and 2 are shown to illus-trate log repeatability.
119

SITE 1011
1389 1443
X line 10 X line 1
3200 m
Site1011
X line 62600
3000
Tw
o-w
ay tr
avel
time
(s)
1651
3400
N S
Qu
ate
rna
ryla
te P
lioce
ne
ea
rly
Plio
cen
ela
te M
ioce
ne
Water depth = 2033 mSill depth = 1600 m
10
20
40
50
60
70
80
90
100
110
120
140
160
170
180
190
200
210
220
230
240
250
270
280
290
150
300
0
I
IIA
IIB
IIIA
Basalt
30
X line 7
1520Shotpoints
130
De
pth
(m
bsf
)
IIC
IIIB
260IV
V
Figure 38. Comparison of the lithostratigraphic column at Site 1011 and a seismic profile through the site (Line EW9504 CAM2-2; Lyle et al., 1995b). Ties areestimated from the depth to basement and measured seismic velocities (see “Physical Properties” section, this chapter). On y-axis, (s) = milliseconds.
120

SHIPBOARD SCIENTIFIC PARTY
GT theur-
in(8-10- the
of the
NGSly be-
LDT
es arether
SHORE-BASED LOG PROCESSINGHole 1011B
Bottom felt: 2032.5 mbrf (used for depth shift to seafloor)Total penetration: 281.5 mbsfTotal core recovered: 271.1 m (96%)
Logging Runs
Logging string 1: DIT/HLDT/APS/HNGS (2 passes)Logging string 2: FMS/GPIT/SDT/NGT
Wireline heave compensator was used to counter ship heave.
Bottom-Hole Assembly
The following bottom-hole assembly depths are as they appear onthe logs after differential depth shift (see “Depth shift” section) anddepth shift to the sea floor. As such, there might be a discrepancywith the original depths given by the drillers on board. Possible rea-sons for depth discrepancies are ship heave, use of wireline heavecompensator, and drill string and/or wireline stretch.
DIT/HLDT/APS/HNGS: Did not reach bottom-hole assembly.DIT/HLDT/APS/HNGS: Bottom-hole assembly at ~49.5 mbsf
(pass 2).FMS/GPIT/SDT/NGT: Did not reach bottom-hole assembly.
Processing
Depth shift: Original logs have been interactively depth shiftedwith reference to NGT from DIT/SDT/HLDT/APS/HNGS pass 2 andto the seafloor (–2032.5 m).
Gamma-ray and environmental corrections: Corrections forborehole size and type of drilling fluid were performed on the Ndata from the FMS/GPIT/SDT/NGT tool string. HNGS data fromDIT/HLDT/APS/HNGS tool string were corrected in real-time ding the recording.
Acoustic data processing: The array sonic tool was operatedstandard depth-derived, borehole compensated, long spacing 10-12 ft) and short spacing (3-5-5-7 ft) mode. The sonic logs fromlong spacing mode have been processed to eliminate some noise and cycle skipping experienced during the recording.
Quality Control
Data recorded through bottom-hole assembly, such as the Hdata above 50 mbsf (pass 1) should be used qualitatively oncause of the attenuation on the incoming signal.
Hole diameter was recorded by the hydraulic caliper on the Htool (CALI) and the caliper on the FMS string (C1 and C2).
Note: Details of standard shore-based processing procedurfound in the “Explanatory Notes” chapter, this volume. For furinformation about the logs, please contact:
Cristina Broglia Zhiping TuPhone: 914-365-8343 Phone: 914-365-8336Fax: 914-365-3182 Fax: 914-365-3182E-mail: [email protected] E-mail: [email protected]
121

SITE 1011
122
Cor
e
Rec
over
y
bottom hole assembly
open hole
Formation
Hole 1011B: Natural Gamma Ray-Density-Porosity Logging Data-Pass 2
Dep
th (
mbs
f)
1H
2H
3H
4H
5H
6H
7H
8H
9H
10H
11H
12H
13H
14H
15H
16X
17X
18X
19X
0
50
100
150
-10 90API unitsTotal Gamma Ray
-10 90API unitsComputed Gamma Ray
10 20in.Caliper
1 3g/cm3Bulk Density
100 0%Neutron Porosity
-0.25 0.25g/cm3Density Correction
0 4inStandoff
0
50
100
150
2 12barns/e-Photoelectric Factor
10 60cuCapture Cross Section
Dep
th (
mbs
f)
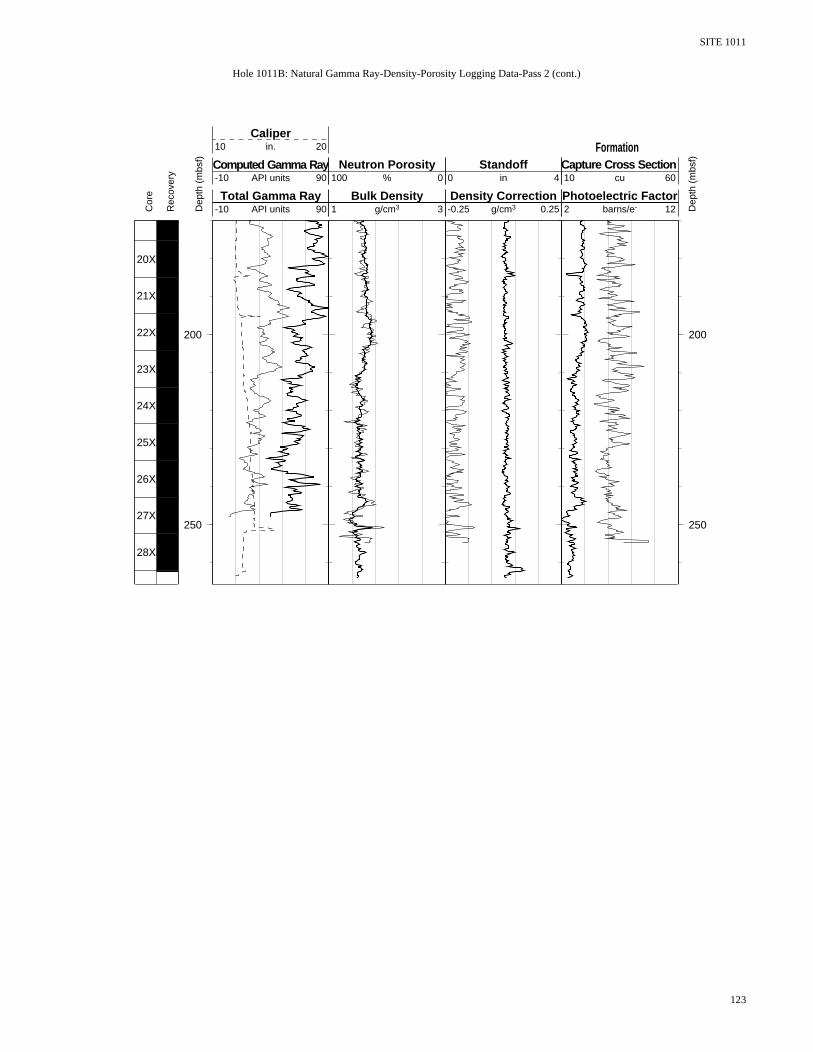
SITE 1011
Hole 1011B: Natural Gamma Ray-Density-Porosity Logging Data-Pass 2 (cont.)
Dep
th (
mbs
f)
20X
21X
22X
23X
24X
25X
26X
27X
28X
29X
200
250
-10 90API unitsTotal Gamma Ray
-10 90API unitsComputed Gamma Ray
10 20in.Caliper
1 3g/cm3Bulk Density
100 0%Neutron Porosity
-0.25 0.25g/cm3Density Correction
0 4inStandoff
200
250
2 12barns/e-Photoelectric Factor
10 60cuCapture Cross Section
Dep
th (
mbs
f)
FormationC
ore
Rec
over
y
123
30X
31X
300 300

SITE 1011
12
Cor
e
Rec
over
y
bottom hole assembly
open hole
Hole 1011B: Natural Gamma Ray-Resistivity-Sonic Logging Data-Pass 2
Dep
th (
mbs
f)
1H
2H
3H
4H
5H
6H
7H
8H
9H
10H
11H
12H
13H
14H
15H
16X
17X
18X
19X
0
50
100
150
0 100API unitsTotal Gamma Ray
0 100API unitsComputed Gamma Ray
0.2 2.2Ohm-mFocused Resistivity
0.2 2.2Ohm-mDeep Resistivity
0.2 2.2Ohm-mMedium Resistivity
1.3 2.3km/sMean Velocity
1.3 2.3km/sMedian Velocity
0
50
100
150
8 18in.FMS Caliper1
8 18in.FMS Caliper2
Dep
th (
mbs
f)
4

SITE 1011
Hole 1011B: Natural Gamma Ray-Resistivity-Sonic Logging Data-Pass 2 (cont.)
Dep
th (
mbs
f)
20X
21X
22X
23X
24X
25X
26X
27X
28X
29X
30X
31X
200
250
0 100API unitsTotal Gamma Ray
0 100API unitsComputed Gamma Ray
0.2 2.2Ohm-mFocused Resistivity
0.2 2.2Ohm-mDeep Resistivity
0.2 2.2Ohm-mMedium Resistivity
1.3 2.3km/sMean Velocity
1.3 2.3km/sMedian Velocity
200
250
8 18in.FMS Caliper1
8 18in.FMS Caliper2
Dep
th (
mbs
f)
Cor
e
Rec
over
y
125
300 300
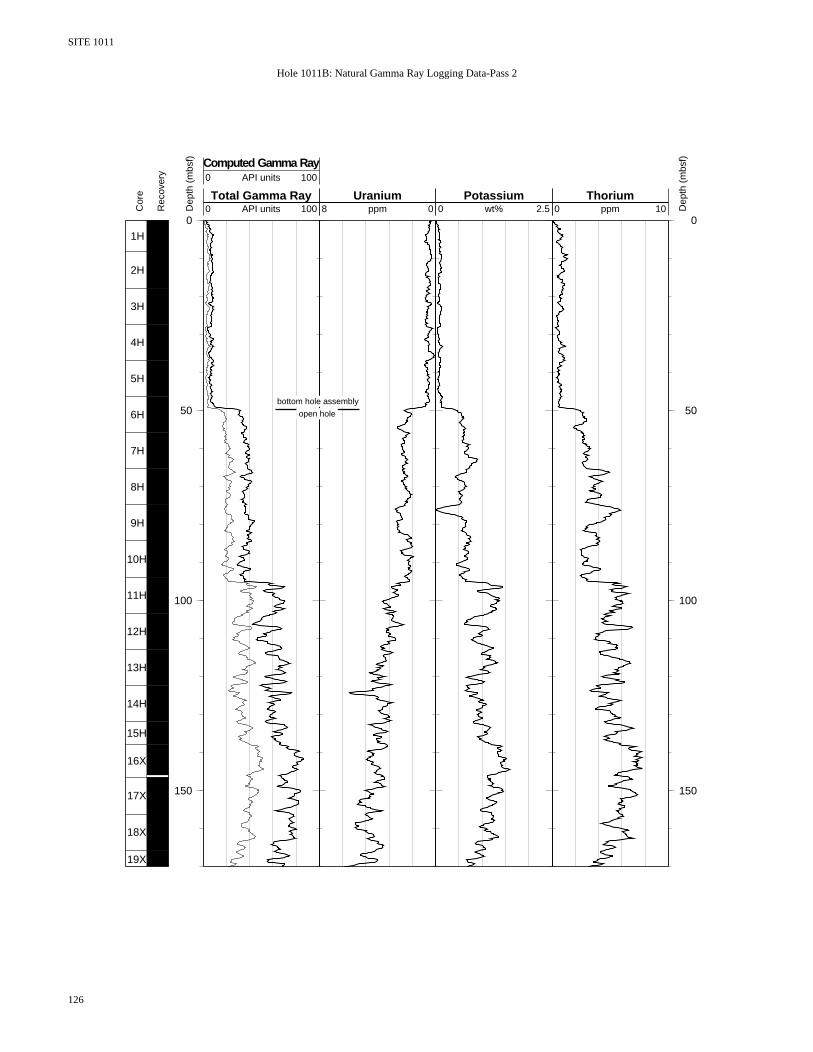
SITE 1011
126
Hole 1011B: Natural Gamma Ray Logging Data-Pass 2
Dep
th (
mbs
f)
1H
2H
3H
4H
5H
6H
7H
8H
9H
10H
11H
12H
13H
14H
15H
16X
17X
18X
19X
0
50
100
150
0 100API unitsTotal Gamma Ray
0 100API unitsComputed Gamma Ray
8 0ppmUranium
0 2.5wt%Potassium
0
50
100
150
0 10ppmThorium
Dep
th (
mbs
f)
Cor
e
Rec
over
y
bottom hole assembly
open hole

SITE 1011
Hole 1011B: Natural Gamma Ray Logging Data-Pass 2 (cont.)
Dep
th (
mbs
f)
20X
21X
22X
23X
24X
25X
26X
27X
28X
29X
200
250
0 100API unitsTotal Gamma Ray
0 100API unitsComputed Gamma Ray
8 0ppmUranium
0 2.5wt%Potassium
200
250
0 10ppmThorium
Dep
th (
mbs
f)
Cor
e
Rec
over
y
127
30X
31X
300 300
3UHYLRXV�&KDSWHU3UHYLRXV�&KDSWHU 7DEOH�RI�&RQWHQWV7DEOH�RI�&RQWHQWV 1H[W�&KDSWHU1H[W�&KDSWHU