holiday inn, arlington, va (dogwood room), 25-26 june 2009 li li and peter gaiser naval research...
TRANSCRIPT

Holiday Inn, Arlington, VA (Dogwood room), 25-26 June 2009
Li Li and Peter Gaiser Naval Research Laboratory
Washington, DC, USA
With contributions fromDrs. S. Seneviratne, G. Nedoluha, and S. Steele-Dunne
Joint AMSR Science Team meeting
Observations of the 2003 European Heat Waves Using Soil Moisture and Vegetation Data

2
2003 European Heat Waves
Heat waves are the most lethal type of weather phenomenon
• One of the hottest summers on record in Europe. • 35,000 people died as a result of the heat wave. • Uninsured crop loss totaling $12.3 Billions
Extreme Heat Wave MechanismsRoles of Soil Moisture, Vegetation, and LST
3
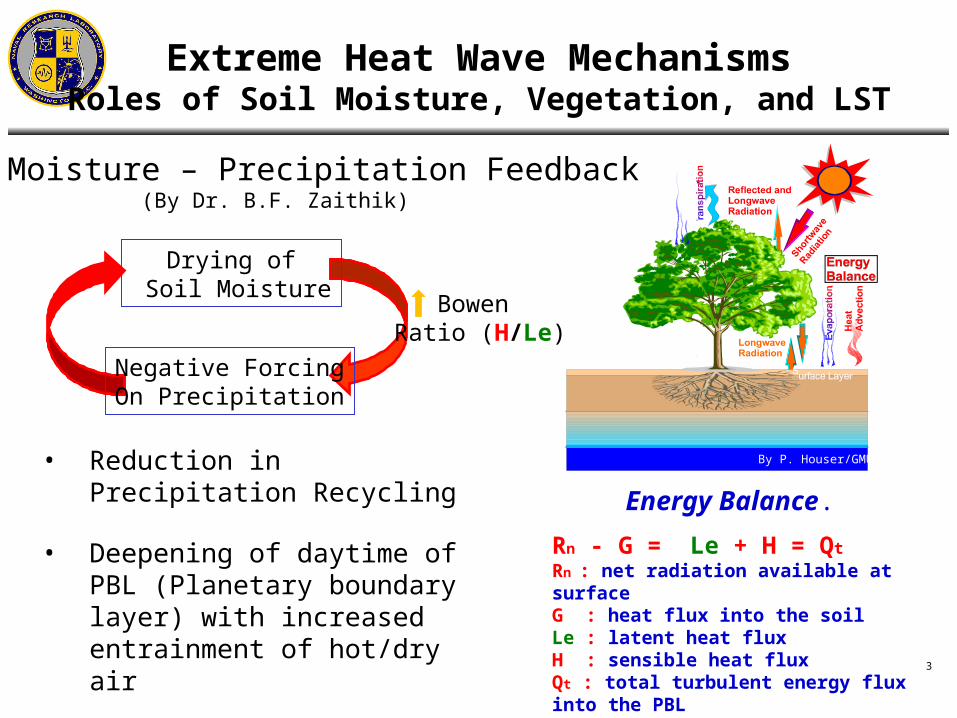
Energy Balance.
Rn - G = Le + H = Qt
Rn : net radiation available at surfaceG : heat flux into the soilLe : latent heat fluxH : sensible heat fluxQt : total turbulent energy flux into the PBL
Bowen Ratio (H/Le)
Negative ForcingOn Precipitation
Drying of Soil Moisture
Soil Moisture – Precipitation Feedback(By Dr. B.F. Zaithik)
• Reduction in Precipitation Recycling
• Deepening of daytime of PBL (Planetary boundary layer) with increased entrainment of hot/dry air
• Reduction in net radiation (Rn) and
Qt
By P. Houser/GMU
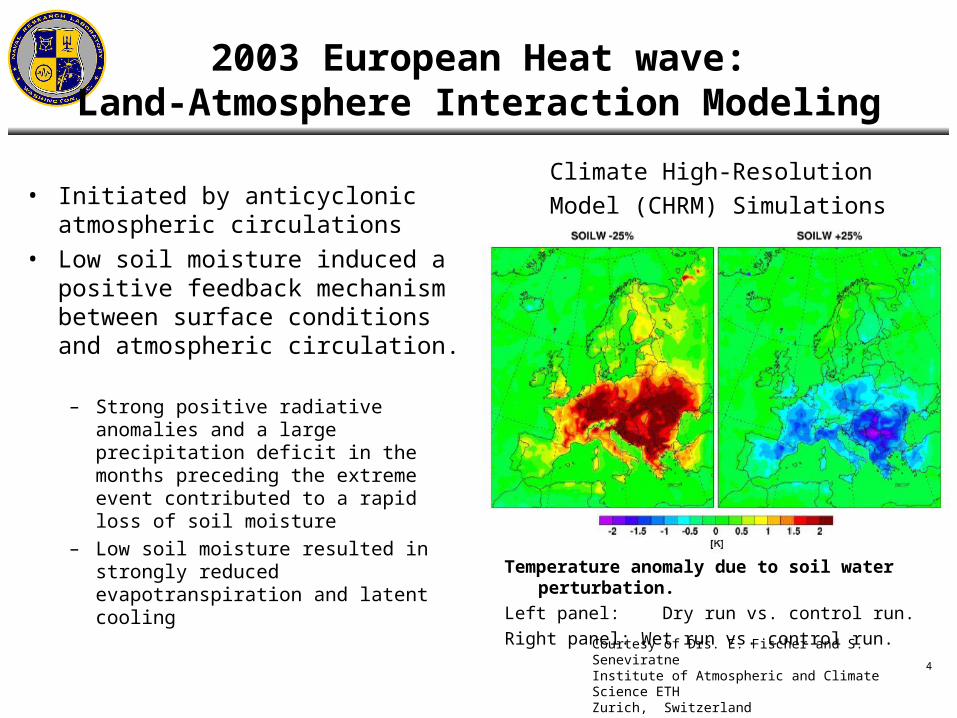
2003 European Heat wave:Land-Atmosphere Interaction Modeling
• Initiated by anticyclonic atmospheric circulations
• Low soil moisture induced a positive feedback mechanism between surface conditions and atmospheric circulation.
– Strong positive radiative anomalies and a large precipitation deficit in the months preceding the extreme event contributed to a rapid loss of soil moisture
– Low soil moisture resulted in strongly reduced evapotranspiration and latent cooling
4
Climate High-Resolution
Model (CHRM) Simulations
Temperature anomaly due to soil water perturbation.
Left panel: Dry run vs. control run.
Right panel: Wet run vs. control run.Courtesy of Drs. E. Fischer and S. SeneviratneInstitute of Atmospheric and Climate Science ETHZurich, Switzerland
5
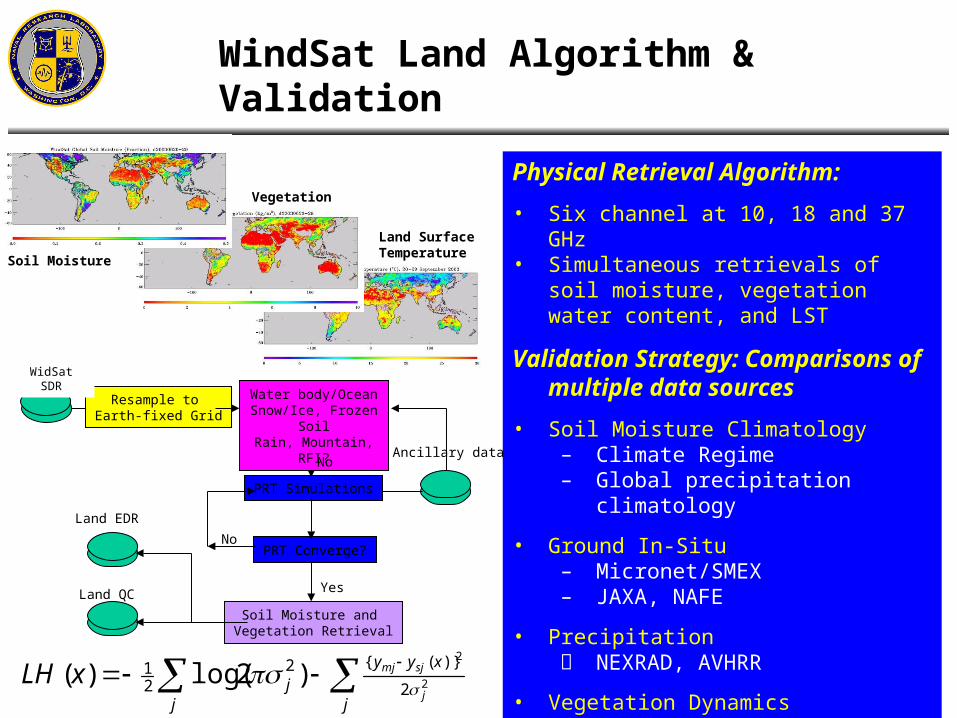
WindSat Land Algorithm & Validation
j j
xyy
jj
sjmjxLH 2
2
2
)}({221 )2log()(
Physical Retrieval Algorithm:
• Six channel at 10, 18 and 37 GHz• Simultaneous retrievals of soil moisture,
vegetation water content, and LST
Validation Strategy: Comparisons of multiple data sources
• Soil Moisture Climatology– Climate Regime– Global precipitation climatology
• Ground In-Situ– Micronet/SMEX – JAXA, NAFE
• Precipitation NEXRAD, AVHRR
• Vegetation Dynamics– GVF/AVHRR– NDVI/NDII/MODIS
Ancillary data
Resample to Earth-fixed Grid
Soil Moisture and Vegetation Retrieval
No
Land EDR
Land QC
Water body/OceanSnow/Ice, Frozen SoilRain, Mountain, RFI?
PRT Simulations
No
PRT Converge?
Yes
WidSat SDR
Soil Moisture
Vegetation
Land SurfaceTemperature
6
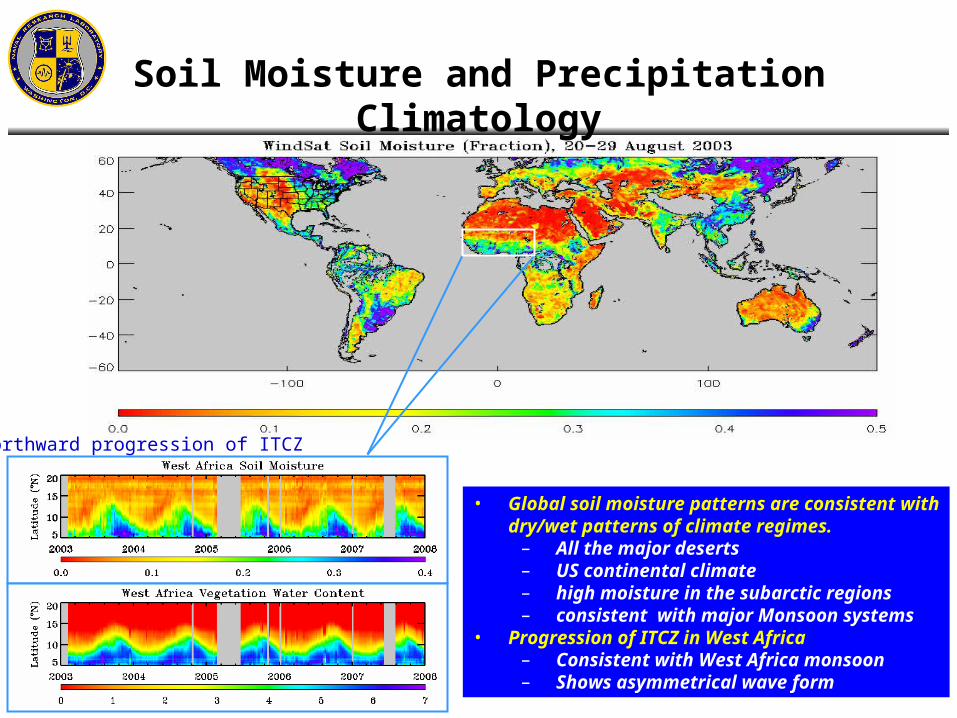
Soil Moisture and Precipitation Climatology
• Global soil moisture patterns are consistent with dry/wet patterns of climate regimes.
– All the major deserts– US continental climate– high moisture in the subarctic regions– consistent with major Monsoon systems
• Progression of ITCZ in West Africa– Consistent with West Africa monsoon– Shows asymmetrical wave form
Northward progression of ITCZ

Soil Moisture In-Situ Validations
USDA Validation Sites:SMEX03: rangeland and winter wheat SMEX04: sparse shrubland, mountainsSMEX05: agricultural – corn, soybean
Other Validation Sites:SMOSREX, France: » Grassland, wheat, corn CEOP, Mongolia: » Arid rangeland
France Mongolia
United States

8
Vegetation Water Content
The WindSat vegetation water content is consistent with the AVHRR NDVI data.
GVF
Vegetation Data Validation
The Normalized Difference Vegetation Index (NDVI): N = (R0.85-R0.66)/(R0.85+R0.66)
Green Vegetation Fraction: GVF = (N-Ns)/(Nv-Ns)
SMEX05 Vegetation Validation

European Summer Climate
9
• Potentially influenced by SST and SM, when the large-scale westerly flow weakens in the summer
• Drought propagation play an important role in maintaining the hot summer
• Using precipitation data as proxy; no direct SM evidence published By Vautard et al, 2007
Soil Moisture
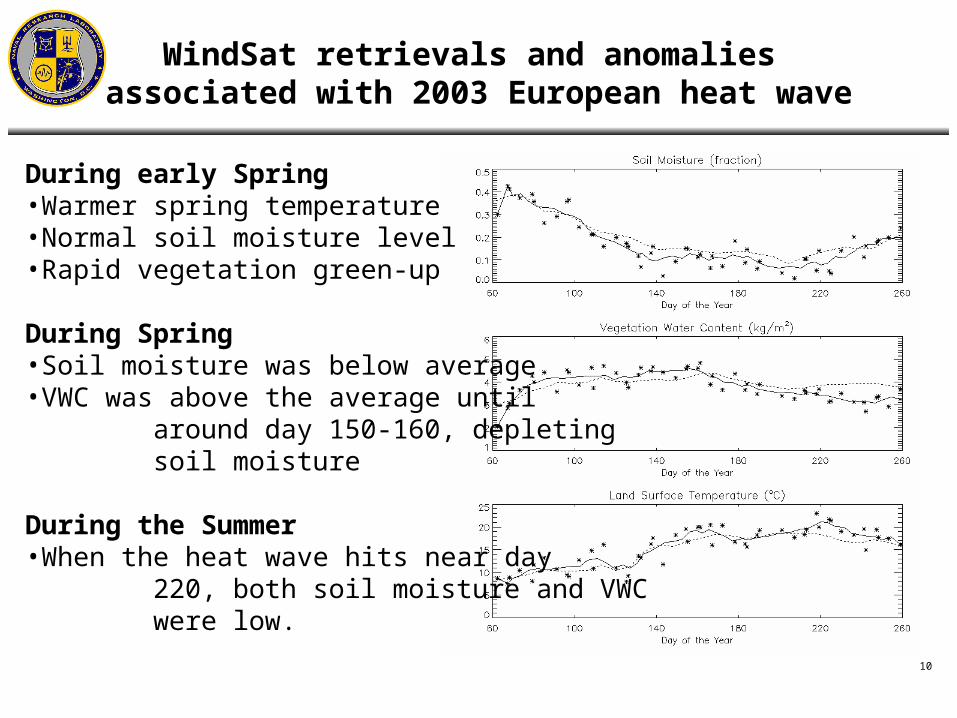
WindSat retrievals and anomalies associated with 2003 European heat wave
10
During early Spring•Warmer spring temperature•Normal soil moisture level •Rapid vegetation green-up
During Spring•Soil moisture was below average •VWC was above the average until around day 150-160, depleting soil moisture
During the Summer•When the heat wave hits near day 220, both soil moisture and VWC were low.

The 2003 European Extreme Heat Wave
11
WindSat Data Captured three reported LST anomalies, and revealed their differences in surface conditions
Day 60 – 110• Warmer spring temperature• Normal soil moisture level • Rapid vegetation green-up
Day 110 - 160• Soil moisture was below average • VWC was above the average until day 150-160,
depleting soil moisture
Late Summer• When the heat wave hits near day 220, both soil
moisture and VWC were low.
LST Soil Moisture
Week 232003
Week 235 year mean
SMOSREX Site
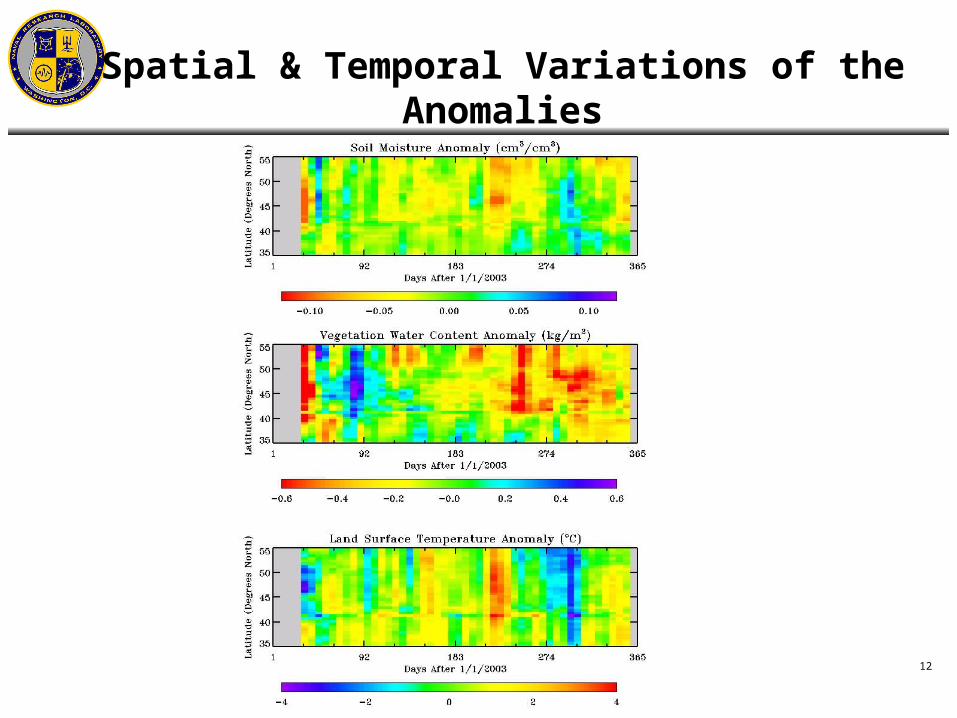
Spatial & Temporal Variations of the Anomalies
12

13
Conclusions
• The passive microwave land observations can:– Capture anomalies of soil moisture and vegetation water
content – provide a detailed description of the evolution of 2003
European heat waves.– corroborate the climate model simulations suggesting an
important role of drought in the deadly 2003 heat wave.
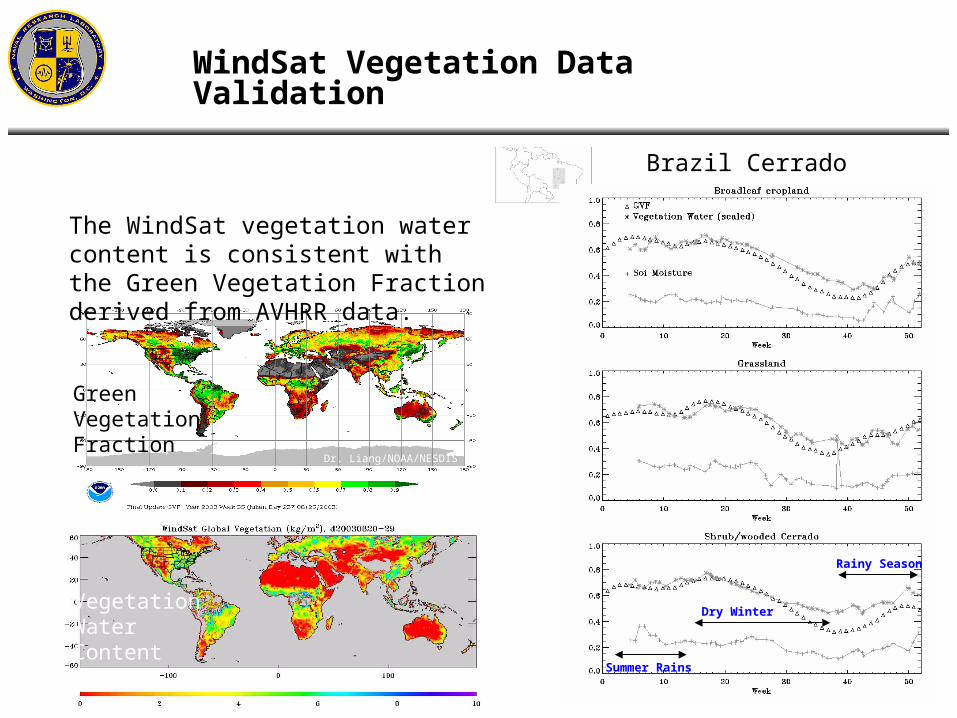
14Summer Rains
Dry Winter
Rainy Season
Vegetation Water Content
Green Vegetation Fraction
The WindSat vegetation water content is consistent with the Green Vegetation Fraction derived from AVHRR data.
WindSat Vegetation Data Validation
Brazil Cerrado
Dr. Liang/NOAA/NESDIS

SMEX05 Vegetation Validation
The Normalized Difference Infrared Index (NDII) is
linearly related to canopy water (EWT):NDII = (R0.85-R1.65)/(R0.85+R1.65) Assuming linear allometric relationships, the VWC is then
linearly related to EWT and NDII
The first comparison of large scale Vis/IR and MW Vegetation data