holistic design and software aided finite element analysis
TRANSCRIPT

Journal of Mechanical Engineering Research Vol. 4(6), pp. 199-212, October 2012 Available online at http://www.academicjournals.org/JMER DOI: DOI: 10.5897/JMER12.009 ISSN 2141-2383 ©2012 Academic Journals
Full Length Research Paper
Holistic design and software aided finite element analysis (FEA) of an All-Terrain Vehicle
Amrit Om Nayak*, G. Ramkumar, T. Manoj, M. A. Kannan, D. Manikandan and Sibi Chakravarthy
Department of Mechanical Engineering, Thiagarajar College of Engineering, Madurai, India.
Accepted 11 May, 2012
We have tried to design an All-Terrain Vehicle that meets international standards and is also cost effective at the same time. We have focused on every single system to improve the performance of each component. Our vehicle can navigate through almost all terrain, which ultimately is the objective behind the making of any All-Terrain Vehicle. We began the task of designing by conducting extensive research of each main component of the vehicle. We did not want to design certain areas such as the frame, and then make the rest to fit. We considered each component to be significant, and thereby designed the vehicle as a whole trying to optimize each component while constantly considering how other components would be affected. This forced us to think outside the box, research more thoroughly, and redesign components along the way in order to have a successful design. Combining this design methodology with the standard engineering design process enabled us to achieve a perfect match of aesthetics, performance, and ease of operation. Our current design is reliable and stable. Extensive research helped us pinpoint the needs of the customers which helped us to refine our design further. We used the necessary parameters to create a Qualitative Function Diagram (QFD) to determine which parameters were the most critical. These key parameters ranging from most critical to least critical are safety, reliability, low cost, ease of operation and maintenance, and overall performance. Key words: Power train, final-drive, rack and pinion, suspension, brakes, roll cage, double Wishbone suspension.
INTRODUCTION An All-Terrain Vehicle (ATV), also known as a quad, quad bike, three-wheeler, or four-wheeler, is defined as a vehicle that travels on low-pressure tyres, with a seat that is straddled by the operator, along with handlebars for steering control. As the name implies, it is designed to handle a wider variety of terrain than most other vehicles. ATVs are intended for use by a single operator, although some companies have developed ATVs intended for use by the operator and one passenger. Here we have designed an ATV with a unique approach that encompasses manual design backed by software aided
*Corresponding author. E-mail: [email protected]. Tel: 91-9791690869.
analysis. We have designed the ATV with aid of sophisticated software tools like Catia to achieve a greater degree of accuracy and precision and carried out stress analysis tests in digital simulation environments with the aid of software. This data has been corroborated with the manual design calculations to enable us achieve our purpose of designing a top notch ATV. FRAME DESIGN METHODOLOGY The primary objective of the frame is to provide a 3-dimensional protected space around the driver that will keep the driver safe. Its secondary objectives are to provide reliable mounting locations for components, be appealing, low in cost, and low in weight (Heinz 2002). These objectives were met by choosing a frame material that has good strength and also weighs less giving us an advantage in weight reduction. A low cost frame was provided through
200 J. Mech. Eng. Res.
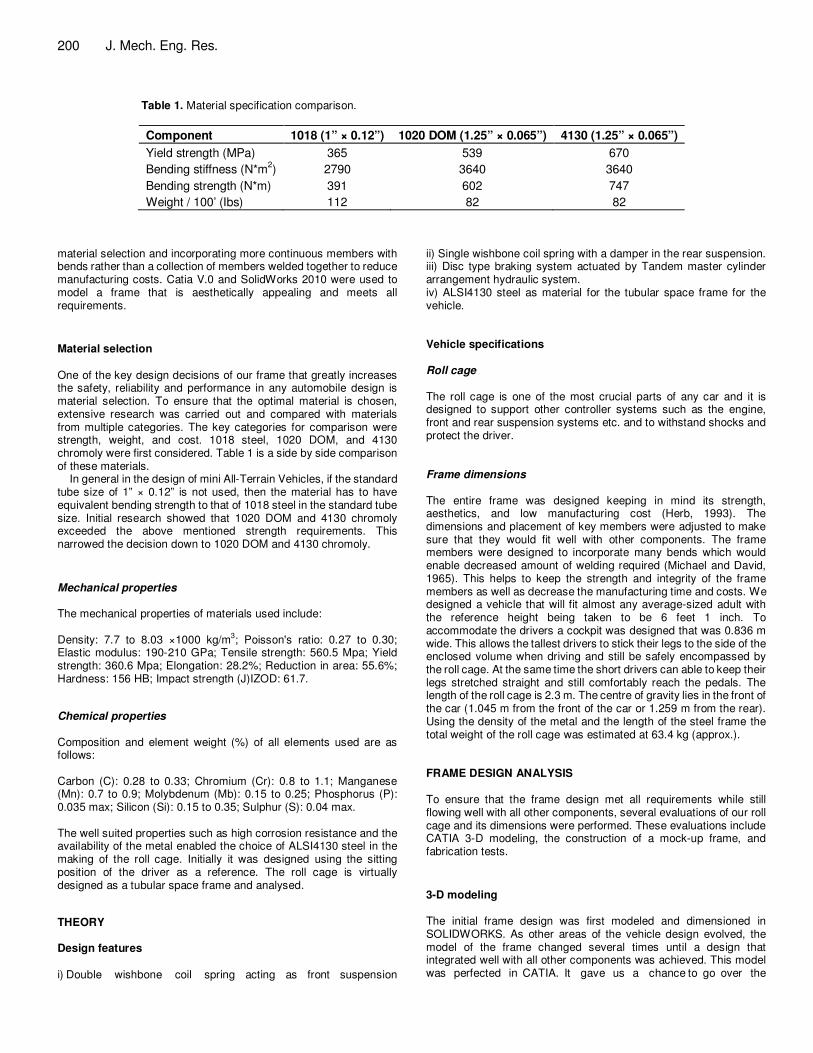
Table 1. Material specification comparison.
Component 1018 (1” × 0.12”) 1020 DOM (1.25” × 0.065”) 4130 (1.25” × 0.065”)
Yield strength (MPa) 365 539 670
Bending stiffness (N*m2) 2790 3640 3640
Bending strength (N*m) 391 602 747
Weight / 100’ (Ibs) 112 82 82
material selection and incorporating more continuous members with bends rather than a collection of members welded together to reduce manufacturing costs. Catia V.0 and SolidWorks 2010 were used to model a frame that is aesthetically appealing and meets all requirements.
Material selection
One of the key design decisions of our frame that greatly increases the safety, reliability and performance in any automobile design is material selection. To ensure that the optimal material is chosen, extensive research was carried out and compared with materials from multiple categories. The key categories for comparison were strength, weight, and cost. 1018 steel, 1020 DOM, and 4130 chromoly were first considered. Table 1 is a side by side comparison of these materials.
In general in the design of mini All-Terrain Vehicles, if the standard tube size of 1” × 0.12” is not used, then the material has to have equivalent bending strength to that of 1018 steel in the standard tube size. Initial research showed that 1020 DOM and 4130 chromoly exceeded the above mentioned strength requirements. This narrowed the decision down to 1020 DOM and 4130 chromoly.
Mechanical properties The mechanical properties of materials used include: Density: 7.7 to 8.03 ×1000 kg/m
3; Poisson's ratio: 0.27 to 0.30;
Elastic modulus: 190-210 GPa; Tensile strength: 560.5 Mpa; Yield strength: 360.6 Mpa; Elongation: 28.2%; Reduction in area: 55.6%; Hardness: 156 HB; Impact strength (J)IZOD: 61.7. Chemical properties Composition and element weight (%) of all elements used are as follows: Carbon (C): 0.28 to 0.33; Chromium (Cr): 0.8 to 1.1; Manganese (Mn): 0.7 to 0.9; Molybdenum (Mb): 0.15 to 0.25; Phosphorus (P): 0.035 max; Silicon (Si): 0.15 to 0.35; Sulphur (S): 0.04 max. The well suited properties such as high corrosion resistance and the availability of the metal enabled the choice of ALSI4130 steel in the making of the roll cage. Initially it was designed using the sitting position of the driver as a reference. The roll cage is virtually designed as a tubular space frame and analysed. THEORY
Design features
i) Double wishbone coil spring acting as front suspension
ii) Single wishbone coil spring with a damper in the rear suspension. iii) Disc type braking system actuated by Tandem master cylinder arrangement hydraulic system. iv) ALSI4130 steel as material for the tubular space frame for the vehicle. Vehicle specifications
Roll cage The roll cage is one of the most crucial parts of any car and it is designed to support other controller systems such as the engine, front and rear suspension systems etc. and to withstand shocks and protect the driver. Frame dimensions The entire frame was designed keeping in mind its strength, aesthetics, and low manufacturing cost (Herb, 1993). The dimensions and placement of key members were adjusted to make sure that they would fit well with other components. The frame members were designed to incorporate many bends which would enable decreased amount of welding required (Michael and David, 1965). This helps to keep the strength and integrity of the frame members as well as decrease the manufacturing time and costs. We designed a vehicle that will fit almost any average-sized adult with the reference height being taken to be 6 feet 1 inch. To accommodate the drivers a cockpit was designed that was 0.836 m wide. This allows the tallest drivers to stick their legs to the side of the enclosed volume when driving and still be safely encompassed by the roll cage. At the same time the short drivers can able to keep their legs stretched straight and still comfortably reach the pedals. The length of the roll cage is 2.3 m. The centre of gravity lies in the front of the car (1.045 m from the front of the car or 1.259 m from the rear). Using the density of the metal and the length of the steel frame the total weight of the roll cage was estimated at 63.4 kg (approx.). FRAME DESIGN ANALYSIS To ensure that the frame design met all requirements while still flowing well with all other components, several evaluations of our roll cage and its dimensions were performed. These evaluations include CATIA 3-D modeling, the construction of a mock-up frame, and fabrication tests.
3-D modeling The initial frame design was first modeled and dimensioned in SOLIDWORKS. As other areas of the vehicle design evolved, the model of the frame changed several times until a design that integrated well with all other components was achieved. This model was perfected in CATIA. It gave us a chance to go over the

dimensions of the vehicle and to make sure that they met all requirements. It provided us with a 3-D visualization of the frame which ensured that the frame would be aesthetically appealing. One of our goals was to incorporate bends where ever possible so as to minimize the number of welded joints. Figure 1 is the final model of the roll cage. Frame fabrication
Before starting the fabrication of the frame, series of tests need to be performed, beginning with weld test needs. This weld test needs to be performed on the 4130 chromoly (Heinz, 2002). This test verifies the correctness of welding techniques. To build an accurate frame, a small adjustable frame jig is constructed to ensure the uniformity or levelness of the surface. Some bend tests are also performed to ensure that the bender properly bends the tube without affecting its integrity (Herb, 1993). Force equations on roll cage At joint J1, F = F1.Cos Ɵ + F2 + F3.Cos 90 (1) At joint J3, F4 = F1.Cos Ɵ.Cos 90 = 0 (2) F5 = F1.Cos Ɵ.Cos (180 – Ɣ – ϕ) (3) F6 = F1.Cos Ɵ.Cos Ɣ + F2 (4) At joint J2, F’ = F2 + F6 =2. F2 + F1.Cos Ɵ.Cos Ɣ (5) Clearly from the above equations for the first three joints as marked in the Figure 2, we infer that the higher value of bending angles at the joints provided by us results in drastic decrease in force component as the force is propagated along the structure. Further calculation reveals that the force components become negligible towards the rear end of the roll cage. The reason is that Cosine value of an angle decreases as we increase the angle.
The roll cage design is started by marking the 16 suspension points in the world co-ordinate system. Then A – arms are created for the suspension mounting. The upright is drawn at the wheel. The side impact structure is drawn based on the above results. This is followed by the front roll hoop and the rear roll hoop; thereafter by placing the cross members based on the analysis results obtained on the bare roll cage. Lastly, mounting points are created for the various vehicle components including the engine mounting point. SUSPENSION DESIGN The overall purpose of a suspension system is to absorb impacts from course irregularities, such as bumps, and distribute that force with the least amount of discomfort to the driver; while providing the best handling (Richard and Jeffrey, 2004). This was achieved by doing extensive research on the front suspension arm’s geometry to help reduce as much body roll as possible. Proper camber and caster angles were applied to the front wheels as well. The shocks are set to provide the proper dampening and spring coefficients to provide a smooth and well performing ride. The suspension was designed to isolate the motion of the road from the vehicle chassis and hence improve ride comfort, vehicle handling, traction and
Nayak et al. 201
Figure 1. Roll cage perspective view.
Figure 2. Force component distribution along the roll cage.
minimize wear in tyres (Srinivasan, 2006). Hence it was decided to equip the vehicle with a four-wheel independent double A-arm type suspension (Figure 3).
The suspension system consists of the conventional helical coil spring. A damper or shock absorber has been added to improve the comfort and safety of the vehicle. The wire and mean diameter were calculated as per the load of the roll cage, driver weight, engine weight and other miscellaneous extra weights. Front suspension design The front suspension consisting of double wishbone coil spring with damper is designed by evaluating the ideal ride height to easily steer through unsmooth tract. Double A-arm allows for good control over wheel angles and produces minimal camber gain over large amounts of wheel travel (Srinivasan, 2006).
The rear to front distribution of weight in the vehicle was calculated to be 35: 65. The total load of the vehicle (which includes roll cage, engine, driver and other weights) was estimated to be 220 kg (approx.) and the load acting on the front suspensions were calculated as 77.82 kg (762.636 N). Load on each spring = 381.318

202 J. Mech. Eng. Res.
Figure 3. Suspension system.
Figure 4. Roll center.
N (assuming equal distribution of weight on each spring). The front suspension is made relatively stiffer than the rear one
owing to the better motion control of the front axle and wheels relative to the frame.
Based on the force acting and material chosen (plain carbon steel) we calculated the various parameters that define the helical coil spring. The feasibility study of making such springs with the required parameters and suitable dampers were found to show positive results.
Rear suspensions and location of the roll centre
The rear suspension unlike the front one consists of single wishbone coil spring with a damper. The rear suspension is designed by considering the same design principles as in the front suspensions except that it is designed in such a way that the spring rate is 120% of that in the front suspension for better motion control of the front axle and the wheels relative to the frame.
The various parameters of the suspensions (both front and rear)
were calculated to be:
1) Weight distribution ratio:
Front: Back - 77.88: 142.12.
2) Total weight on the spring = 220 kg (2156 N approx.) 3) Factors assumed/Taken from data book:
i) Material chosen: Plain carbon steel
ii) Spring index, C = D/d = 8.5 (6)
[Here D is mean diameter; d is diameter of the wire]
iii) Shear stress (ζ) = 16000 N/cm2
iv) Helix angle of the spring, α = 5° (for rear) and 6° (for front)
v) Modulus of rigidity, G = 2.06 × 10⁵ N/mm
2 (7)
Figure 4 shows location of the roll centre.

Table 2. Transmission decision matrix.
Parameter CVT MT
Weight 1 0
Performance 1 1
Drivability 0 1
Reliability 0 1
Tuning 1 0
Simplicity 1 0
Ease of installation 1 0
Total 5 3
POWER TRAIN DESIGN
The power train is designed to transmit the power of the engine to the wheels and tyres. All efforts were made to make the power transmission as efficient and reliable as possible. This was done in a manner that would allow the power train system to be easy to operate, and reduce maintenance and maintenance cost.
The engine selected was the Lombardini 340 cc engine. Its specifications are listed below. Engine specifications – LGA 340 Bore × Stroke: 84 mm × 64 mm, single cylinder, air cooled. Swept volume: 338 cc. Compression ratio: 8:1. Rated power: 8 kW @ 4400 rpm. Max torque: 19 Nm @ 3000 rpm. Valve timing system: Belt driven single overhead camshaft. Lubrication: Forced lubrication vane pump. Lub oil: 15W40 CF4 multi grade oil. Lub oil capacity: 1.7 L. Starting system: Electric start with auto-decomp on camshaft. Electric system: 12 V, 18 amps flywheel mounted alternator. Recommended battery: 12 V, 44 Ah. Weight of engine: 30.5 kg. To begin the power train design process, determination of the type of transmission - manual or automatic, to be used was important. For an automatic transmission, continuously variable transmission (CVT) is preferable. Extensive research was carried out to compare the manual transmission (MT) and the CVT (Table 2).
The cost of each transmission was ignored in our decision matrix. This was done because the cost of a pre-manufactured CVT and assisting components would cost more than the MT and its components. However, the MT would require extensive machine work to make it adapt which would increase its cost and make it comparable to the CVT. Most MTs that would fit our application are found on motorcycles and four wheelers. These vehicles have a very high rpm range. A MT on these vehicles is beneficial because the operator can shift into a higher gear with the rpm at a high value. Since our engine has such a small range between 1300 and 3600 rpm, the performance gain by incorporating a MT is minimal. We felt that since the CVT allows our engine to constantly run near its maximum torque, it would give us the ability to get maximum power from the engine in both the high and low ranges. Also, operating the CVT is easier for the driver since the driver does not have to constantly shift gears. The performance gain of the MT happens only if the operator shifts gears at the optimal RPM, but if the operator does not then there is a significant loss of performance. By using the CVT we eliminate this possibility of error which greatly improves the
Nayak et al. 203 performance and reliability of the vehicle especially when it comes to endurance events. The CVT is designed to have infinite gear ratios between its high and low range (Heinz, 2002). A strong rubber belt is used to connect the drive pulley and the driven pulley. We chose the Polaris P-90 CVT. This CVT consists of the primary spring, cam weights, secondary springs, and secondary cam. These four parameters control nearly every aspect of the transmission such as engagement rpm, shift speed, acceleration rpm, belt grip, up shifting, back shifting, and many others. The ability to fine tune these parameters will allow us to make the CVT as efficient as possible. This CVT provides us with gear ratios of 3.83:1 in the low range and 0.76:1 in the high range. To connect the CVT to the engine and to our chosen gearbox, machining is required. This includes the boring out of the drive pulley to fit the engine shaft, and the splining of the gearbox input shaft to connect to the driven pulley of the CVT. To connect the CVT to the axles a chain driven system or a gear box can be used. We wanted to keep the efficiency and reliability of our power-train system high. Gears are the most efficient way of transmitting power. Having a chain in the system provides another area for failure with the possibility of the chain being knocked off of the sprockets. It also increases the maintenance of the system by having to constantly maintain the tightness of the chain as it stretches and having to replace the chain after extensive use.
The configuration of the vehicle is rear engine and rear wheel drive. For attaining a given speed in such a scenario, the only thing we can vary is the outer diameter of the driving tire. For 60 km/h, outer diameter of the tyre came out to be 16 inches. This diameter is too small as ground clearance decreases. Hence in order to counter this problem options available are: 1. Manipulation of power transmission outside the gear box using gears, sprockets and chain. 2. Engaging the reverse gear lever while driving in all the forward gears and using the first gear in forward as reverse gear. We decided to work on the latter option and so did reverse engineering process trying to find if the gears would be able to transmit the increased torque. Also following this method, 1. We were able to check the weight. 2. Reduce the cost of the vehicle as we avoided the use of additional gears, sprockets and chains. 3. We used standard parts, thus increased the reliability of the transmission system. To find the speed of the vehicle corresponding to different gear ratios, the formulae used is Velocity on road = (2 ×N×R×60) / (π×1000×G) km/h (8) Where, G = gear ratio. N = revolutions per minute. R = outer radius of the tyre in meters. BRAKING SYSTEM
The braking system was designed with the sole purpose of minimizing the stopping distance. Further, the simultaneous locking of all four wheels when the brake pedals were applied was given priority during design stage (Limpert, 1999).
Disc brakes were chosen over drum brakes owing to many advantages in the disc type. The disc brakes play a vital role in reducing the stopping distance and it works on all types of rugged terrain (wet and muddy road, etc).
Most of the components that make up the disc brakes such as the rotor, brake pad, calipers etc are all predefined and design of those

204 J. Mech. Eng. Res.
Table 3. Decision matrix to compare steering systems.
Parameter Hydraulic system Rotary cable Rack and Pinion Flag and shaft
Feedback 5 4 3 1
Lock-Lock ratio 5 2 5 3
Ease of operation 5 3 4 3
Maintenance 1 3 4 5
Cost 1 2 5 5
Total 17 14 21 17
Figure 5. Rack and Pinion aided Ackermann steering system.
components were not necessary. The type of hydraulic system used is front/rear hydraulic split. An independent braking unit is presently actuated by tandem master cylinder. The stopping distance after manual and simulated calculations using the brakes were found to be 4 m.
After finalising all the parts, the calculation for the stopping distance (Limpert, 1999) and the braking force was calculated using the following formula: F*s = mv
2/2 (9)
Where, F is the braking force in N, s is the stopping in metres, m is the mass of the vehicle in kg, v is the velocity of the vehicle in m/s. The braking force is calculated using the formula: Ƞ = (braking force)/(mass of the vehicle) (10)
Here, Ƞ is braking efficiency and is assumed to be 60%. STEERING DESIGN
We researched and compared multiple steering systems. We wanted a steering system that would provide easy operation, would be low in maintenance, provide excellent feedback, and be cost efficient. Table 3 is the decision matrix used to compare the different steering systems.
The main purpose of the steering is to provide the directional control of the vehicle. Based on our decision matrix, we chose to use the rack and pinion system (Heinz, 2002). It provides a good compromise between control and ease of use. If the ratio is high, the driver would have to turn the wheel several rotations to reach full lock. In the tight space of the vehicle, this is undesirable. If the ratio is too low, a slight movement will cause the wheel to turn (Richard and Jeffrey, 2004). This is undesirable because a bump in the trail could cause loss of control. We used Rack and Pinion aided Ackerman steering system (Figure 5) because of its low turning radius and comparatively greater stability than other mechanisms. Other

Nayak et al. 205
Figure 6. Tyre to be used.
reasons for choosing this type of steering is its light weight and low cost. It can be easily mounted in comparison to others.
The use of rack and pinion arrangement in some cars have variable ratio steering, which uses a rack and pinion gear set that has a different tooth pitch (number of teeth per inch) in the centre than it has on the outside. This makes the car respond quickly when starting a turn (the rack is near the centre), and also reduces effort near the wheels turning limits. The formula used for calculating the turning radius is 2*(L/Sin (90-A)) (11) We estimate out turning radius to be about 3.5 m approximately. BODY PANELS
The body panels are designed to protect the driver from objects entering the vehicle and to provide an appealing shell to fulfil the requirements of a frame. We provided a shell that is strong, durable and cost efficient. We also made sure that the shell provides easy access for vehicle components (Heinz, 2002).
We compared carbon fiber, fiberglass, and aluminum sheet for our design. Carbon fiber costs approximately 30% more than both fiberglass and aluminum sheet. That narrowed our decision to fiberglass and aluminum sheet. Fiberglass has the advantage of being able to be shaped into unique curves and designs that would give a vehicle an appealing look. A disadvantage of fiberglass is the fabrication time. It takes a lot of time to successfully mold fibreglass panels, to make them presentable, and to repair. On the other hand, aluminium sheet is easy to work but is limited in the number of curves
and shapes that can be incorporated. When comparing the weight of each material, it was found that the use of aluminum sheet will save almost 2 kg. Since fiberglass composites do not cause much of a weight reduction, we decided that the increased fabrication time of fiberglass was not justified. Thus 18 Gauge 5052 Aluminum sheet was chosen for all body panels. A firewall is necessary to keep the driver safe from any power-train fires and failures. This firewall is going to be constructed out of 23 gauge Aluminum sheet. A skid plate on the bottom of the cockpit is needed as well. This plate protects the driver from course obstacles that could protrude through the bottom of the frame. Fourteen gauge aluminum sheet has been chosen for the skid plate because of its strength and light weight. TYRES
Tyres are the most important part in any car design as they are the part which provides contact between the road and the vehicle. Road shocks are first absorbed by tyres and then transmitted to suspension. So tyres must withstand the shocks without decrease in performance. We have chosen the tire in such a way that it must provide traction in all kind of surfaces without slipping. We therefore chose tyres after careful deliberation (Figure 6) with specifications as follows: i. Enveloped dimension: 145/80R13, ii. Section width – 145 mm, iii. Aspect ratio – 80%, iv. Rim diameter – 330 mm, v. Section height = 116 mm, vi. Outer diameter = 562.2 mm.

206 J. Mech. Eng. Res.
Figure 7. Rod deformation.
OVERALL VEHICLE SPECIFICATIONS Basic dimensions i. Overall length: 2.368 m, ii. Overall width of roll cage: 0.950 m, iii. Overall height (including main roll hoop): 1.2 m, iv. Wheel base: 2.0 m, v. Wheel track: 1.5 m, vi. Ratio of total length to wheel base: 1.471:1, vii. Ground clearance: 0.21 m, viii. Gross vehicle weight: 220 kg.
Capacity
Seating capacity: 1 person Fuel tank capacity: 6 L Factor of safety: 2
ELECTRICAL SYSTEMS Certain electrical components that greatly improve the safety of the vehicle are installed. An easily accessible kill switch is installed on the vehicle to provide an easy and safe way to kill the motor by the driver. A brake/reverse light is installed to warn people when the brakes and reverse gear are engaged. The signal to the brake light is provided by a pressure switch in the brake line. The reverse light is engaged by a mechanical switch on the shifter. All electrical components are powered by a completely sealed 12 V DC dry cell battery that cannot leak in the event of a roll over (Heinz, 2002).
ACCESSORIES AND OTHER CONSIDERATIONS
Safety is the most important factor to consider when designing a
product. With this in mind, additional features are added to the vehicle that helps ensure the safety of the driver. These include the installation of a 5 point harness, a fire extinguisher mounted in the cockpit, and a gas tank splash shield (Heinz, 2002). The splash shield is fabricated to capture any leaking or spilled fuel that might occur during the re-fueling process. We also chose to use a steering wheel that is easily removed by pulling a release switch, then pulling outward on the steering wheel. This allows the driver to exit the vehicle rapidly in the case of an emergency (Richard and Jeffrey, 2004). Ergonomics and reliability are other considerations to be kept in mind. To ensure the comfort of the driver we align the steering wheel to be comfortably used by all drivers. For all fasteners we chose to use Grade 8 bolts because of their high strength and Grade 8 nylon lock nuts to ensure the reliability of all connections.
RESULTS AND DISCUSSION
Finite element analysis (FEA) of 150 mm rod section
Finite element analysis (FEA) of 150 mm rod section reveals rod deformation (Figure 7), stress analysis (Figure 8), translational displacement vector (Figure 9), and force components and total energy (Table 4).
Applied load resultant:
Fx = -1.573e-009 N Fy = -1.000e+003 N Fz = -4.657e-010 N Mx = 8.784e-009 N.m My = 6.134e-010 N.m Mz = -7.500e+001 N.m

Nayak et al. 207
Figure 8. Stress analysis.
Figure 9. Translational displacement vector.
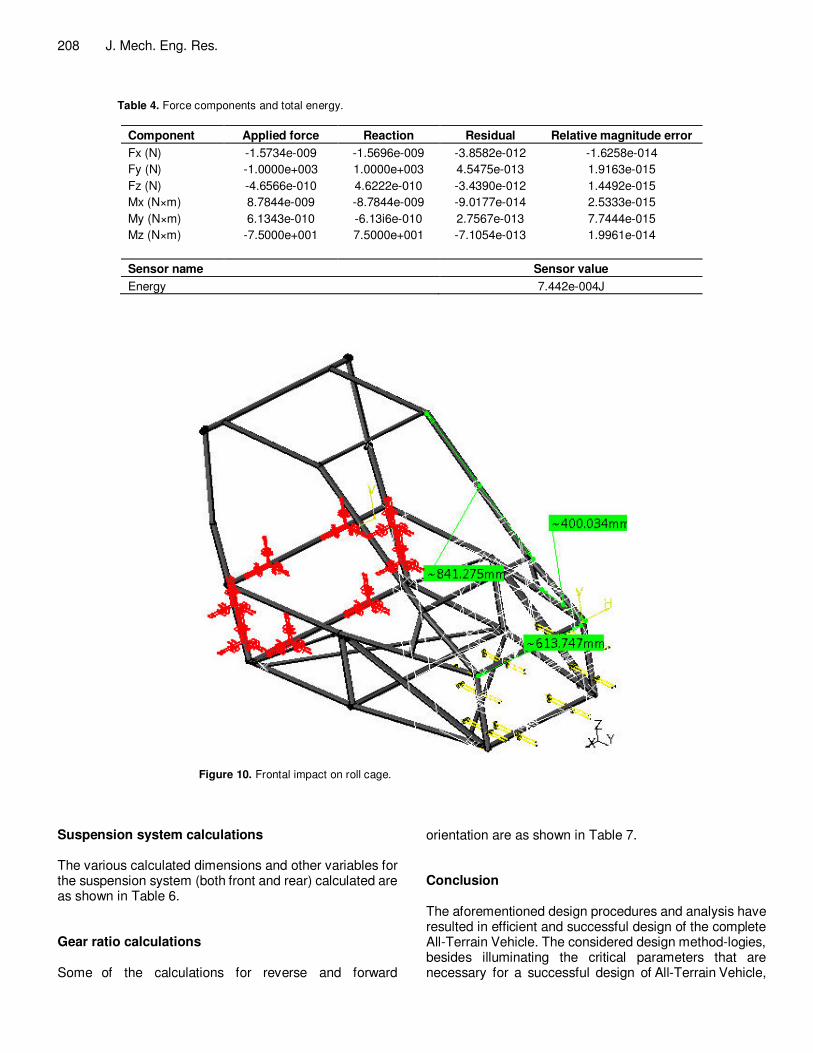
Frame design analysis results
Applied load resultant: Fx = 5.004e-008 N Fy = 5.000e+004 N Fz = -1.806e-006 N Mx = 7.104e+003 N.m My = 4.964e-007 N.m Mz = -1.567e+004 N.m
Figure 10 and Table 5, respectively shows frontal impact on roll cage, and force components for frontal impact.
Deformed mesh
Figures 11, 12, 13 and 14 reveals Von-mises stress 1, Von-mises stress 2, Deformed mesh 2, and Deformed mesh 3, respectively.
208 J. Mech. Eng. Res.
Table 4. Force components and total energy.
Component Applied force Reaction Residual Relative magnitude error
Fx (N) -1.5734e-009 -1.5696e-009 -3.8582e-012 -1.6258e-014
Fy (N) -1.0000e+003 1.0000e+003 4.5475e-013 1.9163e-015
Fz (N) -4.6566e-010 4.6222e-010 -3.4390e-012 1.4492e-015
Mx (N×m) 8.7844e-009 -8.7844e-009 -9.0177e-014 2.5333e-015
My (N×m) 6.1343e-010 -6.13i6e-010 2.7567e-013 7.7444e-015
Mz (N×m) -7.5000e+001 7.5000e+001 -7.1054e-013 1.9961e-014
Sensor name Sensor value
Energy 7.442e-004J
Figure 10. Frontal impact on roll cage.
Suspension system calculations The various calculated dimensions and other variables for the suspension system (both front and rear) calculated are as shown in Table 6. Gear ratio calculations Some of the calculations for reverse and forward
orientation are as shown in Table 7. Conclusion The aforementioned design procedures and analysis have resulted in efficient and successful design of the complete All-Terrain Vehicle. The considered design method-logies, besides illuminating the critical parameters that are necessary for a successful design of All-Terrain Vehicle,

Nayak et al. 209
Table 5. Force components for frontal impact.
Component Applied force Reaction Residual Relative magnitude error
Fx (N) 5.0037e-008 -1.0991e-007 -5.9878e-008 9.0715e-012
Fy (N) -5.0000e+004 5.0000e+004 5.3609e-008 8.1218e-012
Fz (N) -1.8058e-006 1.8574e-006 5.1520e-008 7.8052e-012
Mx (N×m) -7.1045e+003 7.1045e+003 -3.7515e-008 3.2975e-012
My (N×m) 4.9636e-007 -5.0808e-007 -1.1721e-008 1.0303e-012
Mz (N×m) -1.5673e+004 1.5673e+004 -3.7935e-008 3.3344e-012
Figure 11. Von-mises stress 1.
provides a circumspective approach for the design of each component integrated to the vehicle. Appendix Figures 1, 2 and 3 show different views of the All-Terrain Vehicle. Thanks to the design and analysis software packages that have greatly enhanced the accuracy in computation of design variables. The finite element analysis of rod section showing the stress distribution of the considered rod
material and the frame analysis of the roll cage gives promising results for effective design. Thus this article throws light on design parameters that are considered by optimal and reliable techniques and can be used as reference for the successful fabrication of an All-Terrain Vehicle that is promising on grounds of all technical aspects and cost-effectiveness.

210 J. Mech. Eng. Res.
Figure 12. Von-mises stress 2.
Figure 13. Deformed mesh 2.

Nayak et al. 211
Figure 14. Deformed mesh 3.
Table 6. Suspension parameters (front and rear).
Suspension parameter
Diameter of wire (mm)
Mean diameter (mm)
Pitch (mm)
Load (N) Coils (n)
Front 7.778 66.113 21.819 381.318 14
Rear 10.514 89.369 24.55 696.682 13
Table 7. Calculations for reverse and forward orientation.
Calculation Final gear ratio Speed
First 31.45:1 0.65D
Second 18.70:1 1.109D
Third 11.40:1 1.82D
Fourth 7.35:1 2.82D
Fifth 55.08:1 0.38D
REFERENCES Heinz H (2002). Advanced Vehicle Technology.
Butterworth-Heinemann., Woburn, MA, pp. 311-367. Herb A (1993). Chassis Engineering. HP Books, The Berkley Publishing
Group, New York. pp. 73-84.
Limpert R (1999). Brake Design and Safety, Society of Automotive Engineers, Warrendale. pa, pp. 125-320.
Michael C, David P (1965). Racing and Sports Car Chassis Design. BT Batsford Ltd., London. pp. 56-88.
Richard S, Jeffrey KB (2004). Automotive Engineering Fundamentals. SAE International., Warrendale, pa, pp. 275-279.
Srinivasan A (2006). Automotive Mechanics. Tata McGraw-Hill Publications., New Delhi, pp. 57-84.

212 J. Mech. Eng. Res. Appendix: Views of the all terrain vehicle.
Figure 1. Front view of all terrain vehicle.
Figure 2. Side view of all terrain vehicle.
Figure 3. Isometric view of all terrain vehicle roll cage assembly.