hollow cylinder testing at sintef - cfmr … · the origins of hollow cylinder testing ......
TRANSCRIPT

HOLLOW CYLINDER TESTING AT SINTEFPierre Cerasi

Outline
• The origins
• Sand production
• Shale hole stability
• Chalk liquefaction
• Shale creep
2

The origins of hollow cylinder testing
• Formation Physics laboratory established in 1983
• Established to help with borehole stability and solids production problems• Through laboratory experiment based predictive model building
• Early tests looked at cavity• Later simplified to hollow cylinder
3

Hollow cylinder test system
4
• SBEL large sample cell (108 MPa) • Sample size of 2’’, 4’’ or 8’’ diameter• Sand detection system can be added • Internal and external deformation measurement
devices • High-capacity fluid flow system (4 l/min at 40 MPa) • Radial and/or axial flooding of samples
SBEL

5
HC deformation: steps to failure
• First step: elastic deformation• Limited deformation regime
• At some point, microcracks develop (end of linear elastic deformation)
• Growth of a plastic zone from the borehole outwards• Relieves stresses at borehole face
• Screens far-field anisotropic stresses
• Buckling at the borehole surface• Bifurcation from isotropic radial deformation to buckling
• Initiates cracking around the borehole
• Development of shear bands and tensile cracks• Rock rupture occurs as development of shear bands and exfoliation
• Surface parallel cracking and shear banding are dominant failure modes
[Vardoulakis, Sulem & Guenot, 1988]

6
Standard sand production test on HC plug
Fluid inlet
Sand trap
Sand trap
From field core Outcrop

7
HC test procedure and typical output
• Confining stress increased in steps
• For each step, fluid flow rate increased in steps
• If no sand, flow rate increased
• If sand, wait until no more sand produced
Fluid flow rate
StressFlow rate External
radial stress
Time
8
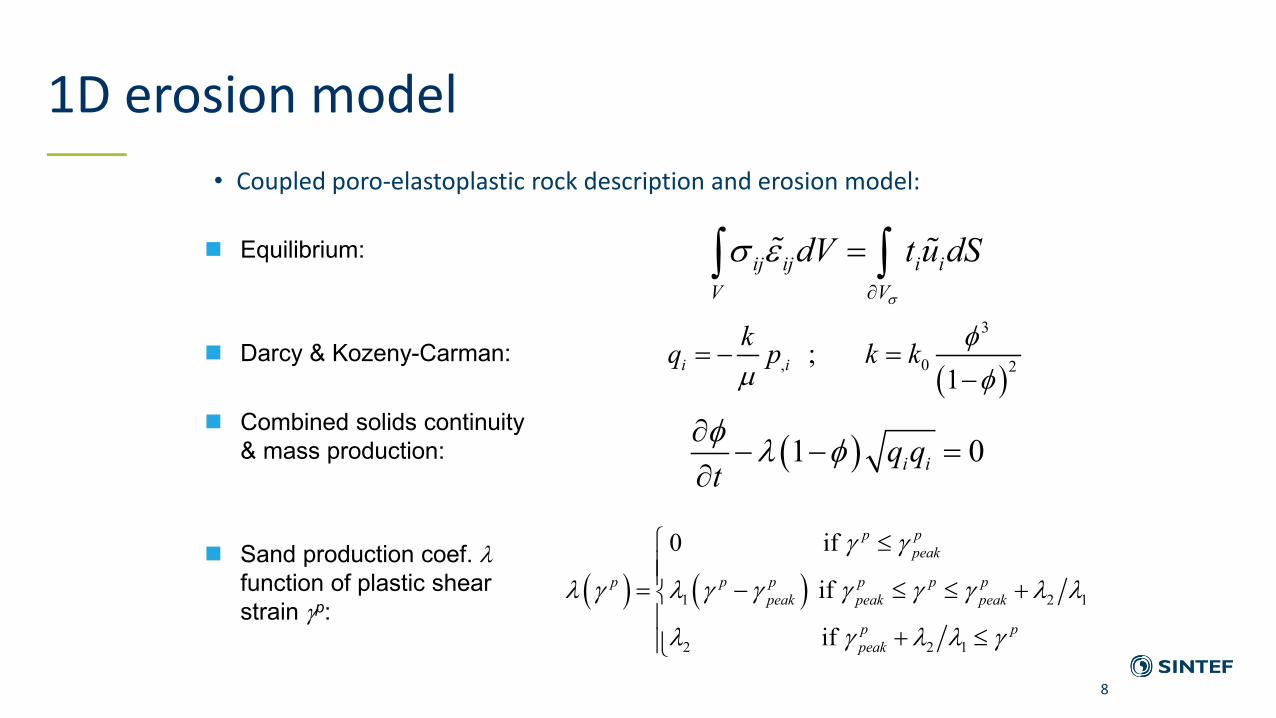
1D erosion model• Coupled poro-elastoplastic rock description and erosion model:
( )
3
, 0 2 ; 1i i
kq p k k φµ φ
= − =−
ij ij i iV V
dV t u dSσ
σ ε∂
=∫ ∫
( )1 0i iq qtφ λ φ∂− − =
∂
( ) ( )1 2 1
2 2 1
0 if
if
if
p ppeak
p p p p p ppeak peak peak
p ppeak
γ γ
λ γ λ γ γ γ γ γ λ λ
λ γ λ λ γ
≤= − ≤ ≤ +
+ ≤
Equilibrium:
Darcy & Kozeny-Carman:
Combined solids continuity & mass production:
Sand production coef. λfunction of plastic shear strain γp:

9
1D Analytical sand model version
• Simplifying assumption: the rock framework is unaffected by erosion until the porosity has reached a critical value φc - then it collapses.• Repeated cycles of erosion & collapse.
• Porosity within sand producing zone:
• Average sand production rate = sand volume within sand producing zone divided by time between each collapse:
• At constant drawdown above the critical limit, the average sand production rate may increase slowly with time.
• Eventually, or alternatively, the sand production may stop after a while.
( ) ( )( )1 1c
s fl fl oq q t to e λ
φ φ− − −
= − −
04 4
0
1with 4 , 2s cc
P S LRφλ πφ φ−
= =−( )0
0
Cs s c
D DM RP Q S qC
µ −= −

10
2D Friction dominated flow model
• Link between rock failure and sand transport
• Analytical model based on friction-collision transition
• Assumes initial required state: plastic zone with shear bands
• Sand flow arises in shear bands
• Fully mobilised friction between grains needed
• Flow occurs in post-peak rock environment• (residual strength, cohesion, friction angle, …)

11
Bounds on sand production estimate
• Lower bound:• only single shear bands active
• Higher bound:• complete collapse of plastic zone• due to wholescale fluidisation• due to interaction between all SB, enclosing breakouts
• Probable actual state:• anywhere between LB and HB, depending on rock
type and failure
Cylindrical tunnel restricted to
centre of plug
Rectangular slit spanning whole
plug height

12
Coupling particle flow to porosity change
• Rate of production coupled to changing porosity:
• Permeability calculation:
( )1s p sM Q ρ φ= −
( )( ) 1
11 s slit t s t
ts slit
Vol dMVol
ρ φφ
ρ+
− −= −
( )
32
2180 1t
SBt
ak φφ
= ⋅−
o it
c i o c
SB
R Rk R R R Rk k
−=
− −+

Sand grains or flakes?• High porosity, low strength sandstones tend to produce individual sand
grains• A sieve analysis of the crushed sample gives a good estimation of what to expect
• Lower porosity, higher strength sandstones tend to produce flakes, especially if there is a substantial amount of clay cementation• But on arrival of water breakthrough, there may be a transition to individual grain production
13

Sand grains
14

Flakes
15

Effect of 2-phase saturation
• Comparison of 1-phase and 2-phase saturation• Water breakthrough effect on sand rate
16

SandPredictor
17

SandPredictor
18

Borehole stability in shales
• Straining of borehole wall of shale:• Osmosis
• Ion exchange
• Thermal effects
19

Formation anisotropy• By default, cores are taken axially along the well path• Some formations are markedly anisotropic• Both in permeability and strength
• One then needs to take out plugs in the relevant direction
• This is often impossible if the core diameter is small
• If possible, repeat testing should be performed at different plug axis angle to formation bedding, to cater for other well orientations
• Bedding angle may affect borehole failure mode (shear, tensile) and caving/breakout size and shape (more relevant for cap rock then most sandstones)
20

Dynamic borehole stability• Simulation of swab and surge effects• Rotation of drillstring with stabilizer
• Scaling down from field to laboratory:
21

Additional fracturing of borehole wall
• Effect of drillstring RPM on shale fracturing studied• Increased RPM leads to longer radial extension of fractures
22

PSI software
• Calculates mudweight window• Based on log input
• Takes into account time-dependent effects
• Weak planes
• Different failure models
• Simple plasticity
23

Chalk liquefaction: triaxial tests
• Water weakening in some chalks
• Pore collapse behaviour
• Used to calibrate elasto-plastic model(s)
24

Chalk liquefaction: HC tests
• Drawdown & depletionHC tests with oil & brinesaturation
25

Chalk liquefaction vs. breakouts
26
Liquefaction failure in brine DD test Breakout failure with radial cracks in brine depletion test

Chalk model (E. Papamichos)
• Tensile criterion for DD-induced liquefaction :
• Similar plastic shear criterion as in sand production for depletion-induced breakouts
• Elasto-plastic modified Mohr-Coulomb with pressure cap:• Numerical solutions, hardening/softening and destructuration,
pore collapse• Kozeny-Carman permeability with added parameter for pore
collapse27

Acidizing in chalk
28

Effect of acid on solids production
• HC solids production tests
• Wormholes crushed onlynear wellbore
• More pronounced strengthreduction for DD tests
29

Creep
• Time dependent strain at constant stress related to solid skeleton• Visco-elastic/plastic deformation process
• Governed by propagation of µ-fractures
30Fjær E. et al., Petroleum Related Rock Mechanics, 2nd ed., 2008.

Shale creep as healing mechanism
• Interesting for P&A
• µannulus healing in WI for CCS
31

Nature's own solution
32
pressure
perm
eabi
lity
Cylindrical shale sample creeping towards pipe
Selected field shale
Outcrop shale
Pores/cracks Steel pipe Intact shale
Good barrier!
Poor barrier!
E. Fjær et al. (2016), How creeping shale may form a sealing barrier around a well, Am. Rock Mech. Assoc., ARMA 16-482.

Technology for a better society