holocene paleoclimate records from a large california ... science reviews 25 (2006) 1570–1598...
TRANSCRIPT
ARTICLE IN PRESS
0277-3791/$ - se
doi:10.1016/j.qu
�CorrespondE-mail addr
Quaternary Science Reviews 25 (2006) 1570–1598
Holocene paleoclimate records from a large California estuarine systemand its watershed region: linking watershed climate and bay conditions
Frances P. Malamud-Roama,�, B. Lynn Ingrama,b, Malcolm Hughesc, Joan L. Florsheimd
aDepartment of Geography, UC Berkeley, Berkeley, CA 94720, USAbDepartment of Earth and Planetary Science, UC Berkeley, Berkeley, CA 94720, USA
cLaboratory of Tree-Ring Research, UA Tuscon, Tuscon, AZ, 95721, USAdGeology Department, UC Davis, Davis, CA 95616, USA
Received 15 December 2004; accepted 10 November 2005
Abstract
The San Francisco Bay-Delta system includes a watershed that covers a large area of California and provides water to two-thirds of
the State’s population. Climate over the estuary and its watershed in the dry summer months is controlled by the subtropical high which
dominates and deflects storms from California. The subtropical high weakens and migrates south as the Aleutian Low strengthens,
bringing wet winter storms to the region. Paleoclimatic records from the Bay and its greater watershed, spanning the Holocene, are
reviewed here in order to better understand natural variations of precipitation and runoff and the linkages between those variations and
the salinity and ecosystems of the estuary. To better understand regional-scale climate patterns, paleoclimate records from coastal
California and the Great Basin are also considered. Large fluctuations in climate have occurred during the period of interest, and there is
generally good agreement between the paleoclimate records from different regions. Early Holocene climate throughout California was
marked by rising temperatures and reduced moisture as seen in fire records from the watershed. This warmth and aridity peaked about
5000–7000 years ago and was followed by a cooling trend, with variable moisture conditions. The Estuary formed relatively rapidly in
response to a high rate of sea level rise that dominated the Holocene until about 6000 years ago, and the subsequent reduced rate of
inundation allowed vast tidal marshes to form along the edges of the estuary, which have since been recording changes in environmental
conditions.
The impacts of changing regional climate patterns are experienced in the San Francisco Bay-Delta system, as altered fresh water flows
result in altered estuary salinity. For example, approximately 3800 cal yr B.P., records from throughout the state indicate a cool, moist
period, and Bay salinity was reduced; this period was followed by a general drying trend throughout California over the last two
millennia, punctuated by decades to centuries-long droughts and brief, extremely wet events. In particular, during the period
ca. 1000–800 cal yr B.P. (A.D. 950–1150) conditions seem to have been unusually dry in many parts of the watershed, reducing the fresh
water flows to the estuary, and shifting tidal marsh plant assemblages toward less diverse, but more salt-tolerant plants. In contrast, the
Little Ice Age (ca. 550–200 cal yr B.P.) brought unusually cool and wet conditions to much of the watershed, and lowered salinity in the
Bay. Many reconstructions suggest that notably stable conditions have prevailed over the instrumental period, i.e., after ca. A.D. 1850,
even including the severe, short-term anomalies experienced during this period. Interdecadal variability is common in many of the
records, with timescales of ca. 55, 70, 90, 100, 150, and 200 years.
r 2006 Elsevier Ltd. All rights reserved.
1. Introduction
For most of the Holocene (the last 10,000 years), the SanFrancisco Bay-Delta region has provided a relativelycomfortable home for human populations, with reliable
e front matter r 2006 Elsevier Ltd. All rights reserved.
ascirev.2005.11.012
ing author. Tel.: +15106422381; fax: +15106423370.
ess: [email protected] (F.P. Malamud-Roam).
resources and a mild climate (Fagan, 2003). Approximately8.9 million people (US Census, 2000) live and work in the12 counties that surround the San Francisco Bay-Deltatoday, making this region an important population andeconomic center in the state of California. The greaterwatershed of the estuary supplies freshwater to 20 millionpeople. During the past two centuries, the San FranciscoBay estuary and its watershed have undergone major
ARTICLE IN PRESS
PacificOcean
40°
35°
124° 120° 114°
Tree ring Sites
ITRDBCALFED Blue Oak
Tree ring recon.
Site Locations
Flood plain
Great Basin
Coastal
Sierran lake
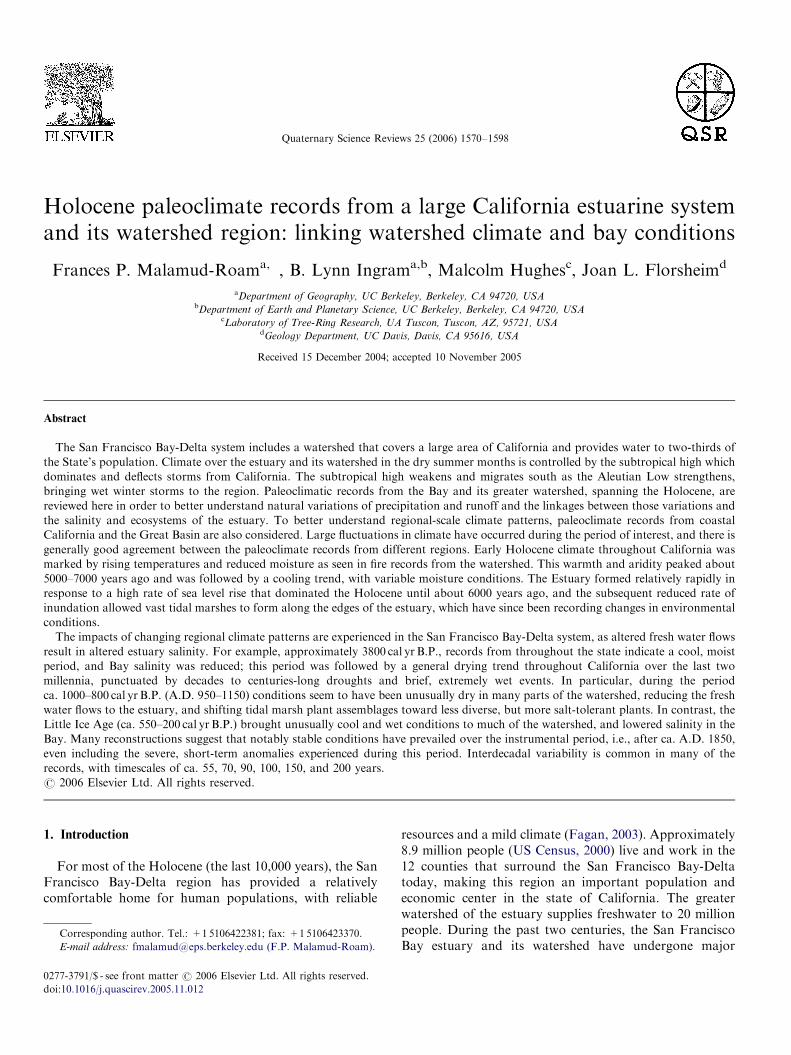
Fig. 1. Map of the study area: San Francisco Bay, California estuary and
its watershed. The watershed is comprised of the Sacramento river basin in
the north and the San Joaquin river basin in the south. Paleoclimate study
sites throughout the San Francisco Bay/Delta system and its watershed.
Symbols may reflect multiple sites. Also shown are sites along Coastal
California and in the Great Basin.
F.P. Malamud-Roam et al. / Quaternary Science Reviews 25 (2006) 1570–1598 1571
human-caused changes, including damming and diversionof major rivers, filling and diking of surrounding wetlands,and extensive land-use changes (Nichols et al., 1986; SFEP,1992). As a result, it has been difficult to describe thenatural state of the estuary, including the character ofnatural variations of river inflows to the estuary, naturalsalinity, and natural ecosystems. Improvements in ourunderstanding of the long-term (decades to millennia)natural variations of the estuary can provide an importantcontext for interpreting human-caused changes in theestuary, for setting restoration targets for habitats, forestimating the limits of the various resource systems thatdraw from the estuary and watershed, and for evaluatingthe risks from global climate changes.
1.1. Setting
The San Francisco Bay estuary consists of a series ofbedrock basins with constricting narrows, or straitsconnecting them. Pacific Ocean water enters the Bay atthe first of these constrictions, the Golden Gate, and inlandof this lies the Central Bay, followed upriver to the northby San Pablo Bay, Carquinez Strait (a second bedrockconstriction), Suisun Bay and the Delta where theSacramento and San Joaquin rivers meet (Goals Project,1999; Malamud-Roam et al., in press). The estuary drainsmuch of the northern half of California (over 40% of thestate, Peterson et al., 1989). Fresh water inflow largelydetermines the health of the estuary ecosystems and, incombination with sea level variations, the salinity of Baywaters (Jassby et al., 1995; Peterson et al., 1995, 1996;Dettinger and Cayan, 2003). The interaction of fresh riverwater and saline ocean water creates an environment withseasonally and inter-annually varying salinity conditions,to which the organisms within the Bay ecosystems haveadapted (Josselyn, 1983).
California’s Mediterranean climate, with wet winters anddry summers, affects the timing of fresh water flows intothe Delta and estuary. The volume of delta flow is greatestin the winter months, as 55% of California’s annualprecipitation typically falls over the state during themonths of January, February and March (Peterson et al.,1995) in the form of rain over lower elevations and snow athigher elevations. The higher elevation snow pack providesnatural storage that releases flows into rivers contributingto the Bay during the dry warm-season months. Inresponse to seasonal changes in flows, Bay salinityfluctuates between fresher conditions in the winter andspring, and saltier conditions in the summer and fall. Inaddition to these seasonal changes, precipitation andriver inflow vary inter-annually with changes in regionalclimate. Variations in precipitation on interannual time-scales have had dramatic consequences for the state: inthe winter of 1861 massive flooding inundated theCentral Valley, forming ‘‘an immense, quiet inland sea ahundred miles long’’ that did not drain until the lateSpring (Kelley, 1989). This flooding initiated the Califor-
nia’s history of flood control management, a complexsystem-wide series of dams, levees, weirs, and bypasschannels. Though their impacts appear less immediatelydramatic, droughts similarly threaten the state. The1976–77 resulted in losses of an estimated $2.6 billion tothe state’s economy (CDWR, 1978), and Nichols et al.(1990) argue that the combination of extreme precipitationin 1986, followed by drought lasting from 1987 to 1992,may have weakened Bay ecosystems causing them to bemore susceptible to invasion by the Asian clam, Potamo-
corbula amurensis.The watershed of San Francisco Bay-Delta (Fig. 1)
system encompasses the western slopes of the SierraNevada Range, the southern slopes of the southernCascade Mountains, parts of the Klamath and CoastRanges, and the Central Valley. At 153,000 squarekilometers, the San Francisco Bay watershed is almost
ARTICLE IN PRESSF.P. Malamud-Roam et al. / Quaternary Science Reviews 25 (2006) 1570–15981572
half the size of California (Atwater et al., 1977) and isvitally linked to estuarine ecosystems, delivering freshwater, nutrients and sediments via rivers and streams andprovides critical spawning grounds and migration routesfor salmon, trout, and other anadromous fish. Climate,hydrology, geology, and topography vary dramaticallyover the length and width of the watershed and interact todetermine the amount and timing of fresh water deliveredto the Bay. The Sacramento River basin supplies about85% of San Francisco Bay’s fresh water, fed mostly byrainfall runoff from storms on the western slopes of themedium altitude, relatively warm northern Sierra Nevada,while the San Joaquin River drains the southern portion ofthe watershed, mostly in the form of spring snow melt offthe southern Sierra Nevada, contributing about 15% of theinflow (Peterson et al., 1989).
San Francisco Bay is closely linked through itswatershed with global and regional climate processes(Peterson et al., 1989, 1995). Variations of annualprecipitation in California are related to changing patternsof winter-spring atmospheric circulation over the NorthPacific Ocean and the tropics, including variations of El
38°
PacificOcean
Tidal wetland ca. 1850
Si
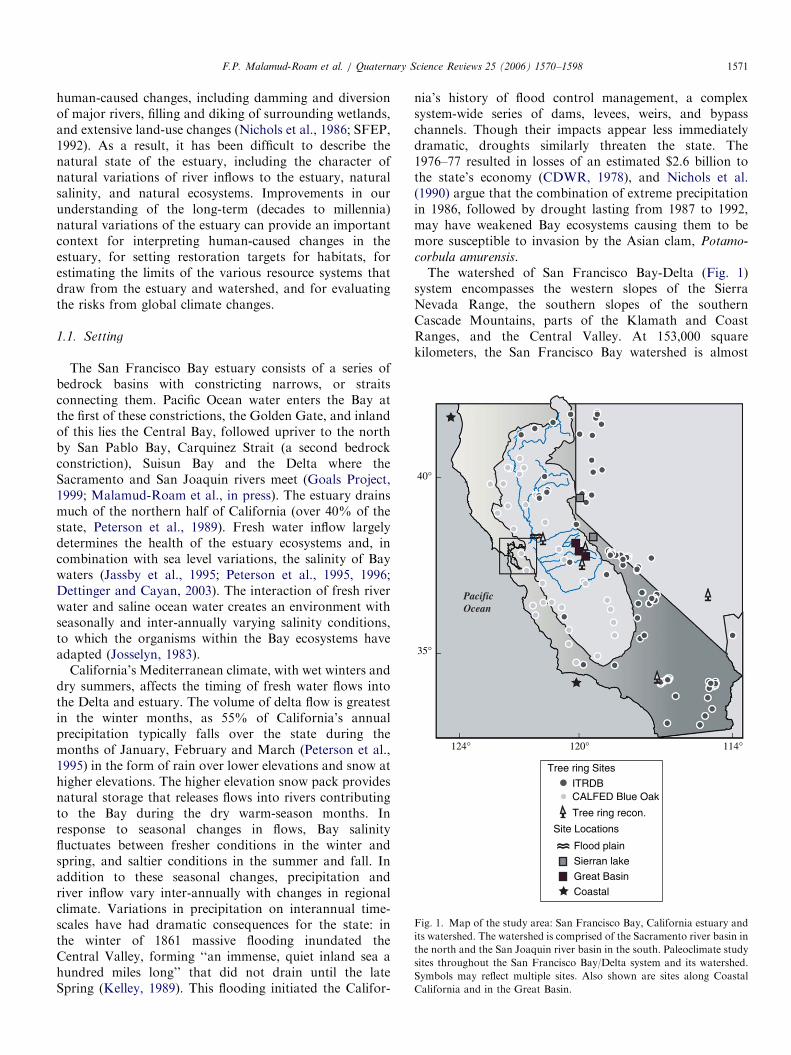
Fig. 2. Map of San Francisco Bay showing the Golden Gate where seawater en
locations.
Nino/Southern Oscillation (Cayan and Webb, 1992).Central California is similarly the transition zone for themulti-decadal ENSO-like expressions of the Pacific Dec-adal Oscillation (PDO; Mantua et al., 1997; Benson et al.,2003) and for other shorter and (especially) longer termclimatic influences that are less understood. Superimposedon these natural climate fluctuations are recent warmingtrends in winter-spring temperatures (Cayan et al., 2001)and associated snowmelt-and streamflow-timing trends(Roos, 1991; Dettinger and Cayan, 1995; Mote, 2003;Stewart et al., 2005). These variations in climate over thewatershed are the primary controls on natural variations ofsalinity in San Francisco Bay (Cayan et al., 1999; Dettingerand Cayan, 2003).The goals of this paper are: (a) to review the variety of
paleoclimatic resources for the San Francisco Bay andwatershed in order to identify major climate variations inthe pre-industrial past, and (b) to compare the recordsfrom the larger watershed region with the Bay records inorder to determine the linkages between climate experi-enced over the larger watershed region and conditions inthe San Francisco Bay. The resulting depiction of the past
122°
San Joaquin River
Sacramento River
10 kmN
Nichols, et al., 1986
te Locations:
Bay cores
Tidal marsh cores
ters, the Delta where San Joaquin and Sacramento rivers enter and coring
ARTICLE IN PRESSF.P. Malamud-Roam et al. / Quaternary Science Reviews 25 (2006) 1570–1598 1573
climates of the estuary and watershed provide importantcontexts for development of scenarios of future climatesand climate changes in the estuary, by illustrating the rangeof natural climatic variations upon which human-inducedclimate changes are likely to be superimposed.
1.2. Natural history of the San Francisco Bay
The modern Bay estuary began forming sometimebetween 10,000 and 8000 years ago as rising sea levelentered the Golden Gate (Atwater et al., 1979). After aninitial period of rapid rise following the last glacial period,global rates of sea level rise slowed ca. 6000 years B.P.(Fairbanks, 1989). Tidal marsh formation and develop-ment around the San Francisco Bay has been controlled byrelative sea level rise (less than 2mm/yr, Atwater, 1979),with no evidence of significant tectonic controls (Atwater etal., 1979; Goman and Wells, 2000).
Humans have occupied the surrounding tidal marsh-lands of the San Francisco Bay estuary for more than 5000years (Ingram, 1998; Fagan, 2003). The growth inpopulation accompanying the Gold Rush era led to therapid loss of tidal wetlands around the Bay and Delta,which were diked for agriculture, salt ponds, and housingwith a total loss of over 85% of the original (i.e., pre- A.D.1850) acreage (Nichols and Wright, 1971; Atwater, 1979),some of that offset by new marshes around San Pablo Baycreated from hydraulic mining sediments washed in fromthe Sierra Nevada (Atwater et al., 1979; Jaffe et al., 1998).Efforts in the latter half of the 20th century have been toprotect wetland habitat, and mitigate any losses of tidalwetlands as part of the Clean Water Act of 1977 (amended)(Fig. 2).
2. Paleoclimate approaches and archives
In this review, the watershed of the San Francisco Bay isdivided into two sub-regions: the Sacramento drainage inthe north, and the San Joaquin drainage in the south andwe review sites beyond the watershed, such as off-coastalsites and the Great Basin that reflect broad-scale climateevents (Fig. 1). Paleoclimate reconstructions of precipita-tion, temperature and vegetation variations span the pastseveral thousand years (see Table 1 (Friddell et al., 2003;Mensing et al., 1999; Soutar and Crill, 1977)).
2.1. San Francisco Bay watershed
2.1.1. Central Valley lowland floodplain archives
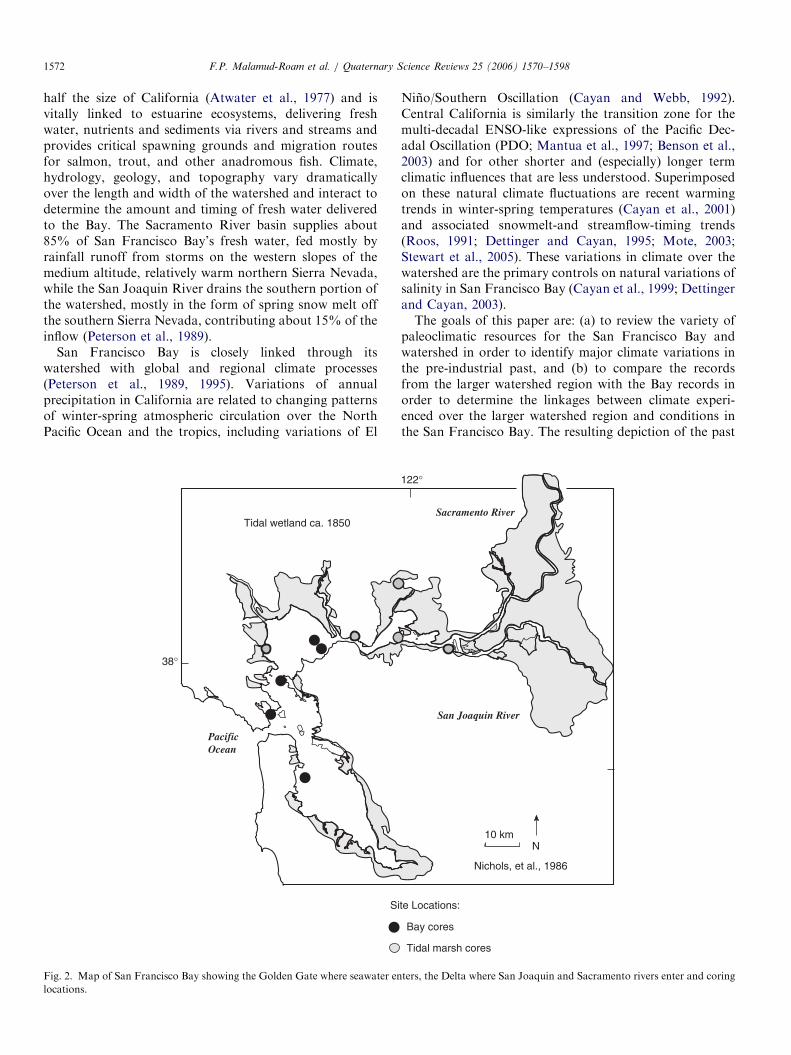
Lowland Central Valley rivers are influenced by climatechange through both upstream watershed hydrology anddownstream sea level fluctuations. Changes in climateconditions have affected river processes and forced changesin floodplain sedimentation styles and paleo-landforms.These paleo-landforms include main and secondary chan-nels, over-bank deposits, alluvial levees, crevasse splays,abandoned channels and oxbows, and seasonal and
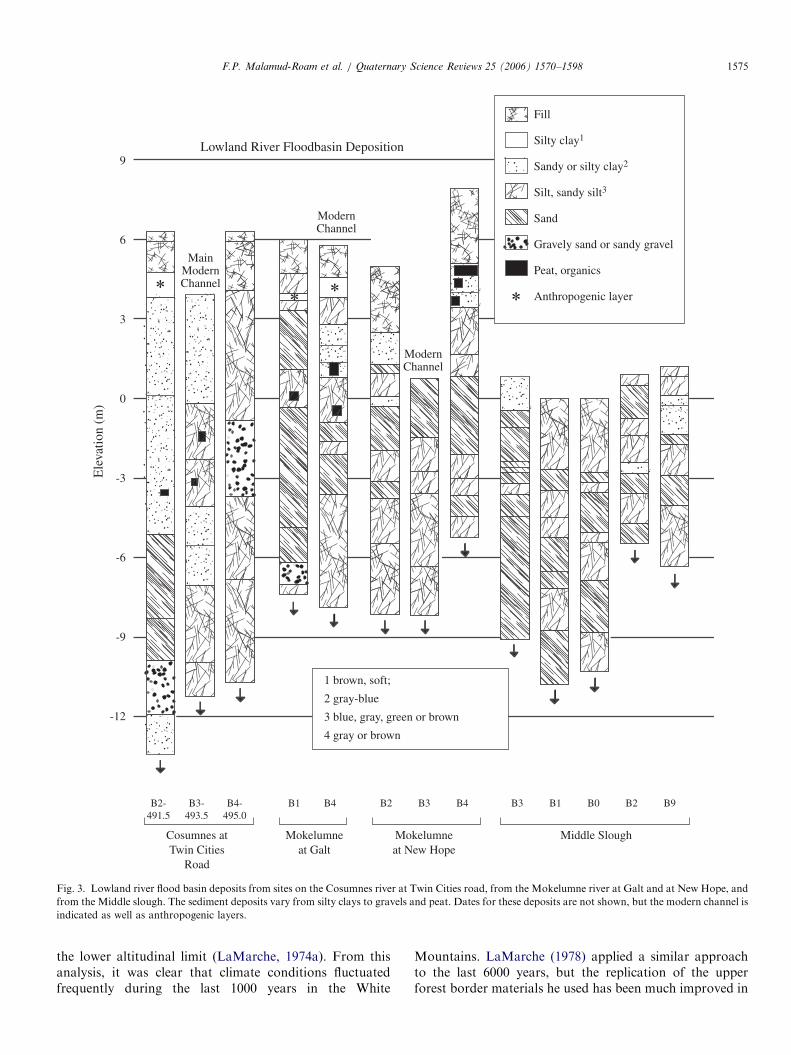
perennial lakes, marshes, and inter-channel wetlands(Gilbert, 1917; Bryan, 1923; Olmsted and Davis, 1961;Brice, 1977; Atwater and Marchand, 1980; Preston, 1981;Sullivan, 1982; Atwater et al., 1986; Florsheim and Mount,2002, 2003). Sediment assemblages, particle size distribu-tions, and stratigraphy within these landforms providearchives of paleoclimate variability and change in lowlandparts of the San Francisco Bay watershed (Fig. 3). Forexample, analysis and dating of floodplain stratigraphy (oforganic-rich and clayey sediment) is a powerful tool forassessing paleoflood magnitude and frequency (Kochel andBaker, 1988; Baker et al., 2002), which can be sensitive toclimate change (Knox, 1993).Holocene sea-level rise created freshwater tidal marsh
over floodplain deposits in the Delta (Brown andPasternack, 2004) and upstream floodplain aggradationcreated blocked tributary valley lakes (Florsheim andMount, 2002) near the margins of the Delta. These lakes,formed at the boundary between Pleistocene glacialoutwash fans and Holocene floodplain deposits (Atwaterand Marchand, 1980), are dendritic, layered with clay, silt,and sand in fluctuating proportions (Strudley, 2001). Basinsubsidence and Quaternary glacial outwash depositscreated large lakes, like Tulare and Buena Vista lakes, inthe southern San Joaquin Basin (Atwater et al., 1986).Prior to anthropogenic disturbances, lake levels andlacustrine sedimentation fluctuated with climate (Preston,1981).Geomorphic surfaces formed during past river regimes
and floods, such as discontinuous low terraces or higherfloodplain surfaces, indicate maximum flood stages (Le-vish, 2002) and are proxies for climate change andvariability in the Central Valley. Archaeological artifacts,pollen, and charcoal found immediately above suchsurfaces are used to date these flood events to aidpaleoclimate reconstructions.
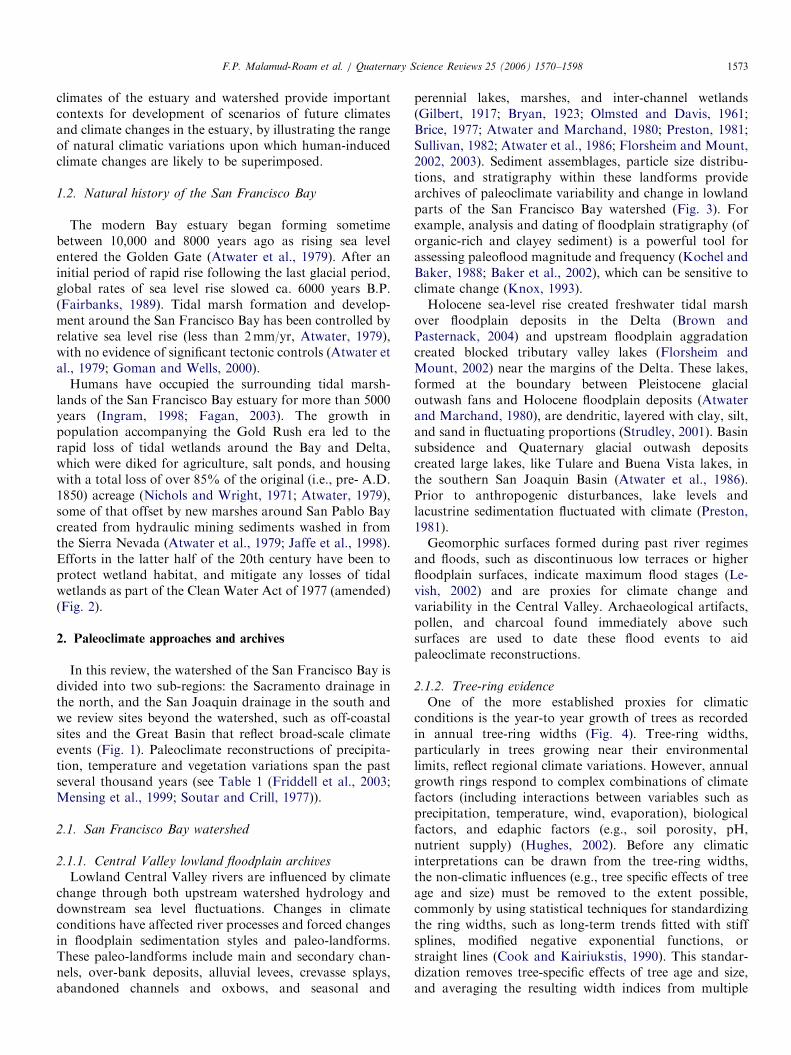
2.1.2. Tree-ring evidence
One of the more established proxies for climaticconditions is the year-to year growth of trees as recordedin annual tree-ring widths (Fig. 4). Tree-ring widths,particularly in trees growing near their environmentallimits, reflect regional climate variations. However, annualgrowth rings respond to complex combinations of climatefactors (including interactions between variables such asprecipitation, temperature, wind, evaporation), biologicalfactors, and edaphic factors (e.g., soil porosity, pH,nutrient supply) (Hughes, 2002). Before any climaticinterpretations can be drawn from the tree-ring widths,the non-climatic influences (e.g., tree specific effects of treeage and size) must be removed to the extent possible,commonly by using statistical techniques for standardizingthe ring widths, such as long-term trends fitted with stiffsplines, modified negative exponential functions, orstraight lines (Cook and Kairiukstis, 1990). This standar-dization removes tree-specific effects of tree age and size,and averaging the resulting width indices from multiple
ARTICLE IN PRESS
Table 1
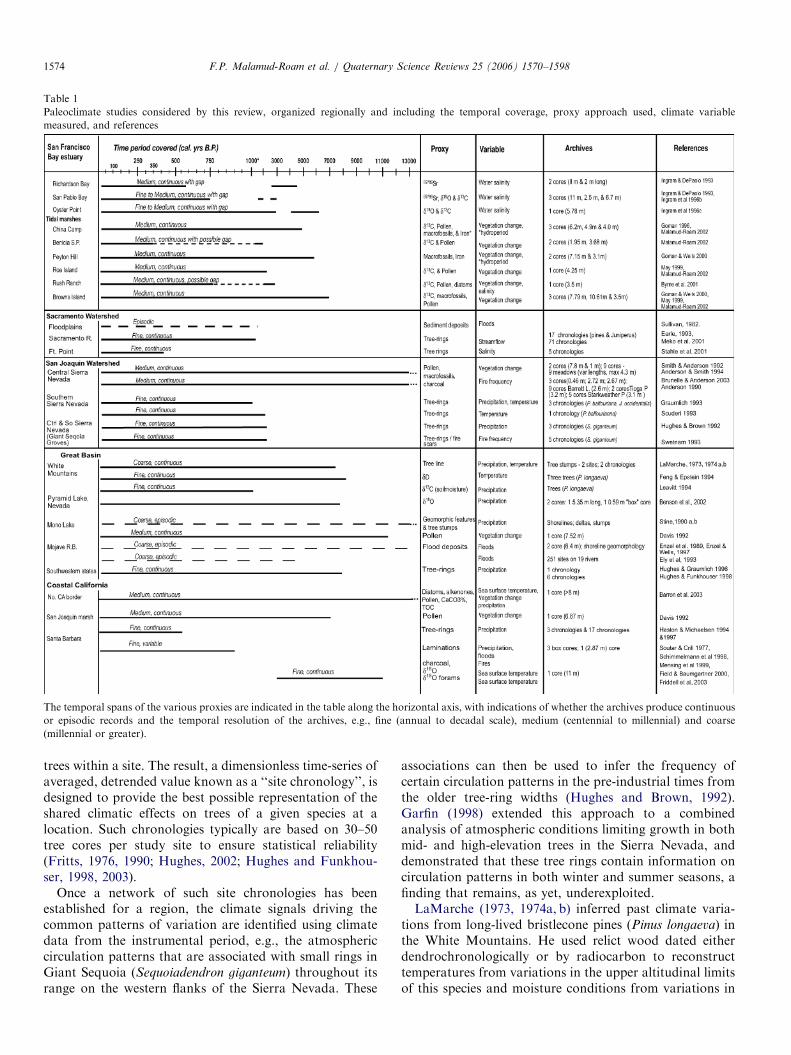
Paleoclimate studies considered by this review, organized regionally and including the temporal coverage, proxy approach used, climate variable
measured, and references
The temporal spans of the various proxies are indicated in the table along the horizontal axis, with indications of whether the archives produce continuous
or episodic records and the temporal resolution of the archives, e.g., fine (annual to decadal scale), medium (centennial to millennial) and coarse
(millennial or greater).
F.P. Malamud-Roam et al. / Quaternary Science Reviews 25 (2006) 1570–15981574
trees within a site. The result, a dimensionless time-series ofaveraged, detrended value known as a ‘‘site chronology’’, isdesigned to provide the best possible representation of theshared climatic effects on trees of a given species at alocation. Such chronologies typically are based on 30–50tree cores per study site to ensure statistical reliability(Fritts, 1976, 1990; Hughes, 2002; Hughes and Funkhou-ser, 1998, 2003).
Once a network of such site chronologies has beenestablished for a region, the climate signals driving thecommon patterns of variation are identified using climatedata from the instrumental period, e.g., the atmosphericcirculation patterns that are associated with small rings inGiant Sequoia (Sequoiadendron giganteum) throughout itsrange on the western flanks of the Sierra Nevada. These
associations can then be used to infer the frequency ofcertain circulation patterns in the pre-industrial times fromthe older tree-ring widths (Hughes and Brown, 1992).Garfin (1998) extended this approach to a combinedanalysis of atmospheric conditions limiting growth in bothmid- and high-elevation trees in the Sierra Nevada, anddemonstrated that these tree rings contain information oncirculation patterns in both winter and summer seasons, afinding that remains, as yet, underexploited.LaMarche (1973, 1974a, b) inferred past climate varia-
tions from long-lived bristlecone pines (Pinus longaeva) inthe White Mountains. He used relict wood dated eitherdendrochronologically or by radiocarbon to reconstructtemperatures from variations in the upper altitudinal limitsof this species and moisture conditions from variations in
ARTICLE IN PRESS
Lowland River Floodbasin Deposition
Ele
vatio
n (m
)
9
6
3
0
-3
-6
-9
-12
Fill
Silty clay1
Sandy or silty clay2
Silt, sandy silt3
Sand
Gravely sand or sandy gravel
Peat, organics
Anthropogenic layer
Cosumnes atTwin Cities
Road
Mokelumneat Galt
ModernChannel
ModernChannel
Mokelumneat New Hope
Middle Slough
B2 B3B1 B4 B4B2-491.5
B3-493.5
B4-495.0
B3 B1 B0 B2 B9
MainModernChannel
1 brown, soft;
2 gray-blue
4 gray or brown
3 blue, gray, green or brown
Fig. 3. Lowland river flood basin deposits from sites on the Cosumnes river at Twin Cities road, from the Mokelumne river at Galt and at New Hope, and
from the Middle slough. The sediment deposits vary from silty clays to gravels and peat. Dates for these deposits are not shown, but the modern channel is
indicated as well as anthropogenic layers.
F.P. Malamud-Roam et al. / Quaternary Science Reviews 25 (2006) 1570–1598 1575
the lower altitudinal limit (LaMarche, 1974a). From thisanalysis, it was clear that climate conditions fluctuatedfrequently during the last 1000 years in the White
Mountains. LaMarche (1978) applied a similar approachto the last 6000 years, but the replication of the upperforest border materials he used has been much improved in
ARTICLE IN PRESSF.P. Malamud-Roam et al. / Quaternary Science Reviews 25 (2006) 1570–15981576
recent years, and a new analysis for this extended period isunder way.
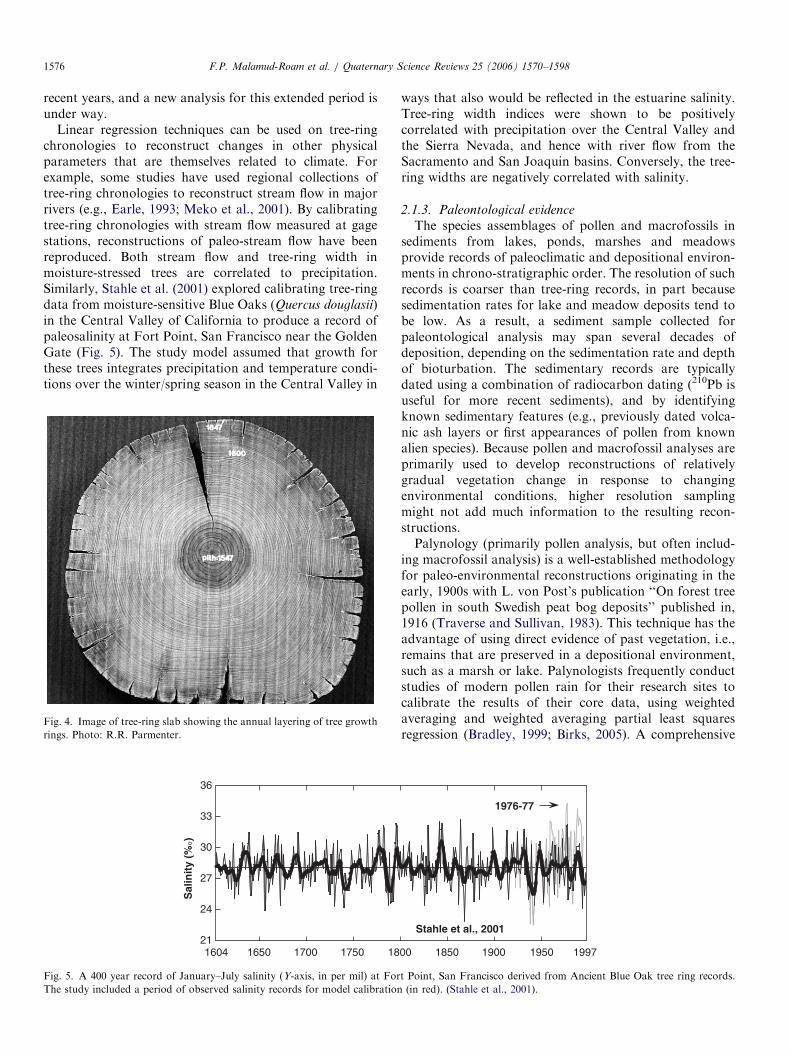
Linear regression techniques can be used on tree-ringchronologies to reconstruct changes in other physicalparameters that are themselves related to climate. Forexample, some studies have used regional collections oftree-ring chronologies to reconstruct stream flow in majorrivers (e.g., Earle, 1993; Meko et al., 2001). By calibratingtree-ring chronologies with stream flow measured at gagestations, reconstructions of paleo-stream flow have beenreproduced. Both stream flow and tree-ring width inmoisture-stressed trees are correlated to precipitation.Similarly, Stahle et al. (2001) explored calibrating tree-ringdata from moisture-sensitive Blue Oaks (Quercus douglasii)in the Central Valley of California to produce a record ofpaleosalinity at Fort Point, San Francisco near the GoldenGate (Fig. 5). The study model assumed that growth forthese trees integrates precipitation and temperature condi-tions over the winter/spring season in the Central Valley in
Fig. 4. Image of tree-ring slab showing the annual layering of tree growth
rings. Photo: R.R. Parmenter.
1650 1700 1750 181604
Sal
init
y (%
°)
36
33
30
27
24
21
Fig. 5. A 400 year record of January–July salinity (Y-axis, in per mil) at For
The study included a period of observed salinity records for model calibration
ways that also would be reflected in the estuarine salinity.Tree-ring width indices were shown to be positivelycorrelated with precipitation over the Central Valley andthe Sierra Nevada, and hence with river flow from theSacramento and San Joaquin basins. Conversely, the tree-ring widths are negatively correlated with salinity.
2.1.3. Paleontological evidence
The species assemblages of pollen and macrofossils insediments from lakes, ponds, marshes and meadowsprovide records of paleoclimatic and depositional environ-ments in chrono-stratigraphic order. The resolution of suchrecords is coarser than tree-ring records, in part becausesedimentation rates for lake and meadow deposits tend tobe low. As a result, a sediment sample collected forpaleontological analysis may span several decades ofdeposition, depending on the sedimentation rate and depthof bioturbation. The sedimentary records are typicallydated using a combination of radiocarbon dating (210Pb isuseful for more recent sediments), and by identifyingknown sedimentary features (e.g., previously dated volca-nic ash layers or first appearances of pollen from knownalien species). Because pollen and macrofossil analyses areprimarily used to develop reconstructions of relativelygradual vegetation change in response to changingenvironmental conditions, higher resolution samplingmight not add much information to the resulting recon-structions.Palynology (primarily pollen analysis, but often includ-
ing macrofossil analysis) is a well-established methodologyfor paleo-environmental reconstructions originating in theearly, 1900s with L. von Post’s publication ‘‘On forest treepollen in south Swedish peat bog deposits’’ published in,1916 (Traverse and Sullivan, 1983). This technique has theadvantage of using direct evidence of past vegetation, i.e.,remains that are preserved in a depositional environment,such as a marsh or lake. Palynologists frequently conductstudies of modern pollen rain for their research sites tocalibrate the results of their core data, using weightedaveraging and weighted averaging partial least squaresregression (Bradley, 1999; Birks, 2005). A comprehensive
00 1850 1900 1950
1976-77
1997
Stahle et al., 2001
t Point, San Francisco derived from Ancient Blue Oak tree ring records.
(in red). (Stahle et al., 2001).
ARTICLE IN PRESS
McGurkMeadow(2091 m)
Anderson, unpub.)
BalsamMeadow(2015 m)
Davis et al. 1985
ExchequerMeadow(2219 m)
Davis & Morato, 1988)
HightopMeadow(1908 m)
Anderson, unpub)
Meadow ofHonor
(1857 m)Anderson,
unpub.
Weston Meadow(2036 m)Anderson
unpub.
Long Meadow(2206 m)
Anderson, unpub
Circle Meadow (2085 m)
Anderson, unpub.
Dogwood Meadow (1987 m)
Anderson, unpub.
Dep
th (
m)
Dep
th (
m)
0
1
2
3
4
5
6
0
1
2
3
4
5
6
1800 47018702960
4540
14401030
2130
413093709400
2410
4690
9530
54304340
84503020
68408410
10160
7070
10680
6160
9420
4040
7660
5090
8170
10500
1036010150
3701900
Peat
Fine grained organic soil
Medium to coarse sands
Gravel
No
Pollen
Pre-
served
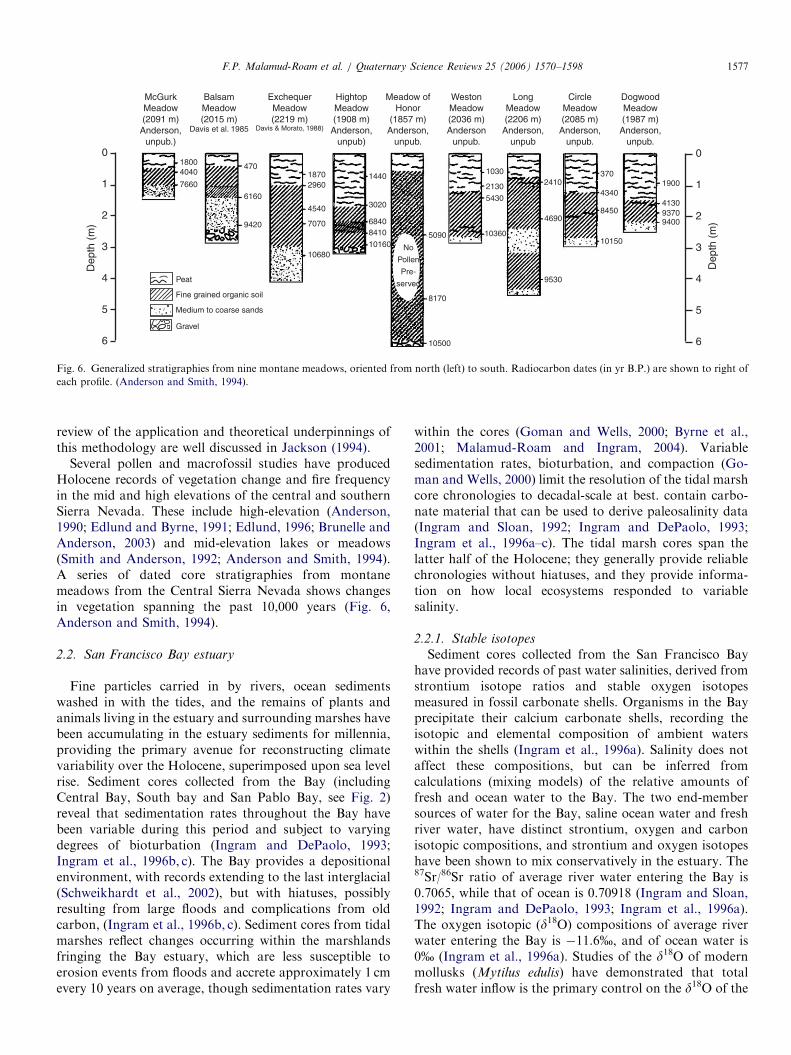
Fig. 6. Generalized stratigraphies from nine montane meadows, oriented from north (left) to south. Radiocarbon dates (in yr B.P.) are shown to right of
each profile. (Anderson and Smith, 1994).
F.P. Malamud-Roam et al. / Quaternary Science Reviews 25 (2006) 1570–1598 1577
review of the application and theoretical underpinnings ofthis methodology are well discussed in Jackson (1994).
Several pollen and macrofossil studies have producedHolocene records of vegetation change and fire frequencyin the mid and high elevations of the central and southernSierra Nevada. These include high-elevation (Anderson,1990; Edlund and Byrne, 1991; Edlund, 1996; Brunelle andAnderson, 2003) and mid-elevation lakes or meadows(Smith and Anderson, 1992; Anderson and Smith, 1994).A series of dated core stratigraphies from montanemeadows from the Central Sierra Nevada shows changesin vegetation spanning the past 10,000 years (Fig. 6,Anderson and Smith, 1994).
2.2. San Francisco Bay estuary
Fine particles carried in by rivers, ocean sedimentswashed in with the tides, and the remains of plants andanimals living in the estuary and surrounding marshes havebeen accumulating in the estuary sediments for millennia,providing the primary avenue for reconstructing climatevariability over the Holocene, superimposed upon sea levelrise. Sediment cores collected from the Bay (includingCentral Bay, South bay and San Pablo Bay, see Fig. 2)reveal that sedimentation rates throughout the Bay havebeen variable during this period and subject to varyingdegrees of bioturbation (Ingram and DePaolo, 1993;Ingram et al., 1996b, c). The Bay provides a depositionalenvironment, with records extending to the last interglacial(Schweikhardt et al., 2002), but with hiatuses, possiblyresulting from large floods and complications from oldcarbon, (Ingram et al., 1996b, c). Sediment cores from tidalmarshes reflect changes occurring within the marshlandsfringing the Bay estuary, which are less susceptible toerosion events from floods and accrete approximately 1 cmevery 10 years on average, though sedimentation rates vary
within the cores (Goman and Wells, 2000; Byrne et al.,2001; Malamud-Roam and Ingram, 2004). Variablesedimentation rates, bioturbation, and compaction (Go-man and Wells, 2000) limit the resolution of the tidal marshcore chronologies to decadal-scale at best. contain carbo-nate material that can be used to derive paleosalinity data(Ingram and Sloan, 1992; Ingram and DePaolo, 1993;Ingram et al., 1996a–c). The tidal marsh cores span thelatter half of the Holocene; they generally provide reliablechronologies without hiatuses, and they provide informa-tion on how local ecosystems responded to variablesalinity.
2.2.1. Stable isotopes
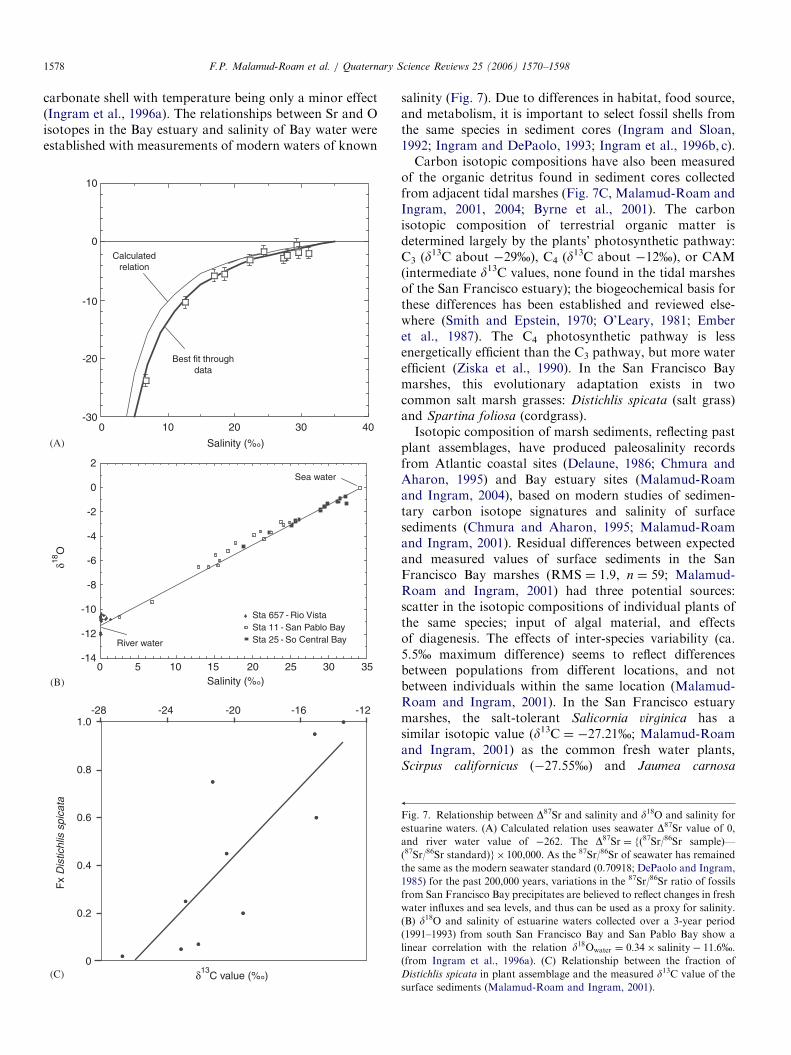
Sediment cores collected from the San Francisco Bayhave provided records of past water salinities, derived fromstrontium isotope ratios and stable oxygen isotopesmeasured in fossil carbonate shells. Organisms in the Bayprecipitate their calcium carbonate shells, recording theisotopic and elemental composition of ambient waterswithin the shells (Ingram et al., 1996a). Salinity does notaffect these compositions, but can be inferred fromcalculations (mixing models) of the relative amounts offresh and ocean water to the Bay. The two end-membersources of water for the Bay, saline ocean water and freshriver water, have distinct strontium, oxygen and carbonisotopic compositions, and strontium and oxygen isotopeshave been shown to mix conservatively in the estuary. The87Sr/86Sr ratio of average river water entering the Bay is0.7065, while that of ocean is 0.70918 (Ingram and Sloan,1992; Ingram and DePaolo, 1993; Ingram et al., 1996a).The oxygen isotopic (d18O) compositions of average riverwater entering the Bay is �11.6%, and of ocean water is0% (Ingram et al., 1996a). Studies of the d18O of modernmollusks (Mytilus edulis) have demonstrated that totalfresh water inflow is the primary control on the d18O of the
ARTICLE IN PRESSF.P. Malamud-Roam et al. / Quaternary Science Reviews 25 (2006) 1570–15981578
carbonate shell with temperature being only a minor effect(Ingram et al., 1996a). The relationships between Sr and Oisotopes in the Bay estuary and salinity of Bay water wereestablished with measurements of modern waters of known
10
0Calculated
relation
-10
-20
-300 10 20 30 40
Salinity (%°)
Salinity (%°)
Best fit throughdata
2
0
-2
-4
-6
-8
-10
-12
-14
-28 -24 -20 -16 -12
0 5 10 15 20 25 30 35
Sea water
River water
Sta 657 - Rio VistaSta 11 - San Pablo BaySta 25 - So Central Bay
1.0
0.8
0.6
0.4
0.2
0
Fx Distichlis
spica
taδ18
O
δ13C value (%°)
(A)
(B)
(C)
salinity (Fig. 7). Due to differences in habitat, food source,and metabolism, it is important to select fossil shells fromthe same species in sediment cores (Ingram and Sloan,1992; Ingram and DePaolo, 1993; Ingram et al., 1996b, c).Carbon isotopic compositions have also been measured
of the organic detritus found in sediment cores collectedfrom adjacent tidal marshes (Fig. 7C, Malamud-Roam andIngram, 2001, 2004; Byrne et al., 2001). The carbonisotopic composition of terrestrial organic matter isdetermined largely by the plants’ photosynthetic pathway:C3 (d13C about �29%), C4 (d13C about �12%), or CAM(intermediate d13C values, none found in the tidal marshesof the San Francisco estuary); the biogeochemical basis forthese differences has been established and reviewed else-where (Smith and Epstein, 1970; O’Leary, 1981; Emberet al., 1987). The C4 photosynthetic pathway is lessenergetically efficient than the C3 pathway, but more waterefficient (Ziska et al., 1990). In the San Francisco Baymarshes, this evolutionary adaptation exists in twocommon salt marsh grasses: Distichlis spicata (salt grass)and Spartina foliosa (cordgrass).Isotopic composition of marsh sediments, reflecting past
plant assemblages, have produced paleosalinity recordsfrom Atlantic coastal sites (Delaune, 1986; Chmura andAharon, 1995) and Bay estuary sites (Malamud-Roamand Ingram, 2004), based on modern studies of sedimen-tary carbon isotope signatures and salinity of surfacesediments (Chmura and Aharon, 1995; Malamud-Roamand Ingram, 2001). Residual differences between expectedand measured values of surface sediments in the SanFrancisco Bay marshes (RMS ¼ 1.9, n ¼ 59; Malamud-Roam and Ingram, 2001) had three potential sources:scatter in the isotopic compositions of individual plants ofthe same species; input of algal material, and effectsof diagenesis. The effects of inter-species variability (ca.5.5% maximum difference) seems to reflect differencesbetween populations from different locations, and notbetween individuals within the same location (Malamud-Roam and Ingram, 2001). In the San Francisco estuarymarshes, the salt-tolerant Salicornia virginica has asimilar isotopic value (d13C ¼ �27.21%; Malamud-Roamand Ingram, 2001) as the common fresh water plants,Scirpus californicus (�27.55%) and Jaumea carnosa
Fig. 7. Relationship between D87Sr and salinity and d18O and salinity for
estuarine waters. (A) Calculated relation uses seawater D87Sr value of 0,
and river water value of �262. The D87Sr ¼ {(87Sr/86Sr sample)—
(87Sr/86Sr standard)}� 100,000. As the 87Sr/86Sr of seawater has remained
the same as the modern seawater standard (0.70918; DePaolo and Ingram,
1985) for the past 200,000 years, variations in the 87Sr/86Sr ratio of fossils
from San Francisco Bay precipitates are believed to reflect changes in fresh
water influxes and sea levels, and thus can be used as a proxy for salinity.
(B) d18O and salinity of estuarine waters collected over a 3-year period
(1991–1993) from south San Francisco Bay and San Pablo Bay show a
linear correlation with the relation d18Owater ¼ 0:34� salinity� 11:6%.
(from Ingram et al., 1996a). (C) Relationship between the fraction of
Distichlis spicata in plant assemblage and the measured d13C value of the
surface sediments (Malamud-Roam and Ingram, 2001).
ARTICLE IN PRESSF.P. Malamud-Roam et al. / Quaternary Science Reviews 25 (2006) 1570–1598 1579
(�27.23%) (Malamud-Roam and Ingram, 2001), posinganother complication for paleosalinity reconstructions.Thus, researchers use this method in conjunction withother proxy records, such as fossil pollen (Byrne et al.,2001; Malamud-Roam and Ingram, 2004). S. virginica
pollen is easily identified in the marsh sediments and thesalt marsh grasses can be distinguished from other non-marsh grasses using the C isotopic signal.
2.2.2. Fossil evidence
Cores spanning the last 7000 years have been recoveredfrom tidal marsh sites (see Fig. 2) and have been analyzedfor plant macrofossils (seeds, leaves, rhizomes) and pollento produce records of vegetation change (May, 1999; Byrneet al., 2001; Goman, 2001; Malamud-Roam and Ingram,2004) and diatoms (Starratt, 2003, 2004) related topaleosalinity and to marsh elevation (Goman and Wells,2000). Several authors have used normalized ratios of salt-tolerant to salt-intolerant marsh pollen as an indicator ofchanging salinity (Davis, 1992; May, 1999; Byrne et al.,2001; Malamud-Roam, 2002; Malamud-Roam and In-gram, 2004). These records show that the vegetationassemblages on the surface of these marshes havefluctuated between dominance by a few, highly salt tolerantspecies, and a more diverse mix of brackish and fresh plantspecies.
In general, based on modern plant surveys conducted inthe San Francisco Bay marshes (Atwater and Hedel 1976;Malamud-Roam and Ingram, 2001), these changes in plantspecies compositions have been interpreted to reflectchanges in estuarine salinity, and indirectly, changes inclimate conditions (reflected in fresh water inflows).However, climatic inferences based on these studies havecaveats, particularly as other factors can influence the plantassemblages (Byrne et al., 2001), including marsh matura-tion: as the marsh matures, the plants themselves elevatethe surface of the marsh by trapping inorganic sedimentsand producing organic detritus. In a tidal environment,local changes in elevation relative to sea level have asignificant impact on species compositions (Adam, 1990).Sea level has continued to rise steadily throughout theHolocene (Atwater, 1979), resulting in a long-term trendincreasing the volume of the Bay, as well as its salinity(Ingram and DePaolo, 1993). Localized changes in marshelevation may also have occurred as a result of past verticalmovement along one of the many faults that cross the SanFrancisco Bay, though marsh core sediments do notcontain evidence of substantial seismic events (Gomanand Wells, 2000; Byrne et al., 2001). Plant interactions,including succession and competition also impact the plantassemblages (Adam, 1990).
2.3. Radiocarbon dating
Radiocarbon dating is the primary method for establish-ing chronologies in estuarine, marsh and lake sediments, aswell as archaeological deposits. The uncertainties in radio-
carbon ages vary over time, in part because the productionof 14C in the atmosphere has not remained constantthroughout time (Stuiver and Quay, 1980; Stuiver andBraziunas, 1992). Hence, chronologies based on radio-carbon dating of plant fragments, concentrated pollen, orbulk organic matter are necessarily of a coarser resolutionthan those based on annual growth (i.e. tree rings) ordeposition (i.e., varves). However, because the radiocarbonmethod extends back to about 40,000 years (Bradley,1999), it is ideal for the period of interest (the Holoceneepoch), and is often the only method available for dating inmany sedimentary environments (such as San FranciscoBay).Cores from San Francisco Bay estuary were dated using
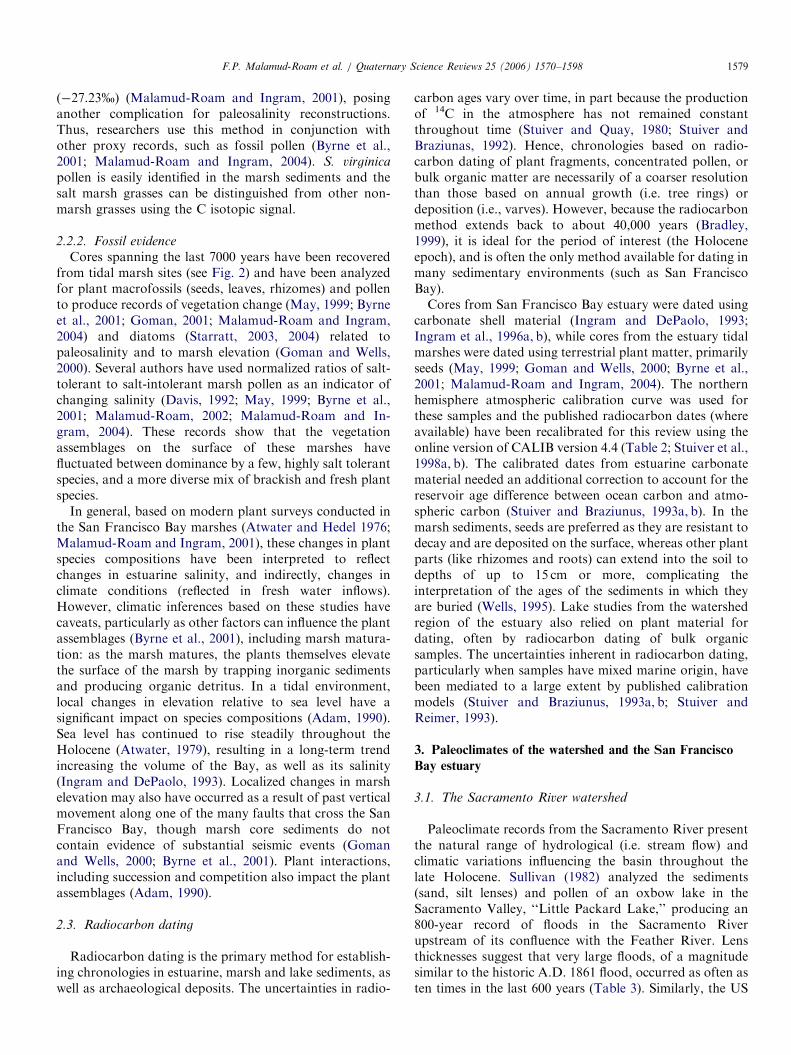
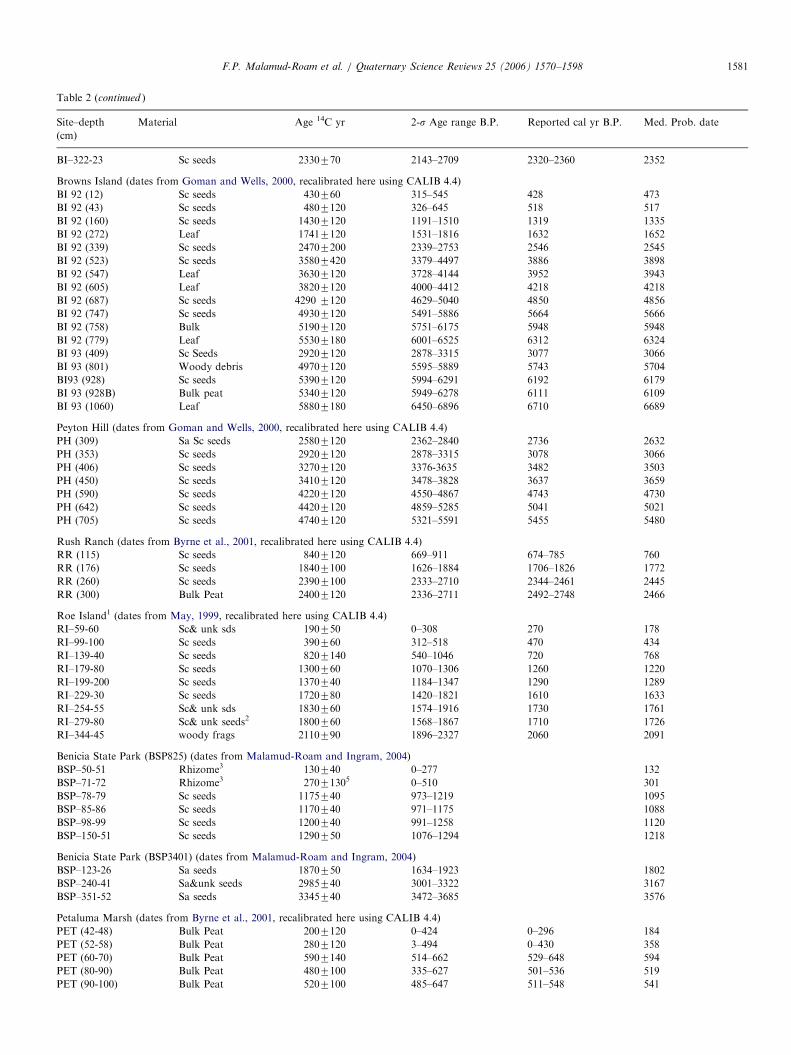
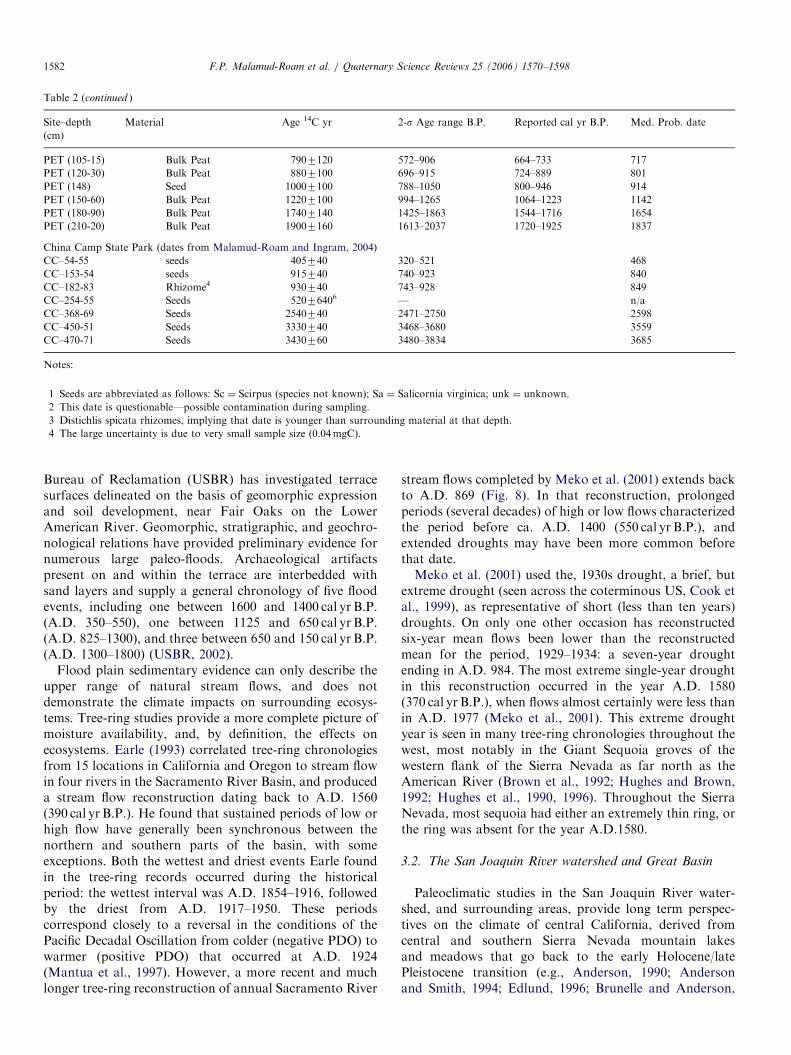
carbonate shell material (Ingram and DePaolo, 1993;Ingram et al., 1996a, b), while cores from the estuary tidalmarshes were dated using terrestrial plant matter, primarilyseeds (May, 1999; Goman and Wells, 2000; Byrne et al.,2001; Malamud-Roam and Ingram, 2004). The northernhemisphere atmospheric calibration curve was used forthese samples and the published radiocarbon dates (whereavailable) have been recalibrated for this review using theonline version of CALIB version 4.4 (Table 2; Stuiver et al.,1998a, b). The calibrated dates from estuarine carbonatematerial needed an additional correction to account for thereservoir age difference between ocean carbon and atmo-spheric carbon (Stuiver and Braziunus, 1993a, b). In themarsh sediments, seeds are preferred as they are resistant todecay and are deposited on the surface, whereas other plantparts (like rhizomes and roots) can extend into the soil todepths of up to 15 cm or more, complicating theinterpretation of the ages of the sediments in which theyare buried (Wells, 1995). Lake studies from the watershedregion of the estuary also relied on plant material fordating, often by radiocarbon dating of bulk organicsamples. The uncertainties inherent in radiocarbon dating,particularly when samples have mixed marine origin, havebeen mediated to a large extent by published calibrationmodels (Stuiver and Braziunus, 1993a, b; Stuiver andReimer, 1993).
3. Paleoclimates of the watershed and the San Francisco
Bay estuary
3.1. The Sacramento River watershed
Paleoclimate records from the Sacramento River presentthe natural range of hydrological (i.e. stream flow) andclimatic variations influencing the basin throughout thelate Holocene. Sullivan (1982) analyzed the sediments(sand, silt lenses) and pollen of an oxbow lake in theSacramento Valley, ‘‘Little Packard Lake,’’ producing an800-year record of floods in the Sacramento Riverupstream of its confluence with the Feather River. Lensthicknesses suggest that very large floods, of a magnitudesimilar to the historic A.D. 1861 flood, occurred as often asten times in the last 600 years (Table 3). Similarly, the US

ARTICLE IN PRESS
Table 2
Recalibrated radiocarbon dates from sites in the San Francisco Bay estuary
Site–depth
(cm)
Material Age 14C yr 2-s Age range B.P. Reported cal yr B.P. Med. Prob. date
San Francisco Bay cores
Richardson Bay1 (dates from Ingram and DePaolo, 1993, recalibrated here using CALIB 4.4, with DR value of 365735 years, obtained from Ingram and
Southon, 1996)
RBGC-3 (40) Mollusk o0 n/a 3575
RBGC-5 (60) Mollusk 830760 0–238 125760 98
RBGC-7 (80) Mollusk 580770 n/a 0770 n/a
RBGC-10 (100) Mollusk 690760 n/a 70760 n/a
RBGC-12 (130) Mollusk 890770 0–279 2257105 150
RBGC-14 (140) Mollusk 8507110 0–322 1507110 139
RBGC-17 (170) Mollusk 6707110 n/a 20770 n/a
RBGC-18 (180) Mollusk 11007100 133–538 4407110 369
RBGC-20 (195) Mollusk 1230770 328–612 5707100 483
RB-2.1A (441) Mollusk 780780 n/a 90780 n/a
RB-2.1b (460) Mollusk 1070770 154–495 370770 353
RB-2.2A (526) Mollusk 2690760 1782–2112 2210760 1940
RB-2.3A (666) Mollusk 3680780 2919–3359 3410780 3151
RB-2.5b (815) Mollusk 3720770 2984–3380 3510770 3205
RB-2.6A (849) Mollusk 37907100 3000–3542 35907100 3284
RB-2.9A (1070) Mollusk 4390780 3808–4293 4320780 4037
San Pablo Bay (dates from Ingram and DePaolo, 1993, recalibrated here using CALIB 4.4, with DR value of 365735 yrs, obtained from Ingram and
Southon, 1996).
SPB-3A-9 (150) Mollusk 730770 n/a 130770 n/a
SPB-3A-11 (190) Mollusk 740760 n/a 130760 n/a
HF-4-cc 270 Mollusk 18107120 739–1245 11807150 996
HF-5-2 (334) Mollusk 2930760 2040–2361 2580780 2225
HF-6-1 (395) Mollusk 2890790 1928–2393 2470790 2181
HF-9cc (850) Mollusk 28207180 1671–2612 24357225 2101
HF-11-1 (1003) Mollusk 3080780 2213–2696 2760790 2437
HF-11-2 (1034) Mollusk 3070760 2266–2675 27707100 2417
San Pablo Bay (dates from Ingram et al., 1996c, recalibrated here using CALIB 4.4, with DR value of 365735 yrs)
SPB (21) Macoma 830 0–238 260 98
SPB (55) Macoma 840 0–242 270 105
SPB (105) Macoma 1260 402–631 610 509
SPB (127) Mytilus 2320 1349–1676 1670 1504
SPB (207) Mytilus 2420 1468–1802 1790 1624
SPB(327) Mytilus 2600 1670–1998 1980 1833
SPB (378) Mytilus 2720 1814–2139 2130 1974
SPB (486) Mytilus 2690 1782–2112 2110 1940
SPB (551) Mytilus 2690 1782–2112 2110 1940
SPB (583) Mytilus 2650 1719–2056 2080 1893
SPB (676) Mytilus 2710 1806–2131 2130 1962
Oyster Point (dates from Ingram et al., 1996b, recalibrated here using CALIB 4.4, with DR value of 365735 yrs, obtained from Ingram and Southon,
1996)
OY (5) Macoma 750760 n/a 160 n/a
OY (29) Macoma 1110760 274–494 500 383
OYP (57) Macoma 1410760 512–715 710 611
OYP (65) Macoma 730770 n/a 120 n/a
OYP (269) Macoma 2270770 1287–1620 1590 1450
OYP( 380) Macoma 3150770 2335–2706 2720 2521
OYP (402) Macoma 3310770 2470–2879 2840 2715
OYP (523) Macoma 5070760 4802–5143 5130 4939
Tidal Marsh Cores
Browns Island1 (dates from May, 1999, recalibrated here using CALIB 4.4)
BI–59-60 Sc2 seeds 240780 0–470 0–420 274
BI–88-89 Sc& unk sds 810780 573–920 660–780 743
BI–128-129 Sc& unk sds 1050740 917–1056 930–970 962
BI–148-49 Sc& unk sds 1210750 992–1262 1060–1170 1131
BI–178-179 unk sds 1270780 988–1310 1070–1280 1186
BI–208-09 Sc& unk sds 1560750 1333–1543 1360–1520 1452
BI–239-40 Sc& unk sds 1780780 1527–1877 1570–1810 1700
F.P. Malamud-Roam et al. / Quaternary Science Reviews 25 (2006) 1570–15981580
ARTICLE IN PRESS
Table 2 (continued )
Site–depth
(cm)
Material Age 14C yr 2-s Age range B.P. Reported cal yr B.P. Med. Prob. date
BI–322-23 Sc seeds 2330770 2143–2709 2320–2360 2352
Browns Island (dates from Goman and Wells, 2000, recalibrated here using CALIB 4.4)
BI 92 (12) Sc seeds 430760 315–545 428 473
BI 92 (43) Sc seeds 4807120 326–645 518 517
BI 92 (160) Sc seeds 14307120 1191–1510 1319 1335
BI 92 (272) Leaf 17417120 1531–1816 1632 1652
BI 92 (339) Sc seeds 24707200 2339–2753 2546 2545
BI 92 (523) Sc seeds 35807420 3379–4497 3886 3898
BI 92 (547) Leaf 36307120 3728–4144 3952 3943
BI 92 (605) Leaf 38207120 4000–4412 4218 4218
BI 92 (687) Sc seeds 4290 7120 4629–5040 4850 4856
BI 92 (747) Sc seeds 49307120 5491–5886 5664 5666
BI 92 (758) Bulk 51907120 5751–6175 5948 5948
BI 92 (779) Leaf 55307180 6001–6525 6312 6324
BI 93 (409) Sc Seeds 29207120 2878–3315 3077 3066
BI 93 (801) Woody debris 49707120 5595–5889 5743 5704
BI93 (928) Sc seeds 53907120 5994–6291 6192 6179
BI 93 (928B) Bulk peat 53407120 5949–6278 6111 6109
BI 93 (1060) Leaf 58807180 6450–6896 6710 6689
Peyton Hill (dates from Goman and Wells, 2000, recalibrated here using CALIB 4.4)
PH (309) Sa Sc seeds 25807120 2362–2840 2736 2632
PH (353) Sc seeds 29207120 2878–3315 3078 3066
PH (406) Sc seeds 32707120 3376-3635 3482 3503
PH (450) Sc seeds 34107120 3478–3828 3637 3659
PH (590) Sc seeds 42207120 4550–4867 4743 4730
PH (642) Sc seeds 44207120 4859–5285 5041 5021
PH (705) Sc seeds 47407120 5321–5591 5455 5480
Rush Ranch (dates from Byrne et al., 2001, recalibrated here using CALIB 4.4)
RR (115) Sc seeds 8407120 669–911 674–785 760
RR (176) Sc seeds 18407100 1626–1884 1706–1826 1772
RR (260) Sc seeds 23907100 2333–2710 2344–2461 2445
RR (300) Bulk Peat 24007120 2336–2711 2492–2748 2466
Roe Island1 (dates from May, 1999, recalibrated here using CALIB 4.4)
RI–59-60 Sc& unk sds 190750 0–308 270 178
RI–99-100 Sc seeds 390760 312–518 470 434
RI–139-40 Sc seeds 8207140 540–1046 720 768
RI–179-80 Sc seeds 1300760 1070–1306 1260 1220
RI–199-200 Sc seeds 1370740 1184–1347 1290 1289
RI–229-30 Sc seeds 1720780 1420–1821 1610 1633
RI–254-55 Sc& unk sds 1830760 1574–1916 1730 1761
RI–279-80 Sc& unk seeds2 1800760 1568–1867 1710 1726
RI–344-45 woody frags 2110790 1896–2327 2060 2091
Benicia State Park (BSP825) (dates from Malamud-Roam and Ingram, 2004)
BSP–50-51 Rhizome3 130740 0–277 132
BSP–71-72 Rhizome3 27071305 0–510 301
BSP–78-79 Sc seeds 1175740 973–1219 1095
BSP–85-86 Sc seeds 1170740 971–1175 1088
BSP–98-99 Sc seeds 1200740 991–1258 1120
BSP–150-51 Sc seeds 1290750 1076–1294 1218
Benicia State Park (BSP3401) (dates from Malamud-Roam and Ingram, 2004)
BSP–123-26 Sa seeds 1870750 1634–1923 1802
BSP–240-41 Sa&unk seeds 2985740 3001–3322 3167
BSP–351-52 Sa seeds 3345740 3472–3685 3576
Petaluma Marsh (dates from Byrne et al., 2001, recalibrated here using CALIB 4.4)
PET (42-48) Bulk Peat 2007120 0–424 0–296 184
PET (52-58) Bulk Peat 2807120 3–494 0–430 358
PET (60-70) Bulk Peat 5907140 514–662 529–648 594
PET (80-90) Bulk Peat 4807100 335–627 501–536 519
PET (90-100) Bulk Peat 5207100 485–647 511–548 541
F.P. Malamud-Roam et al. / Quaternary Science Reviews 25 (2006) 1570–1598 1581
ARTICLE IN PRESS
Table 2 (continued )
Site–depth
(cm)
Material Age 14C yr 2-s Age range B.P. Reported cal yr B.P. Med. Prob. date
PET (105-15) Bulk Peat 7907120 572–906 664–733 717
PET (120-30) Bulk Peat 8807100 696–915 724–889 801
PET (148) Seed 10007100 788–1050 800–946 914
PET (150-60) Bulk Peat 12207100 994–1265 1064–1223 1142
PET (180-90) Bulk Peat 17407140 1425–1863 1544–1716 1654
PET (210-20) Bulk Peat 19007160 1613–2037 1720–1925 1837
China Camp State Park (dates from Malamud-Roam and Ingram, 2004)
CC–54-55 seeds 405740 320–521 468
CC–153-54 seeds 915740 740–923 840
CC–182-83 Rhizome4 930740 743–928 849
CC–254-55 Seeds 52076406 — n/a
CC–368-69 Seeds 2540740 2471–2750 2598
CC–450-51 Seeds 3330740 3468–3680 3559
CC–470-71 Seeds 3430760 3480–3834 3685
Notes:
1 Seeds are abbreviated as follows: Sc ¼ Scirpus (species not known); Sa ¼ Salicornia virginica; unk ¼ unknown.
2 This date is questionable—possible contamination during sampling.
3 Distichlis spicata rhizomes, implying that date is younger than surrounding material at that depth.
4 The large uncertainty is due to very small sample size (0.04mgC).
F.P. Malamud-Roam et al. / Quaternary Science Reviews 25 (2006) 1570–15981582
Bureau of Reclamation (USBR) has investigated terracesurfaces delineated on the basis of geomorphic expressionand soil development, near Fair Oaks on the LowerAmerican River. Geomorphic, stratigraphic, and geochro-nological relations have provided preliminary evidence fornumerous large paleo-floods. Archaeological artifactspresent on and within the terrace are interbedded withsand layers and supply a general chronology of five floodevents, including one between 1600 and 1400 cal yr B.P.(A.D. 350–550), one between 1125 and 650 cal yr B.P.(A.D. 825–1300), and three between 650 and 150 cal yr B.P.(A.D. 1300–1800) (USBR, 2002).
Flood plain sedimentary evidence can only describe theupper range of natural stream flows, and does notdemonstrate the climate impacts on surrounding ecosys-tems. Tree-ring studies provide a more complete picture ofmoisture availability, and, by definition, the effects onecosystems. Earle (1993) correlated tree-ring chronologiesfrom 15 locations in California and Oregon to stream flowin four rivers in the Sacramento River Basin, and produceda stream flow reconstruction dating back to A.D. 1560(390 cal yr B.P.). He found that sustained periods of low orhigh flow have generally been synchronous between thenorthern and southern parts of the basin, with someexceptions. Both the wettest and driest events Earle foundin the tree-ring records occurred during the historicalperiod: the wettest interval was A.D. 1854–1916, followedby the driest from A.D. 1917–1950. These periodscorrespond closely to a reversal in the conditions of thePacific Decadal Oscillation from colder (negative PDO) towarmer (positive PDO) that occurred at A.D. 1924(Mantua et al., 1997). However, a more recent and muchlonger tree-ring reconstruction of annual Sacramento River
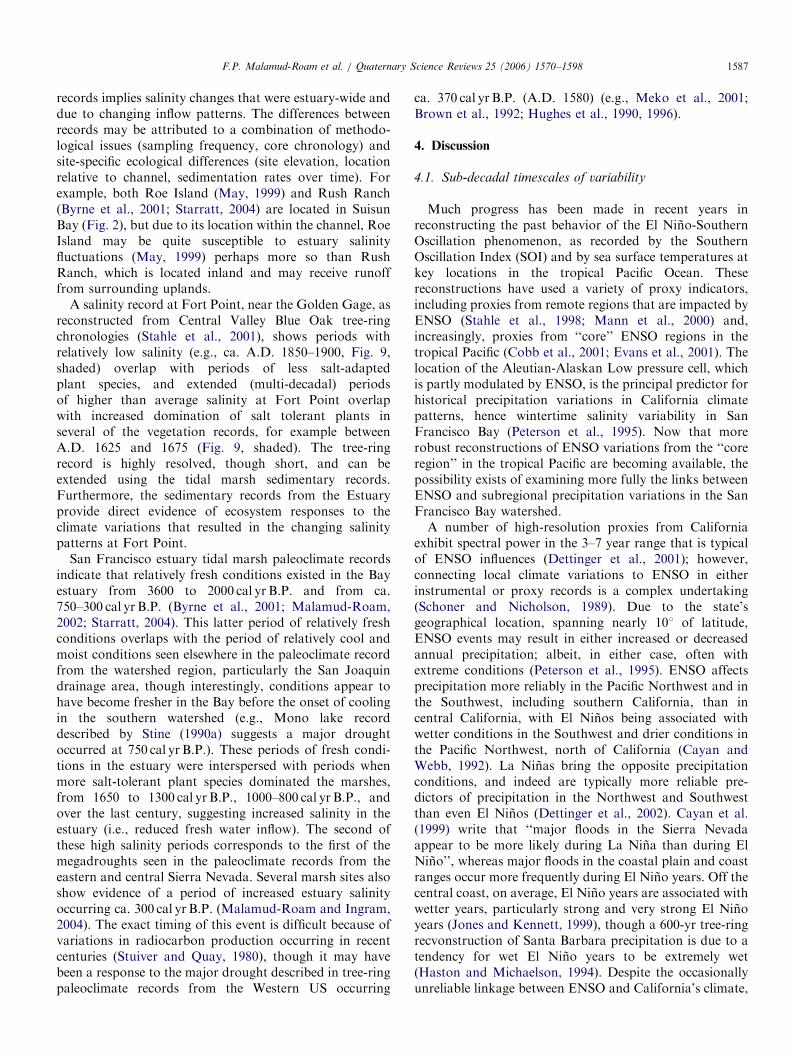
stream flows completed by Meko et al. (2001) extends backto A.D. 869 (Fig. 8). In that reconstruction, prolongedperiods (several decades) of high or low flows characterizedthe period before ca. A.D. 1400 (550 cal yr B.P.), andextended droughts may have been more common beforethat date.Meko et al. (2001) used the, 1930s drought, a brief, but
extreme drought (seen across the coterminous US, Cook etal., 1999), as representative of short (less than ten years)droughts. On only one other occasion has reconstructedsix-year mean flows been lower than the reconstructedmean for the period, 1929–1934: a seven-year droughtending in A.D. 984. The most extreme single-year droughtin this reconstruction occurred in the year A.D. 1580(370 cal yr B.P.), when flows almost certainly were less thanin A.D. 1977 (Meko et al., 2001). This extreme droughtyear is seen in many tree-ring chronologies throughout thewest, most notably in the Giant Sequoia groves of thewestern flank of the Sierra Nevada as far north as theAmerican River (Brown et al., 1992; Hughes and Brown,1992; Hughes et al., 1990, 1996). Throughout the SierraNevada, most sequoia had either an extremely thin ring, orthe ring was absent for the year A.D.1580.
3.2. The San Joaquin River watershed and Great Basin
Paleoclimatic studies in the San Joaquin River water-shed, and surrounding areas, provide long term perspec-tives on the climate of central California, derived fromcentral and southern Sierra Nevada mountain lakesand meadows that go back to the early Holocene/latePleistocene transition (e.g., Anderson, 1990; Andersonand Smith, 1994; Edlund, 1996; Brunelle and Anderson,
ARTICLE IN PRESS
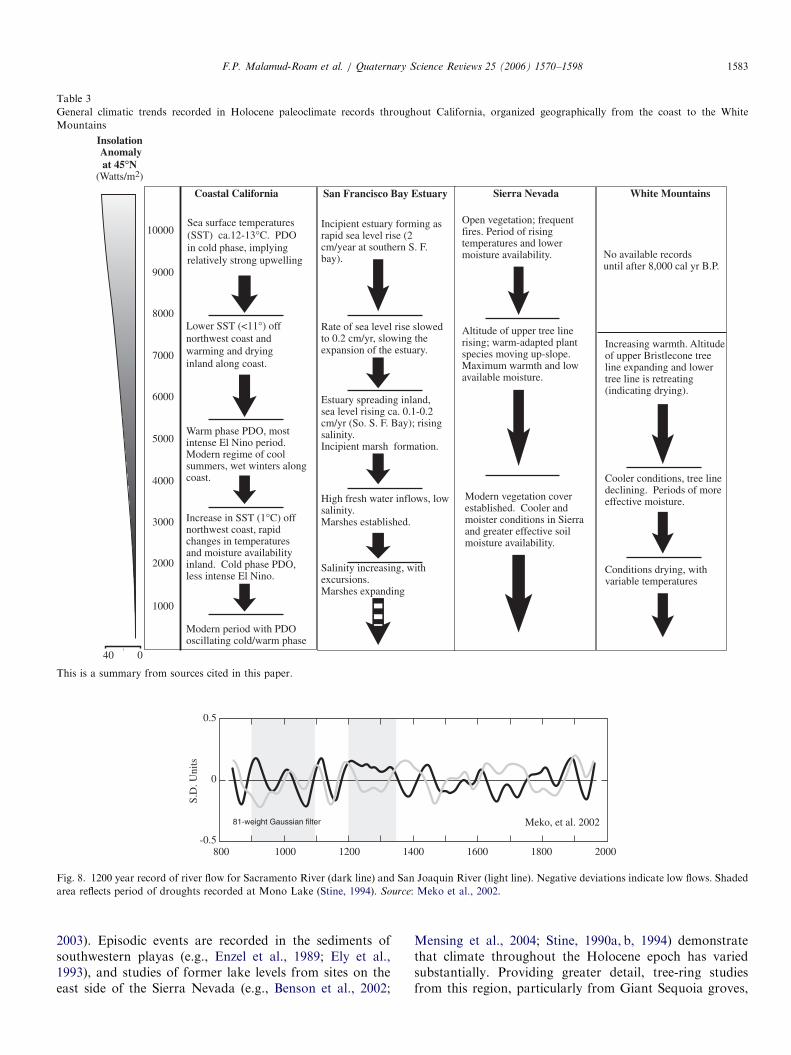
Table 3
General climatic trends recorded in Holocene paleoclimate records throughout California, organized geographically from the coast to the White
Mountains
040
10000
9000
8000
7000
6000
5000
1000
2000
3000
4000
Coastal California San Francisco Bay Estuary Sierra Nevada White Mountains
Sea surface temperatures (SST) ca.12-13°C. PDO in cold phase, implying relatively strong upwelling
Lower SST (<11°) off northwest coast and warming and drying inland along coast.
Warm phase PDO, most intense El Nino period. Modern regime of cool summers, wet winters along coast.
Increase in SST (1°C) off northwest coast, rapid changes in temperatures and moisture availability inland. Cold phase PDO, less intense El Nino.
Modern period with PDOoscillating cold/warm phase
Incipient estuary forming as rapid sea level rise (2 cm/year at southern S. F. bay).
Rate of sea level rise slowed to 0.2 cm/yr, slowing the expansion of the estuary.
Estuary spreading inland, sea level rising ca. 0.1-0.2 cm/yr (So. S. F. Bay); rising salinity. Incipient marsh formation.
High fresh water inflows, low salinity. Marshes established.
Modern vegetation cover established. Cooler and moister conditions in Sierraand greater effective soil moisture availability.
Altitude of upper tree line rising; warm-adapted plant species moving up-slope. Maximum warmth and low available moisture.
Open vegetation; frequent fires. Period of rising temperatures and lower moisture availability.
Increasing warmth. Altitude of upper Bristlecone tree line expanding and lower tree line is retreating (indicating drying).
Cooler conditions, tree line declining. Periods of more effective moisture.
Conditions drying, with variable temperatures
Salinity increasing, with excursions. Marshes expanding
Insolation Anomalyat 45°N
(Watts/m2)
No available records until after 8,000 cal yr B.P.
This is a summary from sources cited in this paper.
800
81-weight Gaussian filter
1200 16001000 1400 1800 2000
Meko, et al. 2002
S.D
. Uni
ts
0.5
-0.5
0
Fig. 8. 1200 year record of river flow for Sacramento River (dark line) and San Joaquin River (light line). Negative deviations indicate low flows. Shaded
area reflects period of droughts recorded at Mono Lake (Stine, 1994). Source: Meko et al., 2002.
F.P. Malamud-Roam et al. / Quaternary Science Reviews 25 (2006) 1570–1598 1583
2003). Episodic events are recorded in the sediments ofsouthwestern playas (e.g., Enzel et al., 1989; Ely et al.,1993), and studies of former lake levels from sites on theeast side of the Sierra Nevada (e.g., Benson et al., 2002;
Mensing et al., 2004; Stine, 1990a, b, 1994) demonstratethat climate throughout the Holocene epoch has variedsubstantially. Providing greater detail, tree-ring studiesfrom this region, particularly from Giant Sequoia groves,
ARTICLE IN PRESSF.P. Malamud-Roam et al. / Quaternary Science Reviews 25 (2006) 1570–15981584
but also from a variety of other tree species, describe bothchanging precipitation and temperature patterns for theHolocene on annual to decadal time-scales (e.g., Graum-lich, 1993; Hughes et al., 1996; Hughes and Graumlich,1996; Biondi et al., 1999; Hughes and Funkhouser, 2003).
Pollen assemblages from several mountain lakes andmeadows in the central Sierra Nevada provide records ofvegetation responses to changing climatic conditions fromthe late Pleistocene through the Holocene (Anderson, 1990;Smith and Anderson, 1992; Anderson and Smith, 1994;Edlund, 1996; Brunelle and Anderson, 2003), which havebeen supplemented by recent studies of fossilized midgeremains in lake sediments (Porinchu et al., 2003). Thesestudies indicate that the early Holocene (until ca. 7000cal yr B.P.) was generally dry, with open vegetation follow-ing the recent retreat of mountain glaciers, and frequentfires (Edlund and Byrne, 1991; Brunelle and Anderson,2003). Warming continued during the middle Holocene(7000–3500 cal yr B.P.) as solar insolation reached itsmaximum for the northern hemisphere. In the midlati-tudes, soil moisture was greater, perhaps due in part toincreased vegetative cover (Anderson and Smith, 1994;Edlund, 1996). These generally warm and moist conditionswere seen throughout the American southwest, forexample, in paleo-flood histories (Ely et al., 1993) andlake deposits from the Mojave Desert (Enzel et al., 1989).Recent studies have reconstructed changes in the lake levelof Pyramid Lake, NV, as the lake has shifted from an opensystem to a closed basin system in response to changes inmoisture regime. Total inorganic carbon, which detectsabrupt changes from open to closed basin conditions andoxygen isotope measurements (Benson et al., 2002), andpollen records (Mensing et al., 2004) show a complicatedearly to mid-Holocene climate history, with lake levelfluctuations indicating overall drought conditions punctu-ated by brief very wet periods from ca. 8000 cal yr B.P. toabout 3800 cal yr B.P., when conditions became generallywetter. LaMarche (1973, 1974a), analyzing the altitudinallimits and tree-ring widths of bristlecone pines in the WhiteMountains, estimated that temperatures were about 1.9 1Cwarmer during this middle Holocene period. Conditions inthe central Sierra Nevada became moist for a period ca.4000–3500 cal yr B.P., and a cooling trend with highervariability began, which continued through to the modernperiod (LaMarche, 1974a; Anderson, 1990; Smith andAnderson, 1992; Anderson and Smith, 1994; Brunelle andAnderson, 2003).
Stine (1990a, b, 1994) used former lake level elevations ofMono Lake and submerged tree stumps from sites in theeastern Sierra Nevada as evidence of prolonged, severedroughts occurring twice in the last 1000 years. Bothdroughts occurred during the period from the 10th centuryA.D. to the 14th century, referred to as the MedievalClimate Anomaly (Stine, 1994). When the lake levelsdropped during these droughts, trees grew at elevations inthe basin (and in other river beds in the eastern Sierra) thatare completely submerged today. By dating the submerged
tree stumps and counting the tree rings, Stine concludedthat these mega-droughts prevailed in the region from ca.1050–850 cal yr B.P. (A.D. 900–1100) and again from 750to 600 cal yr B.P. (A.D. 1200–1350). In at least two cases,these eastern Sierran droughts appear to precede anom-alously wet periods in the larger region (as evidenced by thesubmerged trees). A paleoclimatic reconstruction frombristlecone pines found at high elevations in the WhiteMountains (LaMarche, 1974a) corresponds to the MonoLake droughts: from ca. 1100–900 cal yr B.P. (A.D.850–1050), conditions were cool and dry, and from ca.830–650 cal yr B.P. (A.D. 1120–1300), conditions werewarm and dry. As in the Mono Lake record, these dryperiods were terminated by periods of increased moisture,e.g., 800–730 cal yr B.P. (A.D. 1150–1220) was warm andwet in the White Mountains, and 650–300 cal yr B.P. (A.D.1300–1650) was cool and wet. As severe as these droughtswere—they also appear in tree-ring records from the region(Graumlich, 1993; Hughes and Funkhouser, 1998)—theywere considerably less severe than the droughts detected inthe early Holocene by Brunelle and Anderson (2003) basedon charcoal remains indicating frequent and intense fires.Fire histories provide records of decadal/centennial varia-tions in temperature and interannual fluctuations inprecipitation (Swetnam, 1993; Brunelle and Anderson,2003).The late Holocene tree-ring studies from the San Joaquin
watershed region and the mountain ranges of the GreatBasin indicate that (1) the 20th century experiencedrelatively stable climate conditions, lacking major droughtswhen considered on a millennial timescale, though therehave been brief and intense droughts such as in, 1977(Hughes and Brown, 1992; Hughes et al., 1996) and (2)major, sustained droughts were more common before ca.450 cal yr B.P. (A.D. 1500) than after (Hughes and Fun-khouser, 1998). Several climate reconstructions fromsubalpine tree-ring records of in the San Joaquin watershedand the White Mountains (LaMarche, 1974a; Graumlich,1993; Graybill and Funkhouser, 1999) have shown thatunusually dry conditions prevailed during the MedievalClimate Anomaly, followed by wetter (and cooler) condi-tions during the 17th to the, 19th centuries, referred to asthe Little Ice Age. For example, Graybill and Funkhouser(1999) describe temperature reconstructions for GrantsGrove based on tree-ring chronologies that reveal a rapidwarming trend from 950 to 800 cal yr B.P. (A.D.1000–1150), and a cooling trend in the 17th and early,19th centuries. Fire frequency (and severity), as seen in firescars from giant Sequoia groves (Swetnam, 1993) alsosupports this pattern. Swetnam (1993) found more frequentfires occurred during a warm period from 950 to650 cal yr B.P. (A.D. 1000–A.D. 1300), and fewer duringthe cooler periods from 1450 to 950 cal yr B.P. (A.D.500–A.D. 1000) and after 650 cal yr B.P. Finally, Graum-lich (1993) analyzed 20-yr and 50-yr precipitation andtemperature means in the region for the last 1000 years andfound a period of extended summer warmth at Grants
ARTICLE IN PRESSF.P. Malamud-Roam et al. / Quaternary Science Reviews 25 (2006) 1570–1598 1585
Grove in Sequoia National Park during the 12th century,with temperatures about 0.24 1C warmer than the,1928–1988 instrumental mean from A.D. 1118–1167(832–783 cal yr B.P.). The coldest reconstructed 50-yearperiod was from A.D. 1595–1644 (355–306 cal yr B.P.),and was 0.45 1C cooler than the instrumental mean.
3.3. The San Francisco Bay–delta estuary
Unlike the watershed, most of the paleoclimatic infor-mation from San Francisco Bay and its immediatesurroundings comes from sediment analyses. As notedpreviously, these paleoclimatic resources provide coarsertemporal resolution, but they describe the estuarinevariations and responses to climate changes ‘‘in the firstperson’’ (as the evidence of local ecological change arepreserved in situ) rather than through inferences basedupon distant climatic and hydrologic forcings seen inpaleoclimatic resources of the Sierra Nevada. There is aneed for more comprehensive core collection from the Bayand its surrounding tidal marshes. There is significantwithin and between marsh variability due to site specificfactors that can pose challenges to paleoclimatic inter-pretations. However, considerable paleoclimate researchhas been underway in the estuary, and is described below.
3.3.1. Bay sediment records
Estuary sediment cores have been collected from foursites in the San Francisco Bay: two sites in San Pablo Bay(Ingram and DePaolo, 1993; Ingram et al., 1996a), one sitein Richardson Bay (Ingram and DePaolo, 1993) and onesite near Oyster Point in the Central Bay (Ingram et al.,1996b; Fig. 2). Strontium isotopic compositions incarbonate shells of fossil mollusks in the sediment coreswere measured to reconstruct paleosalinity in RichardsonBay during the past 4300 yr, and in San Pablo Bay duringthe past 1100 yr (Ingram and DePaolo, 1993). Oxygen andcarbon isotopic compositions were measured in carbonateshells from the clam species, Macoma nasuta, and themussel Mytilus edulis, in another sediment core from SanPablo Bay to reconstruct a 2100-yr record of paleosalinity,though a hiatus occurred in that record between ca. 1670and 750 cal yr B.P. (Ingram et al., 1996c). Carbon andoxygen isotopic compositions were measured in a corefrom Oyster Point to reconstruct a 5900 years record ofpaleosalinity, excluding the period from ca. 2700 cal yr B.P.to 3800 cal yr B.P., which lacked fossil material (Ingramet al., 1996b). These studies show salinity in the estuaryincreasing over the past 2500–4300 as sea level rose.Higher-frequency variations in salinity (and thus freshwater inflow) are superimposed upon the overall trend ofincreasing salinity.
Variations inferred from the Bay cores reflect timescalesof about 90, 200 and 500 years (Ingram and DePaolo,1993; Ingram et al., 1996a, b). These same timescales arefound in the spectra of radiocarbon generation in theatmosphere (Stuiver and Quay, 1980; Damon et al., 1989;
Stuiver and Braziunas, 1992) and in other paleoclimaterecords (Beer et al., 1988; Halfman and Johnson, 1988;Anderson, 1991), implying control by a common mechan-ism. Correlations between the Bay cores are hampered bythe error involved in the radiocarbon dating estuarinecarbonates, and relatively coarse temporal resolutionprecludes detection of interannual fluctuations (less than10 years). However, the core records are in generalagreement and identify the following changes in freshwater inflows from the Delta. Relatively low fresh waterinflow during the periods: ca. 1230–1150, 1400–1300,2700–2600 and 3700–3450 cal yr B.P. (Ingram et al.,1996b, c) interspersed with relatively high fresh waterinflow during the periods: ca. 1180–1100, 2400–2200,3400–3100, and 5100–3800 cal yr B.P. (Ingram et al.,1996b, c). During the past 1000 years, five periods of lowerthan modern stream flow are detected in the cores, thoughat slightly different times (Ingram et al., 1996b, c). Fourhigh-flow periods occurred in the last 700 years at OysterPoint (Fig. 9).
3.3.2. Tidal marshes
Tidal marshes began to form around the San FranciscoBay estuary about 6000 years ago, when the early Holocenerate of sea-level rise (following the melting of continentalice sheets) slowed enough to support marsh development(Atwater et al., 1979). Evidence from marshes that existedaround the estuary from ca. 6200 to 3500 years (Gomanand Wells, 2000) ago suggests that, initially, marshes wereintermittent. Sediments deposited in incipient tidal marshesduring this period alternated between marsh deposits andsubtidal estuarine deposits (‘‘Bay mud’’) at Browns Island,Peyton Hill (Goman and Wells, 2000) and China Camp(Goman, 1996; Malamud-Roam, 2002). This intermittencyhas been attributed to short-term variations in the rate ofsea level rise in the estuary, such that sediment suppliesprovided by inflows from the upstream watersheds wereinsufficient to keep pace during the periods of more rapidsea-level rise (Goman and Wells, 2000) but were sufficientto keep pace during periods of slower sea-level rise. Thelong-term trend since about 3500 cal yr B.P. has beentoward shoaling, development and expansion of marshdeposits (Goman and Wells, 2000; Malamud-Roam, 2002).The marshes have been expanding since that time, reachingmaximum extents by A.D. 1850, when human developmentand land-use practices reduced marsh areas around the SanFrancisco Bay estuary (San Francisco Estuary Project,1992).Carbon isotope, pollen and diatom records from tidal
marshes around the Bay show evidence of increasedsalinity (as seen, for example by dominance of salt tolerantplants) over the last 3000 years (May, 1999; Goman andWells, 2000; Byrne et al., 2001; Malamud-Roam, 2002;Starratt, 2003, 2004; Malamud-Roam and Ingram, 2004).This trend can be seen at Browns Island near the mouthof the Delta, where macrofossils of the fresh waterplant Phragmites communis, which dominated the organic
ARTICLE IN PRESS
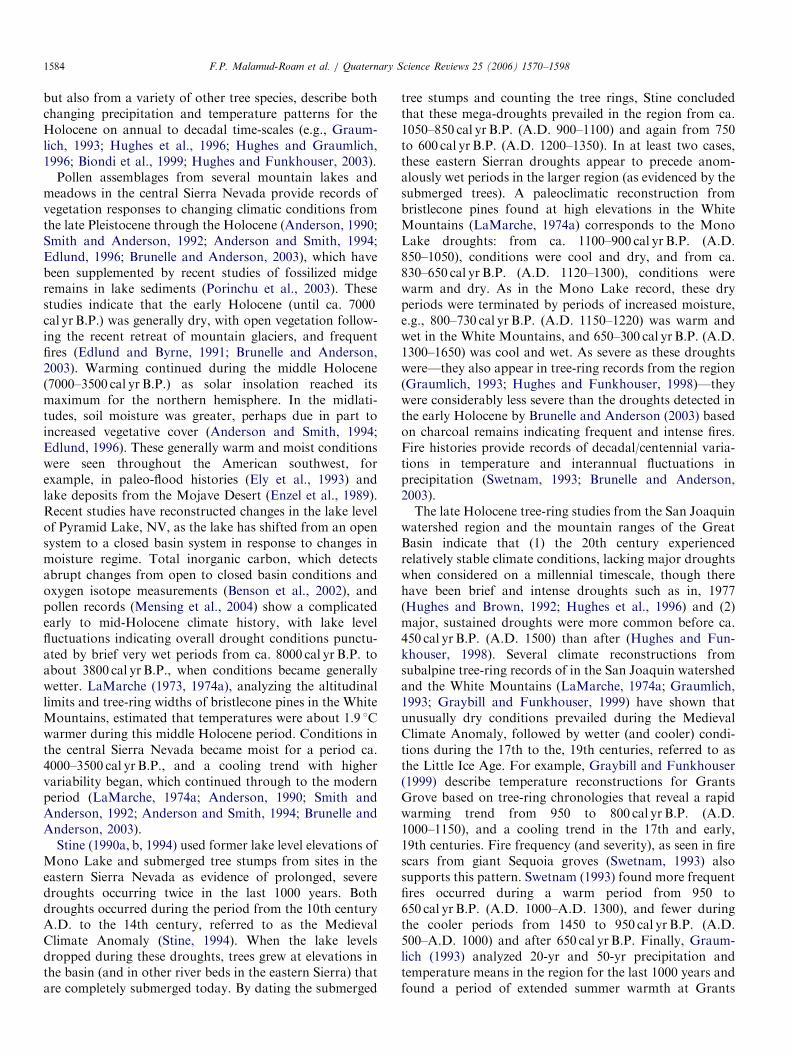
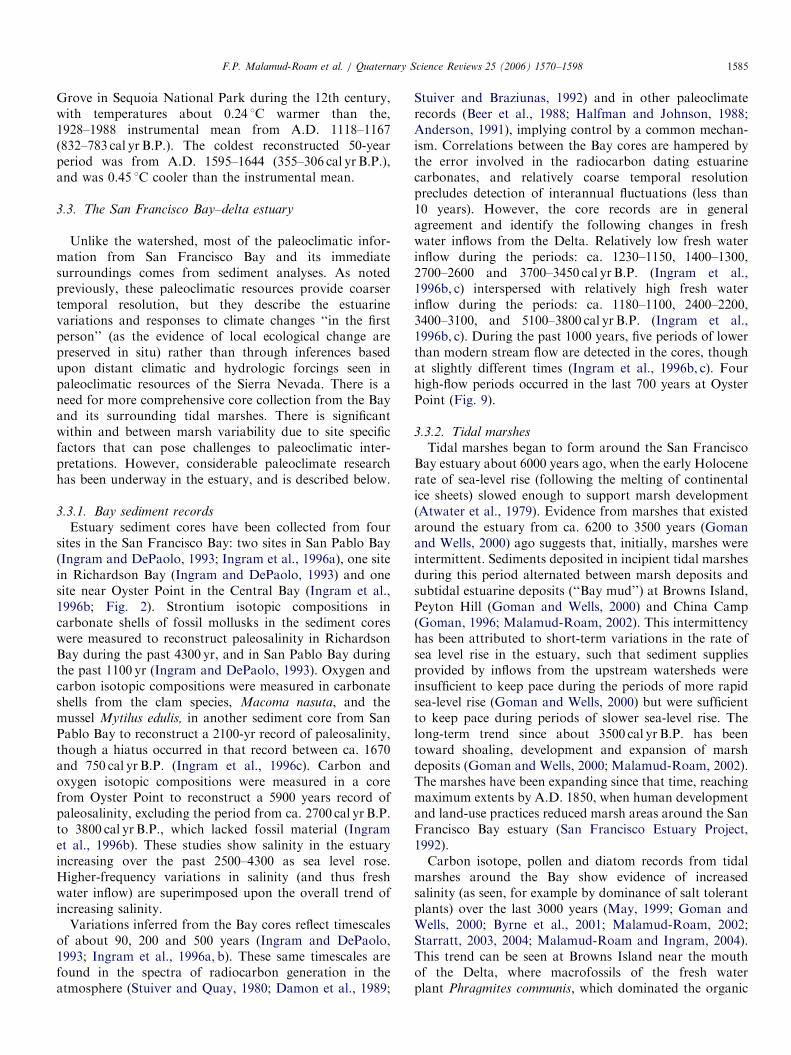
(A) (B) (C) (D)
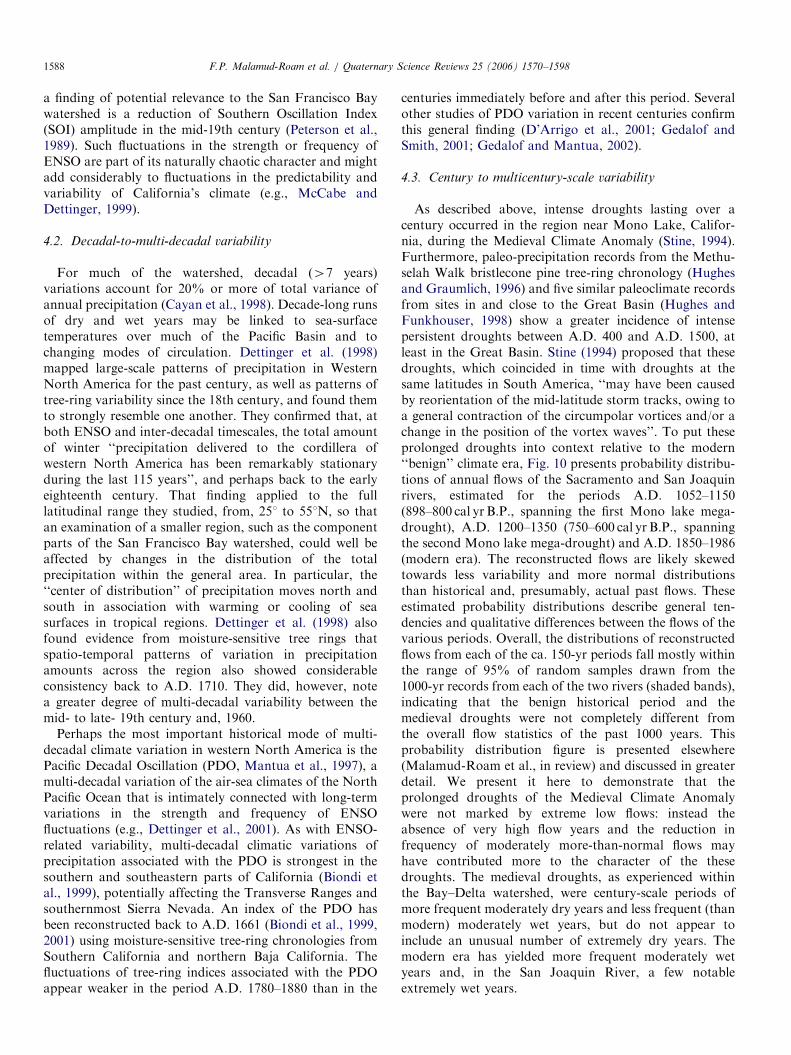
Fig. 9. San Francisco Bay estuary paleosalinity records. Top: sedimentary records covering the full history of the Holocene marshes. For marsh sites
(A–C), the stable C isotope compositions are shown on the left, with d13C values increasing (less negative) to the right and indicating greater dominance of
salt-tolerant grasses; the marsh pollen index is shown on the right, with Chenopodiaceae (pickleweed) pollen as a fraction of the sum of Chenopodiacae
and Cyperaceae (sedge) pollen, unity represents full dominance by pickleweed pollen and dashed line represents pre-European disturbance mean. (A)
China Camp State Park in San Pablo Bay. (B) Benicia State Park in Carquinez strait. (C) Roe Island in Suisun Bay (source for pollen: May, 1999). (D)
Oyster Point, San Francisco salinity derived from stable oxygen isotope compositions (Ingram, et al., 1996b). Bottom: the last 400 years compared against
salinity at Fort Point reconstructed from Central Valley Oak tree-ring chronologies (source: Stahle et al., 2001). Shaded period ca. A.D. 1850–1900
indicates period of relatively fresh conditions seen in records and ca A.D. 1625–1675 indicates period of relatively high salinity seen in records.
F.P. Malamud-Roam et al. / Quaternary Science Reviews 25 (2006) 1570–15981586
sediments before 1000 cal yrs B.P., essentially disappearedand were replaced by Scirpus americanus (a fresh- tobrackish water tule species) (Atwater, 1980; Goman andWells, 2000). Increasingly brackish conditions have alsobeen indicated by the appearance of the salt tolerantS. virginica (pickleweed) pollen on the island (May, 1999)and Atwater (1980) found rhizomes of the salt grassDistichlis spicata that returned a radiocarbon date of5407120 14C yr B.P. (calibrated 2 sigma range is310–690 cal yr B.P.).
Similar patterns of plant-species change over the past3000 years have been detected at other marsh sites. AtPeyton Hill, macrofossils of Scirpus americanus declined inabundance, to be replaced by S. virginica and Triglochin
maritima (both salt-tolerant, high-marsh species) (Goman
and Wells, 2000; Goman, 2001). At China Camp,Cyperaceae pollen (probably representing species ofScirpus) and Typha pollen declined during the past 3000years, again replaced by S. virginica, which has sincedominated the assemblage (Malamud-Roam, 2002).A comparison of paleoclimate records (pollen and stable
carbon isotope compositions) from a series of localmarshes (and salinity from Oyster Point) along the naturalsalinity gradient that spans the northern reach of theestuary shows substantial agreement between the records(Fig. 9). Plant assemblages at individual marsh sitesrespond to a host of physical processes, but the dominantphysical influences are salinity and depth and duration oftidal inundation (Adam, 1990; Mitsch and Gosselink, 1993;Sanderson et al., 2000). The agreement among these
ARTICLE IN PRESSF.P. Malamud-Roam et al. / Quaternary Science Reviews 25 (2006) 1570–1598 1587
records implies salinity changes that were estuary-wide anddue to changing inflow patterns. The differences betweenrecords may be attributed to a combination of methodo-logical issues (sampling frequency, core chronology) andsite-specific ecological differences (site elevation, locationrelative to channel, sedimentation rates over time). Forexample, both Roe Island (May, 1999) and Rush Ranch(Byrne et al., 2001; Starratt, 2004) are located in SuisunBay (Fig. 2), but due to its location within the channel, RoeIsland may be quite susceptible to estuary salinityfluctuations (May, 1999) perhaps more so than RushRanch, which is located inland and may receive runofffrom surrounding uplands.
A salinity record at Fort Point, near the Golden Gage, asreconstructed from Central Valley Blue Oak tree-ringchronologies (Stahle et al., 2001), shows periods withrelatively low salinity (e.g., ca. A.D. 1850–1900, Fig. 9,shaded) overlap with periods of less salt-adaptedplant species, and extended (multi-decadal) periodsof higher than average salinity at Fort Point overlapwith increased domination of salt tolerant plants inseveral of the vegetation records, for example betweenA.D. 1625 and 1675 (Fig. 9, shaded). The tree-ringrecord is highly resolved, though short, and can beextended using the tidal marsh sedimentary records.Furthermore, the sedimentary records from the Estuaryprovide direct evidence of ecosystem responses to theclimate variations that resulted in the changing salinitypatterns at Fort Point.
San Francisco estuary tidal marsh paleoclimate recordsindicate that relatively fresh conditions existed in the Bayestuary from 3600 to 2000 cal yr B.P. and from ca.750–300 cal yr B.P. (Byrne et al., 2001; Malamud-Roam,2002; Starratt, 2004). This latter period of relatively freshconditions overlaps with the period of relatively cool andmoist conditions seen elsewhere in the paleoclimate recordfrom the watershed region, particularly the San Joaquindrainage area, though interestingly, conditions appear tohave become fresher in the Bay before the onset of coolingin the southern watershed (e.g., Mono lake recorddescribed by Stine (1990a) suggests a major droughtoccurred at 750 cal yr B.P.). These periods of fresh condi-tions in the estuary were interspersed with periods whenmore salt-tolerant plant species dominated the marshes,from 1650 to 1300 cal yr B.P., 1000–800 cal yr B.P., andover the last century, suggesting increased salinity in theestuary (i.e., reduced fresh water inflow). The second ofthese high salinity periods corresponds to the first of themegadroughts seen in the paleoclimate records from theeastern and central Sierra Nevada. Several marsh sites alsoshow evidence of a period of increased estuary salinityoccurring ca. 300 cal yr B.P. (Malamud-Roam and Ingram,2004). The exact timing of this event is difficult because ofvariations in radiocarbon production occurring in recentcenturies (Stuiver and Quay, 1980), though it may havebeen a response to the major drought described in tree-ringpaleoclimate records from the Western US occurring
ca. 370 cal yr B.P. (A.D. 1580) (e.g., Meko et al., 2001;Brown et al., 1992; Hughes et al., 1990, 1996).
4. Discussion
4.1. Sub-decadal timescales of variability
Much progress has been made in recent years inreconstructing the past behavior of the El Nino-SouthernOscillation phenomenon, as recorded by the SouthernOscillation Index (SOI) and by sea surface temperatures atkey locations in the tropical Pacific Ocean. Thesereconstructions have used a variety of proxy indicators,including proxies from remote regions that are impacted byENSO (Stahle et al., 1998; Mann et al., 2000) and,increasingly, proxies from ‘‘core’’ ENSO regions in thetropical Pacific (Cobb et al., 2001; Evans et al., 2001). Thelocation of the Aleutian-Alaskan Low pressure cell, whichis partly modulated by ENSO, is the principal predictor forhistorical precipitation variations in California climatepatterns, hence wintertime salinity variability in SanFrancisco Bay (Peterson et al., 1995). Now that morerobust reconstructions of ENSO variations from the ‘‘coreregion’’ in the tropical Pacific are becoming available, thepossibility exists of examining more fully the links betweenENSO and subregional precipitation variations in the SanFrancisco Bay watershed.A number of high-resolution proxies from California
exhibit spectral power in the 3–7 year range that is typicalof ENSO influences (Dettinger et al., 2001); however,connecting local climate variations to ENSO in eitherinstrumental or proxy records is a complex undertaking(Schoner and Nicholson, 1989). Due to the state’sgeographical location, spanning nearly 101 of latitude,ENSO events may result in either increased or decreasedannual precipitation; albeit, in either case, often withextreme conditions (Peterson et al., 1995). ENSO affectsprecipitation more reliably in the Pacific Northwest and inthe Southwest, including southern California, than incentral California, with El Ninos being associated withwetter conditions in the Southwest and drier conditions inthe Pacific Northwest, north of California (Cayan andWebb, 1992). La Ninas bring the opposite precipitationconditions, and indeed are typically more reliable pre-dictors of precipitation in the Northwest and Southwestthan even El Ninos (Dettinger et al., 2002). Cayan et al.(1999) write that ‘‘major floods in the Sierra Nevadaappear to be more likely during La Nina than during ElNino’’, whereas major floods in the coastal plain and coastranges occur more frequently during El Nino years. Off thecentral coast, on average, El Nino years are associated withwetter years, particularly strong and very strong El Ninoyears (Jones and Kennett, 1999), though a 600-yr tree-ringrecvonstruction of Santa Barbara precipitation is due to atendency for wet El Nino years to be extremely wet(Haston and Michaelson, 1994). Despite the occasionallyunreliable linkage between ENSO and California’s climate,
ARTICLE IN PRESSF.P. Malamud-Roam et al. / Quaternary Science Reviews 25 (2006) 1570–15981588
a finding of potential relevance to the San Francisco Baywatershed is a reduction of Southern Oscillation Index(SOI) amplitude in the mid-19th century (Peterson et al.,1989). Such fluctuations in the strength or frequency ofENSO are part of its naturally chaotic character and mightadd considerably to fluctuations in the predictability andvariability of California’s climate (e.g., McCabe andDettinger, 1999).
4.2. Decadal-to-multi-decadal variability
For much of the watershed, decadal (47 years)variations account for 20% or more of total variance ofannual precipitation (Cayan et al., 1998). Decade-long runsof dry and wet years may be linked to sea-surfacetemperatures over much of the Pacific Basin and tochanging modes of circulation. Dettinger et al. (1998)mapped large-scale patterns of precipitation in WesternNorth America for the past century, as well as patterns oftree-ring variability since the 18th century, and found themto strongly resemble one another. They confirmed that, atboth ENSO and inter-decadal timescales, the total amountof winter ‘‘precipitation delivered to the cordillera ofwestern North America has been remarkably stationaryduring the last 115 years’’, and perhaps back to the earlyeighteenth century. That finding applied to the fulllatitudinal range they studied, from, 251 to 551N, so thatan examination of a smaller region, such as the componentparts of the San Francisco Bay watershed, could well beaffected by changes in the distribution of the totalprecipitation within the general area. In particular, the‘‘center of distribution’’ of precipitation moves north andsouth in association with warming or cooling of seasurfaces in tropical regions. Dettinger et al. (1998) alsofound evidence from moisture-sensitive tree rings thatspatio-temporal patterns of variation in precipitationamounts across the region also showed considerableconsistency back to A.D. 1710. They did, however, notea greater degree of multi-decadal variability between themid- to late- 19th century and, 1960.
Perhaps the most important historical mode of multi-decadal climate variation in western North America is thePacific Decadal Oscillation (PDO, Mantua et al., 1997), amulti-decadal variation of the air-sea climates of the NorthPacific Ocean that is intimately connected with long-termvariations in the strength and frequency of ENSOfluctuations (e.g., Dettinger et al., 2001). As with ENSO-related variability, multi-decadal climatic variations ofprecipitation associated with the PDO is strongest in thesouthern and southeastern parts of California (Biondi etal., 1999), potentially affecting the Transverse Ranges andsouthernmost Sierra Nevada. An index of the PDO hasbeen reconstructed back to A.D. 1661 (Biondi et al., 1999,2001) using moisture-sensitive tree-ring chronologies fromSouthern California and northern Baja California. Thefluctuations of tree-ring indices associated with the PDOappear weaker in the period A.D. 1780–1880 than in the
centuries immediately before and after this period. Severalother studies of PDO variation in recent centuries confirmthis general finding (D’Arrigo et al., 2001; Gedalof andSmith, 2001; Gedalof and Mantua, 2002).
4.3. Century to multicentury-scale variability
As described above, intense droughts lasting over acentury occurred in the region near Mono Lake, Califor-nia, during the Medieval Climate Anomaly (Stine, 1994).Furthermore, paleo-precipitation records from the Methu-selah Walk bristlecone pine tree-ring chronology (Hughesand Graumlich, 1996) and five similar paleoclimate recordsfrom sites in and close to the Great Basin (Hughes andFunkhouser, 1998) show a greater incidence of intensepersistent droughts between A.D. 400 and A.D. 1500, atleast in the Great Basin. Stine (1994) proposed that thesedroughts, which coincided in time with droughts at thesame latitudes in South America, ‘‘may have been causedby reorientation of the mid-latitude storm tracks, owing toa general contraction of the circumpolar vortices and/or achange in the position of the vortex waves’’. To put theseprolonged droughts into context relative to the modern‘‘benign’’ climate era, Fig. 10 presents probability distribu-tions of annual flows of the Sacramento and San Joaquinrivers, estimated for the periods A.D. 1052–1150(898–800 cal yr B.P., spanning the first Mono lake mega-drought), A.D. 1200–1350 (750–600 cal yr B.P., spanningthe second Mono lake mega-drought) and A.D. 1850–1986(modern era). The reconstructed flows are likely skewedtowards less variability and more normal distributionsthan historical and, presumably, actual past flows. Theseestimated probability distributions describe general ten-dencies and qualitative differences between the flows of thevarious periods. Overall, the distributions of reconstructedflows from each of the ca. 150-yr periods fall mostly withinthe range of 95% of random samples drawn from the1000-yr records from each of the two rivers (shaded bands),indicating that the benign historical period and themedieval droughts were not completely different fromthe overall flow statistics of the past 1000 years. Thisprobability distribution figure is presented elsewhere(Malamud-Roam et al., in review) and discussed in greaterdetail. We present it here to demonstrate that theprolonged droughts of the Medieval Climate Anomalywere not marked by extreme low flows: instead theabsence of very high flow years and the reduction infrequency of moderately more-than-normal flows mayhave contributed more to the character of the thesedroughts. The medieval droughts, as experienced withinthe Bay–Delta watershed, were century-scale periods ofmore frequent moderately dry years and less frequent (thanmodern) moderately wet years, but do not appear toinclude an unusual number of extremely dry years. Themodern era has yielded more frequent moderately wetyears and, in the San Joaquin River, a few notableextremely wet years.
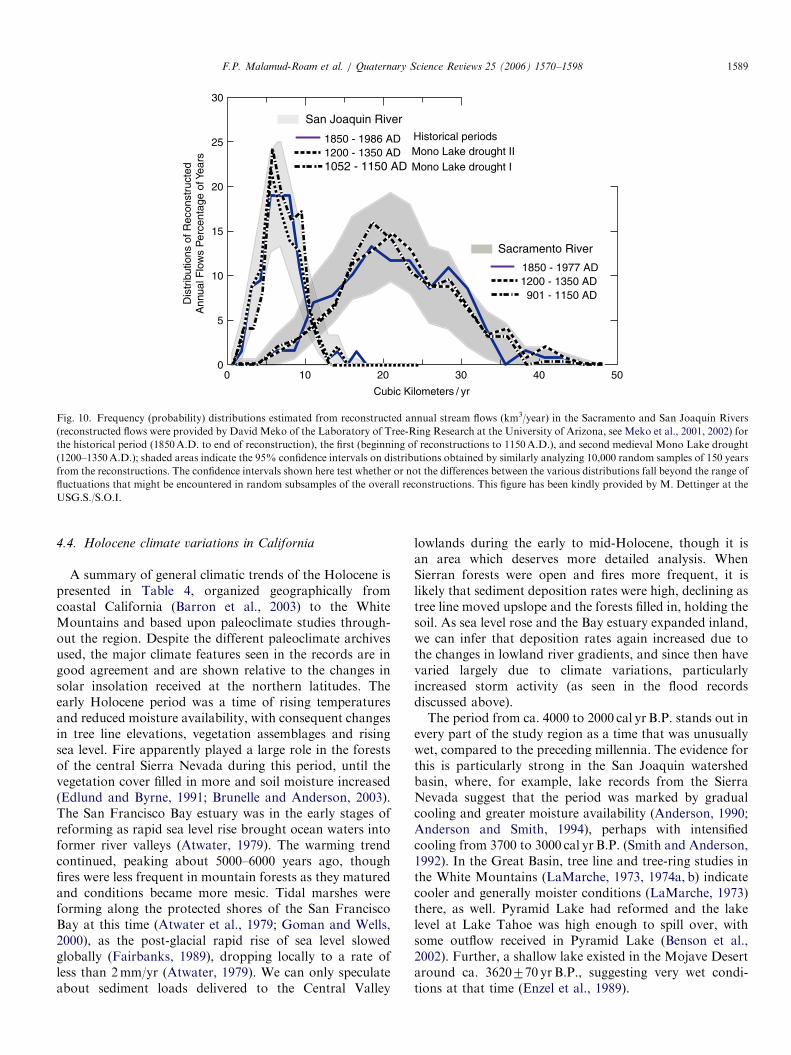
ARTICLE IN PRESS
Mono Lake drought IIMono Lake drought I
Historical periods
Cubic Kilometers / yr
Sacramento River
1850 - 1986 AD1200 - 1350 AD
San Joaquin River
1052 - 1150 AD
1850 - 1977 AD1200 - 1350 AD 901 - 1150 AD
30
25
20
15
10
5
00 10 20 30 40 50
Dis
trib
utio
ns o
f Rec
onst
ruct
edA
nnua
l Flo
ws
Per
cent
age
of Y
ears
Fig. 10. Frequency (probability) distributions estimated from reconstructed annual stream flows (km3/year) in the Sacramento and San Joaquin Rivers
(reconstructed flows were provided by David Meko of the Laboratory of Tree-Ring Research at the University of Arizona, see Meko et al., 2001, 2002) for
the historical period (1850A.D. to end of reconstruction), the first (beginning of reconstructions to 1150A.D.), and second medieval Mono Lake drought
(1200–1350A.D.); shaded areas indicate the 95% confidence intervals on distributions obtained by similarly analyzing 10,000 random samples of 150 years
from the reconstructions. The confidence intervals shown here test whether or not the differences between the various distributions fall beyond the range of
fluctuations that might be encountered in random subsamples of the overall reconstructions. This figure has been kindly provided by M. Dettinger at the
USG.S./S.O.I.
F.P. Malamud-Roam et al. / Quaternary Science Reviews 25 (2006) 1570–1598 1589
4.4. Holocene climate variations in California
A summary of general climatic trends of the Holocene ispresented in Table 4, organized geographically fromcoastal California (Barron et al., 2003) to the WhiteMountains and based upon paleoclimate studies through-out the region. Despite the different paleoclimate archivesused, the major climate features seen in the records are ingood agreement and are shown relative to the changes insolar insolation received at the northern latitudes. Theearly Holocene period was a time of rising temperaturesand reduced moisture availability, with consequent changesin tree line elevations, vegetation assemblages and risingsea level. Fire apparently played a large role in the forestsof the central Sierra Nevada during this period, until thevegetation cover filled in more and soil moisture increased(Edlund and Byrne, 1991; Brunelle and Anderson, 2003).The San Francisco Bay estuary was in the early stages ofreforming as rapid sea level rise brought ocean waters intoformer river valleys (Atwater, 1979). The warming trendcontinued, peaking about 5000–6000 years ago, thoughfires were less frequent in mountain forests as they maturedand conditions became more mesic. Tidal marshes wereforming along the protected shores of the San FranciscoBay at this time (Atwater et al., 1979; Goman and Wells,2000), as the post-glacial rapid rise of sea level slowedglobally (Fairbanks, 1989), dropping locally to a rate ofless than 2mm/yr (Atwater, 1979). We can only speculateabout sediment loads delivered to the Central Valley
lowlands during the early to mid-Holocene, though it isan area which deserves more detailed analysis. WhenSierran forests were open and fires more frequent, it islikely that sediment deposition rates were high, declining astree line moved upslope and the forests filled in, holding thesoil. As sea level rose and the Bay estuary expanded inland,we can infer that deposition rates again increased due tothe changes in lowland river gradients, and since then havevaried largely due to climate variations, particularlyincreased storm activity (as seen in the flood recordsdiscussed above).The period from ca. 4000 to 2000 cal yr B.P. stands out in
every part of the study region as a time that was unusuallywet, compared to the preceding millennia. The evidence forthis is particularly strong in the San Joaquin watershedbasin, where, for example, lake records from the SierraNevada suggest that the period was marked by gradualcooling and greater moisture availability (Anderson, 1990;Anderson and Smith, 1994), perhaps with intensifiedcooling from 3700 to 3000 cal yr B.P. (Smith and Anderson,1992). In the Great Basin, tree line and tree-ring studies inthe White Mountains (LaMarche, 1973, 1974a, b) indicatecooler and generally moister conditions (LaMarche, 1973)there, as well. Pyramid Lake had reformed and the lakelevel at Lake Tahoe was high enough to spill over, withsome outflow received in Pyramid Lake (Benson et al.,2002). Further, a shallow lake existed in the Mojave Desertaround ca. 3620770 yr B.P., suggesting very wet condi-tions at that time (Enzel et al., 1989).
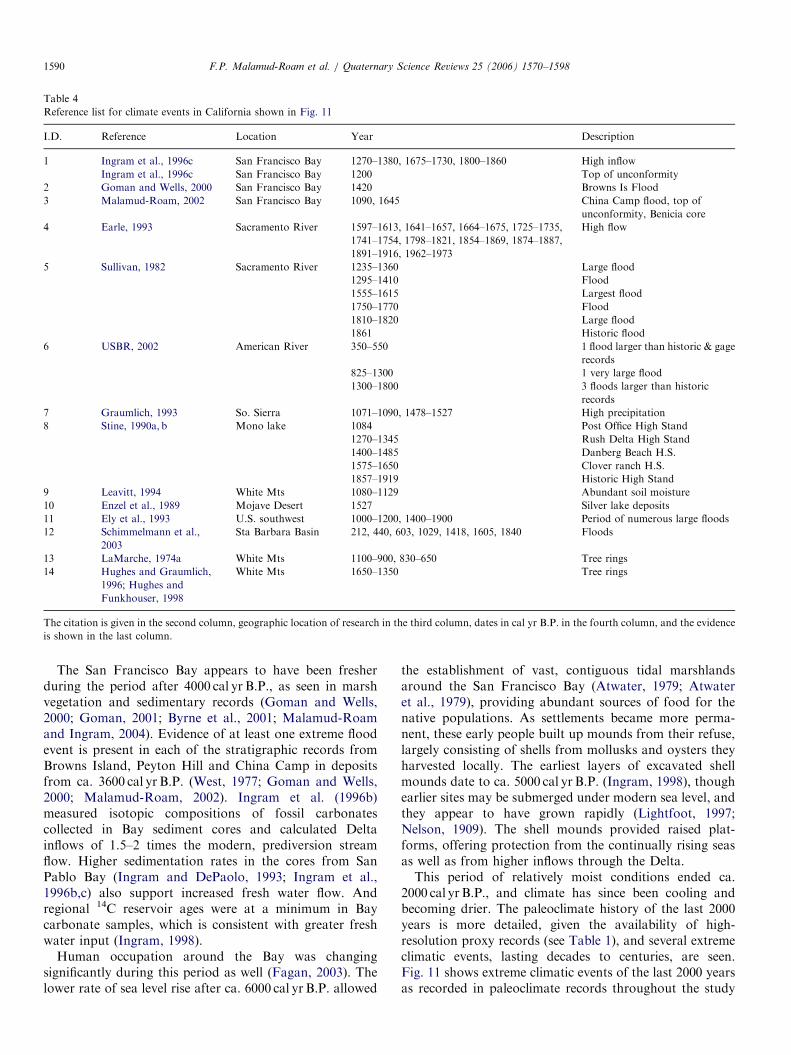
ARTICLE IN PRESS
Table 4
Reference list for climate events in California shown in Fig. 11
I.D. Reference Location Year Description
1 Ingram et al., 1996c San Francisco Bay 1270–1380, 1675–1730, 1800–1860 High inflow
Ingram et al., 1996c San Francisco Bay 1200 Top of unconformity
2 Goman and Wells, 2000 San Francisco Bay 1420 Browns Is Flood
3 Malamud-Roam, 2002 San Francisco Bay 1090, 1645 China Camp flood, top of
unconformity, Benicia core
4 Earle, 1993 Sacramento River 1597–1613, 1641–1657, 1664–1675, 1725–1735,
1741–1754, 1798–1821, 1854–1869, 1874–1887,
1891–1916, 1962–1973
High flow
5 Sullivan, 1982 Sacramento River 1235–1360 Large flood
1295–1410 Flood
1555–1615 Largest flood
1750–1770 Flood
1810–1820 Large flood
1861 Historic flood
6 USBR, 2002 American River 350–550 1 flood larger than historic & gage
records
825–1300 1 very large flood
1300–1800 3 floods larger than historic
records
7 Graumlich, 1993 So. Sierra 1071–1090, 1478–1527 High precipitation
8 Stine, 1990a, b Mono lake 1084 Post Office High Stand
1270–1345 Rush Delta High Stand
1400–1485 Danberg Beach H.S.
1575–1650 Clover ranch H.S.
1857–1919 Historic High Stand
9 Leavitt, 1994 White Mts 1080–1129 Abundant soil moisture
10 Enzel et al., 1989 Mojave Desert 1527 Silver lake deposits
11 Ely et al., 1993 U.S. southwest 1000–1200, 1400–1900 Period of numerous large floods
12 Schimmelmann et al.,
2003
Sta Barbara Basin 212, 440, 603, 1029, 1418, 1605, 1840 Floods
13 LaMarche, 1974a White Mts 1100–900, 830–650 Tree rings
14 Hughes and Graumlich,
1996; Hughes and
Funkhouser, 1998
White Mts 1650–1350 Tree rings
The citation is given in the second column, geographic location of research in the third column, dates in cal yr B.P. in the fourth column, and the evidence
is shown in the last column.
F.P. Malamud-Roam et al. / Quaternary Science Reviews 25 (2006) 1570–15981590
The San Francisco Bay appears to have been fresherduring the period after 4000 cal yr B.P., as seen in marshvegetation and sedimentary records (Goman and Wells,2000; Goman, 2001; Byrne et al., 2001; Malamud-Roamand Ingram, 2004). Evidence of at least one extreme floodevent is present in each of the stratigraphic records fromBrowns Island, Peyton Hill and China Camp in depositsfrom ca. 3600 cal yr B.P. (West, 1977; Goman and Wells,2000; Malamud-Roam, 2002). Ingram et al. (1996b)measured isotopic compositions of fossil carbonatescollected in Bay sediment cores and calculated Deltainflows of 1.5–2 times the modern, prediversion streamflow. Higher sedimentation rates in the cores from SanPablo Bay (Ingram and DePaolo, 1993; Ingram et al.,1996b,c) also support increased fresh water flow. Andregional 14C reservoir ages were at a minimum in Baycarbonate samples, which is consistent with greater freshwater input (Ingram, 1998).
Human occupation around the Bay was changingsignificantly during this period as well (Fagan, 2003). Thelower rate of sea level rise after ca. 6000 cal yr B.P. allowed
the establishment of vast, contiguous tidal marshlandsaround the San Francisco Bay (Atwater, 1979; Atwateret al., 1979), providing abundant sources of food for thenative populations. As settlements became more perma-nent, these early people built up mounds from their refuse,largely consisting of shells from mollusks and oysters theyharvested locally. The earliest layers of excavated shellmounds date to ca. 5000 cal yr B.P. (Ingram, 1998), thoughearlier sites may be submerged under modern sea level, andthey appear to have grown rapidly (Lightfoot, 1997;Nelson, 1909). The shell mounds provided raised plat-forms, offering protection from the continually rising seasas well as from higher inflows through the Delta.This period of relatively moist conditions ended ca.
2000 cal yr B.P., and climate has since been cooling andbecoming drier. The paleoclimate history of the last 2000years is more detailed, given the availability of high-resolution proxy records (see Table 1), and several extremeclimatic events, lasting decades to centuries, are seen.Fig. 11 shows extreme climatic events of the last 2000 yearsas recorded in paleoclimate records throughout the study
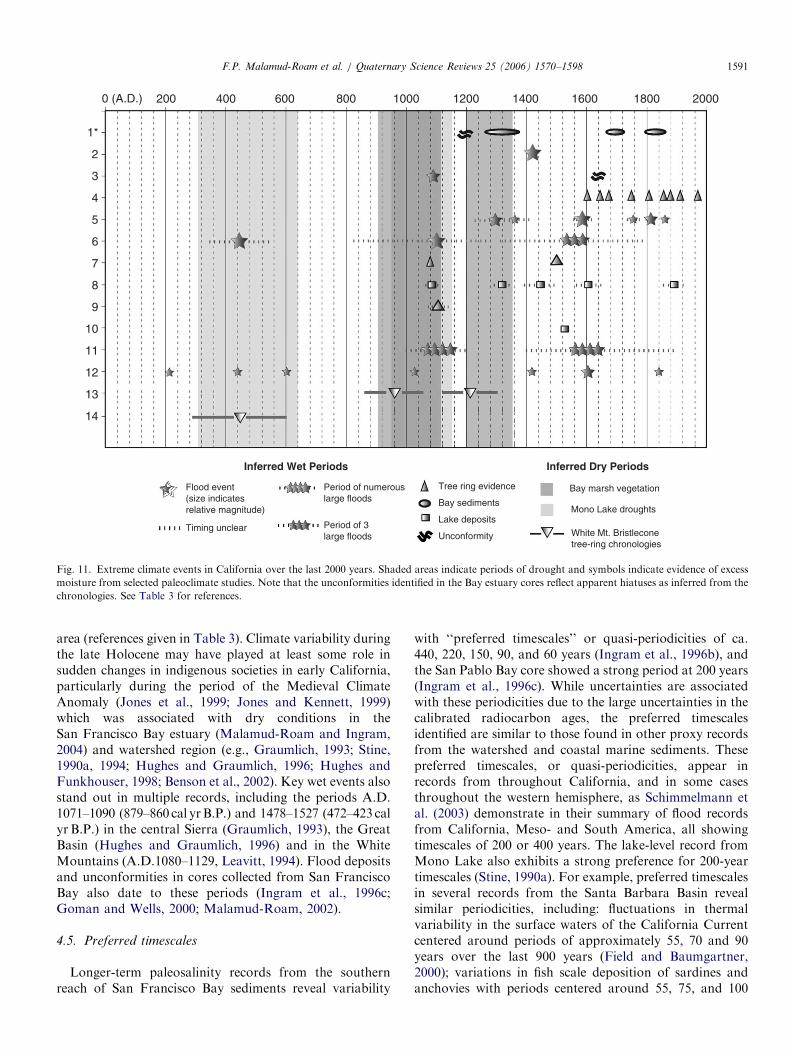
ARTICLE IN PRESS
1*
2
3
4
5
6
7
8
9
10
11
12
13
14
0 (A.D.) 200 400 600 800 1000 1200 1400 1600 1800 2000
Flood event(size indicatesrelative magnitude)
Timing unclear
Period of numerouslarge floods
Period of 3large floods
Tree ring evidence
Bay sediments
Lake deposits
Unconformity
Bay marsh vegetation
Mono Lake droughts
White Mt. Bristleconetree-ring chronologies
Inferred Wet Periods Inferred Dry Periods
Fig. 11. Extreme climate events in California over the last 2000 years. Shaded areas indicate periods of drought and symbols indicate evidence of excess
moisture from selected paleoclimate studies. Note that the unconformities identified in the Bay estuary cores reflect apparent hiatuses as inferred from the
chronologies. See Table 3 for references.
F.P. Malamud-Roam et al. / Quaternary Science Reviews 25 (2006) 1570–1598 1591
area (references given in Table 3). Climate variability duringthe late Holocene may have played at least some role insudden changes in indigenous societies in early California,particularly during the period of the Medieval ClimateAnomaly (Jones et al., 1999; Jones and Kennett, 1999)which was associated with dry conditions in theSan Francisco Bay estuary (Malamud-Roam and Ingram,2004) and watershed region (e.g., Graumlich, 1993; Stine,1990a, 1994; Hughes and Graumlich, 1996; Hughes andFunkhouser, 1998; Benson et al., 2002). Key wet events alsostand out in multiple records, including the periods A.D.1071–1090 (879–860 cal yrB.P.) and 1478–1527 (472–423 calyr B.P.) in the central Sierra (Graumlich, 1993), the GreatBasin (Hughes and Graumlich, 1996) and in the WhiteMountains (A.D.1080–1129, Leavitt, 1994). Flood depositsand unconformities in cores collected from San FranciscoBay also date to these periods (Ingram et al., 1996c;Goman and Wells, 2000; Malamud-Roam, 2002).
4.5. Preferred timescales
Longer-term paleosalinity records from the southernreach of San Francisco Bay sediments reveal variability
with ‘‘preferred timescales’’ or quasi-periodicities of ca.440, 220, 150, 90, and 60 years (Ingram et al., 1996b), andthe San Pablo Bay core showed a strong period at 200 years(Ingram et al., 1996c). While uncertainties are associatedwith these periodicities due to the large uncertainties in thecalibrated radiocarbon ages, the preferred timescalesidentified are similar to those found in other proxy recordsfrom the watershed and coastal marine sediments. Thesepreferred timescales, or quasi-periodicities, appear inrecords from throughout California, and in some casesthroughout the western hemisphere, as Schimmelmann etal. (2003) demonstrate in their summary of flood recordsfrom California, Meso- and South America, all showingtimescales of 200 or 400 years. The lake-level record fromMono Lake also exhibits a strong preference for 200-yeartimescales (Stine, 1990a). For example, preferred timescalesin several records from the Santa Barbara Basin revealsimilar periodicities, including: fluctuations in thermalvariability in the surface waters of the California Currentcentered around periods of approximately 55, 70 and 90years over the last 900 years (Field and Baumgartner,2000); variations in fish scale deposition of sardines andanchovies with periods centered around 55, 75, and 100
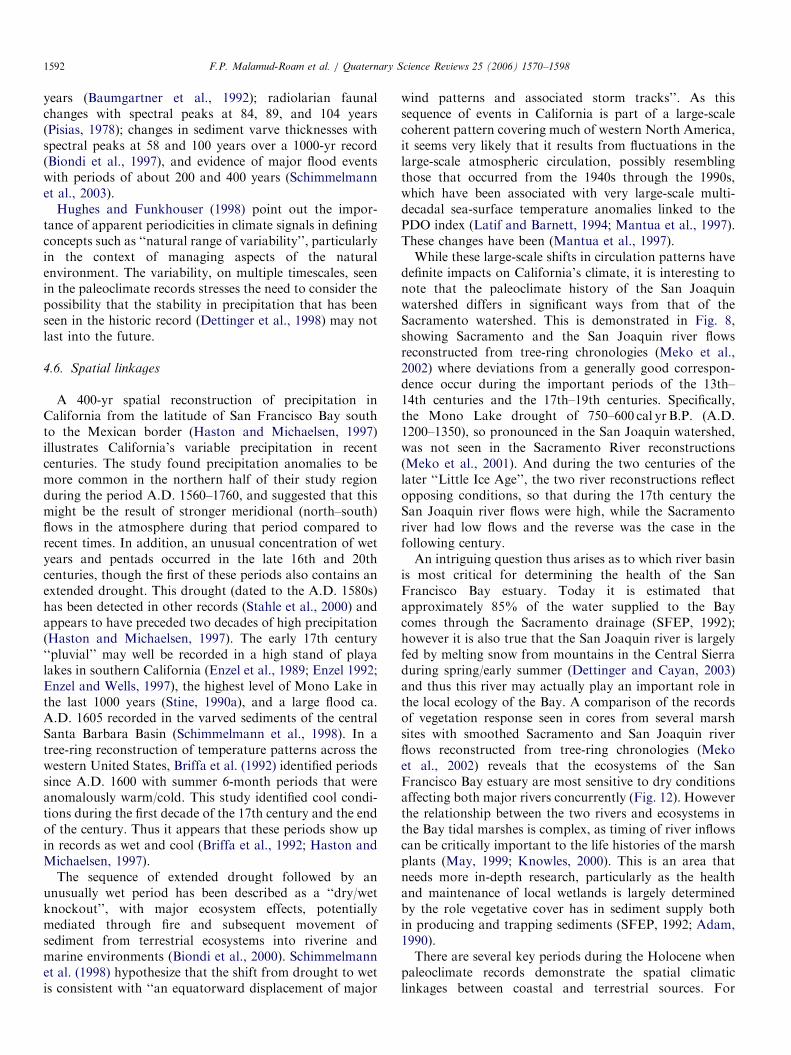
ARTICLE IN PRESSF.P. Malamud-Roam et al. / Quaternary Science Reviews 25 (2006) 1570–15981592
years (Baumgartner et al., 1992); radiolarian faunalchanges with spectral peaks at 84, 89, and 104 years(Pisias, 1978); changes in sediment varve thicknesses withspectral peaks at 58 and 100 years over a 1000-yr record(Biondi et al., 1997), and evidence of major flood eventswith periods of about 200 and 400 years (Schimmelmannet al., 2003).
Hughes and Funkhouser (1998) point out the impor-tance of apparent periodicities in climate signals in definingconcepts such as ‘‘natural range of variability’’, particularlyin the context of managing aspects of the naturalenvironment. The variability, on multiple timescales, seenin the paleoclimate records stresses the need to consider thepossibility that the stability in precipitation that has beenseen in the historic record (Dettinger et al., 1998) may notlast into the future.
4.6. Spatial linkages
A 400-yr spatial reconstruction of precipitation inCalifornia from the latitude of San Francisco Bay southto the Mexican border (Haston and Michaelsen, 1997)illustrates California’s variable precipitation in recentcenturies. The study found precipitation anomalies to bemore common in the northern half of their study regionduring the period A.D. 1560–1760, and suggested that thismight be the result of stronger meridional (north–south)flows in the atmosphere during that period compared torecent times. In addition, an unusual concentration of wetyears and pentads occurred in the late 16th and 20thcenturies, though the first of these periods also contains anextended drought. This drought (dated to the A.D. 1580s)has been detected in other records (Stahle et al., 2000) andappears to have preceded two decades of high precipitation(Haston and Michaelsen, 1997). The early 17th century‘‘pluvial’’ may well be recorded in a high stand of playalakes in southern California (Enzel et al., 1989; Enzel 1992;Enzel and Wells, 1997), the highest level of Mono Lake inthe last 1000 years (Stine, 1990a), and a large flood ca.A.D. 1605 recorded in the varved sediments of the centralSanta Barbara Basin (Schimmelmann et al., 1998). In atree-ring reconstruction of temperature patterns across thewestern United States, Briffa et al. (1992) identified periodssince A.D. 1600 with summer 6-month periods that wereanomalously warm/cold. This study identified cool condi-tions during the first decade of the 17th century and the endof the century. Thus it appears that these periods show upin records as wet and cool (Briffa et al., 1992; Haston andMichaelsen, 1997).
The sequence of extended drought followed by anunusually wet period has been described as a ‘‘dry/wetknockout’’, with major ecosystem effects, potentiallymediated through fire and subsequent movement ofsediment from terrestrial ecosystems into riverine andmarine environments (Biondi et al., 2000). Schimmelmannet al. (1998) hypothesize that the shift from drought to wetis consistent with ‘‘an equatorward displacement of major
wind patterns and associated storm tracks’’. As thissequence of events in California is part of a large-scalecoherent pattern covering much of western North America,it seems very likely that it results from fluctuations in thelarge-scale atmospheric circulation, possibly resemblingthose that occurred from the 1940s through the 1990s,which have been associated with very large-scale multi-decadal sea-surface temperature anomalies linked to thePDO index (Latif and Barnett, 1994; Mantua et al., 1997).These changes have been (Mantua et al., 1997).While these large-scale shifts in circulation patterns have
definite impacts on California’s climate, it is interesting tonote that the paleoclimate history of the San Joaquinwatershed differs in significant ways from that of theSacramento watershed. This is demonstrated in Fig. 8,showing Sacramento and the San Joaquin river flowsreconstructed from tree-ring chronologies (Meko et al.,2002) where deviations from a generally good correspon-dence occur during the important periods of the 13th–14th centuries and the 17th–19th centuries. Specifically,the Mono Lake drought of 750–600 cal yr B.P. (A.D.1200–1350), so pronounced in the San Joaquin watershed,was not seen in the Sacramento River reconstructions(Meko et al., 2001). And during the two centuries of thelater ‘‘Little Ice Age’’, the two river reconstructions reflectopposing conditions, so that during the 17th century theSan Joaquin river flows were high, while the Sacramentoriver had low flows and the reverse was the case in thefollowing century.An intriguing question thus arises as to which river basin
is most critical for determining the health of the SanFrancisco Bay estuary. Today it is estimated thatapproximately 85% of the water supplied to the Baycomes through the Sacramento drainage (SFEP, 1992);however it is also true that the San Joaquin river is largelyfed by melting snow from mountains in the Central Sierraduring spring/early summer (Dettinger and Cayan, 2003)and thus this river may actually play an important role inthe local ecology of the Bay. A comparison of the recordsof vegetation response seen in cores from several marshsites with smoothed Sacramento and San Joaquin riverflows reconstructed from tree-ring chronologies (Mekoet al., 2002) reveals that the ecosystems of the SanFrancisco Bay estuary are most sensitive to dry conditionsaffecting both major rivers concurrently (Fig. 12). Howeverthe relationship between the two rivers and ecosystems inthe Bay tidal marshes is complex, as timing of river inflowscan be critically important to the life histories of the marshplants (May, 1999; Knowles, 2000). This is an area thatneeds more in-depth research, particularly as the healthand maintenance of local wetlands is largely determinedby the role vegetative cover has in sediment supply bothin producing and trapping sediments (SFEP, 1992; Adam,1990).There are several key periods during the Holocene when
paleoclimate records demonstrate the spatial climaticlinkages between coastal and terrestrial sources. For
ARTICLE IN PRESS
800A.D.
1200 16001000 1400 1800 2000
-1
0
1Sacramento R.San Joaquin R.
Tidal marsh plants
Higher river flows
Lower river flows
Higher estuarysalinity
Lower estuarysalinity
Fig. 12. Estuary salinity inferred from tidal marsh paleoclimate records (May, 1999; Byrne et al., 2001; Malamud-Roam and Ingram, 2004) compared
against tree-ring reconstructed flows of the Sacramento and San Joaquin rivers from Meko et al. (2002). Salinity index is qualitative, based on vegetation
patterns from five estuary marsh sites.
F.P. Malamud-Roam et al. / Quaternary Science Reviews 25 (2006) 1570–1598 1593
example, as described above, ca. 2000 cal yr B.P., terrestrialand tidal marsh records from the San Francisco Bay-Deltawatershed region indicate a shift from cooler-wetterconditions to drier conditions. This shift coincided withsignificant changes in ocean circulation and upwellingpatterns, when the DR values (the difference between theregional reservoir 14C age and the average ocean surfacewater 14C age) recorded in paired marine shells andcarbonized plant remains in Santa Barbara Basin andDaisy Cave (Kennett et al., 1997; Ingram et al., in prep.),and in San Francisco Bay shell middens (Ingram, 1998)underwent rapid fluctuations, with the DR values decliningby more than 500 years. Similarly, radiocarbon agedifferences between planktonic (surface dwelling) andbenthic (bottom dwelling) foraminifers in Santa BarbaraBasin sediments increased from an average of 440 yearsbefore 2000 years ago to an average of 620 years after(Roark et al., 2003). The authors note a decline inbioturbation recorded in the Santa Barbara Basin sedi-ments (reported by Behl and Kennett, 1996) and posit aninflux of older, oxygen depleted Pacific Intermediate waterentering the basin at about 2000 cal yr B.P. One thousandyears later, the intermittent mega-droughts of the MedievalClimate Anomaly (ca. A.D. 900–1350; Stine, 1994) coin-cided with a period of anomalously warm coastal oceantemperatures in the California Current, as indicated byoxygen isotope analyses of foraminifera from SantaBarbara Basin (A.D. 1200–1450; Field and Baumgartner,2000). Oxygen isotope compositions of mussel shells fromarchaeological sites along the central coast also indicatethat sea surface temperatures were slightly warmer thanpresent, but, more importantly, during this time thereexisted a wide seasonal range in temperatures, greater thanat any other time in the Holocene (Jones and Kennett,1999). This period, in turn, was followed by cooler, and, inmany places in California (Fig. 11), wetter conditions ca.500–150 cal yr B.P. (A.D. 1450–1800, e.g., Scuderi 1993;LaMarche, 1973, 1974a), coinciding with changes inocean surface water temperatures, inferred from positive
anomalies of d18O of planktonic foraminifera (Field andBaumgartner, 2000).A measure of how intimately linked the Bay-Delta
system is to its surrounding watershed regions is seen in thechanges of unimpaired annual fresh water flows from theSacramento River and San Joaquin River basins resultingfrom large-scale atmospheric changes in the ratios ofprecipitation falling in the northern and southern wa-tershed regions. For example, the ratio of SacramentoRiver water (fs) to San Joaquin river water (fsj) was higherduring the period, 1965–1976 (f s=f sj ¼ 2:1) than during theperiod, 1977–1987 (f s=f sj ¼ 1:7) (Knowles and Cayan,2002), a change that contributed to differences in thetiming of inflow to the San Francisco Bay between the twodecades.
5. Conclusions
The examples given above illustrate the degree to whichclimate variability in the watershed, including its internalspatial structure, is coupled to the larger-scale climatesystem, and the extent to which paleoclimate research hasalready contributed insights on these connections. As thenumber of proxy records with high temporal resolutionreflecting major features of the global climate increases(Bradley et al., 2003), and as they are complemented bymulti-century runs of coupled ocean–atmosphere climatemodels with reasonable estimates of forcing (for example,Bolville and Gent, 1998), the possibility increases of betterunderstanding the range of possible future natural con-tributions to the climate variability of the watershed. Thesevarious regional to global scale influences have resulted in acomplex history of climate and hydrology for SanFrancisco and its watershed.Climate over California during the last century has been
relatively stable (Dettinger et al., 1998) when examinedin the context of the past 2000 years, even with thesevere droughts of the, 1930s and the mid-1970s. Severalpreferred timescales of interdecadal change are shared by
ARTICLE IN PRESSF.P. Malamud-Roam et al. / Quaternary Science Reviews 25 (2006) 1570–15981594
paleoclimate records from San Francisco Bay estuarineand marsh sediments, coastal sediments, and lake sedi-ments in the watershed, and these timescales of climatevariability are easily missed when only the climate of thelast 100–150 years is considered. Longer term records,including tree rings, and sediments from lakes and from inand around the San Francisco Bay, provide a means ofextending records to cover paleoclimate for much of theHolocene. When these longer paleoclimate records areconsidered, current drought conditions experienced inthe US Southwest do not appear out of the range ofnatural variability. However, the warmer temperaturesassociated with anthropogenic global warming, mayexacerbate such conditions. It is notable that whilecalculated stream flows through the Delta during theMedieval Climate Anomaly were approximately one-thirdlower than modern pre-diversion flows (Ingram et al.,1996b), they were still greater than modern flows un-adjusted for diversion. In other words, actual fresh waterinflow to the Bay is lower today than it has ever beenduring the Holocene, and this during a period when climatehas been relatively stable.
Acknowledgments
We wish to thank the USG.S. and CALFED Science forfunds to support this work (Program Award03WRPA0002) and we wish to extend our gratitude toMichael Dettinger from the USG.S./Scripps Institution ofOceanography for his support and many discussions aboutthis work. This review has benefited from the generousinput from many other people, including M. Goman, B.Roark, P. Schweikhardt, D. and Sloan, and the manuscripthas been greatly improved by the input from twoanonymous reviewers. We also thank Jeanne DiLeo, whogreatly helped with many of these figures.
References
Adam, P., 1990. Saltmarsh Ecology. Cambridge Studies in Ecology.
Cambridge University Press, Cambridge, England 461pp.
Anderson, R., 1990. Holocene forest development and paleoclimates
within the Central Sierra Nevada, California. Journal of Ecology 78,
470–489.
Anderson, R.Y., 1991. A solar/geomagnetic C-14 climate connection:
evidence from mid-Holocene varves in a Minnesota lake. In: Redmond,
K.T. (Ed.), Proceedings of the Eigth Annual Pacific Climate (PACLIM)
Workshop, California Department of Water Resources, Interagency
Ecological Studies Program Technical Report 31.
Anderson, R.S., Smith, S.J., 1994. Paleoclimatic interpretations of
meadow sediment and pollen stratigraphies from California. Geology
22, 723–726.
Atwater, B.F., 1979. Ancient processes at the site of southern San
Francisco Bay: movement of the crust and changes in sea level. In:
Conomos, T.J. (Ed.), San Francisco Bay: The Urbanized Estuary.
Pacific Division. American Association for the Advancement of
Science, San Francisco, CA, pp. 31–45.
Atwater, B.F., 1980. Attempts to correlate late Quaternary climatic
records between San Francisco Bay, the Sacramento-San Joaquin
Delta, and the Mokelumne river, California. Unpublished Ph.D.
dissertation, University of Delaware.
Atwater, B.F., Hedel, C.H., 1976. Distribution of seed plants with respect
to tide levels and water salinity in the natural tidal marshes of the
northern San Francisco Bay estuary, California. US Geological Survey
Open File Report 76-389. Menlo Park, CA, 41pp.
Atwater, B.F., Marchand, D.E., 1980. Preliminary Maps Showing late
Cenozoic Deposits of the Bruceville, Elk Grove, Florin, and Galt 7.5-
Min Quadrangles, Sacramento and San Joaquin Counties, CA. US
Geological Survey Open File Report 80-849, 11pp.
Atwater, B.F., Hedel, C.W., Helley, E.J., 1977. Late quaternary
depositional history, Holocene sea-level changes, and vertical crustal
movement, southern San Francisco Bay, California. US Geological
Survey Prof. Paper 1014. Menlo Park, California, 15pp.
Atwater, B.F., Conard, S.G., Dowden, J.N., Hedel, C.W., MacDonald,
R.L., Savage, W., 1979. History, landforms and vegetation of the
estuary’s tidal marshes. In: Conomos, T.J. (Ed.), San Francisco Bay:
The Urbanized Estuary. Pacific Division, American Association for
the Advancement of Science, San Francisco, CA, pp. 347–385.
Atwater, B.F., Adam, D.P., Bradbury, J.P., Forester, R.M., Mark, R.K.,
Lettis, W.R., Fisher, G.R., Gobalet, K.W., Robinson, S.W., 1986. A
fan dam for Tulare Lake, California, and implication for the
Wisconsin glacial history of the Sierra Nevada. Geological Society of
America Bulletin 97, Menlo Park, California, pp. 97–109.
Baker, V.R., Webb, R.H., House, P.K., 2002. The scientific and societal
value of paleoflood hydrology. In: House, P.K., Webb, R.H., Baker,
V.R., Levish, D.R. (Eds.), Ancient Floods, Modern Hazards:
Principles and Applications of Paleoflood Hydrology, Water Science
and Application Vol. 5, pp. 1–19.
Barron, J.A., Heusser, L., Herbert, T., Lyle, M., 2003. High-resolution
climatic evolution of coastal northern California during the past
16,000 years. Paleoceanography 18 (1), 1020.
Baumgartner, T.R., Soutar, A., Ferreira-Bartrina, V., 1992. Reconstruc-
tion of the history of Pacific sardine and northern anchovy populations
over the past two millennia from sediments of the Santa Barbara
Basin. California Cooperative Oceanic Fisheries Investigations Re-
ports 33, 24–40.
Beer, J., Siegenthaler, U., Bonani, G., Finkel, R.C., Oesheger, H., Suter,
M., Wolfli, W., 1988. Information on past solar activity and
geomagnetism from 10Be in the Camp Century ice core. Nature 331,
675–679.
Behl, R.J., Kennett, J.P., 1996. Brief interstadial events in the Santa
Barbara Basin, northeast Pacific, during the past 60 kyr. Nature 379,
243–246.
Benson, L., Kashgarian, M., Rye, R., Lund, S., Paillet, F., Smoot, J.,
Kester, C., Mensing, S., Meko, D., Lindstrom, S., 2002. Holocene
multidecadal and multi-centennial droughts affecting Northern Cali-
fornia and Nevada. Quaternary Science Reviews 21, 659–682.
Benson, L., Braddock, L., Smoot, J., Mensing, S., Lund, S., Stine, S.,
Sarna-Wojcicki, A., 2003. Influence of the Pacific Decadal Oscillation
on the climate of the Sierra Nevada, California and Nevada.
Quaternary Research 59, 151–159.
Biondi, F., Lange, C.B., Hughes, M.K., Berger, W.H., 1997. Inter-decadal
signals during the last millennium (AD 1117–1992) in the varve records
of Santa Barbara Basin, California. Geophysical Research Letters 24,
193–196.
Biondi, F., Cayan, D.R., Berger, W.H., 1999. Decadal-scale changes in
Southern California tree-ring records. In: Karl, T.R. (Ed.), Proceed-
ings of the 10th Symposium on Global Change Studies. American
Meteorological Society, Boston, MA.
Biondi, F., Isaacs, C., Hughes, M.K., Cayan, D.R., Berger, W.H., 2000.
The Near-1600 Dry/Wet Knockout: Linking Terrestrial and Near-
Shore Ecosystems. In: US Department of Commerce, NOAA,
Proceedings of the Twenty-Fourth Annual Climate Diagnostics and
Prediction Workshop.
Biondi, F., Gershunov, A., Cayan, D.R., 2001. North Pacific
decadal climate variability since AD 1661. Journal of Climate 14,
5–10.
ARTICLE IN PRESSF.P. Malamud-Roam et al. / Quaternary Science Reviews 25 (2006) 1570–1598 1595
Birks, H.J.G., 2005. Fifty years of Quaternary pollen analysis in
Fennoscandia 1954–2004. Grana 44, 1–22.
Bolville, B.A., Gent, P.R., 1998. The NCAR climate system model,
version one. Journal of Climate 11, 1115–1130.
Bradley, R.S., 1999. Paleoclimatology Reconstructing Climates of the
Quaternary. Academic Press, San Diego 613pp.
Bradley, R.S., Briffa, K.R., Cole, J., Hughes, M.K., Osborn, T.J., 2003.
The climate of the last millennium. In: Alverson, K., Bradley, R.S.,
Pedersen, T.F. (Eds.), Paleoclimate, Global Change and the Future.
Springer, Berlin, pp. 105–149.
Brice, J., 1977. Lateral migration of the middle Sacramento River,
California. US Geological Survey Water Resource Investigations, 77-
43 51pp.
Briffa, K.R., Jones, P.D., Schweingruber, F.H., 1992. Tree-ring density
reconstructions of summer temperature patterns across western North
America since 1600. Journal of Climate 5, 735–754.
Brown, K.J., Pasternack, G.B., 2004. The geomorphic dynamics and
environmental history of an upper deltaic floodplain tract in the
Sacramento-San Joaquin Delta, California. Earth Surface Processes
and Landforms 29 (10), 1235–1258.
Brown, P.B., Hughes, M.K., Swetnam, T.W., Caprio, A.R., 1992. Giant
Sequoia ring-width chronologies from the central Sierra Nevada. Tree-
Ring Bulletin 52, 1–14.
Brunelle, A., Anderson, R.S., 2003. Sedimentary charcoal as an indicator
of late-Holocene drought in the Sierra Nevada, California, and its
relevance to the future. The Holocene 13 (1), 21–28.
Bryan, K., 1923. Geology and groundwater resources of the
Sacramento Valley, CA. US Geological Survey Water-Supply Paper
495 285pp.
Byrne, R., Ingram, B.L., Starratt, S., Malamud-Roam, F., Collins, J.N.,
Conrad, M.E., 2001. Carbon-isotope, diatom and pollen evidence for
late Holocene salinity change in a brackish marsh in the San Francisco
Estuary. Quaternary Research 55, 66–76.
California Department of Water Resources, 1978. The 1976–1977
California Drought—A Review. California Resources Agency, De-
partment of Water Resources, 228pp.
Cayan, D.R., Webb, R.H., 1992. El Nino/Southern Oscillation and
streamflow in the western United States. In: Diaz, H., Markgraf, V.
(Eds.), El Nino: Historical and Paleoclimatic Aspects of the
Southern Oscillation. Cambridge University Press, Cambridge, pp.
29–68.
Cayan, D.R., Dettinger, M.D., Diaz, H.F., Graham, N.E., 1998. Decadal
variability of precipitation over Western North America. Journal of
Climate 11, 3148–3466.
Cayan, D.R., Redmond, K.T., Riddle, L.G., 1999. ENSO and hydrologic
extremes in the western United States. Journal of Climate 12 (9),
2881–2893.
Cayan, D.R., Kammerdiener, S.A., Dettinger, M.D., Caprio, J.M.,
Peterson, D.H., 2001. Changes in the onset of spring in the western
United States. Bulletin of the American Meteorological Society 82 (3),
399–415.
Chmura, G.L., Aharon, P., 1995. Stable carbon isotope signatures of
sedimentary carbon in coastal wetlands as indicators of salinity regime.
Journal of Coastal Research 11 (1), 124–135.
Cobb, K.M., Charles, C.D., Hunter, D.E., 2001. A central tropical Pacific
coral demonstrates Pacific, Indian and Atlantic decadal climate
connections. Geophysical Research Letters 28, 2209–2212.
Cook, E.R., Kairiukstis, L.A., 1990. Methods of Dendrochronology:
Applications in the Environmental Sciences. Kluwer, Dordrecht
294pp.
Cook, E.R., Meko, D.M., Stahle, D.W., Cleaveland, M.K., 1999. Drought
reconstructions for the continental United States. Journal of Climate
12 (4), 1145–1162.
Damon, P.E., Cheng, S., Linick, T.W., 1989. Fine and hyperfine structure
in the spectrum of secular variations of atmospheric 14C. Radiocarbon
31, 704–718.
D’Arrigo, R., Vilallba, R., Wiles, G., 2001. Tree-ring estimates of pacific
decadal climate variability. Climate Dynamics 18, 219–224.
Davis, O.K., 1992. Rapid climatic change in coastal southern California
inferred from pollen analysis of San Joaquin Marsh. Quaternary
Research 37, 89–100.
Delaune, R.D., 1986. The use of d13C signature of C3 and C4 plants in
determining past depositional environments in rapidly accreting
marshes of the Mississippi river deltaic plain. Louisiana, USA
Chemical Geology 59, 315–320.
DePaolo, D.J., Ingram, B.L., 1985. High-Resolution stratigraphy with
Strontium Isotopes. Science 227, 938–941.
Dettinger, M.D., Cayan, D.R., 1995. Large-scale atmospheric forcing of
recent trends toward early snowmelt in California. Journal of Climate
8, 606–623.
Dettinger, M.D., Cayan, D.R., 2003. Interseasonal covariability of Sierra
Nevada streamflow and San Francisco Bay salinity. Journal of
Hydrology 277 (3–4), 164.
Dettinger, M.D., Cayan, D.R., Diaz, H.F., Meko, D.M., 1998. North-
south precipitation patterns in western North America on interannual-
to-decadal timescales. Journal of Climate 11 (12), 3095–3111.
Dettinger, M.D., Battisti, D.S., Garreaud, R.D., McCabe, G.J., Bitz,
C.M., 2001. Interhemispheric effects of interannual and decadal
ENSO-like climate variations on the Americas. In: Markgraf, V.
(Ed.), Interhemispheric Climate Linkages. Academic Press, New York,
pp. 1–16.
Dettinger, M.D., Cayan, D.R., Redmond, K.T., 2002. United States
streamflow probabilities and uncertainties based on anticipated El
Nino, water year 2003: experimental long-lead forecast bulletin. Center
for Land-Ocean-Atmosphere Studies 11 (3), 46–52.
Earle, C.J., 1993. Asynchronous droughts in California streamflow as
reconstructed from tree rings. Quaternary Research 39, 290–299.
Edlund, E.G., 1996. Late Quaternary environmental history of montane
forests of the Sierra Nevada, California. Ph.D. thesis, Geography
Department, University of California, Berkeley.
Edlund, E.G., Byrne, A.R., 1991. Climate, fire and late Quaternary
vegetation change in the Central Sierra Nevada. In: Nodvin, S.C.,
Waldrop, T.A. (Eds.), Fire and the Environment: Ecological and
Cultural Perspectives, USD.A. Forest Service General Technical
Report SE-69, pp. 390–396.
Ely, L.L., Enzel, Y., Baker, V.R., Cayan, D.R., 1993. A 5000-yr record of
extreme floods and climate change in the southwestern United States.
Science 262, 410–412.
Ember, L.M., Williams, D.F., Morris, J.T., 1987. Processes that influence
carbon isotope variations in salt marsh sediments. Marine Ecology
Progress Series 36, 33–42.
Enzel, Y., 1992. Flood frequency of the Mojave river and the formation of
late Holocene playa lakes, southern California, USA. The Holocene 2,
11–18.
Enzel, Y., Wells, S.G., 1997. Extracting Holocene paleohydrology
and paleoclimatology information from modern extreme flood
events: an example from southern California. Geomorphology 19,
203–226.
Enzel, Y., Cayan, D.R., Anderson, R.Y., Wells, S.G., 1989. Atmospheric
circulation during Holocene lake stands in the Mojave desert: evidence
of regional climate change. Nature 341, 44–47.
Evans, M.N., Cane, M.A., Schrag, D.P., Kaplan, A., Linsley, B.K.,
Villalba, R., Wellington, G.M., 2001. Support for tropically driven
Pacific decadal variability based on paleoproxy evidence. Geophysical
Research Letters 28 (19), 3689–3692.
Fagan, B., 2003. Before California: an Archaeologist Looks at Our
Earliest Inhabitants. Rowman and Littlefield Publishers, Inc, Lanham,
MD 400pp.
Fairbanks, R.G., 1989. A 17,000-year glacio-eustatic sea level record:
influence of glacial melting rates on the Younger Dryas event and
deep-ocean circulation. Nature 342, 637–642.
Field, D.B., Baumgartner, T.R., 2000. A 900 year stable isotope record of
interdecadal and centennial change from the California Current.
Paleoceanography 15, 695–708.
Florsheim, J.L., Mount, J.F., 2002. Restoration of floodplain topography
by sand splay complex formation in response to intentional levee
ARTICLE IN PRESSF.P. Malamud-Roam et al. / Quaternary Science Reviews 25 (2006) 1570–15981596
breaches, lower Cosumnes River, California. Geomorphology 44
(1–2), 67–94.
Florsheim, J.L., Mount, J.F., 2003. Changes in lowland floodplain
sedimentation processes: pre-disturbance to post-rehabilitation, Co-
sumnes River, California. Geomorphology 56, 305–323.
Friddell, J.E., Thunell, R.C., Guilderson, T.P., Kashgarian, M., 2003.
Increased northeast Pacific climatic variability during the warm middle
Holocene. Geophysical Research Letters 30 (11), 1560 14-1–14-4.
Fritts, H.C., 1976. Tree Rings and Climate. Academic Press, London.
Fritts, H.C., 1990. Tree-rings and environment. Proceedings of the
International Dendroecological Symposium.
Garfin, G.M., 1998. Relationships between winter atmospheric circulation
patterns and extreme tree growth anomalies in the Sierra Nevada.
International Journal of Climatology 18, 725–740.
Gedalof, Z., Mantua, N., 2002. A multi-century perspective of variability
in the Pacific Decadal Oscilation: new insights from tree rings and
coral. Geophysical Research Letters 29 57-1–57-4.
Gedalof, Z., Smith, D.J., 2001. Interdecadal climate variability and
regime-scale shifts in Pacific North America. Geophysical Research
Letters 28, 1515–1518.
Gilbert, G.K., 1917. Hydraulic mining in the Sierra Nevada. US
Geological Survey Prof. Paper 105 154pp.
Goals Project, 1999. Baylands Ecosystem Habitat Goals: A report of
habitat recommendations, prepared by the San Francisco Bay Area
Wetlands Ecosystem Goals Project. San Francisco, CA; Oakland, CA,
US Environmental Protection Agency; S.F. Bay Regional Water
Quality Control Board: 209+86pp appendices.
Goman, M., 1996. A history of Holocene Environmental Change in the
San Francisco Estuary. Ph.D. thesis, University of California,
Berkeley, 310pp.
Goman, M., 2001. Statistical analysis of modern seed assemblages from
the San Francisco Bay: applications for the reconstruction of paleo-
salinity and paleo-tidal inundation. Journal of Paleolimnology 26 (4),
393–409.
Goman, M., Wells, E., 2000. Trends in river flow affecting the
northeastern reach of the San Francisco Bay Estuary over the past
7000 Years. Quaternary Research 54, 206–217.
Graumlich, L.E., 1993. A 1000-year record of temperature and precipita-
tion in the Sierra Nevada. Quaternary Research 39, 249–255.
Graybill, D.A., Funkhouser, G.S., 1999. Dendroclimatic reconstructions
during the past millennium in the southern Sierra Nevada and Owens
Valley, California. In: Rose, M.R., Wigand, P.E. (Eds.), Proceedings
of the Southern California climate Symposium Trends and Extremes
of the Past 2000 Years, Natural History Museum of L.A. County Tech
Report No. 11.
Halfman, J.D., Johnson, T.C., 1988. High-resolution record of cyclic
climatic change during the past 4Ka from Lake Turkana, Kenya.
Geology 16, 496–500.
Haston, L., Michaelsen, J., 1997. Spatial and temporal variability of
southern California precipitation over the last 400 yr and relationships
to atmospheric circulation patterns. Journal of Climate 10, 1836–1852.
Haston, L., Michaelsen, J., 1994. Long-term Central Coaastal California
precipitation variability and relationships to El Nino-Southern
Oscillation. Journal of Climate 7, 1373–1387.
Hughes, M.K., 2002. Dendrochronology in climatology—the state of the
art. Dendrochronologia 20 (1–2), 95–116.
Hughes, M.K., Brown, P.M., 1992. Drought frequency in central
California since 101B.C. recorded in giant sequoia tree rings. Climate
Dynamics 6, 161–197.
Hughes, M.K., Graumlich, L.J., 1996. Multimillennial dendroclimatic
studies from the western United States. In: Jones, P.D., Bradley, R.S.,
Jouzel, J. (Eds.), Climatic Variations and Forcing Mechanisms of the
Last 2000 Years. Springer, Berlin.
Hughes, M.K., Funkhouser, G., 1998. Extremes of moisture availability
reconstructed from tree rings for recent millennia in the Great Basin of
Western North America. In: Benniston, M., Innes, J.L. (Eds.), The
Impacts of Climate Variability on Forests, (series) Lecture notes in
Earth Science, vol. 74. Springer, Berlin.
Hughes, M.K., Funkhouser, G., 2003. Frequency-dependent climate
signal in upper and lower forest border trees in the mountains of the
Great Basin. Climatic Change 59, 233–244.
Hughes, M.K., Richards, B.F., Swetnam, T.W., Baisan, C.H., 1990. Can a
climate record be extracted from Giant Sequoia tree rings? In:
Betancourt, J.L., MacKay, A.M. (Eds.), Proceedings of the Sixth
Annual Pacific Climate (PACLIM) Workshop, Asilomar, California,
March 5-8, 1989: California Department of Water Resources,
Interagency Ecological Studies Program, Technical Report 23.
Hughes, M.K., Touchan, R., Brown, P., 1996. A multimillennial network
of giant Sequoia chronologies for dendroclimatology. In: Meko, D.,
Swetnam, T. (Eds.), Tree Rings, Environment and Humanity,
Proceedings of the International Conference. Radiocarbon, Tucson,
Arizona, pp. 225–234.
Ingram, B.L., 1998. Differences in radiocarbon age between shell and
charcoal from a Holocene shellmound in northern California.
Quaternary Research 49, 102–110.
Ingram, B.L., DePaolo, D., 1993. A 4300 yr strontium isotope record of
estuarine paleosalinity in San Francisco Bay, CA. Earth and Planetary
Science Letters 119, 103–119.
Ingram, B.L., Sloan, D., 1992. Strontium isotopic composition of
estuarine sediments as paleosalinity-paleoclimate indicator. Science
255, 68–72.
Ingram, B.L., Southon, J.R., 1996. Reservoir ages in eastern Pacific
coastal and estuarine waters. Radiocarbon 38, 573–582.
Ingram, B.L., Conrad, M.E., Ingle, J.C., 1996a. Stable isotope and salinity
systematics in estuarine waters and carbonates: San Francisco Bay.
Geochimica et Cosmochimica Acta 60 (1), 455–467.
Ingram, B.L., Conrad, M.E., Ingle, J.C., 1996b. Stable isotope
record of late Holocene salinity and river discharge in San
Francisco Bay, California. Earth and Planetary Science Letters 141,
237–247.
Ingram, B.L., Conrad, M.E., Ingle, J.C., 1996c. A 2000-yr record of
Sacramento-San Joaquin River inflow to San Francisco Bay estuary,
California. Geology 24, 331–334.
Jackson, S.T., 1994. Pollen and spores in Quaternary lake sediments as
sensors of vegetation composition: theoretical models and empirical
evidence. In: Traverse, A. (Ed.), Sedimentation of Organic Particles.
Cambridge University Press, Cambridge, pp. 253–286.
Jaffe, B.E., Smith, R.E., Torresan, L.Z., 1998. Sedimentation and
Bathymetric change in San Pablo Bay: 1856–1983. US Geological
Survey Open-File Report 98-759.
Jassby, A.D., Kimmerer, W.J., Monismith, S.G., Armor, C., Cloern, J.E.,
Powell, T.M., Schubel, J.R., Vendlinski, T.J., 1995. Isohaline position
as a habitat indicator for estuarine populations. Ecological Applica-
tions 5 (1), 272–289.
Jones, T.L., Kennett, D.J., 1999. Late Holocene sea temperatures along
the Central California Coast. Quaternary Research 51, 74–82.
Jones, T.L., Brown, G.M., Raab, L.M., McVickar, J.L., Spaulding, W.G.,
Kennett, D.J., York, A., Walker, P.L., 1999. Environmental impera-
tives reconsidered: demographic crises in Western North America
during the Medieval Climate Anomaly. Current Anthropology 40 (2),
137–170.
Josselyn, M., 1983. The Ecology of San Francisco Bay Tidal Marshes: A
Community Profile. US Fish and Wildlife Service, Division of
Biological Services, Washington, DC, FWS/OBS Report 83/82, 102pp.
Kelley, R., 1989. Battling the Inland Sea. University of California Press,
Berkeley 395pp.
Kennett, D.J., Ingram, B.L., Erlandson, J.M., Walker, P., 1997. Evidence
for temporal fluctuations in marine radiocarbon reservoir ages in the
Santa Barbara Channel, southern California. Journal of Archaeolo-
gical Science 24, 1051–1059.
Kochel, R.C., Baker, V.R., 1988. Paleoflood analysis using slackwater
deposits. In: Baker, V.R., Kochel, R.C., Patton, P.C. (Eds.), Flood
Geomorphology. Wiley, New York, pp. 357–376.
Knowles, N., 2000. Modelling the hydroclimate of the San Francisco Bay-
Delta estuary and watershed. Ph.D. thesis, University of California,
San Diego, 291pp.
ARTICLE IN PRESSF.P. Malamud-Roam et al. / Quaternary Science Reviews 25 (2006) 1570–1598 1597
Knowles, N., Cayan, D., 2002. Potential effects of global warming on the
Sacramento/San Joaquin watershed and the San Francisco estuary.
Geophysical Research Letters 20 (18), 1891.
Knox, J.C., 1993. Large increases in flood magnitude in response to
modest changes in climate. Nature 361, 430–432.
LaMarche Jr., V., 1973. Holocene climatic variations inferred from
treeline fluctuations in the White Mountains, California. Quaternary
Research 3, 632–660.
LaMarche Jr., V., 1974a. Paleoclimatic inferences from long tree-ring
records. Science 183, 1043–1048.
LaMarche Jr., V., 1974b. Frequency-dependent relationships between
tree-ring series along an ecological gradient and some dendroclimatic
implications. Tree-Ring Bulletin 34, 1–20.
LaMarche Jr., V., 1978. Tree-ring evidence of past climatic variability.
Nature 276, 334–338.
Latif, M., Barnett, T.P., 1994. Causes of decadal climate variability over
North Pacific and North America. Science 266 (5185), 634–637.
Leavitt, S., 1994. Major wet intervals in White Mountains Medieval warm
period evidenced in d13C of Bristlecone pine tree rings. Climate Change
26, 299–308.
Levish, D.R., 2002. Paleohydrologic bounds: non-exceedance information
for flood hazard assessment. In: House, P.K., Webb, R.H., Baker,
V.R., Levish, D.R. (Eds.), Ancient Floods, Modern Hazards:
Principles and Applications of Paleoflood Hydrology. American
Geophysical union, Washington, DC.
Lightfoot, K., 1997. Cultural construction of coastal landscapes: a middle
Holocene perspective from San Francisco Bay. In: Erlandson, J.,
Glassow, M. (Eds.), Archaeology of the California Coast during the
Middle Holocene, 129–141. Series, Perpectives in California Archae-
ology, vol. 4. Institute of Archaeology, Univ. of California.
Malamud-Roam, K., Malamud-Roam, F., Watson, E., Collins, J.,
Ingram, L., 2006. The Quaternary Geography and Biogeography of
Tidal Salt Marshes. In Terrestrial Vertebrates of Tidal Marshes:
Ecology, Evolution, and Conservation Journal of Avian Biology,
Special volume, in press.
Malamud-Roam, F., 2002. A Late Holocene History of Vegetation
Change in San Francisco Estuary Marshes using Stable Carbon
Isotopes and Pollen Analysis. Ph.D. thesis, University of California,
Berkeley.
Malamud-Roam, F., Ingram, B.L., 2001. Carbon isotopic compositions of
plants and sediments of tide marshes in the San Francisco Estuary.
Journal of Coastal Research 17 (1), 17–19.
Malamud-Roam, F., Ingram, B.L., 2004. Late Holocene d13C and pollen
records of paleosalinity from tidal marshes in the San Francisco
estuary. Quaternary Research 62, 134–145.
Mann, M.E., Bradley, R.S., Hughes, M.K., 2000. Long-term variability in
the El Nino Southern Oscillation and associated teleconnections. In:
Diaz, H.F., Markgraf, V. (Eds.), El Nino and the Southern Oscillation,
Multiscale Variability and Global and Regional Impacts. Cambridge
University Press, Cambridge, UK, pp. 357–412.
Mantua, N.J., Hare, S.R., Zhang, Y., Wallace, J.M., Francis, R.C., 1997.
A Pacific interdecadal climate oscillation with impacts on salmon
production. Bulletin of the American Meteorological Society 78,
1069–1079.
May, M.D., 1999. Vegetation and salinity changes over the last 2000 years
at two islands in the northern San Francisco Estuary, California. M.A.
Thesis, University of California, Berkeley, 55pp.
McCabe, G.J., Dettinger, M.D., 1999. Decadal variations in the
strength of ENSO teleconnections with precipitation in the western
United States. International Journal of Climatology 19 (13),
1399–1410.
Meko, D.M., Therrell, M.D., Baisan, C.H., Hughes, M.K., 2001.
Sacramento River flow reconstructed to A.D. 869 from tree rings.
Journal of the American Water Resources Association 37 (4),
1029–1038.
Meko, D.M., Touchan, R., Hughes, M.K., Caprio, A.C., 2002. San
Joaquin River flow reconstructed from tree rings [abstract]. In: West,
G.J., Blomquist, N.L. (Eds.), Proceedings of the Nineteenth Annual
Pacific Climate Workshop, Sacramento (CA), Interagency Ecological
Program for San Francisco Estuary Technical Report 71, p. 186.
Mensing, S.A., Michaelson, J., Byrne, R., 1999. A 560-Year record
of Santa Ana fires reconstructed from charcoal deposited in
the Santa Barbara Basin, California. Quaternary Research 51,
295–305.
Mensing, S.A., Benson, L.V., Kashgarian, M., Lund, S., 2004. A
Holocene pollen record of persistent droughts from Pyramid Lake,
Nevada, USA. Quaternary Research 62 (1), 29–38.
Mitsch, W.J., Gosselink, J.G., 1993. Wetlands, second ed. Van Nostrand
Reinhold, New York 722pp.
Mote, P.W., 2003. Trends in snow water equivalent in the Pacific
Northwest and their climatic causes. Geophysical Research Letters 30.
Nelson, N.C., 1909. Shellmounds of the San Francisco Bay region.
Publications in American Archaeology and Ethnology 7 (4), 309–356
University of California.
Nichols, F.H., Wright, N.A., 1971. Preliminary map of historic margins of
marshlands, San Francisco Bay, California. US Geological Survey,
Basic Data Contribution 9. Menlo Park, California, 10pp. and map.
Nichols, F.H., Cloern, J.E., Luoma, S.N., Peterson, D.H., 1986. The
modification of an estuary. Science 231, 567–573.
Nichols, F.H., Thompson, J.K., Schemel, L.E., 1990. The remarkable
invasion of San Francisco Bay (California, USA) by the Asian clam
Potamocorbula amurensis, II. Displacement of a former community.
In Marine Ecological Progress Series 66, 95–101.
O’Leary, M., 1981. Carbon isotope fractionation in plants. Phytochem-
istry 20, 570–582.
Olmsted, F.H., Davis, G.H., 1961. Geologic features and ground-water
storage capacity of the Sacramento Valley, California. US Geological
Survey Water Supply Paper 1497, 241.
Peterson, D.H., Cayan, D.R., Festa, J.F., Nichols, F.H., Walters, R.A.,
Slack, J.V., Hager, S.E., Schemel, L.E., 1989. Climate variability in an
estuary: effects of riverflow on San Francisco Bay. In: Peterson, D.H.
(Ed.), Aspects of Climate Variability in the Pacific and the Western
Americas, vol. 55. American Geophysical Union Geophysical Mono-
graph, pp. 419–442.
Peterson, D.H., Cayan, D.R., DiLeo, J., Noble, M., Dettinger, M., 1995.
The role of climate in Estuarine variability. American Scientist 83,
58–67.
Peterson, D.H., Cayan, D.R., Dettinger, M.D., Noble, M.A., Riddle,
L.G., Schemel, L.E., Smith, R.E., Uncles, R.J., Walters, R.A., 1996.
San Francisco Bay salinity: observations, numerical simulations,
and statistical models. In: Hollibaugh, J.T. (Ed.), San Francisco
Bay: The Ecosystem. Pacific Division, AAAS, San Francisco, CA,
pp. 9–34.
Pisias, N.G., 1978. Paleoceanography of the Santa Barbara Basin and the
California Current during the last 8000 years. Ph.D. thesis, University
of R.I., Kingston, 219pp.
Porinchu, D.F., MacDonald, G.M., Bloom, A.M., Moser, K.A., 2003.
Late Pleistocene and early Holocene climate and limnological changes
in the Sierra Nevada, California, USA inferred from midges (Insecta:
Diptera: Chironomidae). Palaeogeography, Palaeoclimatology, Pa-
laeoecology 198, 403–422.
Preston, W., 1981. Vanishing Landscapes, Land and Life in the Tulare
Lake Basin. University of California Press, Berkeley 278p.
Roark, E.B., Ingram, B.L., Southon, J., Kennett, J.P., 2003. Holocene
foraminiferal radiocarbon record of paleocirculation in the Santa
Barbara Basin. Geology 31, 379–382.
Roos, M., 1991. A trend of decreasing snowmelt runoff in northern
California. In: Proceedings of the 59th Western Snow Conference,
Juneau (AK), pp. 29–36.
SFEP, San Francisco Estuary Project, 1992. State of the Estuary: A
Report on Conditions and Problems in the San Francisco Bay/
Sacramento-San Joaquin Delta Estuary. Prepared by the Association
of Bay Area Governments, Oakland, CA, 267pp.
Sanderson, E.W., Ustin, S.L., Foin, T.C., 2000. The influence of tidal
channels on the distribution of salt marsh plant species in Petaluma
Marsh, CA, USA. Plant Ecology 146, 29–41.
ARTICLE IN PRESSF.P. Malamud-Roam et al. / Quaternary Science Reviews 25 (2006) 1570–15981598
Schimmelmann, A., Zhao, M., Harvey, C.C., Lange, C.B., 1998. A Large
California flood and correlative global climatic events 400 years ago.
Quaternary Research 49, 51–61.
Schimmelmann, A., Lange, C.B., Meggers, B.J., 2003. Palaeoclimatic and
archaeological evidence for a �200-yr recurrence of floods and
droughts linking California, Mesoamerica and South America over
the past 2000 years. The Holocene 13 (5), 763–778.
Schoner, T., Nicholson, S.E., 1989. The relationship between California
rainfall and ENSO events. Journal of Climate 2 (11), 1258–1269.
Schweikhardt, P., Ingram, B.L., Sloan, D., 2002. Paleoenvironmental
Change During the Holocene and Last Interglacial in San Pablo Bay,
Northern California. In: Proceedings American Geophysical Union
Fall Meeting, San Francisco.
Scuderi, L.A., 1993. A 2000-yr tree ring record of annual temperatures in
the Sierra Nevada mountains. Science 259, 1433.
Smith, S.J., Anderson, R.S., 1992. Late Wisconsin paleoecologic record
from Swamp Lake, Yosemite National Park, California. Quaternary
Research 38, 91–102.
Smith, B.N., Epstein, S., 1970. Biogeochemistry of the stable isotopes of
hydrogen and carbon in salt marsh biota. Plant Physiology 46,
738–742.
Soutar, A., Crill, P.A., 1977. Sedimentation and climatic patterns in the
Santa Barbara Basin during the, 19th and 20th centuries. Geological
Society of America Bulletin 88, 111–1172.
Stahle, D.W., D’Arrigo, R.D., Krusic, P.J., Cleaveland, M.K., Cook,
E.R., Allan, R.J., Cole, J.E., Dunbar, R.B., Therrell, M.D., Gay,
D.A., Moore, M.D., Stokes, M.A., Burns, B.T., Villanueva-Diaz, J.,
Thompson, L.G., 1998. Experimental dendroclimatic reconstruction of
the Southern Oscillation. Bulletin of the American Meteorological
Society 79 (10), 2137–2152.
Stahle, D.W., Cook, E.R., Cleaveland, M.K., Therrell, M.D., Meko,
D.M., Grissino-Mayer, H.D., Watson, E., Luckman, B., 2000. Tree-
ring data document 16th century megadrought over North America.
EOS Transactions of the American Geophysical Union 81 (12),
121–125.
Stahle, D.W., Therrell, M.D., Cleaveland, M.K., Cayan, D.R., Dettinger,
M.D., Knowles, N., 2001. Ancient Blue Oaks reveal human impact on
San Francisco Bay salinity. EOS Transactions of the American
Geophysical Union 82 (12), 141.
Starratt, S.W., 2003. Siliceous Microfossils as Proxies for Late Holocene
Climate Change: The Record from Northern San Francisco Bay and
the Sacramento Delta, California, USA. Abstract. In: Proceedings of
XVI INQUA Conference. July, 2003. Reno, NV.
Starratt, S.W., 2004. Diatoms as indicators of late Holocene fresh water
flow variation in the San Francisco Bay estuary, central California,
USA. In: Poulin, M. (Ed.), Seventeenth International Diatom
Symposium. Biopress Ltd, Bristol, pp. 371–397.
Stewart, I., Cayan, D., Dettinger, M., 2005. Changes towards earlier
streamflow timing across western North America. Journal of Climate
18, 1136–1155.
Stine, S., 1990a. Late Holocene Fluctuations of Mono Lake, Eastern
California. Paleogeography, Paleoclimatology, and Paleoecology 78,
333–381.
Stine, S., 1990b. Past climate At Mono Lake. Nature 345, 391.
Stine, S., 1994. Extreme and persistent drought in California and
Patagonia during mediaeval time. Nature 369, 546–549.
Strudley, M.W., 2001. Formation and Evolution of Blocked Tributary
Valley Lakes on the Lower Cosumnes River Floodplain, Sacramento
County, CA. Senior Honors Thesis, UC Davis Geology Department,
33pp.
Stuiver, M., Braziunas, T.F., 1992. Evidence of solar activity variations.
In: Bradley, R.S., Jones, P.D. (Eds.), Climate Since A.D. 1500.
Routledge, London, pp. 593–605.
Stuiver, M., Braziunus, T.F., 1993a. Modeling atmospheric 14C influences
and 14C ages of marine samples to 10,000B.C. Radiocarbon 35,
215–230.
Stuiver, M., Braziunas, T.F., 1993b. Sun, ocean, climate and atmospheric14CO2: an evaluation of causal and spectral relationships. The
Holocene 3, 289–305 (original dataset).
Stuiver, M., Quay, P.D., 1980. Changes in atmospheric carbon-14
attributed to a variable sun. Science 207, 11–19.
Stuiver, M., Reimer, P.J., 1993. Extended 14C data base and
revised CALIB 4.3 14C age calibration program. Radiocarbon 35,
215–230.
Stuiver, M., Reimer, P.J., Bard, E., Beck, J.W., Burr, G.S., Hughen, K.A.,
Kromer, B., McCormac, F.G., Plicht, J., Spurk, M., 1998a. Radio-
carbon 40, 1041–1083.
Stuiver, M., Reimer, P.J., Braziunas, T.F., 1998b. Radiocarbon 40,
1127–1151 (revised dataset).
Sullivan, D.G., 1982. Prehistoric flooding in the Sacramento Valley:
Stratigraphic Evidence from Little Packer Lake, Glenn County,
California. Masters Thesis, University of California, Berkeley, 90pp.
Swetnam, T.W., 1993. Fire history and climate change in Giant Sequoia
groves. Science 262, 885.
Traverse, A., Sullivan, H.J., 1983. The background, origin, and early
history of the American Association of Stratigraphic Palynologists.
Palynology 7, 7–18.
United States Bureau of Reclamation (USBR), Technical Services Center,
2002. Flood Hazard Analysis, Folsom Dam, Central Valley, Califor-
nia, NTIS, DIBR-224p.
United States Census Bureau, 2000. US Census, 2000 webpage http://
www.census.gov.
Wells, L.E., 1995. Radiocarbon dating of Holocene tidal marsh deposits:
applications to reconstructing relative sea level changes in the San
Francisco Estuary. In: Noller, J.S., Lettis, W.R., Sowers, J.M. (Eds.),
Quaternary Geochronology and Paleoseismology. Nuclear Regulatory
Commission, Washington, D.C.
West, G.J., 1977. Late Holocene vegetation history of the Sacramento–
San Joaquin Delta, California. Unpublished report prepared for
California Dept. of Water Resources under Interagency Agreement B-
50 173: The Cultural Heritage Section of the California Department of
Parks and Recreation.
Ziska, L.H., Drake, B.G., Chamberlain, S., 1990. Long-term photosyn-
thetic response in single leaves of a C3 and C4 salt marsh species grown
at elevated atmospheric carbon dioxide in situ. Oecologia (Berlin) 83
(4), 469–472.