holocene sedimentation in the skagerrak interpreted from
TRANSCRIPT

JOURNAL OF QUATERNARY SCIENCE (2005) 20(1) 21–32Copyright � 2005 John Wiley & Sons, Ltd.Published online in Wiley InterScience (www.interscience.wiley.com). DOI: 10.1002/jqs.892
Holocene sedimentation in the Skagerrakinterpreted from chirp sonar and core dataRICHARD GYLLENCREUTZ,* MARTIN JAKOBSSON and JAN BACKMANDepartment of Geology and Geochemistry, Stockholm University, Stockholm, Sweden
Gyllencreutz, R., Jakobsson, M. and Backman, J. 2005. Holocene sedimentation in the Skagerrak interpreted from chirp sonar and core data. J. Quaternary Sci., Vol. 20pp. 21–32. ISSN 0267-8179.
Received 23 January 2004; Revised 23 July 2004; Accepted 16 August 2004
ABSTRACT: High-resolution chirp sonar profiling in the northeastern Skagerrak shows acousticallystratified sediments draping a rough-surfaced substratum. A 32 metre long sediment core retrievedfrom the survey area encompasses the entire Holocene and latest Pleistocene. The uppermostseismo-acoustic units in the chirp profiles represent Holocene marine sediments. The lowermost unitis interpreted as ice-proximal glacial-marine sediments rapidly deposited during the last deglaciation.The end of ice-proximal sedimentation is marked by a strong reflector, interpreted to have beenformed during latest Pleistocene time as a consequence of rapid ice retreat and drastically loweredsedimentation rate. The subsequent distal glacial-marine sediments were deposited with initially highsedimentation rates caused by an isostatic rebound-associated sea-level fall. Based on correlationbetween the core and the chirp sonar profiles using measured sediment physical properties andAMS 14C dating, we propose a revised position for the Pleistocene/Holocene boundary in theseismo-acoustic stratigraphy of the investigated area. Copyright � 2005 John Wiley & Sons, Ltd.
KEYWORDS: Holocene; Skagerrak; seismic; sediments; deglaciation.
Introduction
The Skagerrak is the deepest part of the otherwise relativelyshallow North Sea (Figs 1 and 2). The North Atlantic Currentmainly drives the circulation and subsequent sedimentation inthe Skagerrak, with important contributions from Baltic Seaoutflow and from the Jutland Current (Fig. 3) (Longva andThorsnes, 1997). In the deep northeastern Skagerrak, mixedcurrents form an anticlockwise gyre reducing the currentspeed, which allows fine-grained sediment to accumulate atvery high rates (van Weering, 1982a; Rodhe and Holt, 1996;Bøe et al., 1996). For this reason, the Skagerrak is themajor sink for fine-grained sediment in the North Sea.Acquired seismic reflection data shows the presence of a thick,apparently undisturbed, sediment sequence in the northeast-ern Skagerrak (Stabell et al., 1985; van Weering et al., 1993;Bøe et al., 1996; Rise et al., 1996; Longva and Thorsnes,1997; Novak and Stoker, 2001). Holocene sedimentation inthe Skagerrak has been comprehensively reviewed by vanWeering et al. (1993).
The promising high-resolution sedimentary archivesprompted the International Marine Past Global Changes Study(IMAGES) programme to select the coring site MD99-2286 inthis area (Figs 1 and 2), where a 32 m long core was retrievedin 1999. The main objective was to study the Holocene circu-
lation changes in the Skagerrak, in order to obtain importantinformation about the mode and amplitude of oceanographicand climatic variability.
This paper provides a detailed view of the Holocene and lat-est Pleistocene stratigraphy in the northeastern Skagerrak basedon high-resolution chirp sonar data acquired with R/V Skager-rak during the site survey for IMAGES site MD99-2286 and onstudies of the 32 m long core. An age model based on 27 radio-carbon dates was established for MD99-2286 and the cali-brated ages show that the core spans 12 000 years, thusencompassing the entire Holocene and the latest Pleistocene.All data was brought into a dynamic 3-D environment for theconstruction of a stratigraphic model and subsequent interpre-tation. In this paper, we will use the informal working defini-tion of 11 500 cal. yr BP (10 000 14C years) for the base of theHolocene at the end of the Younger Dryas cold period, asassigned by the International Commission on Stratigraphy(ICS website, 2004).
Oceanographic and sedimentary setting
The Skagerrak is bordered by the coasts of Denmark, Swedenand Norway and consists of a glacially eroded sedimentarybasin that forms the southeastern end of the Norwegian Trench(Floden, 1973; Holtedahl, 1986; Sejrup et al., 1995, 2000,2003) (Fig. 1). Water depths in the Skagerrak basin exceed700 m (Fig. 1), making it the deepest part of the otherwise shal-low North Sea.
* Correspondence to: Richard Gyllencreutz, Department of Geology and Geo-chemistry, Stockholm University, SE-10691 Stockholm, Sweden.E-mail: [email protected]
The following summary of present large-scale circulation inthe Skagerrak is based on Svansson (1975), Rodhe (1987, 1998)and Otto et al. (1990). The North Atlantic Current mainlygoverns the circulation and subsequent sedimentation in the
Skagerrak through water entering the North Sea betweenScotland and Norway, along with minor inflow through theEnglish Channel. The most important feature of the Skagerrakcirculation is the Jutland Current, which is formed of mixed
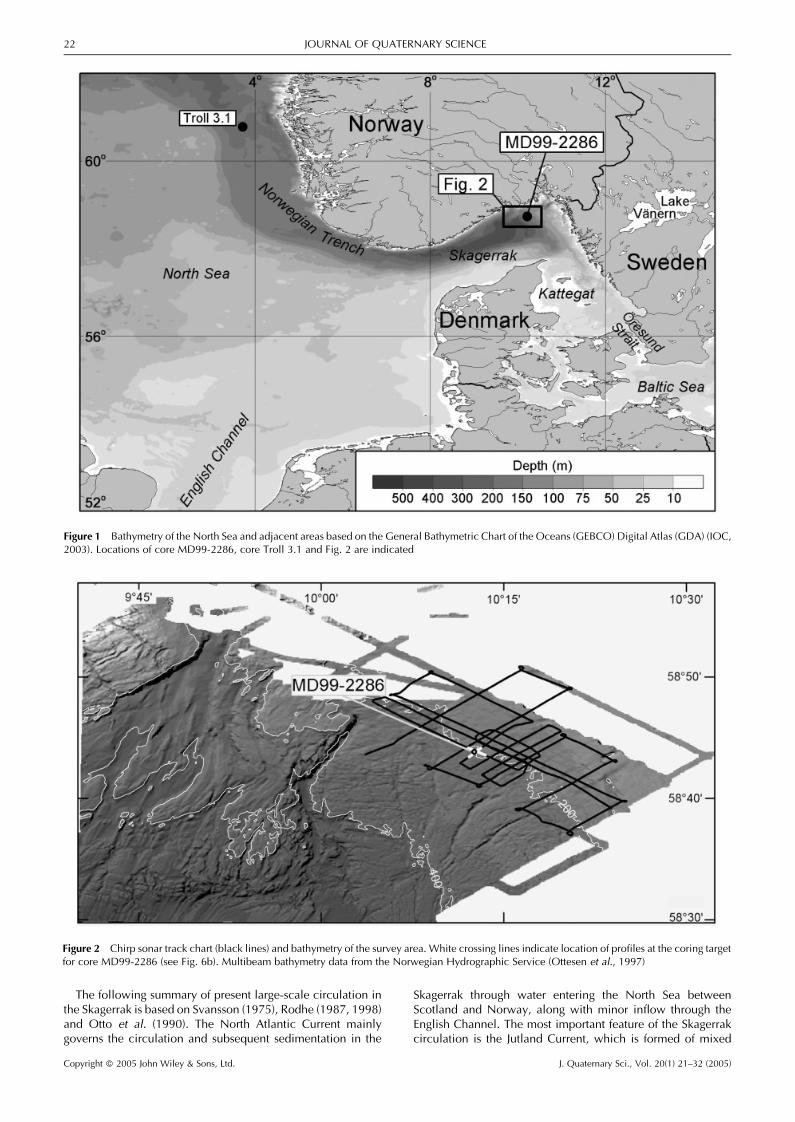
Figure 1 Bathymetry of the North Sea and adjacent areas based on the General Bathymetric Chart of the Oceans (GEBCO) Digital Atlas (GDA) (IOC,2003). Locations of core MD99-2286, core Troll 3.1 and Fig. 2 are indicated
Figure 2 Chirp sonar track chart (black lines) and bathymetry of the survey area. White crossing lines indicate location of profiles at the coring targetfor core MD99-2286 (see Fig. 6b). Multibeam bathymetry data from the Norwegian Hydrographic Service (Ottesen et al., 1997)
22 JOURNAL OF QUATERNARY SCIENCE
Copyright � 2005 John Wiley & Sons, Ltd. J. Quaternary Sci., Vol. 20(1) 21–32 (2005)

watermasses from the English Channel and the southern NorthSea and runs northward along the Danish west coast (Fig. 3).The Jutland Current further mixes with Central North Sea wateras it continues to the northeast entering the Skagerrak. Further-more, the watermass is subsequently mixed with relativelyfresh and cold Baltic Sea water, before it makes a cyclonic turnin the northeastern Skagerrak. The water then continues west-ward and exits the Skagerrak in the southwest as the NorwegianCoastal Current (Fig. 3). In the course of the cyclonic turn in theSkagerrak, the water depth increases and the current speed isgreatly reduced, causing fine-grained sediment to be depositedin the northeastern and central parts of the Skagerrak (Rodheand Holt, 1996) at a relatively high rate, up to 1 cm yr�1 (vanWeering, 1982a; Bøe et al., 1996). During periods with stronginfluence of Atlantic water from the northern passage, the Jut-land Current can be blocked for a limited period, and subse-quently flushed into the Skagerrak in 2–3 weeks when theAtlantic inflow diminishes again (Aure et al., 1990).
Most of the suspended sediment entering the Skagerrak isderived from the large amounts of inflowing Atlantic water withlow sediment concentration (Longva and Thorsnes, 1997), withimportant contributions from the Jutland Current carrying ahigh sediment load of erosion products from the Jutland coasts(Eisma and Kalf, 1987).
The present water depth is 225 m at the coring site, and theaccumulated sediment thickness as interpreted from chirpsonar profiles is about 55 m. This corresponds to ca. 75 milli-seconds (ms) two-way travel time (TWT), using a sedimentsound velocity of 1500 m s�1; this value is always used for con-verting TWT to metres in this study, and all values below givenin milliseconds refer to TWT. Using a sea level of 160–180 mabove present sea level just after the last deglaciation (Hafsten,
1983; Lambeck et al., 1998) and correcting for the sedimentaccumulation, the palaeo-water depth at the coring site at thetime of the deglaciation was about 400–450 m.
The Skagerrak was a fjord-like basin during the deglaciation(Stabell and Thiede, 1986) until a seaway developed acrossmiddle Sweden after the final drainage of the Baltic Ice Lakeat ca. 11 560 calendar years BP (Bjorck, 1995; Andren et al.,2002; Bjorck et al., 2002). The former land region west of Jut-land was flooded at about the same time, resulting in a majorchange of the geographic position of the southern coastlines(Stabell and Thiede, 1985, 1986). Another major change inthe hydrographic conditions in the Skagerrak was the openingof the English Channel at about 7500–7600 14C years BP(Jelgersma, 1979; Nordberg, 1991; Conradsen and Heier-Nielsen, 1995; Lambeck, 1995; Knudsen and Seidenkrantz,1998), equivalent to ca. 8500 cal. yr BP using the MARINE98calibration curve. The major components of the modern circu-lation system were established in conjunction with a hydro-graphic shift at 5500 14C years BP (Conradsen, 1995;Conradsen and Heier-Nielsen, 1995; Jiang et al., 1997),equivalent to ca. 6400 cal. yr BP. This shift is interpreted asan increase in the Jutland Current and stronger inflow of salineNorth Sea water to the Skagerrak and the Kattegat, synchronouswith the final drowning of the Jutland Bank (Leth, 1996).
Previous seismic surveys and coringin the study area
In previous seismic reflection studies of the Skagerrak and theNorwegian Trench, an uppermost acoustic unit has beendefined and described as acoustically transparent, and pro-posed to be of Holocene age (van Weering et al., 1973; vanWeering, 1975; van Weering, 1982b; Falt, 1982; Holtedahl,1986; Salge and Wong, 1988; von Haugwitz and Wong,1993; Andersen et al., 1995b; Rise et al., 1996). In these inves-tigations various systems such as Airgun, Sleeve gun, Sparker,Boomer or GeoPulse were used as seismic sources. In a seismicsurvey of outer Oslo Fjord sediments, an uppermost acousti-cally transparent unit, of supposedly Holocene or late glacialage, was described by Solheim and Grønlie (1983). Novakand Stoker (2001) suggested that a parallel-stratified acousticunit in the southern Skagerrak comprised the Holocene, inter-preted from deep-towed Boomer data.
Previous coring in the region comprises at least 15 coreslonger than 2 m, including the more than 200-m long Skagen3 core, drilled onshore in northernmost Denmark, and the38-m long Troll 3.1 core from the Norwegian Channel (Ander-sen et al., 1995b). In addition, the surface sediments and recentsedimentation rates in the Norwegian part of the Skagerrak havebeen investigated in the study of 268 short cores (<50 cm), col-lected within the ‘Skagerrak project’ (Bøe et al., 1996; Ottesenet al., 1997; Longva and Thorsnes, 1997). With the exception ofthe Skagen 3 core, MD99-2286 is the longest core retrievedfrom the Skagerrak that spans the entire Holocene. None ofthe previous cores from the Skagerrak have been correlated toseismic profiles to permit dating of acoustic reflectors.
Methods
Coring
A 32.4 m long CALYPSO core, MD99-2286, was retrieved in1999 from 225 water depth by R/V Marion Dufresne at
Figure 3 General circulation pattern in the North Sea and Skagerrak.The relative magnitude of volume transport is indicated by the width ofthe arrows. Grey arrows indicate water entering the Skagerrak more orless directly from the Atlantic and black arrows indicate indirect trans-port via the North Sea or from the Baltic Sea (redrawn from Longva andThorsnes, 1997, fig. 4.3)
HOLOCENE SEDIMENTATION IN THE SKAGERRAK 23
Copyright � 2005 John Wiley & Sons, Ltd. J. Quaternary Sci., Vol. 20(1) 21–32 (2005)

58 �43.770 N, 10 �12.310 E (Fig. 1), using a 40 m long core bar-rel. The CALYPSO corer is a giant version of the conventionalpiston core, capable of retrieving up to �60 m long cores. Adual (‘breakaway’) piston design is incorporated in the coringsystem to minimise coring disturbance during recovery (pull-out) from the seafloor (Rack et al., 2000). In addition, a 2.4 mlong gravity core, Sk000209-2, was retrieved in 2000 from225 m water depth by R/V Skagerrak at 58 �43.840 N,10 �11.780 E (622 m from core MD99-2286) in order to ensurefull recovery of the surface sediments.
Core description
Following the splitting of core MD99-2286, the sediment wasvisually described with respect to macro-sedimentology, col-our (using the Munsell soil colour chart) and macrofossilsonboard the ship. The microfossil content was described in18 smear slides evenly distributed along the 32 m long core.
Physical properties
Whole-core logging of Gamma Ray Attenuation (GRA) density(Fig. 4a) was performed onboard R/V Marion Dufresne using aGeoTek Multi Sensor Core Logger (MSCL). High-resolutionpoint measurements of p-wave velocity were carried out onsplit core halves at the Department of Geology and Geochem-istry, Stockholm University, also using a GeoTek MSCL(Fig. 4b). Prior to the physical property measurements, the corewas stored in the core-logging laboratory until the sedimentattained a stable temperature. P-wave measurements were alsocarried out on three discrete samples in constant-volume con-tainers from the top, middle and bottom of the core, on a Geo-Tek MSCL at the University of Rhode Island.
Dating
The chronostratigraphic control of core MD99-2286 relies on27 AMS 14C dates, performed by the Institute of Particle Phy-sics, ETH, Zurich, Switzerland, using the method describedby Hajdas et al. (1997). The dated samples consist of eithermollusc shells of known species or mixed benthic foraminifera.The radiocarbon dates were calibrated using the CALIB (rev.4.4) software (Stuiver and Reimer, 1993). The samples wereassumed to consist of 100% marine carbon, and the calibrationdata set MARINE98 (Stuiver et al., 1998) was used. In order tofacilitate comparison with other studies, a standard reservoircorrection of 400 years was used for all samples, althoughwe recognise that the reservoir age may have been greater dur-ing part or all of the deglaciation (Bard et al., 1990; Bondeviket al., 1999). The results of the calibrated AMS 14C dates arepresented using the probability method (Telford et al., 2004)(Table 1 and Fig. 5).
Chirp sonar profiling
High-resolution seismo-acoustic data was acquired from R/VSkagerrak with an EdgeTech X-Star chirp sonar system usingthe SB-512 tow-fish. The reflected acoustic signal was digitallyrecorded after real time processing through a correlation filter(Schock et al., 1989). Surveying was performed with a 40 mslong 1.5–7.5 kHz chirp pulse, resulting in a sediment penetra-tion of between 40 and 90 ms in water depths ranging between100 and 300 m, yielding a vertical resolution of ca. 12 cm. Thetotal length of chirp profiles collected in this study is 217 km(Fig. 2). The positioning system consisted of a differentialGPS. Soundings from the ship0s hull-mounted Skipper GDS101 echo sounding system were used to adjust variations inthe chirp sonar tow-fish depth.
Dynamic 3-D visualisation
All data in this study (i.e. chirp sonar, bathymetry, and coredata) together with multi-beam bathymetry from the Geologi-cal Survey of Norway was brought into Interactive Visualiza-tion System’s (IVS) dynamic 3-D visualisation softwareFledermaus (Mayer et al., 2000). Grey-scale raster images wereprepared from the processed chirp sonar data using an averagesound speed of 1500 m s�1 and displayed geo-referenced as‘hanging curtains’. The geological interpretation of the high-resolution chirp sonar data was undertaken in this 3-D environ-ment, which greatly facilitated a consistent interpretation dueto the simultaneous display of crossing lines. The 3-D visualisa-tion also provided a quality check of the chirp sonar depthmeasurements using the detailed multi-beam bathymetry(Figs 2 and 6).
Results
Lithology
The visual sedimentological description reveals that coreMD99-2286 consists of nearly homogeneous silty clay, whichslightly coarsens upwards. The sediment colour showed varia-tions ranging from dark olive grey (Munsell colour 5Y3/2) todark greenish grey (Munsell colour 5Y4/1). Slight colour
Figure 4 MST-measured physical properties plotted against depth (m)in core MD99-2286. (a) Boyce-corrected (Boyce, 1976) GRA-densitymeasured with 2-cm resolution. (b) P-wave velocity, measured with0.5-cm resolution. The p-wave data was calibrated to on-site condi-tions using a temperature of 7 �C (Svansson, 1975), a salinity of 35%(Svansson, 1975; Rodhe, 1987) and a water depth of 225 m. Arrowsindicate core section breaks. The outlined bars in right side of (b) indi-cate depth intervals where artefacts occur and where the signal was lostdue to bad transducer coupling
24 JOURNAL OF QUATERNARY SCIENCE
Copyright � 2005 John Wiley & Sons, Ltd. J. Quaternary Sci., Vol. 20(1) 21–32 (2005)

mottling, possibly indicating bioturbation, was observedthroughout the core. Sulphide streaks and small cracks, indicat-ing reducing conditions and the presence of gas, were observedin the intervals 0–15 m and 24–29 m. During the core descrip-tion, a void in the core at 13.15–13.55 m depth was noted. Thesediment on both sides of the void was firm and apparentlyundisturbed, and the facing edges of the void perfectly matchedeach other. As no sediment appears to be missing, this void isregarded as an artificial effect from the coring, and therefore thelength of the void (40 cm) was subtracted from the nominalcore depth from 13.55 m downwards.
Sediment physical properties
The GRA density record of core MD99-2286 shows a rapiddown-core increase from ca. 1.6 to ca. 1.7 g cm�3 in the top2 m of the core (Fig. 4a). From 2 m, the density increases line-arly to almost 2.0 g cm�3 at 31 m core depth, attributed to post-depositional compaction of the sediment. The lowermost metreof the core is characterised by a down-core decrease in densityreaching ca. 1.9 g cm�3 in the bottom of the core.
The p-wave record of core MD99-2286 shows valuesranging from 1400 to 1550 m s�1 (Fig. 4b). The discrete
sample p-wave measurements yielded velocities of1540.4 m s�1 at 2.94–2.99 m, 1573.5 m s�1 at 14.54–14.59 mand 1491.9 m s�1 at 30.95–31.00 m depth. However, artefactsrelated to core section breaks in the top of the core and lack ofuseful p-wave velocity data below 13 m (Fig. 4b), possiblycaused by small amounts of gas trapped between the core linerand the sediment, preclude the use of p-wave velocity for asynthetic seismogram that could be used for core correlationto the chirp sonar records. Therefore, the p-wave data are onlyused as an approximation of the seismic velocity.
Chronostratigraphy
The calibrated ages show that core MD99-2286 spans 0 to11 680–12 300 years (one-sigma age range), and thus coversthe entire Holocene and the latest Pleistocene (Fig. 5). Theinferred sedimentation rate gradually increases with time, from0.06 cm yr�1 at 12 000 yr BP to about 1 cm yr�1 in the upper-most sediments. The latter is consistent with the measuredmodern sediment accumulation rates of > 0.6 cm yr�1 aroundthe coring site (Bøe et al., 1996).
Some of the AMS 14C dates in the core are problematic, espe-cially in the top 10 m, as some ages are older than or identical
Table 1 AMS 14C dating of core MD99-2286 (MD) and core Sk000209-2 (Sk). Laboratory reference codes in parentheses denote samples omittedfrom the age model due to presumed sediment reworking. The results from core Sk000209-2 are from Senneset (2002). Laboratory reference codes inparentheses denote samples omitted from the age model
�13C 14C age Age range (cal. yr BP)Corr. Nominal vs. PDB (Libby h.l.) probability method
deptha depth WeightLaboratory Core (cm) (cm) % þ/� (14C yr þ/� Max. Median Min. Dated (mg) Typeb
reference 1� BP) 1� (1�) (1�) species
(ETH-24 953) MD 115.5 115.5 �3.8 1.2 785 50 480 424 378 Scaphander sp. 27.78 g,w(ETH-25 546) MD 185.5 185.5 2.0 1.2 800 55 494 436 393 Yoldiella lucida 8.85 m,wETH-24 001 MD 268 268 1.7 1.2 535 50 252 166 113 Ennucula tenuis 26.1 m,wETH-24 397 MD 319.5 319.5 1.8 1.2 730 45 417 372 320 Thyasira equalis 49.67 m,b(ETH-26 937) MD 319.5 319.5 0.5 1.2 1095 55 701 652 613 Foraminifera (mixed fauna) 11.86 fETH-25 547 MD 370.5 370.5 0.7 1.2 900 60 548 513 467 Nucula tumidula 9.55 m,b(ETH-26 388) MD 410.5 410.5 0.1 1.2 1270 50 877 814 761 Foraminifera (mixed fauna) 13.07 fETH-26 938 MD 481.5 481.5 2.7 1.2 1225 55 824 768 699 Foraminifera (mixed fauna) 16.77 f(ETH-26 939) MD 561 561 �0.1 1.2 1510 50 1115 1057 992 Foraminifera (mixed fauna) 18.57 fETH-26 940 MD 640.5 640.5 0.8 1.2 1530 50 1146 1080 1024 Foraminifera (mixed fauna) 16.23 f(ETH-25 955) MD 700.5 700.5 2.3 1.2 1915 55 1518 1458 1398 Foraminifera (mixed fauna) 16.42 fETH-25 956 MD 801 801 �0.2 1.2 1915 55 1518 1458 1398 Foraminifera (mixed fauna) 18.04 f(ETH-26 389) MD 901 901 0.5 1.2 2155 50 1808 1744 1690 Foraminifera (mixed fauna) 19.29 fETH-26 390 MD 1001 1001 �0.5 1.2 2175 50 1819 1766 1705 Foraminifera (mixed fauna) 15.51 fETH-26 941 MD 1070.5 1070.5 3.0 1.2 2440 55 2138 2076 1997 Foraminifera (mixed fauna) 11.62 fETH-26 418 MD 1200.5 1200.5 1.4 1.2 2765 60 2572 2493 2360 Foraminifera (mixed fauna) 12.56 fETH-27 241 MD 1360.5 1400.5 0.0 1.2 2975 55 2789 2752 2704 Foraminifera (mixed fauna) 14.87 f(ETH-26 419) MD 1460.5 1500.5 1.3 1.2 3390 60 3334 3256 3192 Foraminifera (mixed fauna) 14.05 f(ETH-27 242) MD 1660.5 1700.5 �1.7 1.2 3895 60 3952 3861 3775 Foraminifera (mixed fauna) 18.1 fETH-26 137 MD 1826 1866 1.0 1.2 4120 60 4252 4173 4081 Polinices montagui 16.73 g,wETH-24 003 MD 2377 2417 1.3 1.2 6255 65 6773 6698 6628 Portlandia intermedia 42.6 m,bETH-25 548 MD 2676.5 2716.5 3.4 1.2 7955 70 8478 8410 8335 Pseudamusium septemradiatum 62.37 m,b(ETH-25 549) MD 2681.5 2721.5 2.9 1.2 7710 60 8262 8163 8099 Pseudamusium septemradiatum 100.02 m,bETH-25 550 MD 3100.5 3140.5 �0.6 1.2 9620 70 10 585 10 332 10 145 Pseudamusium septemradiatum 44.68 m,bETH-24004 MD 3119 3159 1.1 1.2 9955 85 11 080 10 734 10 373 Bathyarca glacialis 25.5 m,bETH-25 551 MD 3129.5 3169.5 �2.0 1.2 9910 70 11 003 10 696 10 354 Cryptonautica affinis 25.77 g,bETH-24 005 MD 3198 3238 1.4 1.2 10 715 80 12 306 11 954 11 678 Portlandia intermedia 134.5 m,bKIA13 258 Sk 100–101 — — 605 30 279 266 256 Not identified 1.0c m-,bKIA13 259 Sk 160–161 — — 915 35 536 516 500 Not identified 0.4c m-,b
a Correction for artificial void in core at 1315–1355 cm; nominal depths below 1355 cm are reduced by 40 cm.b Type abbreviations: g¼ gastropod, m¼mollusc, f¼benthic foraminifera, w¼whole, b¼broken.c The weight of core Sk000209-2 samples is given in pure carbon (mg C).
HOLOCENE SEDIMENTATION IN THE SKAGERRAK 25
Copyright � 2005 John Wiley & Sons, Ltd. J. Quaternary Sci., Vol. 20(1) 21–32 (2005)

in age to the closest underlying sample. This pattern cannot beexplained by the order in which the samples were analysedsince they were measured in random order (see laboratorycodes in Table 1). Anomalously old ages could be explainedby sub-depositional reworking or by contamination with oldercarbon, whereas anomalously young ages could be explainedby contamination with modern carbon or by deep burrowing ofthe dated species. Contamination errors are generally onlylikely in the foraminiferal samples, as these are not etched dur-ing pretreatment. Errors from deep burrowing are less likely asall of the dated mollusc species are known not to burrow morethan ca. 10 cm into the substratum (Anders Waren, Museum ofSwedish Natural History, personal communication, 2002). Byassuming that all samples yielding ages older than or identicalto the closest underlying samples are reworked, it follows thatthese 10 samples should be excluded from the construction ofthe age model (Fig. 5, dates in parentheses in Table 1). The agemodel for core Sk000209-2 is based on seven 210Pb dates andtwo 14C dates. The 210Pb measurements in the top 25 cm ofcore Sk000209-2 produced consistent results and show thatthe core top is of modern (zero) age (Senneset, 2002) (Table 1).
High-resolution chirp sonar profiling
The chirp sonar acoustic stratigraphy generally shows acousti-cally stratified sediments with several internal parallel reflec-tors overlying a substratum, which was poorly penetrated bythe chirp signal. Four seismo-acoustic units have been defined,labelled A, B, C and D from the top down (Fig. 6). These unitsare separated by prominent reflectors numbered 1, 2, 3 and 4from the top down (Fig. 6). The three upper units A, B and Cblanket the underlying topography and are distinguished by
relatively low acoustic impedance and continuous internallayering. The lowermost unit D closely drapes the subjacenttopography and shows internal layering and relatively highacoustic impedance. In some of the profiles, distinct depres-sions ranging from about 50 to about 200 m in diameter canbe seen within or close to areas showing acoustic turbidity.These depressions, 11 in total, are interpreted as pockmarks.Acoustic turbidity obscured the chirp profiles in about one-third of the area covered. Acoustic turbidity is caused by a highgas content and is often found in relation to areas with pock-marks in the Skagerrak (Hovland and Judd, 1988; Judd andHovland, 1992).
Unit D
Unit D is the lowermost unit, characterised by high acousticimpedance and defined by a sharp upper boundary at reflector3. Distinctive parallel internal reflectors in unit D are continu-ous throughout the investigated area, and the thickness of unitD is relatively uniform at about 15 ms, equivalent to ca. 23 m.However, the lower boundary of unit D, reflector 4, is not asharp reflector in all profiles, as the acoustic signal is comple-tely absorbed within or immediately below this unit. Unit Dclosely drapes the underlying surface, so that the topographyof the substratum is more or less preserved throughout the sedi-ment unit.
Unit C
Unit C is defined as the virtually acoustically transparent unitbetween the weak reflector 2 and the strong reflector 3. Unit
Figure 5 Age model for core MD99-2286 based on 27 AMS 14C dates. The age model is shown with a line connecting filled circles. Open circlesshow age estimates excluded from the age model because of presumed sediment reworking. Error bars denote 1� calibrated age ranges (see alsoTable 1)
26 JOURNAL OF QUATERNARY SCIENCE
Copyright � 2005 John Wiley & Sons, Ltd. J. Quaternary Sci., Vol. 20(1) 21–32 (2005)

C has a varying thickness, ranging from about 20 to about35 ms, equivalent to ca. 30–53 m. The acoustic impedance isgenerally relatively low in unit C, and decreases from reflector2 downwards. Unit C is acoustically transparent to the chirpsonar pulse used in this survey in the lowermost part of the unit.Only a few, weak internal reflectors with low continuity arepresent in unit C.
Unit B
Unit B is defined as the unit between reflectors 1 and 2. Thethickness of unit B varies conformably with unit C and rangesfrom about 10 to about 25 ms, equivalent to ca. 15–38 m. UnitB is characterised by distinct acoustic layering in the top anddeclining acoustic impedance downwards from reflector 1.Reflector 2 is weak in comparison to reflectors 1, 3 and 4and has moderate to low continuity.
Unit A
Unit A is the uppermost unit, defined by an upper boundary atthe seafloor and by a lower boundary at reflector 1. Unit A has arelatively uniform thickness of about 10–12 ms, equivalent to ca.15–18 m, and is characterised by moderate acoustic impedancethroughout the investigated area, and weak but clearly parallellayering. The acoustic impedance increases towards reflector 2.Many of the profiles show acoustic turbidity (Fig. 6), which in allbut a few cases have an upper boundary within unit A.
Discussion
Core/seismic integration
In order to get a better understanding of what causes theobserved seismo-acoustic reflectors, it is important to obtain
Figure 6 (a) Representative chirp record from a section located at N58 �43.90, E10 �14.60, showing the general stratigraphy of the survey area innortheastern Skagerrak. The defined seismic reflectors 1–4 and units A–D are indicated. A patch of acoustic turbidity is marked with an arrow. Depthlabels in metres are based on 1500 m s�1 sound velocity. (b) Oblique 3-D view of the chirp sonar profiles around the coring location of MD99-2286(see crossing white lines in Fig. 2). The chirp profile names are indicated, and core MD99-2286 is marked with a grey cylinder below the arrow.Colours on the chirp profiles mark interpreted seismic units
HOLOCENE SEDIMENTATION IN THE SKAGERRAK 27
Copyright � 2005 John Wiley & Sons, Ltd. J. Quaternary Sci., Vol. 20(1) 21–32 (2005)

a reliable correlation between the core and the seismo-acousticrecord at the coring site. Optimally, this is carried out usingdensity and p-wave velocity data from the core to calculatethe acoustic reflectivity function and generate a synthetic seis-mogram through convolution with the seismo-acoustic sourcefunction. The modelled acoustic trace may then be directlycompared to the traces in the seismo-acoustic records fromthe coring site. The p-wave velocity measurements of coreMD99-2286 are not of sufficient quality for this purpose dueto poor transducer coupling (Fig. 4b). However, the GRA-density record shows changes that would give rise to pro-nounced acoustic impedance contrasts that probably causedreflections in the chirp pulse. Based on the GRA-density recorda core-/seismo-acoustic correlation is proposed in Fig. 7.
Interpretation of chirp sonar profiles
Unit D
Based on the pronounced stratification and the draping appear-ance, Unit D is interpreted as glacial marine sediments (‘innerproximal zone’, Boulton, 1990), mainly formed from rapiddeposition of suspended matter. The acoustic pattern withstrong, closely spaced reflectors conformable with the underly-ing bedrock (Figs 6 and 8) is characteristic for ice-proximal gla-cial marine sediments consisting of beds of alternating sand/gravel and mud (Syvitski, 1991; Syvitski et al., 1996). Thisfacies association is produced by highly sediment-chargedsubglacial meltwater streams proximal to tidewater-glaciers(Powell, 1981). Unit D may be correlated to unit 2 of vanWeering (1973; 1975; 1982a), Solheim and Grønlie (1983),and Holtedahl (1986), sequence 2 of Salge and Wong (1988),sequence P4 of von Haugwitz and Wong (1993), unit G of Riseet al. (1996) and unit C of Novak and Stoker (2001).
The lower boundary of unit D, reflector 4, is generallyweak and in some profiles missing, as the acoustic signalis completely absorbed within or immediately below unit D
(Figs 6 and 7). Unit D thus appears to be underlain by a dense,compacted substratum, such as till or diamicton, or rests directlyon the bedrock surface. However, either proposed cases ofsubstratum composition imply that reflector 4 marks the onsetof glacial marine sedimentation in the area after the ground-based ice had retreated and started to float over the deeperbasins. It follows that the age of reflector 4, i.e. the base of unitD, must be close to the timing of the ice-retreat from the area.
As the sea level rose during the deglaciation, a floating iceshelf, calving icebergs into a fully marine environment, devel-oped in the deeper parts of the Skagerrak basin between ca.17 000 and 15 000 cal. yr BP. When the ice shelf broke up,the ice margin rapidly receded to a grounding line in northeast-ern Skagerrak (southernmost dotted line in Fig. 8), reaching thepresent Swedish west coast at ca. 15 000 cal. yr BP (Andersenet al., 1995b; Lagerlund and Houmark-Nielsen, 1993;Kleman et al., 1997; Lundqvist and Wohlfarth, 2001;Houmark-Nielsen and Kjaer, 2003). Dated moraines onshoreprovide age estimates of the position of the ice margin whenit had reached the present coast (Fig. 8). The ice marginaldeposits on the Hvaler islands, eastern outer Oslo Fjord, arecorrelated to the east with the Trollhattan Moraine in Sweden(Berglund, 1979; Sørensen, 1979, 1992; Andersen et al.,1995a), which formed ca. 14 100–14 200 cal. yr BP after a per-iod of rapid ice-retreat (Lundqvist and Wohlfarth, 2001). TheHvaler moraines are correlated to the west with ice marginaldeposits on Tjøme in the western outer Oslo Fjord (Sørensen,1992; Andersen et al., 1995a).
The recession was fastest in the northeastern to northerndirection (Longva and Thorsnes, 1997; Boulton et al., 2001).Based on the recession diagrams compiled by Andersen et al.(1995a), the ice recession rate on the eastern and western sideof the outer Oslo Fjord was ca. 30–40 m yr�1 during the lastdeglaciation. However, the Berghem Moraine, located ca.
Figure 7 Proposed correlation of the MST-measured GRA-density logwith the chirp sonar profile at the coring site. The reflection coefficientis shown as measured by the chirp sonar for the seismic trace at the cor-ing location. The GRA-density log was linearly detrended in order tocompensate for the effect of compaction, and was smoothed using a27-term Gaussian filter. The length of the GRA-density log depth scalewas adjusted to the sound velocity used by the chirp sonar(1500 m s�1), and the inferred penetration depth is indicated with anarrow. Reflector 1 and 2 (defined in Fig. 6) are marked by sharp densitycontrasts in the log
Figure 8 Ice Marginal Zones (IMZ, numbers in circles) of the OsloFjord region and southwestern Sweden, compiled from Andersen et al.(1995a), Sørensen (1992), and Lundqvist and Wohlfarth (2001). Solidlines indicate mapped IMZ positions, and dashed lines mark inferredice margins. The dotted lines mark hypothetical offshore ice marginsinferred from ice flow lineations (Kleman et al., 1997; Boulton et al.,2001). Ages for IMZ 1, 2, 4 and 5 and the oldest IMZ 3 age are fromLundqvist and Wohlfarth (2001). The youngest IMZ 3 age located atTjøme (see text) and ages for IMZ 6–8 are calibrated in this work from14C ages of Andersen et al. (1995a). LF and OF marks the Langesundsf-jord and the Oslo Fjord, respectively. The black dot shows the locationof core MD99-2286
28 JOURNAL OF QUATERNARY SCIENCE
Copyright � 2005 John Wiley & Sons, Ltd. J. Quaternary Sci., Vol. 20(1) 21–32 (2005)

20 km towards the coast from the Trollhattan Moraine, wasformed ca. 14 400–14 200 cal. yr BP (Lundqvist and Wohlfarth,2001), which suggests an ice recession rate in this area wellover 100 m yr�1 (Fig. 8). As marine parts of the ice sheetdecayed faster than the land ice through iceberg calving (Lager-lund and Houmark-Nielsen, 1993; Longva and Thorsnes, 1997;Siegert et al., 2001), an ice recession rate on the order of 100–200 m yr�1 appears reasonable. Tjøme is located ca. 40 kmnorth-northeast of the MD99-2286 coring site, and is the clo-sest locality where the deglaciation is dated. The Tjøme mor-aine was formed 11 975� 155 14C years BP, which wascalibrated to a median age of 13 420 cal. yr BP (one-sigmarange 13 170–13 670 cal. yr BP) using the same calibrationparameters as for the core MD99-2286 dates (this work), andgives a minimum age for the Hvaler/Tjøme–Trollhattan IMZ(Andersen et al., 1995a). To conclude, the bounding para-meters for estimation of the deglaciation age of the coring siteare the end member ages of the Tjøme (ca. 13 200–13 600 cal. yr BP) and Trollhattan (14 100–14 200 cal. yr BP) mor-aines and an assumed ice recession rate of 100–200 m yr�1 overa distance of 40 km. From this, it follows that the coring site waspresumably deglaciated between 14 600 (14 200� 400) and13 400 (13 200� 200) cal. yr BP, which thus constitutes a max-imum age for unit D sediments.
The total sediment thickness below core MD99-2286amounts to about 25 ms (ca. 19 m) (Figs 6b and 7). In principle,we lack age control from the base of the core to the base of unitD, preventing firm conclusions about sedimentation rates fromthis interval. Yet, some reasonable speculations can be madeabout the sedimentation rate in this interval. The time availablefor deposition of unit D and lowermost unit C is on the order of2000 years, counted from the possible onset of sedimentationafter the deglaciation at 14 600–13 400 cal. yr BP to the base ofcore MD99-2286 at ca. 12 000 cal. yr BP. This implies an aver-age sedimentation rate on the order of 1 cm yr�1 for the deposi-tion of this sedimentary succession. However, unit D isinterpreted to consist of ice-proximal sediments, and sedimen-tation rates in the proximal zone (ca. < 40 km, Boulton, 1990)of a melting and calving ice sheet decrease exponentially fromthe glacier front. When the ice is retreating, sediment accumu-lation is largely controlled by the rate of retreat (Eyles et al.,1985; Syvitski, 1989; Boulton, 1990). This implies that the sedi-mentation rate was initially very high during deposition of unitD, but then decreased significantly with time. Given ice reces-sion rates of 100–200 m yr�1, the time of rapid (ice proximal)deposition of unit D is restricted to ca. 200–400 years afterdeglaciation, before the investigated area was in a distal(ca.> 40 km, Boulton, 1990) position to the ice front and sedi-mentation rates were significantly lowered. This interpretationis coherent with results from the Troll 3.1 core and adjacentseismic profiles, which indicate that deposition of ice-proximalsediments lasted only a few hundred years (Andersen et al.,1995b). It is also consistent with the results from Solheim andGrønlie (1983), who proposed that their unit 2 in the outer OsloFjord was rapidly deposited under ice-proximal conditions,although a maximum of 3000 years for deposition of this unitwas suggested.
Deposition of unit D was probably initiated when the iceretreated far enough to permit adjacent fjords to act as sedimenttraps. Thick sequences of glacial marine sediments have beenreported from seismic studies of the Oslo Fjord (Solheim andGrønlie, 1983; Pederstad et al., 1993) and the Langesundsfjord(Holtedahl, 1986) and their associated submarine channels.Some of the deepest parts of the Oslo Fjord were ice-free byca. 13 400 cal. yr BP (see Levene moraine, Fig. 8). We proposethat the sharp boundary between Unit C and D, reflector 3 (Figs6 and 7), represents the break-up of the ice shelf and rapid
recession of the ice front to a more distal position. Accordingly,reflector 3 is proposed to have formed mainly as a result of adrastic lowering of the sedimentation rate, for which sedimentsbeing trapped in newly deglaciated fjord and channel systemsin southeastern Norway probably had a major effect. A similardevelopment was proposed for the formation of the upperboundary reflector of unit F of Andersen et al. (1995b) basedon seismic profiles adjacent to the Troll 3.1 core. After forma-tion of reflector 3, distal glacial marine processes gained dom-inance over ice-proximal glacial marine sedimentation. This isconsistent with the results from Salge and Wong (1988), whoproposed that the sedimentation rate in the Skagerrak was aboutten times higher in the Late Pleistocene than in the Holocene. Itis also consistent with the results from the Troll 3.1 core byAndersen et al. (1995b), who concluded that the sedimentationrate in the Norwegian Channel was rapidly lowered by severalorders of magnitude at the beginning of the Younger Dryas at11 300 14C years BP (ca. 12 900 cal. yr BP, this work).
Unit C
The weak, but continuous parallel reflectors blanketing thesubjacent topography indicate very fine-grained nearly homo-geneous material, deposited under calm conditions (Figs 6 and7). Unit C is interpreted as distal glacial marine sediments gra-dually changing to postglacial marine sediments deposited dur-ing latest Pleistocene to early Holocene times. This isconsistent with the interpretation of the uppermost unit H ofvon Haugwitz and Wong (1993). They concluded that by theend of the Pleistocene, shallow marine deposits graduallycame to dominate over glacial marine sediments. As the sealevel rose, the main depocentre for the postglacial marine sedi-ments shifted to the east, causing the sedimentation rate in theeastern Skagerrak to increase throughout the early Holocene.
The unit C sediments below core MD99-2286 amounts to ca.10 ms (ca. 8 m) (Figs 6b and 7), and the linear sedimentationrate in the bottom of core MD99-2286 is ca. 0.06 cm yr�1. Con-sidering the time available for deposition of this succession,maximum ca. 2000 years (as discussed above), the averagesedimentation rate must have been significantly higher duringdeposition of lowermost unit C than in the parts recovered incore MD99-2286. An explanation for this could be that theshoreline displacement resulting from the rapid isostatic upliftcommencing immediately after deglaciation (Hafsten, 1983;Lambeck et al., 1998) probably exposed substantial amountsof material to erosion and transport into the Skagerrak. Sucha development was previously suggested for deposition of thelowermost part of the upper, previously supposed Holoceneunit of Solheim and Grønlie (1983), Holtedahl (1986) and Riseet al. (1996).
Reflector 3 is the most prominent reflector in the chirp sonarprofiles (Figs 6 and 7). This reflector has a wide regional extent,and its strong reflection coefficient and good continuity permitscorrelation with previous investigations (van Weering et al.,1973; van Weering, 1975, 1982b; Falt, 1982; Holtedahl,1986; Salge and Wong, 1988; von Haugwitz and Wong,1993; Andersen et al., 1995b; Rise et al., 1996). In these stu-dies, the correlated reflector is interpreted to represent thePleistocene/Holocene boundary, which is dated to11 500 cal. yr BP according to the informal working definitionof the International Commission on Stratigraphy (ICS website,2004). Reflector 3 may be correlated to reflector U5 of vonHaugwitz and Wong (1993). They conclude that reflector U5
represents an unconformity. Although reflector 3 of the presentsurvey is very sharp, the chirp sonar profiles do not indicate any
HOLOCENE SEDIMENTATION IN THE SKAGERRAK 29
Copyright � 2005 John Wiley & Sons, Ltd. J. Quaternary Sci., Vol. 20(1) 21–32 (2005)

truncated reflectors or the presence of an unconformity. Usingthe age model for core MD99-2286 and an estimate of the corepenetration in the chirp sonar profiles, the validity of the pre-vious assumption of a Pleistocene/Holocene boundary agefor reflector 3 can be assessed.
The bottom of core MD99-2286 at 32 m is AMS 14C dated to10 715� 80 14C years, corresponding to 11 950 (þ350/�275)cal. yr BP. The corresponding penetration depth of coreMD99-2286 in the chirp sonar profile at the coring site is43 ms, assuming a sound velocity in the sediment of1500 m s�1. Accordingly, the total sediment thickness of unitA, B and C is 53 ms, implying that the core is 10 ms short ofreaching reflector 3 (top of unit D). This suggested penetrationdepth is supported by the proposed correlation of core MD99-2286 with the chirp sonar profile based on GRA-density (Fig. 7).There is no apparent sharp boundary in the chirp sonar profilesat the depth of the Pleistocene/Holocene transition(11 500 cal. yr BP) inferred from the MD99-2286 age model.In order to obtain a core penetration that reaches reflector 3,one must assume a p-wave velocity of around 1200 m s�1,which is unreasonable as the measured p-wave velocity in coreMD99-2286 shows consistent values in the range of 1450 to1550 m s�1. Therefore, we propose that the sharp boundarybetween unit C and unit D, reflector 3, does not represent thebase of the Holocene, as interpreted in earlier investigations(van Weering et al., 1973; van Weering, 1975, 1982b;Solheim and Grønlie, 1983; Holtedahl, 1986; Salge and Wong,1988; von Haugwitz and Wong, 1993; Rise et al., 1996; Novakand Stoker, 2001).
Units B and A
The units above unit C represent postglacial marine sedimentsdeposited from suspension under calm conditions, based onthe relatively transparent but conformably stratified layersblanketing the underlying topography (Figs 6 and 7). Sincethe opening of the English Channel at ca. 8500 cal. yr BP, theJutland Current has been one of the most important sourcesof sediment input to the eastern Skagerrak. The present-dayJutland Current (Fig. 3) is highly unstable and can be periodi-cally blocked by inflowing Atlantic water, with subsequentflushing of sediment-loaded water into the deposition areas(Aure et al., 1990). Bottom current pulses related to JutlandCurrent fluctuations during the last 2000 years were interpretedfrom grain size data in four cores from the southern flank of theSkagerrak (Hass, 1996). These current pulses were associatedwith colder periods with intensified storminess and increasedwesterly winds, but it is not known when this current behaviourstarted. However, the major components of the modern circu-lation system were established in conjunction with a hydro-graphic shift at ca. 6400 cal. yr BP manifested by anintensified flow of the Jutland Current (Conradsen, 1995;Conradsen and Heier-Nielsen, 1995; Jiang et al., 1997). It isthus possible that the pulsating nature of the Jutland Currenthas been present since about mid-Holocene times. If this is cor-rect, the relatively strong reflector 1, separating units A and B,as well as the internal reflectors within units A and B, couldrepresent event-layers from periods of blocking and subsequentflushing of the Jutland Current. This would result in decreasedcurrent speed and consequent deposition of finer sediments fol-lowed by a sudden increase in current speed and deposition ofmore coarse-grained material, possibly causing reflectors inseismic profiles. This relationship needs to be further investi-gated by, for example, detailed grain-size analysis of coreMD99-2286. The increasing sedimentation rate from upper
unit C until recent, as measured in core MD99-2286, is probablya result of increasing sediment supply via the Jutland Current.
Conclusions
Based on high-resolution chirp sonar profiling and physicalproperties of a 32 m long piston core, the stratigraphy of upper-most Pleistocene to Holocene sediments in the northeasternSkagerrak has been described. Core MD99-2286 representsan apparently undisturbed high-resolution record of the entireHolocene and latest Pleistocene sediments, based on a radio-carbon-based age model and physical properties data.
The chirp sonar stratigraphy shows acoustically stratifiedsediments with several internal parallel reflectors overlying arough-surfaced substratum not penetrated by the signal. Thelowermost unit, D, is interpreted as ice-proximal glacial marinesediments rapidly deposited below or close to a calving shelfice, until the ice shelf broke up and the ice front receded to amore distal position. The sharp boundary between Units C andD, reflector 3, is proposed to represent the rapid break-up of theice-shelf and recession of the ice front far enough to exposethe nearby fjords as sediment traps, causing a rapid loweringof the sedimentation rate in the investigated area. After this,postglacial marine processes gradually became dominant overglacial marine sedimentation.
Based on the suggested correlation of the 14C dated coreMD99-2286 with the chirp sonar profile, the prominent reflec-tor separating the topmost relatively transparent unit from theunderlying stratified unit is proposed to be older than the Pleis-tocene/Holocene boundary, as assumed in previous investiga-tions. Instead, the change to Holocene conditions in the surveyarea in northeastern Skagerrak is interpreted to have occurredas a continuous process of increasingly normal marine deposi-tion, which gradually substituted the distal glacial marine sedi-mentation. The base of the Holocene at 11 500 cal. yr BP is notrepresented by any seismically significant impedance con-trasts. During deposition of the lowermost part of unit C, theaverage sedimentation rates must have been significantlyhigher than the rate measured in the bottom of core MD99-2286 at ca. 12 000 cal. yr BP, based on the correlation betweenthe core and the chirp sonar profiles. Such high sedimentationrates could be caused by current reworking of near-coastalsediments that were exposed as the sea level was rapidly low-ered due to glacio-isostatic rebound.
The uppermost units, B and A, represent marine Holocenesediments deposited with an increasing sedimentation ratereflecting a strengthening of the Jutland Current in an otherwisemore or less modern oceanographic environment.
Acknowledgements We are grateful to Eve Arnold, Fredrik Klingbergand Tom Floden for many fruitful discussions; Karen Luise Knudsen,Thomas Andren and Jan Heinemeier for age model discussions; JanLundqvist for discussions on ice recession; Peter Kristensen for picking for-ams for radiocarbon dating; Liv Senneset for data from core Sk000209-2;the Geological Survey of Norway for generously provided bathymetricdata; and two anonymous reviewers for constructive criticism.
References
Andersen BG, Mangerud J, Sørensen R, Reite A, Sveian H, Thoresen M,Bergstrom B. 1995a. Younger dryas ice-marginal deposits inNorway. Quaternary International 28: 147–169.
30 JOURNAL OF QUATERNARY SCIENCE
Copyright � 2005 John Wiley & Sons, Ltd. J. Quaternary Sci., Vol. 20(1) 21–32 (2005)

Andersen ES, Østmo SR, Forsberg CF, Lehman SJ. 1995b. Late- andpost-glacial depositional environments in the Norwegian Trench,northern North Sea. Boreas 24: 47–64.
Andren T, Lindeberg G, Andren E. 2002. Evidence of the final drainageof the Baltic Ice Lake and the brackish phase of the Yoldia Sea in gla-cial varves from the Baltic Sea. Boreas 31: 226–238.
Aure J, Svendsen E, Rey F, Skjoldal HR. 1990. The Jutland Current:nutrients and physical oceanographic conditions in late autumn1989. ICES Journal of Marine Science 35: 28 pp.
Bard E, Hamelin B, Fairbanks RG, Zindler A. 1990. Calibration of the14C timescale over the past 30 000 years using mass spectrometricU–Th ages from Barbados corals. Nature 345: 405–410.
Berglund BE. 1979. The deglaciation of southern Sweden 13 500–10 000 B.P. Boreas 8: 89–118.
Bjorck S. 1995. A review of the history of the Baltic Sea, 13.0–8.0 ka BP.Quaternary International 27: 19–40.
Bjorck J, Andren T, Wastegard S, Possnert G, Schoning K. 2002.An event stratigraphy for the Last Glacial–Holocene transition ineastern middle Sweden: results from investigations of varvedclay and terrestrial sequences. Quaternary Science Reviews 21:1489–1501.
Bøe R, Rise L, Thorsnes T, de Haas H, Saether OM, Kunzendorf H.1996. Sea-bed sediments and sediment accumulation rates in theNorwegian part of Skagerrak. Norges Geologiske Undersøkelse430: 75–84.
Bondevik S, Birks HH, Gulliksen S, Mangerud J. 1999. Late Weichse-lian marine 14C reservoir ages at the western coast of Norway. Qua-ternary Research 52: 104–114.
Boulton GS. 1990. Sedimentary and sea level changes during glacialcycles and their control on glacimarine facies architecture. InGlacimarine Environments: Processes and Sediments, vol. 53,Dowdeswell JA, Scourse JD (eds). Geological Society SpecialPublication no. 53; 15–52.
Boulton GS, Dongelmans P, Punkari M, Broadgate M. 2001. Palaeogla-ciology of an ice sheet through a glacial cycle: the European icesheet through the Weichselian. Quaternary Science Reviews 20:591–625.
Boyce RE. 1976. Definitions and laboratory techniques of compres-sional sound velocity parameters and wet-water content, wet-bulkdensity, and porosity parameters by gravimetric and gamma-rayattenuation techniques. In Initial Reports of the Deep Sea DrillingProgram 33, vol. 33, Schlanger SO, Jackson ED, et al. (eds). U.S.Govt. Printing Office: Washington, DC; 931–958.
Conradsen K. 1995. Late Younger Dryas to Holocene palaeoenviron-ments of the southern Kattegat, Scandinavia. The Holocene 5:447–456.
Conradsen K, Heier-Nielsen S. 1995. Holocene paleoceanography andpaleoenvironments of the Skagerrak–Kattegat, Scandinavia. Paleo-ceanography 10: 801–813.
Eisma D, Kalf J. 1987. Dispersal, concentration and deposition of sus-pended matter in the North Sea. Journal of the Geological Society ofLondon 144: 161–178.
Eyles CH, Eyles N, Miall AD. 1985. Models of glacimarine sedimenta-tion and their application to the interpretation of ancient glacialsequences. Palaeogeography, Palaeoclimatology, Palaeoecology51: 15–84.
Falt L-M. 1982. Late Quaternary sea-floor deposits off the Swedish westcoast. PhD thesis, Chalmers University of Technology and Universityof Gothenburg. Publ A 37 (Goteborg).
Floden T. 1973. Notes on the bedrock of the eastern Skagerrak withremarks on the pleistocene deposits. Stockholm Contributions inGeology XXIV:5: 79–102.
Hafsten U. 1983. Shore-level changes in south Norway during the last13 000 years, traced by biostratigraphical methods and radiometricdatings. Norsk Geografisk Tidsskrift 37: 63–79.
Hajdas I, Beer J, Bonani G, Bonino G, Cini Castagnoli G, Taricco C.1997. Radiocarbon time scale of the Mediterranean core CT85-5:the last 40 000 years. In Proceedings of the International Schoolof Physics ‘Enrico Fermi’ Course CXXXIII, Cini Castagnoli G,Provenzale A (eds). IOS Press: Amsterdam.
Hass HC. 1996. Northern Europe climate variations during lateHolocene: evidence from marine Skagerrak. Palaeogeography,Palaeoclimatology, Palaeoecology 123: 121–145.
Holtedahl H. 1986. Sea-floor morphology and Late Quaternary sedi-ments south of the Langesundsfjord, north-eastern Skagerrak. NorskGeologisk Tidsskrift 66: 311–323.
Houmark-Nielsen M, Kjaer KH. 2003. Southwest Scandinavia, 40–15 kyr BP: paleogeography and environmental change. Journal ofQuaternary Science 18: 769–786.
Hovland M, Judd AG. 1988. Seabed Pockmarks and Seepages—Impacton Geology, Biology and the Marine Environment. Graham &Trotman: London; 180–203.
ICS website. 2004. Overview of Global Boundary Stratotype Sectionsand Points (GSSPs). http://www.stratigraphy.org [20 July 2004].
IOC, IHO, BODC. 2003. Centenary Edition of the General BathymetricChart of the Oceans (GEBCO) Digital Atlas (GDA). Intergovernmen-tal Oceanographic Commission and the International HydrographicOrganization as part of the General Bathymetric Chart of the Oceans,British Oceanographic Data Centre, Liverpool.
Jelgersma S. 1979. Sea-level changes in the North Sea basin. In TheQuaternary History of the North Sea, Oerle E, Shuttenhelm RTE,Wiggers AJ (eds). Acta Univ. Ups. Symp. Univ. Ups. Annum Quin-gentesimum Celebrantis, 2: Uppsala; 233–248.
Jiang H, Bjorck S, Knudsen KL. 1997. A palaeoclimatic and palaeocea-nographic record of the last 11 000 14C years from the Skagerrak–Kattegat, north-eastern Atlantic margin. The Holocene 7: 301–310.
Judd AG, Hovland M. 1992. The evidence of shallow gas in marinesediments. Continental Shelf Research 12: 1081–1095.
Kleman J, Hattestrand C, Borgstrom I, Stroeven A. 1997. Fennoscan-dian paleoglaciology reconstructed using a glacial geological inver-sion model. Journal of Glaciology 43: 283–299.
Knudsen KL, Seidenkrantz M-S. 1998. Holocene palaeoenvironmentsin the North Sea region: reflections from the Skagen core. InGeoscience in Aarhus Presented in Connection with the 23rd NordicGeological Winter Meeting, Wilson JR, Michelsen Ø (eds). Aarhus,Denmark; 45–48.
Lagerlund E, Houmark-Nielsen M. 1993. Timing and pattern of the lastdeglaciation in the Kattegat region, southwest Scandinavia. Boreas22: 337–347.
Lambeck K. 1995. Late Devensian and Holocene shorelines of theBritish Isles and North Sea from models of glacio-hydro-isostaticrebound. Journal of the Geological Society of London 152: 437–448.
Lambeck K, Smither C, Johnston P. 1998. Sea-level change, glacialrebound and mantle viscosity for northern Europe. Geophysical Jour-nal International 134: 102–144.
Leth JO. 1996. Late Quaternary geological development of the JutlandBank and the initiation of the Jutland Current, NE North Sea. Geolo-gical Survey of Norway Bulletin 430: 25–34.
Longva O, Thorsnes T. 1997. Skagerrak in the past and present—anintegrated study of geology, chemistry, hydrography and microfossilecology. In NGU Special Publication, no. 8; 1–100.
Lundqvist J, Wohlfarth B. 2001. Timing and east–west correlation ofsouth Swedish ice marginal lines during the Late Weichselian. Qua-ternary Science Reviews 20: 1127–1148.
Mayer LA, Paton CW, Gee L, Gardner JV, Ware CW. 2000. Interactive3-D visualization: a tool for seafloor navigation, exploration, andengineering. Proceedings of IEEE Oceans 2: 913–920.
Nordberg K. 1991. Oceanography in the Kattegat and Skagerrak overthe past 8000 years. Paleoceanography 6: 461–484.
Novak B, Stoker MS. 2001. Late Weichselian glacimarine depositionalprocesses in the southern Skagerrak revealed by high-resolution seis-mic facies analysis. Marine Geology 178: 115–133.
Ottesen D, Bøe R, Longva O, Olsen HA, Rise L, Skilbrei JR, Thorsnes T.1997. Geologisk atlas—Skagerrak. Atlas over kvartaere avsetninger,bunnsedimenter, berggrunn og batymetri i norsk sektor av Skagerrak.NGU Rapport no. 96; 138 pp.
Otto L, Zimmerman TF, Furnes GK, Mork M, Saetre R, Becker G. 1990.Review of the physical oceanography of the North Sea. NetherlandsJournal of Sea Research 26: 161–238.
Pederstad K, Roaldset E, Roenningsland TM. 1993. Sedimentation andenvironmental conditions in the inner Skagerrak–outer Oslofjord.Marine Geology 111: 245–268.
Powell RD. 1981. A model for sedimentation by tidewater glaciers.Annals of Glaciology 2: 129–134.
Rack F, Skinner A, Amman H. 2000. Coring and high pressure sam-pling. In Proceedings from INMARTECH 2000 International Marine
HOLOCENE SEDIMENTATION IN THE SKAGERRAK 31
Copyright � 2005 John Wiley & Sons, Ltd. J. Quaternary Sci., Vol. 20(1) 21–32 (2005)

Technicians Workshop 20–22 September, Robertson KG, RietveldMJ (eds). Royal Netherlands Institute for Sea Research (NIOZ), Texel;113–119.
Rise L, Olsen HA, Bøe R, Ottesen D. 1996. Thickness, distribution anddepositional environment of Holocene sediments in the Norwegianpart of Skagerrak. Norges geologiske Undersøkelse 430: 5–16.
Rodhe J. 1987. The large-scale circulation in the Skagerrak: interpreta-tion of some observations. Tellus 39A: 245–253.
Rodhe J. 1998. The Baltic and North Seas: a process-oriented review ofthe physical oceanography. In The Sea, vol. 11, Robinson AR, BrinkKH (eds). Wiley: New York; 699–732.
Rodhe J, Holt N. 1996. Observations of the transport of suspended mat-ter into the Skagerrak along the western and northern coast ofJutland. Journal of Sea Research 35: 91–98.
Salge U, Wong HK. 1988. Seismic stratigraphy and Quaternary sedi-mentation in the Skagerrak (north-eastern North Sea). Marine Geol-ogy 81: 159–174.
Schock SG, LeBlanc LR, Mayer LA. 1989. Chirp subbottom profiler forquantitative sediment analysis. Geophysics 54: 445–450.
Sejrup HP, Aarseth I, Haflidason H, Løvlie R, Bratten A, Tjøstheim G,Forsberg CF, Ellingsen KL. 1995. Quaternary of the Norwegian Chan-nel: glaciation history and palaeoceanography. Norsk GeologiskTidsskrift 75: 65–87.
Sejrup HP, Larsen E, Landvik J, King EL, Haflidason H, Nesje A. 2000.Quaternary glaciations in southern Fennoscandia: evidence fromsouthwestern Norway and the northern North Sea region. Quatern-ary Science Reviews 19: 667–685.
Sejrup HP, Larsen E, Haflidason H, Berstad IM, Hjelstuen BO,Jonsdottir HE, King EL, Landvik J, Longva O, Nygard A, Ottesen D,Raunholm S, Rise L, Stalsberg K. 2003. Configuration history andimpact of the Norwegian Channel Ice Stream. Boreas 32: 18–36.
Senneset L. 2002. A record of high resolution ocean variability fromSkagerrak over the past 900 years. Masters thesis, University ofBergen (Bergen).
Siegert MJ, Dowdeswell JA, Hald M, Svendsen J-I. 2001. Modelling theEurasian Ice Sheet through a full Weichselian glacial cycle. Globaland Planetary Change 31: 367–385.
Solheim A, Grønlie G. 1983. Quaternary sediments and bedrock geol-ogy in the outer Oslofjord and northernmost Skagerrak. Norsk Geo-logisk Tidskrift 63: 55–72.
Sørensen R. 1979. Late Weichselian deglaciation in the Oslofjord area,south Norway. Boreas 8: 241–246.
Sørensen R. 1992. The physical environment of Late Weichseliandeglaciation of the Olsofjord region, south-eastern Norway. SverigesGeologiska Undersokning Serie Ca 81: 339–346.
Stabell B, Thiede J. 1985. The physiographic evolution of the Skagerrakduring the past 15 000 years: paleobathymetry and paleoceanogra-phy. Norsk Geologisk Tidsskrift 65: 19–22.
Stabell B, Thiede J. 1986. Paleobathymetry and paleogeographyof southern Scandinavia in the late Quaternary. Meyniana 38:43–59.
Stabell B, Werner F, Thiede J. 1985. Late Quaternary and modernsediments of the Skagerrak and their depositional environment: AnIntroduction. Norsk Geologisk Tidsskrift 65: 9–17.
Stuiver M, Reimer PJ. 1993. Extended 14C data base and revised CALIB3.0 14C age calibration program. Radiocarbon 35: 215–230.
Stuiver M, Reimer PJ, Braziunas TF. 1998. High-precision radiocarbonage calibration for terrestrial and marine samples. Radiocarbon 40:1127–1151.
Svansson A. 1975. Physical and chemical oceanography of the Skager-rak and Kattegat. I. Open sea conditions. Fishery Board of Sweden,Institute of Marine Research, Report, no. 1; 88 pp.
Syvitski JPM. 1989. On the deposition of sediment within glacier-influenced fjords: oceanographic controls. Marine Geology 85:301–329.
Syvitski JPM. 1991. Towards an understanding of sediment depositionon glaciated continental shelves. Continental Shelf Research 11:897–937.
Syvitski JPM, Lewis CFM, Piper DJW. 1996. Palaeoceanographic infor-mation derived from acoustic surveys of glaciated continentalmargins: examples from eastern Canada. In Late Quaternary Palaeo-ceanography of the North Atlantic Margins, Andrews JT, AustinWEN, Bergsten H, Jennings AE (eds). Geological Society SpecialPublication no. 111; 51–76.
Telford RJ, Heegard E, Birks HJB. 2004. The intercept is a poor estimateof a calibrated radiocarbon age. The Holocene 14: 296–298.
van Weering TCE. 1975. Late Quaternary history of the Skagerrak: aninterpretation of acoustical profiles. Geologie en Mijnbouw 54:130–145.
van Weering TCE. 1982a. Recent sediments and sediment transport inthe northern North Sea: pistoncores from Skagerrak. Proceedings ofthe Koninklijke Nederlandse Akademie van Wetenschapper B85:155–201.
van Weering TCE. 1982b. Shallow seismic and acoustic reflectionprofiles from the Skagerrak: implications for recent sedimentation.Proceedings of the Koninklijke Nederlandse Akademie vanWetenschapper B85: 129–154.
van Weering TCE, Jansen JHF, Eisma D. 1973. Acoustic reflectionprofiles of the Norwegian Channel between Oslo and Bergen.Netherlands Journal of Sea Research 6: 241–263.
van Weering TCE, Berger GW, Okkels E. 1993. Sediment transport,resuspension and accumulation rates in the north-eastern Skagerrak.Marine Geology 111: 269–285.
von Haugwitz WR, Wong HK. 1993. Multiple Pleistocene ice advancesinto the Skagerrak: a detailed seismic stratigraphy from high resolu-tion seismic profiles. Marine Geology 111: 189–207.
32 JOURNAL OF QUATERNARY SCIENCE
Copyright � 2005 John Wiley & Sons, Ltd. J. Quaternary Sci., Vol. 20(1) 21–32 (2005)