holographic detection of a tooth structure deformation
TRANSCRIPT
Holographic detection of a tooth structure deformationafter dental filling polymerization
Dejan PantelicInstitute of PhysicsPregrevica 11811080 Zemun, BelgradeSerbiaE-mail: [email protected]
Larisa BlažicUniversity of Novi SadFaculty of MedicineDental ClinicHajduk Veljkova 1221000 Novi SadSerbia
Svetlana Savic-ŠevicBratimir PanicInstitute of PhysicsPregrevica 11811080 Zemun, BelgradeSerbia
Abstract. An experimental technique to reveal the effects of dentalpolymer contraction is established to choose the most appropriatepolymerization technique. Tooth deformation following a dental fill-ing polymerization is analyzed using double-exposure holographicinterferometry. A caries-free, extracted human molar is mounted indental gypsum and different cavity preparations and fillings are madeon the same tooth. Dental composite fillings are polymerized by anLED light source especially designed for this purpose. Holographicinterferograms are made for occlusal �class I�, occlusomesial �class II�,and mesioocclusodistal �class II MOD� cavities and fillings. Maximumintercuspal deformation ranges from 2 �m for the class I cavity to14 �m for the MOD class cavity. A finite element method �FEM� isused to calculate von Mises stress on a simplified tooth model, basedon experimental results. The stress varies between 50 and 100 MPa,depending on the cavity type. © 2007 Society of Photo-Optical InstrumentationEngineers. �DOI: 10.1117/1.2714056�
Keywords: holography; interferometry; biomechanics; dental composites.Paper 06046RR received Mar. 3, 2006; revised manuscript received Nov. 22, 2006;accepted for publication Nov. 27, 2006; published online Mar. 12, 2007.
1 Introduction
Polymerization shrinkage of dental composites is still a causeof serious clinical problems such as loss of bonding betweencomposite and a tooth, or microfractures of a tooth tissue,both resulting in premature dental filling failure.1 In addition,stress caused by polymerization contraction may also causepostoperative sensitivity.2 It is difficult to directly measurestress induced by dental composite contraction, as it is distrib-uted inside the tooth. Instead, the resulting deformation of atooth surface is measured and the stress is estimated.
The current research is performed in several directions.One deals with linear and volumetric contraction of pure com-posite layers �outside the dental cavity�.3–7 The second, clini-cally more relevant approach focuses on measuring tooth de-formation induced by the composite inside the dental cavity.Changes in tooth structure and the resulting cuspaldeflection8–11 due to polymerization shrinkage are detected byseveral measurement techniques: microscopy,12 straingauges,13 interferometry,14 and photoelasticity.15,16
The third, computational, approach analyzes both deforma-tion and the resulting stress, using the finite elementmethod17–20 �FEM�. This is essentially a computer simulationthat gives detailed information about shrinkage stresses, butdoes not take into consideration specific differences in humanteeth which vary considerably in their coronal morphologyand mechanical properties.21 Therefore, the same results fornumerical and experimental studies cannot be expected, be-cause the total shrinkage and the resulting stress are depen-
dent on the cavity shape, tooth tissue structure, and the prop-erties of the composite material, bonding system, andpolymerization process.
As can be seen, a method connecting experimental mea-surements of dental deformation with numerical calculation ofinternal stress is necessary. First, complete deformation fieldshould be measured, and then the FEM should be applied todetermine stress inside the tooth.
Holography offers a solution to the problem of the defor-mation field measurement. In particular, laser interferometryby holography is a nondestructive method for measurement ofmechanical deformations of different structures and materials.Deformation is seen as a system of dark and bright fringessuperposed on the 3-D holographic image. The fringes aremaps of the investigated structure deformation and representan extremely sensitive picture of displacements caused by me-chanical stress.
Holographic interferometry was used previously to inves-tigate various dental tissues or dental implants.22–26 To ourknowledge, this paper is the first holographic study of a com-plete tooth deformation field induced by dental compositeshrinkage. The holographic interferometry method was used�in vitro� to determine the total deformation at any point of thetooth surface. Based on experimental data, the resulting stresswas calculated using the FEM.
2 MethodCaries-free extracted human third molars were used. Theywere kept in a saline solution at 4°C to preserve their biologi-cal and mechanical properties. Just before measurement, the
1083-3668/2007/12�2�/024026/7/$25.00 © 2007 SPIE
Address all correspondence to Dejan Pantelic, Lasers and Optoelectronics, In-stitute of Physics, Pregrevica 118, 11080 Zemun, Belgrade, Serbia; Tel: 381 113160793; Fax: 381 11 3162190; E-mail: [email protected]
Journal of Biomedical Optics 12�2�, 024026 �March/April 2007�
Journal of Biomedical Optics March/April 2007 � Vol. 12�2�024026-1
Downloaded From: https://www.spiedigitallibrary.org/journals/Journal-of-Biomedical-Optics on 16 Oct 2021Terms of Use: https://www.spiedigitallibrary.org/terms-of-use

tooth was mounted in an inclined position using dental gyp-sum, in a manner shown in Fig. 1. After drying, a good me-chanical contact between the tooth and gypsum was obtained,enabling stability during holographic measurements.
Standard cavity preparations and restorations were made�class I, class II, and class II MOD� and the configuration isshown schematically in Figs. 2�a�–2�c�. They were cut using adiamond coated burr attached to the water-cooled air turbine.Each cavity was prepared for dental composite placement bythe “Prompt L Pop” adhesive system according to the manu-facturer’s �3M ESPE, Seefeld, Germany� instruction. Conse-quently, the cavities were filled in one increment �bulk tech-
nique� with a commercially available dental composite resin“Filtek Z 250” �3M ESPE, Seefeld, Germany�.
Dental composite resin was polymerized by an LED lightsource, specially designed for research purposes. LED diodes�42 of them in total, with 10 mW of optical output power,each� were mounted on the hemispherical holder �Figs. 3�a�and 3�b��. The light source produced an evenly illuminatedcircular spot �more than 1 cm in diameter� at the center of asphere where the tooth was placed, illuminated, and a dentalfilling was polymerized. This enabled contactless operation, incontrast to commercial devices, where the LED lamp tipshould be in complete contact with dental polymer.
Operation without contact is important in holographic re-search, where extreme mechanical stability is required. Addi-tionally, possible heat transfer from the LED to the tooth isnegligible, because LEDs dissipate only a small amount ofheat and the tooth is 30 mm from the lamp.
The tooth surface must be painted to improve fringe vis-ibility in the resulting holographic interferogram.26,27 A paintlayer must be thin, but opaque to laser radiation and capableof drying fast. A silver marker �PX-20�L� produced by Mit-subishi Pencil Co. Ltd.� served this purpose perfectly.
Double-exposure holograms were produced using a simplesplit beam setup �Fig. 4� with 10-mW power, 632.8-nm wave-length HeNe laser. The LED lamp was positioned above thetooth to induce polymerization. The first holographic expo-sure �of 5-s duration� was made before polymerization. TheLED lamp was turned on for the time period necessary toinduce complete polymerization. Subsequently, the LEDsource was turned off and the second holographic exposure�5 s� was made. Therefore, two holographic images were re-corded on the same holographic photosensitive material �sil-ver halide glass plate, Agfa 8E75HD�.
Following the standard chemical processing �development,fixing, bleaching, and drying�, the hologram plate was re-turned to its original position and prepared for reconstructionand analysis. On reconstruction two coherent images wereseen—one corresponding to the undeformed and the other tothe deformed state of the tooth. Interference of these two
Fig. 1 Tooth mounted in dental gypsum in an inclined position.
Fig. 2 Standard dental cavity configurations: �a� class I, �b� class II, and �c� class II MOD.
Pantelic et al.: Holographic detection of a tooth structure deformation…
Journal of Biomedical Optics March/April 2007 � Vol. 12�2�024026-2
Downloaded From: https://www.spiedigitallibrary.org/journals/Journal-of-Biomedical-Optics on 16 Oct 2021Terms of Use: https://www.spiedigitallibrary.org/terms-of-use

images produces a series of dark and bright fringes—an inter-ferogram.
The holographic interferogram was made first for the oc-clusal cavity �class I�, and then the same procedure was
repeated for the occlusomesial cavity �class II� and the me-sioocclusodistal cavity �class II MOD�. All cavities weremade in the same tooth specimen by gradually increasing thecavity dimension from class I to class II MOD type.
Fig. 3 LED lamp used during experiments produces even illumination on a circle with more than 1 cm diameter: �a� technical drawing withdimensions in millimeters and �b� photograph of an LED lamp.
Fig. 4 Holographic interferometry setup: LA, laser; BS, beamsplitter; M, mirror; L, diverging lens �pinhole filter�; HP, holographic plate; T, tooth; LD,LED lamp.
Pantelic et al.: Holographic detection of a tooth structure deformation…
Journal of Biomedical Optics March/April 2007 � Vol. 12�2�024026-3
Downloaded From: https://www.spiedigitallibrary.org/journals/Journal-of-Biomedical-Optics on 16 Oct 2021Terms of Use: https://www.spiedigitallibrary.org/terms-of-use

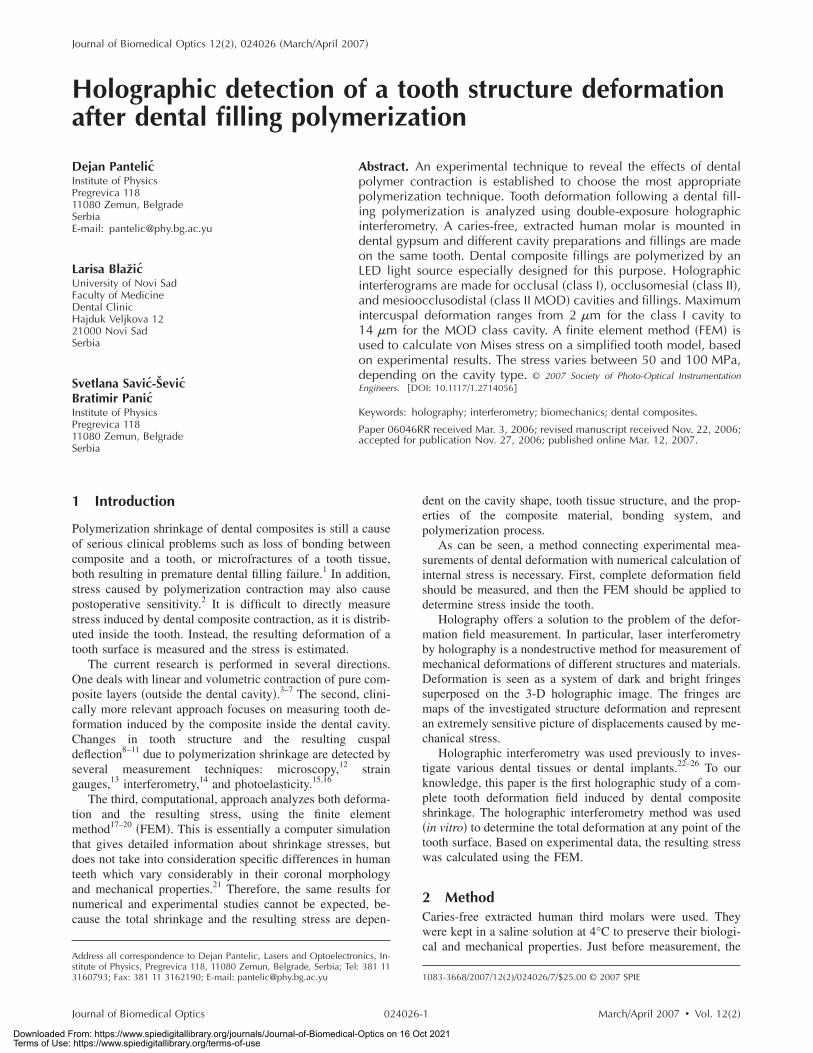
3 Results of Holographic MeasurementsAs a general conclusion, it was found that a larger volume ofcomposite material �due to a larger cavity� induced morestrain. Photographs show a series of interferograms obtainedfor occlusal cavity �class I, Figs. 5�a� and 5�b��, occlusomesialcavity �class II, Figs. 6�a� and 6�b��, and mesioocclusodistalcavity �class II MOD, Figs. 7�a� and 7�b��. Figures 5�a�, 6�a�,and 7�a� are the original photographs, while in Figs. 5�b�,6�b�, and 7�b� dark fringes are emphasized by lines with num-bers indicating the corresponding deformation in micrometers�i.e., deformation is constant along each line or fringe�.
Obviously, number of fringes increases with an increasedcavity size. An occlusal cavity produced only one, barely vis-ible, fringe at the tooth cusp �Figs. 5�a� and 5�b��. Fringenumber increases to 7 for the occlusomesial cavity �Figs. 6�a�and 6�b��, and for mesioocclusodistal cavity �Figs. 7�a� and7�b��, 12 fringes are visible. Knowing the wavelength of the
laser radiation �633 nm�, it was concluded that maximum de-flections range from, approximately, 1 �class I cavity� to7 �m �class II MOD cavity�.
In our experiment, we could see only one side of a tooth,while the other was completely invisible. It can be assumedthat roughly the same deformation was produced on the hid-den side, since a tooth is almost symmetrical with respect tothe mesiodistal line, and cavities were also intentionallydrilled symmetrically �see Fig. 1�. Therefore, the resulting in-tercuspal movement ranges from 2 to 14 �m �double of whatwas observed on one side of the tooth�.
4 Mechanical Model and Finite ElementCalculation of Mechanical Stress
The FEM is a powerful tool in dentistry. However, its resultsshould be treated more as an estimate, rather than an exact
Fig. 5 Tooth hologram reconstruction of �a� class I cavity and �b� class I cavity with contour lines drawn �numbers designate deformation inmicrometers�.
Fig. 6 Tooth hologram reconstruction of �a� class II cavity and �b� class II cavity with contour lines drawn �numbers designate deformation inmicrometers�.
Pantelic et al.: Holographic detection of a tooth structure deformation…
Journal of Biomedical Optics March/April 2007 � Vol. 12�2�024026-4
Downloaded From: https://www.spiedigitallibrary.org/journals/Journal-of-Biomedical-Optics on 16 Oct 2021Terms of Use: https://www.spiedigitallibrary.org/terms-of-use
picture of the actual stress distribution inside the dental tissue.This is due to natural variability in properties of teeth, differ-ences in characteristics of dental polymers, and because ofapproximations made during modeling and calculation.
Teeth were previously modeled in many ways, and stressand strain were calculated. Two-dimensional �2-D� and 3-Dmodels were constructed by approximating a tooth with acylinder28 or a parallelepiped.17 More realistic mechanicalmodels were obtained by computerized tomography29 �CT� orlaser scanning of a real tooth.30
In general, results obtained by approximating a tooth17,28
are quite similar to more comprehensive models.18,30 Stressdistributions are comparable and numerical values of maxi-mum von Mises stress are roughly the same.
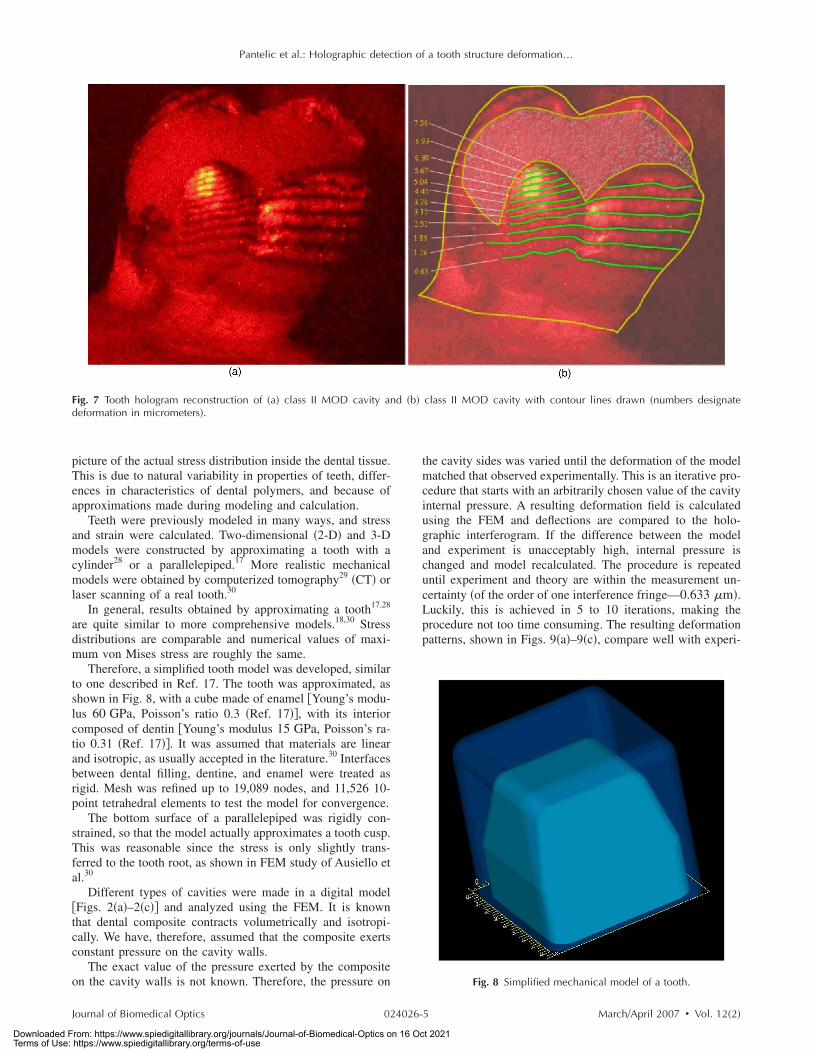
Therefore, a simplified tooth model was developed, similarto one described in Ref. 17. The tooth was approximated, asshown in Fig. 8, with a cube made of enamel �Young’s modu-lus 60 GPa, Poisson’s ratio 0.3 �Ref. 17��, with its interiorcomposed of dentin �Young’s modulus 15 GPa, Poisson’s ra-tio 0.31 �Ref. 17��. It was assumed that materials are linearand isotropic, as usually accepted in the literature.30 Interfacesbetween dental filling, dentine, and enamel were treated asrigid. Mesh was refined up to 19,089 nodes, and 11,526 10-point tetrahedral elements to test the model for convergence.
The bottom surface of a parallelepiped was rigidly con-strained, so that the model actually approximates a tooth cusp.This was reasonable since the stress is only slightly trans-ferred to the tooth root, as shown in FEM study of Ausiello etal.30
Different types of cavities were made in a digital model�Figs. 2�a�–2�c�� and analyzed using the FEM. It is knownthat dental composite contracts volumetrically and isotropi-cally. We have, therefore, assumed that the composite exertsconstant pressure on the cavity walls.
The exact value of the pressure exerted by the compositeon the cavity walls is not known. Therefore, the pressure on
the cavity sides was varied until the deformation of the modelmatched that observed experimentally. This is an iterative pro-cedure that starts with an arbitrarily chosen value of the cavityinternal pressure. A resulting deformation field is calculatedusing the FEM and deflections are compared to the holo-graphic interferogram. If the difference between the modeland experiment is unacceptably high, internal pressure ischanged and model recalculated. The procedure is repeateduntil experiment and theory are within the measurement un-certainty �of the order of one interference fringe—0.633 �m�.Luckily, this is achieved in 5 to 10 iterations, making theprocedure not too time consuming. The resulting deformationpatterns, shown in Figs. 9�a�–9�c�, compare well with experi-
Fig. 7 Tooth hologram reconstruction of �a� class II MOD cavity and �b� class II MOD cavity with contour lines drawn �numbers designatedeformation in micrometers�.
Fig. 8 Simplified mechanical model of a tooth.
Pantelic et al.: Holographic detection of a tooth structure deformation…
Journal of Biomedical Optics March/April 2007 � Vol. 12�2�024026-5
Downloaded From: https://www.spiedigitallibrary.org/journals/Journal-of-Biomedical-Optics on 16 Oct 2021Terms of Use: https://www.spiedigitallibrary.org/terms-of-use
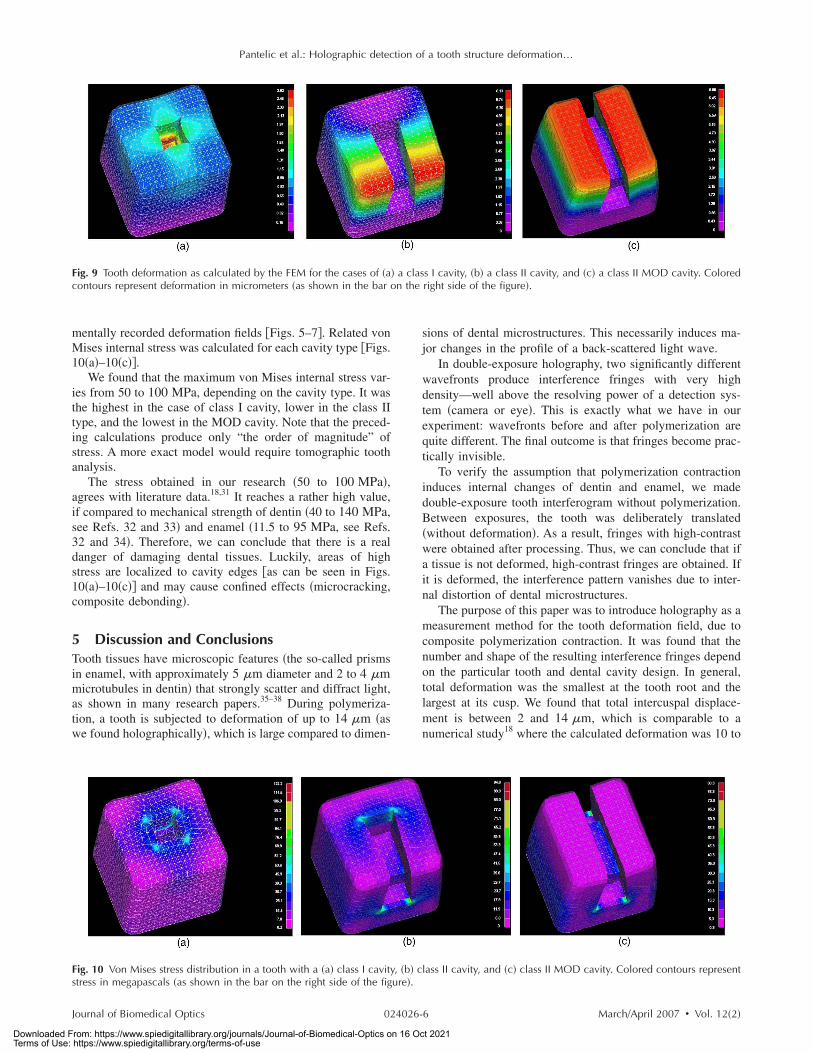
mentally recorded deformation fields �Figs. 5–7�. Related vonMises internal stress was calculated for each cavity type �Figs.10�a�–10�c��.
We found that the maximum von Mises internal stress var-ies from 50 to 100 MPa, depending on the cavity type. It wasthe highest in the case of class I cavity, lower in the class IItype, and the lowest in the MOD cavity. Note that the preced-ing calculations produce only “the order of magnitude” ofstress. A more exact model would require tomographic toothanalysis.
The stress obtained in our research �50 to 100 MPa�,agrees with literature data.18,31 It reaches a rather high value,if compared to mechanical strength of dentin �40 to 140 MPa,see Refs. 32 and 33� and enamel �11.5 to 95 MPa, see Refs.32 and 34�. Therefore, we can conclude that there is a realdanger of damaging dental tissues. Luckily, areas of highstress are localized to cavity edges �as can be seen in Figs.10�a�–10�c�� and may cause confined effects �microcracking,composite debonding�.
5 Discussion and ConclusionsTooth tissues have microscopic features �the so-called prismsin enamel, with approximately 5 �m diameter and 2 to 4 �mmicrotubules in dentin� that strongly scatter and diffract light,as shown in many research papers.35–38 During polymeriza-tion, a tooth is subjected to deformation of up to 14 �m �aswe found holographically�, which is large compared to dimen-
sions of dental microstructures. This necessarily induces ma-jor changes in the profile of a back-scattered light wave.
In double-exposure holography, two significantly differentwavefronts produce interference fringes with very highdensity—well above the resolving power of a detection sys-tem �camera or eye�. This is exactly what we have in ourexperiment: wavefronts before and after polymerization arequite different. The final outcome is that fringes become prac-tically invisible.
To verify the assumption that polymerization contractioninduces internal changes of dentin and enamel, we madedouble-exposure tooth interferogram without polymerization.Between exposures, the tooth was deliberately translated�without deformation�. As a result, fringes with high-contrastwere obtained after processing. Thus, we can conclude that ifa tissue is not deformed, high-contrast fringes are obtained. Ifit is deformed, the interference pattern vanishes due to inter-nal distortion of dental microstructures.
The purpose of this paper was to introduce holography as ameasurement method for the tooth deformation field, due tocomposite polymerization contraction. It was found that thenumber and shape of the resulting interference fringes dependon the particular tooth and dental cavity design. In general,total deformation was the smallest at the tooth root and thelargest at its cusp. We found that total intercuspal displace-ment is between 2 and 14 �m, which is comparable to anumerical study18 where the calculated deformation was 10 to
Fig. 9 Tooth deformation as calculated by the FEM for the cases of �a� a class I cavity, �b� a class II cavity, and �c� a class II MOD cavity. Coloredcontours represent deformation in micrometers �as shown in the bar on the right side of the figure�.
Fig. 10 Von Mises stress distribution in a tooth with a �a� class I cavity, �b� class II cavity, and �c� class II MOD cavity. Colored contours representstress in megapascals �as shown in the bar on the right side of the figure�.
Pantelic et al.: Holographic detection of a tooth structure deformation…
Journal of Biomedical Optics March/April 2007 � Vol. 12�2�024026-6
Downloaded From: https://www.spiedigitallibrary.org/journals/Journal-of-Biomedical-Optics on 16 Oct 2021Terms of Use: https://www.spiedigitallibrary.org/terms-of-use
20 �m. The strain due to setting of composite restoration wasquantified previously by measuring cuspal movement,12,36,39
with similar experimental results.The resulting stress was calculated using the FEM applied
to the simplified tooth model. Correspondence with measure-ments was established, and the resulting maximum stress wasestimated between 50 and 100 MPa. To achieve more exactpicture of dental stress, tomographic methods should be used.
Finally, holographic interferometry has indirectly indicatedthat there are alterations in internal structure of dental tissuescaused by polymerization contraction of composite material.This was verified by the almost total absence of an interfer-ence pattern in the case of an unpainted tooth surface.
AcknowledgmentsThis work was supported by the Serbian Ministry of Scienceand Environmental Protection under the Contract No. 141003.
References1. D. Tantbirojn, A. Versluis, M. R. Pintado, R. DeLong, and W. H.
Douglas, “Tooth deformation patterns in molars after composite res-toration,” Dent. Mater. 20, 535–542 �2004�.
2. N. J. M. Opdam, F. J. M. Roeters, A. J. Feilzer, and E. H. Verdon-schot, “Marginal integrity and postoperative sensitivity in class 2resin composite restoration in vivo,” J. Dent. 26, 555–562 �1998�.
3. C. Alvarez-Gayosso, F. Barcelo-Santana, J. Guerrero-Ibarra, G. Saez-Espınola, and M. A. Canseco-Martınez, “Calculation of contractionrates due to shrinkage in light-cured composites,” Dent. Mater. 20,228–235 �2004�.
4. R. L. Sakaguchi, B. D. Wiltbank, and N. C. Shah, “Critical configu-ration analysis of four methods or measuring polymerization shrink-age strain of composites,” Dent. Mater. 20, 388–396 �2004�.
5. J. H. Lai and A. E. Johnson, “Measuring polymerization shrinkage ofphoto-activated restorative materials by a water-filled dilatometer,”Dent. Mater. 16, 172–176 �1993�.
6. C. L. Davidson, A. J. De Gee, and A. J. Feilzer, “True linear poly-merization shrinkage of unfilled resin and composites determinedwith a linometer,” Dent. Mater. 9, 11–14 �1993�.
7. E. A. Fogleman, M. T. Kelly, and W. T. Grubbs, “Laser interferomet-ric method for measuring linear polymerization shrinkage in lightcured dental restoratives,” Dent. Mater. 18, 324–330 �2002�.
8. R. H. Kuijs, W. M. M. Fennis, C. M. Kreulen, M. Barink, and N.Verdonschof, “Does layering minimize shrinkage stresses in compos-ite restorations?” J. Dent. Res. 82, 967–971 �2003�.
9. N. Martin, N. M. Jedynakiewicz, and D. F. Williams, “Cuspal deflec-tion during polymerization on composite lutes of ceramic inlays,” J.Dent. 27, 29–36 �1999�.
10. B. E. Causton, B. Miller, and J. Sefton, “The deformation of cusps bybonded posterior composite restorations: an in-vitro study,” Br. Dent.J. 159, 397–400 �1985�.
11. G. J. Pearson and S. M. Hegarty, “Cusp movement of molar teethwith composite filling materials in conventional and modified MODcavities,” Br. Dent. J. 166, 162–165 �1989�.
12. A. A. Suliman, D. B. Boyer, and R. S. Lakes, “Cusp movements inpremolars resulting from composite polymerization shrinkage,” Dent.Mater. 9, 6–10 �1993�.
13. N. Meredith and D. J. Setchell, “In vitro measurement of cuspalstrain and displacement in composite restored teeth,” J. Dent. 25,331–337 �1997�.
14. A. A. Suliman, D. B. Boyer, and R. S. Lakes, “Interferometric mea-surement of cusp deformation of teeth restored with composite,” J.Dent. Res. 72, 1532–1536 �1993�.
15. Y. Kinomoto and M. Torii, “Photoelastic analysis of polymerizationcontraction stresses in resin composite restoratives,” J. Dent. 26,165–171 �1998�.
16. C. P. Ernst, G. R. Meyer, K. Klöcker, and B. Willershausen, “Deter-mination of polymerization shrinkage stress by means of a photoelas-tic investigation,” Dent. Mater. 20, 313–321 �2004�.
17. H. Ensaff, D. M. O’Doherty, and P. H. Jacobsen, “The influence of
the restoration-tooth interface in light cured composite restorations: afinite element analysis,” Biomaterials 22, 3097–3103 �2001�.
18. A. Versluis, D. Tantbirojn, M. R. Pintado, R. DeLong, and W. H.Douglas, “Residual shrinkage stress distributions in molars aftercomposite restoration,” Dent. Mater. 20, 554–564 �2004�.
19. P. Hubsch, J. Middleton, and J. Knox, “The influence of cavity shapeon the stresses in composite dental restorations: a finite elementstudy,” Comput. Methods Biomech. Biomed. Eng. 5, 343–349 �2002�.
20. M. Barink, P. C. Van der Mark, W. M. Fennis, R. H. Kuijs, C. M.Kreulen, and N. Verdonschot, “A three dimensional finite elementmodel of the polymerization process in dental restorations,” Bioma-terials 24, 1427–1435 �2003�.
21. J. Jantarat, P. Panitvisai, J. E. A. Palamara, and H. Messerh, “Com-parison of methods for measuring cuspal deformation in teeth,” J.Dent. 29, 75–82 �2001�.
22. A. Wesson, G. R. Goldstein, and A. Schulman, “Flexion characteris-tics of fixed partial denture frameworks tested by using elapsed-timeholographic interferometry,” J. Prosthet. Dent. 60, 308–310 �1988�.
23. R. J. Van Straten, L. M. Hitge, W. Kalk, and J. Schenk, “A study ofacrylic resin denture base material distortion using computer-aidedholographic interferometry,” Int. J. Prosthodont 4, 577–585 �1991�.
24. P. R. Wedendal and H. I. Bjelkhagen, “Dental holographic interfer-ometry in vivo utilizing a ruby laser system I. Introduction and de-velopment of methods for precision measurements on the functionaldynamics of human teeth and prosthodontic appliances,” Acta Odon-tol. Scand. 32, 131–145 �1974�.
25. P. R. Wedendal and H. I. Bjelkhagen, “Dental holographic interfer-ometry in vivo utilizing a ruby laser system. II. Clinical applica-tions,” Acta Odontol. Scand. 32, 345–356 �1974�.
26. P. R. Wedendal and H. I. Bjelkhagen, “Dynamics of human teeth infunction by means of double pulsed holography: an experimentalinvestigation,” Appl. Opt. 13, 2481–2485 �1974�.
27. D. Fried, R. E. Glena, J. D. B. Featherstone, and W. Seka, “Nature oflight scattering in dental enamel and dentin at visible and near-infrared wavelengths,” Appl. Opt. 34, 1278–1285 �1995�.
28. B. Kahler, A. Kotousov, and K. Borkowski, “Effect of material prop-erties on stresses at the restoration-dentin interface of composite res-torations during polymerization,” Dent. Mater. 22, 942–947 �2006�.
29. N. Verdonshot, W. M. M. Fennis, R. H. Kuijs, J. Stolk, C. M.Kreulen, and N. H. J. Creugers, “Generation of 3-D finite elementmodels of restored human teeth using micro-CT techniques,” Int. J.Prosthodont 14, 310–315 �2001�.
30. P. Ausiello, A. Apicella, C. L. Davidson, and S. Rengo, “3D-finiteelement analyses of cusp movements in a human upper premolar,restored with adhesive resin-based composites,” J. Biomech. 34,1269–1277 �2001�.
31. P. Ausiello, A. Apicella, and C. L. Davidson, “Effect of adhesivelayer properties on stress distribution in composite restorations—a3D finite element analysis,” Dent. Mater. 18, 295–303 �2002�.
32. M. Giannini, C. J. Soares, and R. M. de Carvalho, “Ultimate tensilestrength of tooth structures,” Dent. Mater. 20, 322–329 �2004�.
33. P. A. Miguez, P. N. R. Pereira, P. Atsawasuwan, and M. Yamauchi,“Collagen cross-linking and ultimate tensile strength in dentin,” J.Dent. Res. 83, 807–810 �2004�.
34. E. B. De Las Casas, T. P. M. Cornacchia, P. H. Gouvea, and C. A.Cimini, Jr., “Abfraction and anisotropy-effects of prism orientationon stress distribution,” Comput. Methods Biomech. Biomed. Eng. 6,65–73 �2003�.
35. J. R. Zijp, J. J. ten Bosch, and R. A. J. Groenhuis, “HeNe-laser lightscattering by human dental enamel,” J. Dent. Res. 74, 1891–1898�1995�.
36. R. E. Walton, W. C. Outhwaite, and D. F. Pashley, “Magnification–aninteresting optical property of dentin,” J. Dent. Res. 55, 630–642�1976�.
37. W. J. O’Brien, “Fraunhofer diffraction of light by human enamel,” J.Dent. Res. 67, 484–486 �1988�.
38. R. Schilke, J. A. Lisson, O. Bauss, and W. Geurtsen, “Comparison ofthe number and diameter of dentinal tubules in human and bovinedentine by scanning electron microscopic investigation,” Arch. OralBiol. 45, 355–361 �2000�.
39. A. A. Suliman, D. B. Boyer, and R. S. Lakes, “Polymerizationshrinkage of composite resins: comparison with tooth deformation,”J. Prosthet. Dent. 71, 7–12 �1994�.
Pantelic et al.: Holographic detection of a tooth structure deformation…
Journal of Biomedical Optics March/April 2007 � Vol. 12�2�024026-7
Downloaded From: https://www.spiedigitallibrary.org/journals/Journal-of-Biomedical-Optics on 16 Oct 2021Terms of Use: https://www.spiedigitallibrary.org/terms-of-use