holt mcdougal algebra 1 10 graphing functions warm up solve each equation for y. 1. 2x + y = 3 2....
TRANSCRIPT

Holt McDougal Algebra 1
10 Graphing Functions
Warm UpSolve each equation for y. 1. 2x + y = 3
2. –x + 3y = –6
3. 4x – 2y = 8
4. Generate ordered pairs for using x = –4, –2, 0, 2 and 4.
Holt McDougal Algebra 1
10 Graphing Functions
I can graph functions given a limited domain.
I can graph functions given a domain of all real numbers.
Objectives
Holt McDougal Algebra 1
10 Graphing Functions
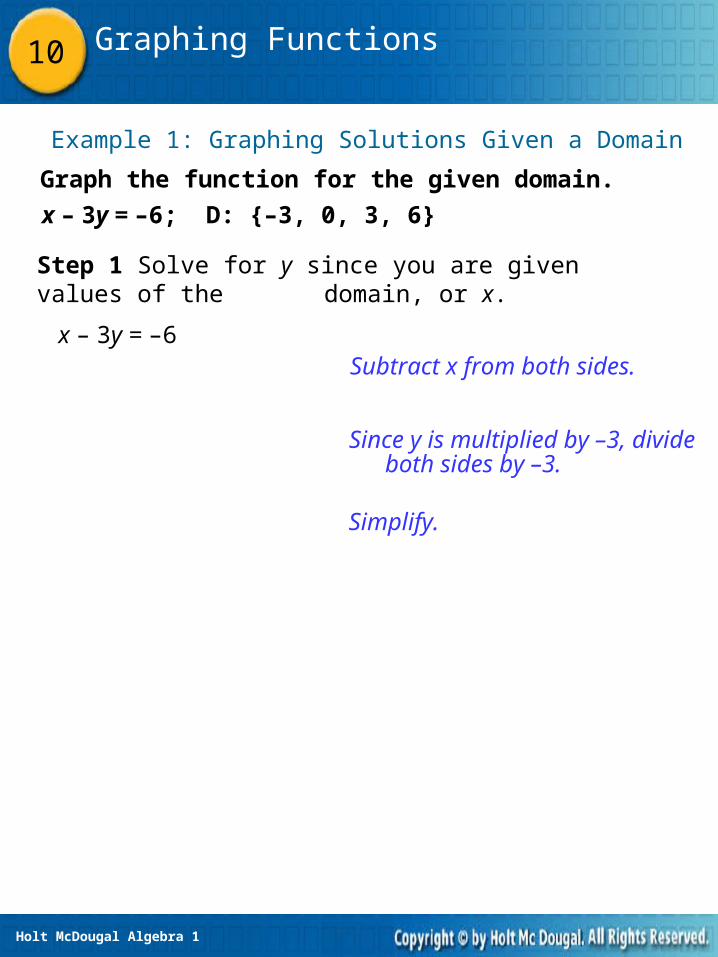
Example 1: Graphing Solutions Given a Domain
Graph the function for the given domain.
x – 3y = –6; D: {–3, 0, 3, 6}
Step 1 Solve for y since you are given values of the domain, or x.
Subtract x from both sides.
Since y is multiplied by –3, divide both sides by –3.
Simplify.
x – 3y = –6
Holt McDougal Algebra 1
10 Graphing Functions
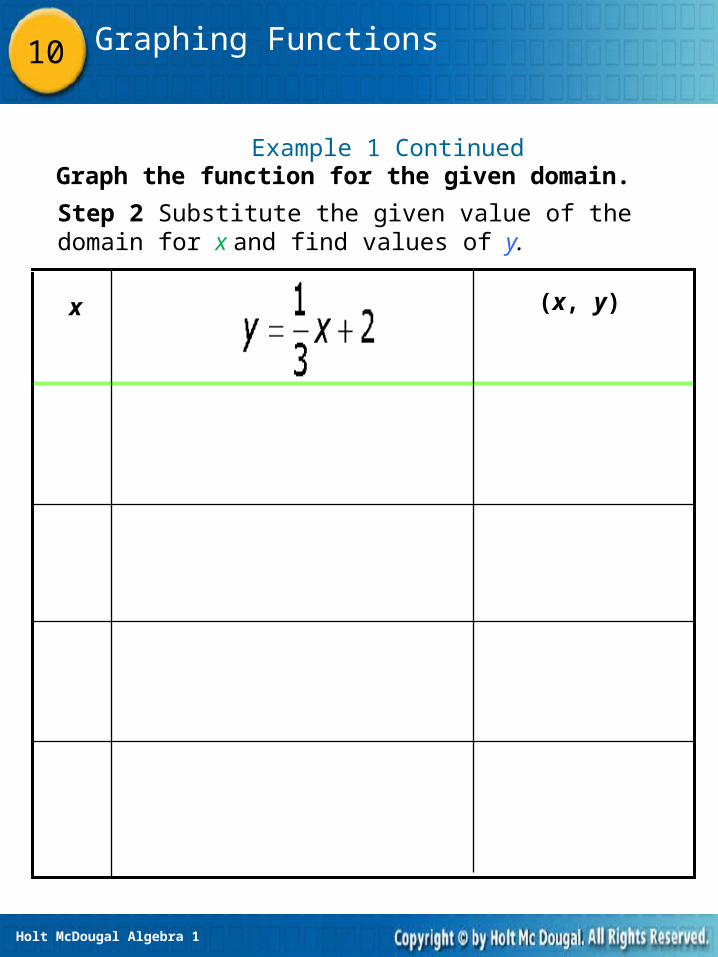
Example 1 Continued
Step 2 Substitute the given value of the domain for x and find values of y.
x (x, y)
Graph the function for the given domain.
Holt McDougal Algebra 1
10 Graphing Functions
y
x
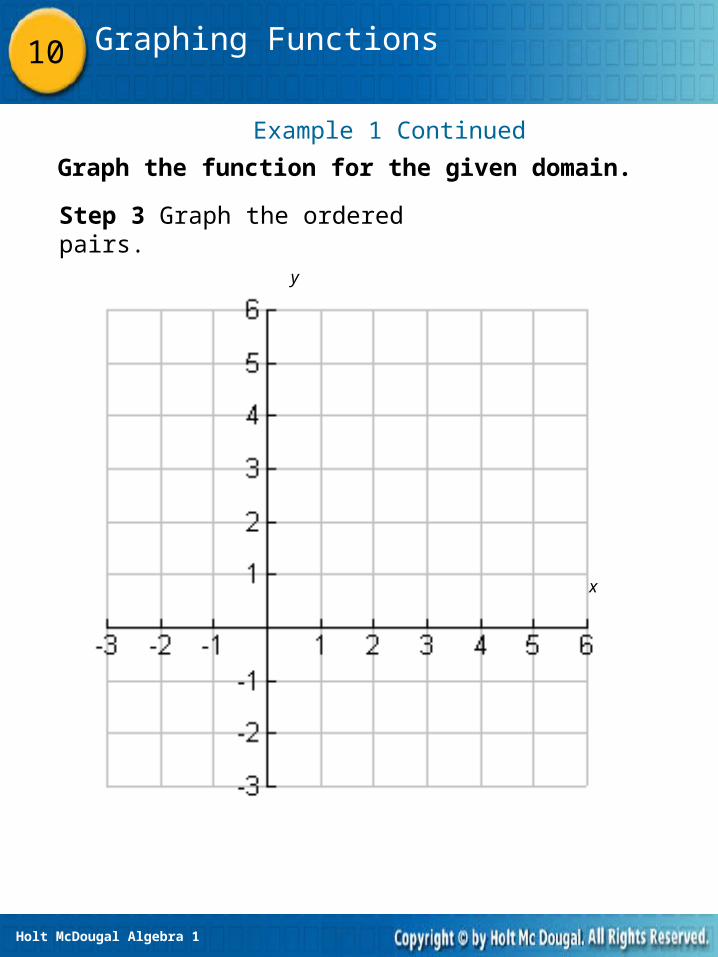
Step 3 Graph the ordered pairs.
Example 1 Continued
Graph the function for the given domain.

Holt McDougal Algebra 1
10 Graphing Functions
Graph the function for the given domain.
f(x) = x2 – 3; D: {–2, –1, 0, 1, 2}
Example 2: Graphing Solutions Given a Domain
Step 1 Use the given values of the domain to find values of f(x).
f(x) = x2 – 3 (x, f(x))x
Holt McDougal Algebra 1
10 Graphing Functions
y
x
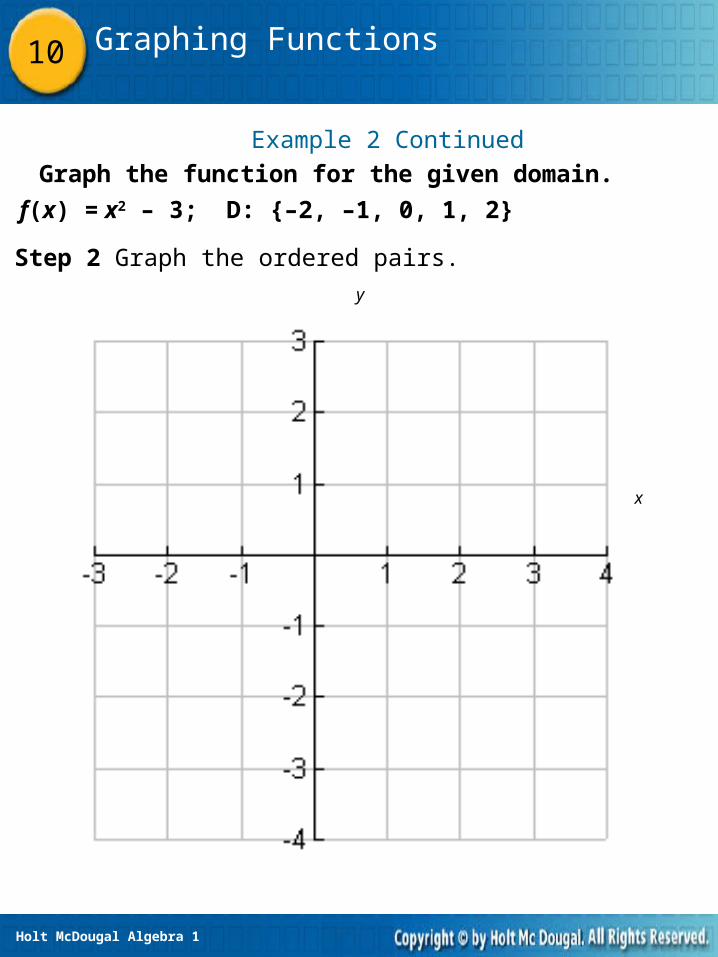
Step 2 Graph the ordered pairs.
Graph the function for the given domain.
f(x) = x2 – 3; D: {–2, –1, 0, 1, 2}
Example 2 Continued

Holt McDougal Algebra 1
10 Graphing Functions
If the domain of a function is all real numbers, any number can be used as an input value. This process will produce an infinite number of ordered pairs that satisfy the function. Therefore, arrowheads are drawn at both “ends” of a smooth line or curve to represent the infinite number of ordered pairs. If a domain is not given, assume that the domain is all real numbers.

Holt McDougal Algebra 1
10 Graphing Functions
Graphing Functions Using a Domain of All Real Numbers
Step 1 Use the function to generate ordered pairs by choosing several values for x.
Step 2
Step 3
Plot enough points to see a pattern for the graph.
Connect the points with a line or smooth curve.
Holt McDougal Algebra 1
10 Graphing Functions
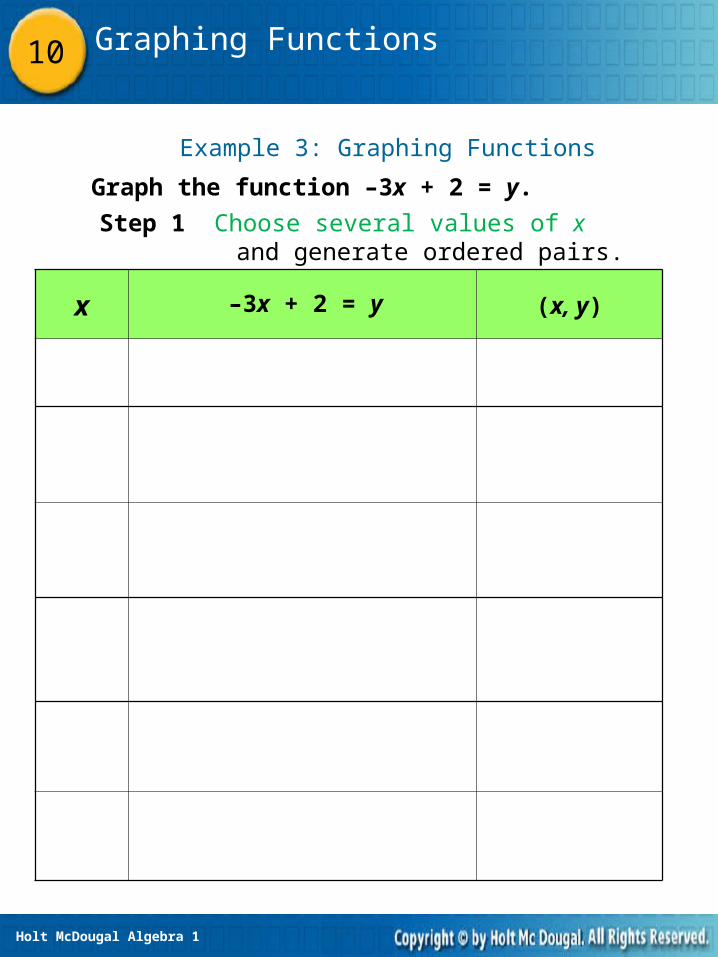
x –3x + 2 = y (x, y)
Example 3: Graphing Functions
Graph the function –3x + 2 = y.
Step 1 Choose several values of x and generate ordered pairs.
Holt McDougal Algebra 1
10 Graphing Functions
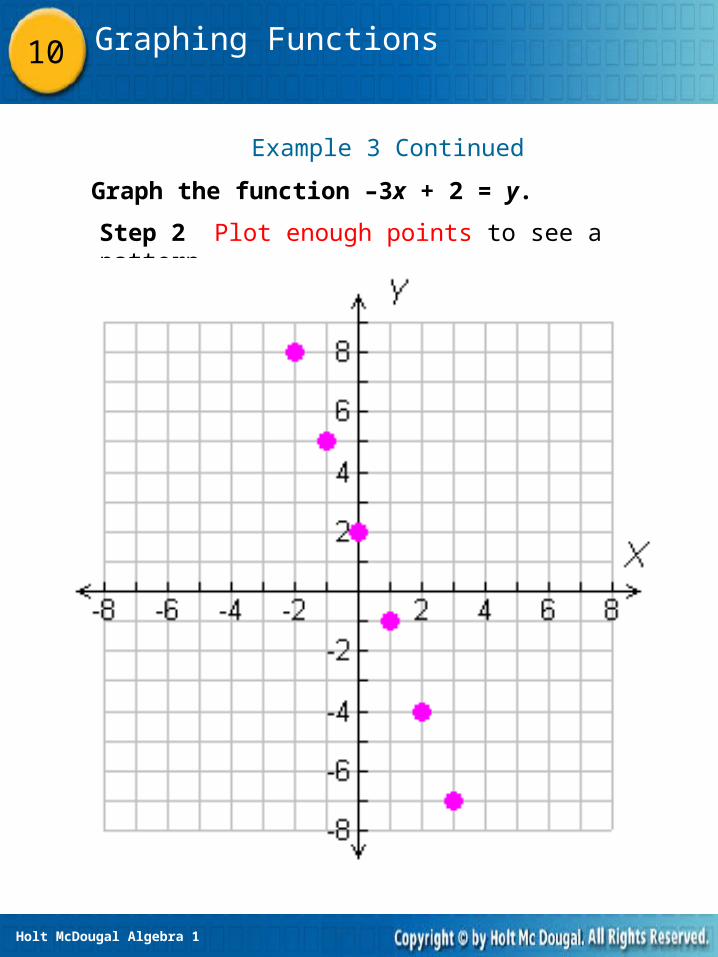
Step 2 Plot enough points to see a pattern.
Example 3 Continued
Graph the function –3x + 2 = y.
Holt McDougal Algebra 1
10 Graphing Functions
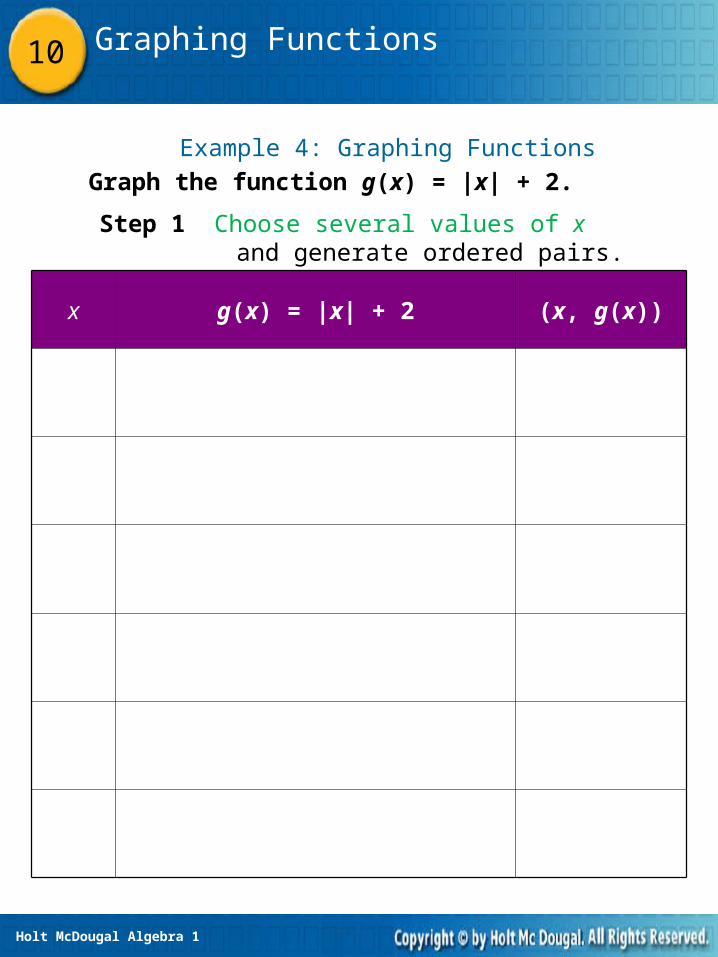
x g(x) = |x| + 2 (x, g(x))
Example 4: Graphing Functions
Step 1 Choose several values of x and generate ordered pairs.
Graph the function g(x) = |x| + 2.
Holt McDougal Algebra 1
10 Graphing Functions
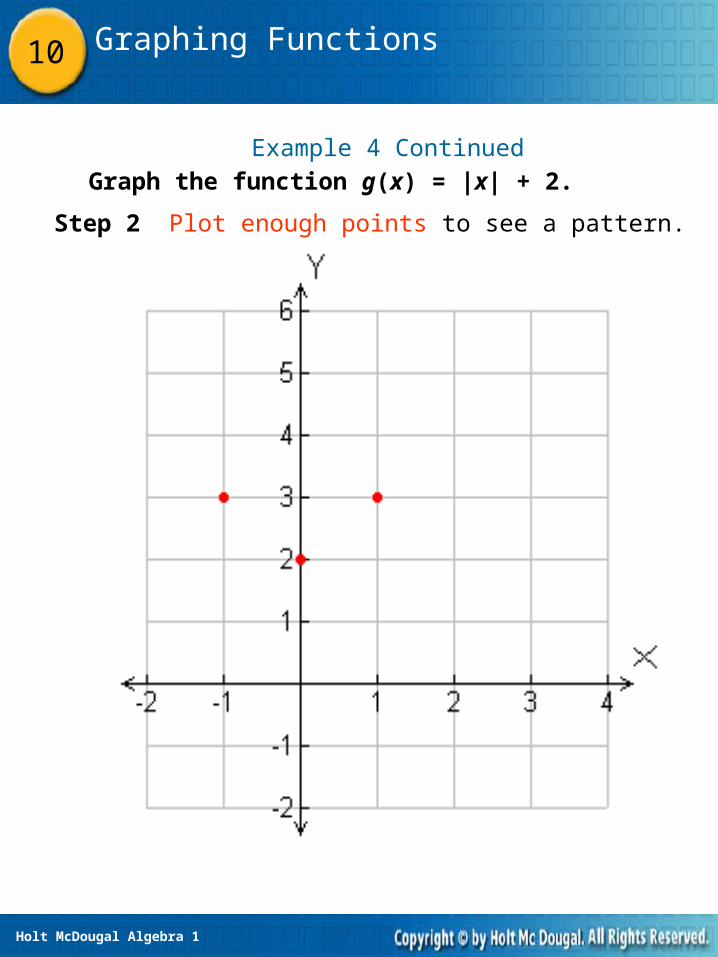
Step 2 Plot enough points to see a pattern.
Example 4 ContinuedGraph the function g(x) = |x| + 2.

Holt McDougal Algebra 1
10 Graphing Functions
Example 5: Finding Values Using Graphs
Use a graph of the function
to find the value of f(x) when x = –4. Check
your answer.
Locate –4 on the x-axis. Move up to the graph of the function. Then move right to the y-axis to find the corresponding value of y.
f(–4) =
Holt McDougal Algebra 1
10 Graphing Functions
Recall that in real-world situations you may have to limit the domain to make answers reasonable. For example, quantities such as time, distance, and number of people can be represented using only nonnegative values. When both the domain and the range are limited to nonnegative values, the function is graphed only in Quadrant I.

Holt McDougal Algebra 1
10 Graphing Functions
Example 6: Problem-Solving Application
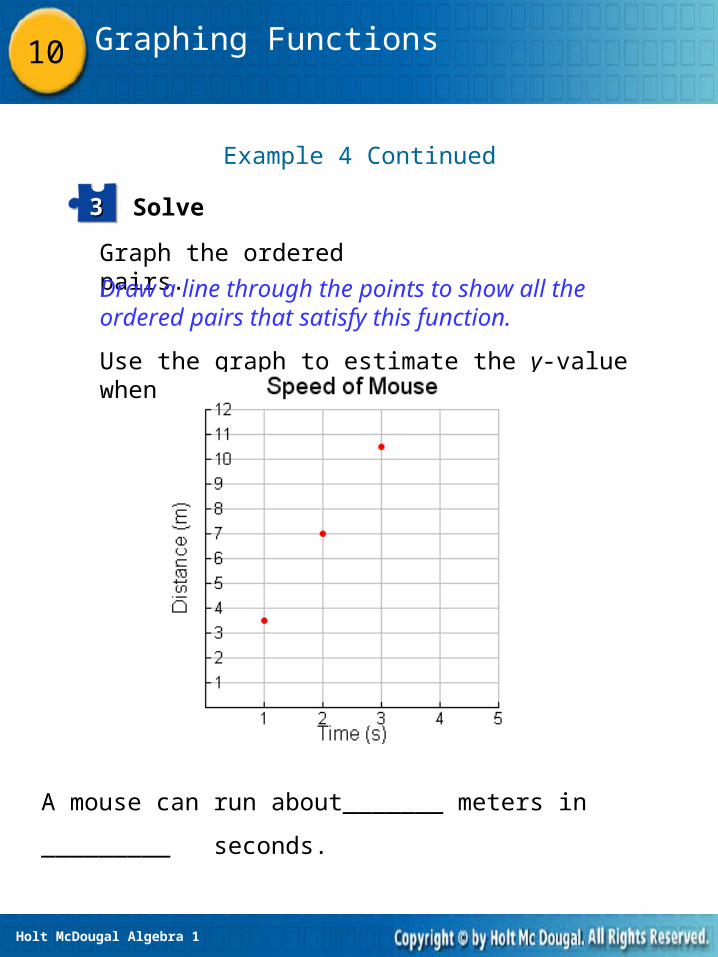
A mouse can run 3.5 meters per second. The function y = 3.5x describes the distance in meters the mouse can run in x seconds. Graph the function. Use the graph to estimate how many meters a mouse can run in 2.5 seconds.
y = 3.5x x (x, y)
Holt McDougal Algebra 1
10 Graphing Functions
Graph the ordered pairs.
Draw a line through the points to show all the ordered pairs that satisfy this function.
Use the graph to estimate the y-value when x is 2.5.
A mouse can run about_______ meters in
_________ seconds.
Solve33
Example 4 Continued

Holt McDougal Algebra 1
10 Graphing Functions
Assignment
Pizzazz Worksheets