home energy savings program evaluation 2011-2012
TRANSCRIPT

Final Report: 2011‐2012
Wyoming Residential Home
Energy Savings Evaluation January 21, 2014
Rocky Mountain Power

This page left blank.

Prepared by:
Sarah Brooks
Jeana Swedenburg
Hossein Haeri
Steve Cofer
Cadmus

1
Table of Contents Glossary of Terms.......................................................................................................................................... 4
Executive Summary ....................................................................................................................................... 6
Key Findings ............................................................................................................................................ 6
Key Impact Evaluation Findings ....................................................................................................... 7
Key Process Evaluation Findings ...................................................................................................... 9
Cost‐Effectiveness Results ............................................................................................................... 9
Summary............................................................................................................................................... 11
Recommendations................................................................................................................................ 12
Introduction ................................................................................................................................................ 13
Program Description ............................................................................................................................. 13
Program Participation .......................................................................................................................... 14
Data Collection and Evaluation Activities ............................................................................................. 15
Sample Design and Data Collection Methods ................................................................................ 15
Impact Evaluation ....................................................................................................................................... 19
Methodology ........................................................................................................................................ 19
Tracking Database Review .................................................................................................................... 20
Lighting ........................................................................................................................................... 20
Non‐Lighting ................................................................................................................................... 20
Lighting Impact Analysis ....................................................................................................................... 22
Lighting Evaluated Gross Savings ................................................................................................... 23
Evaluated Net Savings .................................................................................................................... 33
CFL Retailer Allocation Review ...................................................................................................... 35
Appliances, HVAC, and Weatherization Impact Analysis ..................................................................... 44
Evaluated Gross Savings ................................................................................................................ 44
Appliances, Home Electronics, and HVAC Net Savings Approach ................................................. 55
Process Evaluation Findings ........................................................................................................................ 63
Methodology ........................................................................................................................................ 63
Document Review .......................................................................................................................... 64
Marketing Materials Review .......................................................................................................... 64
Utility and Administrator Staff Interviews ..................................................................................... 64

2
Participant and Trade Ally Surveys ................................................................................................ 65
Program Implementation and Delivery ................................................................................................ 65
Program Overview ......................................................................................................................... 65
Program Status............................................................................................................................... 66
Delivery Structure and Processes .................................................................................................. 66
Program Management and Staffing............................................................................................... 71
Delivery Challenges ........................................................................................................................ 72
Marketing ............................................................................................................................................. 77
Approach and Overview ................................................................................................................ 77
Effectiveness .................................................................................................................................. 78
Customer Response .............................................................................................................................. 82
Lighting Purchasing Decisions ........................................................................................................ 82
Non‐Lighting Participation Decisions ............................................................................................. 83
Satisfaction ..................................................................................................................................... 85
Quality Assurance ................................................................................................................................. 87
Overall Conclusions ..................................................................................................................................... 89
Measure Offerings and Standards ........................................................................................................ 89
Data Collection and Reporting ............................................................................................................. 89
Lighting Retailer Allocation .................................................................................................................. 89
EISA ....................................................................................................................................................... 89
Customer Preference ........................................................................................................................... 89
Lighting Program Sponsorship .............................................................................................................. 90
Trade Ally Support ................................................................................................................................ 90
Drivers of Awareness ............................................................................................................................ 90
Application Processing ......................................................................................................................... 91
Program Website .................................................................................................................................. 91
wattsmart Brand Differentiation .......................................................................................................... 91
Customer Response .............................................................................................................................. 92
Overall Recommendations .......................................................................................................................... 93
Data Collection and Reporting ............................................................................................................. 93
Lighting Retailer Allocation .................................................................................................................. 93

3
EISA ....................................................................................................................................................... 93
Drivers of Awareness ............................................................................................................................ 93
Application Processing ......................................................................................................................... 94
Cost‐Effectiveness ....................................................................................................................................... 95
Appendices .................................................................................................................................................. 99
Appendix A: Survey and Data Collection Forms ................................................................................... 99
Appendix B: Precision Calculations ...................................................................................................... 99
Appendix C: Program Incentives .......................................................................................................... 99
Appendix D: Stored‐to‐Installed CFL Bulbs Savings .............................................................................. 99
Appendix E: Hours‐of‐Use Methodology .............................................................................................. 99
Appendix F: Price Response Model ...................................................................................................... 99
Appendix G: Attic, Floor, and Wall Insulation Billing Analysis .............................................................. 99
Appendix H: Non‐Lighting Engineering Reviews .................................................................................. 99
Appendix I: Non‐Lighting NTG Evaluation Methodology ..................................................................... 99
Appendix J: Non‐Lighting Freeridership Responses ............................................................................. 99
Appendix K: Logic Model ...................................................................................................................... 99
Appendix L: Marketing Materials Review ............................................................................................. 99
Appendix M: Incentive Reward Application Benchmarking and Best Practices .................................. 99
Appendix N: Measure Group Cost‐Effectiveness ................................................................................. 99

4
Glossary of Terms
Analysis of Covariance (ANCOVA)
An ANCOVA model is an Analysis of Variance (ANOVA) model with a continuous variable added. An
ANCOVA model explains the variation in the independent variable, based on a series of characteristics
(expressed as binary variables equaling either zero or one).
Evaluated Gross Savings
Evaluated gross savings represent the total program savings, based on the validated savings and
installations, before adjusting for behavioral effects such as freeridership or spillover. They are most
often calculated for a given measure ‘i’ as:
∗
Evaluated Net Savings
Evaluated net savings are the program savings net of what would have occurred in the program’s
absence. These savings are the observed impacts attributable to the program. Net savings are calculated
as the product of evaluated gross savings and the net‐to‐gross (NTG) ratio:
∗
Freeridership
Freeriders in energy‐efficiency programs are participants who would have adopted the energy‐efficient
measure in the program’s absence. This is often expressed as the freeridership rate, or the proportion of
evaluated gross savings that can be classified as freeridership.
Gross Realization Rate
The ratio of evaluated gross savings and the savings reported (or claimed) by the program administrator.
In‐Service Rate (ISR)
The ISR (also called the installation rate) is the proportion of incented measures actually installed.
Net‐to‐Gross (NTG)
NTG is the ratio of net savings to evaluated gross savings. Analytically, NTG is defined as:
1
P‐Value
A p‐value indicates the probability that a statistical finding might be due to chance. A p‐value of less
than 0.10 indicates that, with 90% confidence, the finding was due to the intervention.

5
Spillover
Spillover is the adoption of an energy‐efficiency measure induced by the program’s presence, but not
directly funded by the program. As with freeridership, this is expressed as a fraction of evaluated gross
savings (or the spillover rate).
Trade Ally
For the purposes of the process evaluation, trade allies are respondents of the participant
retailer/contractor survey. Trade allies include retailers and contractors who supply and install
discounted compact florescent lamps (CFLs), appliances, HVAC, or insulation through the program.
T‐Test
In regression analysis, a t‐test is applied to determine whether the estimated coefficient differs
significantly from zero. A t‐test with a p‐value less than 0.10 indicates that there is a 90% probability that
the estimated coefficient is different from zero.

6
Executive Summary
Rocky Mountain Power first offered the Home Energy Savings (HES) Program in Wyoming in 2009. The
HES Program provides residential customers with incentives to facilitate purchases of energy‐efficient
products and services through upstream (manufacturer) and downstream (customer) incentive
mechanisms. During the 2011 and 2012 program years, Rocky Mountain Power reported gross
electricity savings of 11,033,525 kWh.
In 2011‐2012, the HES Program included energy‐efficiency measures in six categories:
1. Appliances: Rocky Mountain Power provided customer incentives for clothes washers,
dishwashers, refrigerators, freezers, room air conditioners, ceiling fans, light fixtures,
evaporative coolers, high‐efficiency electric storage water heaters, and heat pump water
heaters.
2. Home Electronics: Rocky Mountain Power provided customer incentives for ENERGY STAR®
home electronics such as computer monitors, desktop computers and flat screen televisions
(TVs).
3. Heating, ventilation, and air conditioning (HVAC): Rocky Mountain Power provided customer
incentives for high‐efficiency heating and cooling equipment, services and conversion, as well as
for duct sealing and duct insulation.
4. Lighting: Rocky Mountain Power provided upstream incentives for manufacturers to reduce
retail prices on compact florescent lamps (CFLs).
5. New Homes: Rocky Mountain Power provided new home customer incentives, including
incentives for energy‐efficient dishwashers, refrigerators, evaporative coolers, insulation,
windows, and ductless heat pumps, as well as a builder option package (BOP) with heat pump
installation.
6. Weatherization: Rocky Mountain Power provided customer incentives for attic, wall, and floor
insulation, as well as for high‐efficiency windows.
Rocky Mountain Power contracted with Cadmus to conduct impact and process evaluations of the
Wyoming HES Program for program years 2011 and 2012. For the impact evaluation, Cadmus assessed
energy impacts and program cost‐effectiveness. For the process evaluation, Cadmus assessed program
delivery and efficacy, bottlenecks, barriers, best practices, and opportunities for improvements. This
document presents these evaluations’ results.
Key Findings Cadmus’ evaluation focused on the highest‐saving measures, which collectively accounted for over 99%
of the HES Program savings. Cadmus collected primary data on the top savings measures, performed a
billing analysis for insulation measures, and completed engineering reviews using secondary data for the
7
remaining measures. CFLs accounted for almost 89% of total reported HES Program savings across
program years 2011 and 2012, and therefore were a primary focus of the evaluation.
Key Impact Evaluation Findings
Key impact evaluation findings include the following (summarized in Table 1):
Appliances: Overall, the appliance measure group realized 97% of reported gross savings.
Incented appliances experienced a 100% installation rate. Evaluated gross savings realization
rates ranged from 25% (for ceiling fans) to 161% (for refrigerators). Appliance measures had a
savings‐weighted net‐to‐gross (NTG) of 60%.
Home Electronics: Overall, the home electronics measure group realized 73% of reported gross
savings. Incented home electronics experienced a 100% installation rate. Evaluated flat screen
television savings drive the overall measure group realization rate (televisions had a 73%
realization rate). Home electronic measures had a savings‐weighted net‐to‐gross (NTG) of 57%.
HVAC: Overall, the HVAC measure group realized 124% of reported gross savings. Incented
HVAC equipment experienced a 100% installation rate. Evaluated gross savings realization rates
ranged from 100% to 134% (ductless heat pump). HVAC measures had a savings weighted NTG
of 60%.
Lighting: The HES lighting component experienced a gross realization rate of 78% and a NTG of
65%. Incented CFLs had a 72% installation rate, based on installation, storage, and removal
practices reported through surveys..
New Homes: All completed 2011‐2012 new home measures were insulation projects. Therefore,
Cadmus used the results from the insulation billing analysis to verify new homes savings. The
evaluated net savings realization rate was 112% for all evaluated weatherization measures.
Weatherization: The evaluated net savings realization rate was 112% for all weatherization
measures. Cadmus’ billing analysis included participant and nonparticipant groups and directly
produced a net savings estimate.

8
Table 1. 2011 and 2012 HES Program Savings*
Measure
Group
Evaluated
Units**
Reported
Gross
Savings
(kWh)
Evaluated
Gross
Savings
(kWh)
Gross
Realization
Rate
Evaluated
Net
Savings
(kWh)
NTG
Precision
at 90%
Confidence
(+/‐)***
Appliances 4,668 600,973 584,807 97% 351,524 60% 22%
Home
Electronics 1,666 297,350 217,338 73% 124,551 57% 35%
HVAC 29 21,290 26,463 124% 15,752 60% 26%
Lighting 301,681 9,806,161 7,653,224 78% 4,991,010 65% 15%
New Homes 11,803 3,585 4,023 112% 4,023 N/A 21%
Weatherization 818,192 304,165 340,059 112% 340,059 N/A+ 40%
Total 1,138,039 11,033,525 8,825,915 80% 5,826,920 66% 13%
* Throughout the report, totals in tables may not add up correctly due to rounding.
** Cadmus counted each square foot of incented insulation or windows as one unit.
*** Appendix B describes the methodology for calculating precision.
+ Cadmus estimated weatherization measure savings using a billing analysis approach. It is not feasible to parse
out gross savings using this method and evaluated savings are net. No NTG adjustment was required.
Table 2 and Table 3 show the breakout of impact evaluation findings by program year.
Table 2. 2011 HES Program Savings
Measure Group Evaluated
Units
Reported Gross
Savings (kWh)
Evaluated Gross
Savings (kWh)
Gross
Realization
Rate
Evaluated Net
Savings (kWh)
Appliances 2,705 405,154 364,273 90% 218,962
Home Electronics 146 25,867 18,926 73% 10,846
HVAC 10 1,586 1,586 100% 944
Lighting 134,003 4,564,390 3,559,445 78% 2,321,273
New Homes 11,803 3,585 4,023 112% 4,023
Weatherization 583,930 86,187 96,074 111% 96,074
Total 732,597 5,086,768 4,044,327 80% 2,652,123

9
Table 3. 2012 HES Program Savings
Measure Group Evaluated
Units
Reported Gross
Savings (kWh)
Evaluated Gross
Savings (kWh)
Gross
Realization
Rate
Evaluated Net
Savings (kWh)
Appliances 1,963 195,819 220,534 113% 132,562
Home Electronics 1,520 271,483 198,412 73% 113,705
HVAC 19 19,704 24,877 126% 14,808
Lighting 167,678 5,241,772 4,093,780 78% 2,669,737
New Homes 0 0 0 N/A 0
Weatherization 234,262 217,978 243,985 112% 243,985
Total 405,442 5,946,755 4,781,588 80% 3,174,797
Key Process Evaluation Findings
Key process evaluation findings include the following:
Satisfaction with the HES Program remained very high: surveyed customers reported high
satisfaction levels regarding purchased measures and overall program experience.
Retailers were a common driver of awareness for contractor‐installed measures (14%), though
the main sources of awareness for contractor‐installed measures were Rocky Mountain Power
representatives (16%) and word‐of‐mouth (15%).
Although the EISA standards took effect beginning in January 2012, with the phase out of 100‐
watt incandescent bulbs, more than one‐third (39%) of the surveyed Wyoming lighting
customers who attempted to purchase 100‐watt incandescent bulbs were able to do so during
2012.
Cost‐Effectiveness Results
As shown in Table 4 the program was cost‐effective across the 2011‐2012 evaluation periods from all
test perspectives except for the Ratepayer Impact (RIM) test and the Total Resource Cost (TRC) test. The
PacifiCorp Total Resource Cost (PTRC) yielded a benefit/cost ratio of 1.08 and the Total Resource Cost
(TRC) test yielded a benefit/cost ratio of 0.98.
The RIM test measures the impact of programs on customer rates. Many programs do not pass the RIM
test because a utility’s avoided energy savings are usually less than the lost revenues and operating
costs of the program. A program passes the RIM test only if rates will go down as a result of the
program, and this happens infrequently when the program targets the highest marginal cost hours
(when marginal costs are greater than rates).

10
Table 4. 2011–2012 Evaluated Net HES Program Cost‐Effectiveness Summary
Cost‐Effectiveness Test Levelized
$/kWh Costs Benefits Net Benefits
Benefit/Cost
Ratio
Total Resource Cost Test (PTRC) +
Conservation Adder $0.082 $2,609,548 $2,813,891 $204,343 1.08
Total Resource Cost Test (TRC) No
Adder $0.082 $2,609,548 $2,558,083 ($51,465) 0.98
Utility Cost Test (UCT) $0.056 $1,795,024 $2,558,083 $763,059 1.43
Rate Impact Test (RIM) $4,719,684 $2,558,083 ($2,161,601) 0.54
Participant Cost Test (PCT) $2,399,496 $5,184,608 $2,785,112 2.16
Lifecycle Revenue Impacts ($/kWh) $0.000016837
Discounted Participant Payback
(years) 2.51
Table 5 and Table 6 show HES Program cost‐effectiveness for the 2011 and 2012 program years,
respectively, based on evaluated net savings. The 2012 program year was more cost‐effective from all
test perspectives than the 2011 program year.
This increased cost‐effectiveness results can attributed to a 20% net increase in energy savings from
2011 to 2012, while program costs decreased 22%. The lighting program had the largest impact on this
change in savings and costs. Lighting accounted for 72% of the savings increase in 2012 and 46% of the
decrease in costs. Lighting’s levelized cost per kWh decreased 27% (from $0.069/kWh to $0.051/kWh). A
decrease in levelized costs means that Rocky Mountain Power spent less per kilowatt hour of energy
saved.
Table 5. 2011 Evaluated Net HES Program Cost‐Effectiveness Summary
Cost‐Effectiveness Test Levelized
$/kWh Costs Benefits Net Benefits
Benefit/Cost
Ratio
Total Resource Cost Test (PTRC) +
Conservation Adder $0.102 $1,504,131 $1,251,356 ($252,775) 0.83
Total Resource Cost Test (TRC) No
Adder $0.102 $1,504,131 $1,137,596 ($366,535) 0.76
Utility Cost Test (UCT) $0.071 $1,039,000 $1,137,596 $98,597 1.09
Rate Impact Test (RIM) $2,272,420 $1,137,596 ($1,134,824) 0.50
Participant Cost Test (PCT) $1,264,976 $2,337,483 $1,072,507 1.85
Lifecycle Revenue Impacts ($/kWh) $0.000008839
Discounted Participant Payback
(years) 2.32

11
Table 6. 2012 Evaluated Net HES Program Cost‐Effectiveness Summary
Cost‐Effectiveness Test Levelized
$/kWh Costs Benefits Net Benefits
Benefit/Cost
Ratio
Total Resource Cost Test (PTRC) +
Conservation Adder $0.064 $1,184,676 $1,674,569 $489,894 1.41
Total Resource Cost Test (TRC) No
Adder $0.064 $1,184,676 $1,522,336 $337,660 1.29
Utility Cost Test (UCT) $0.044 $810,231 $1,481,785 $671,554 1.83
Rate Impact Test (RIM) $2,622,732 $1,522,336 ($1,100,397) 0.58
Participant Cost Test (PCT) $1,215,865 $3,051,264 $1,835,399 2.51
Lifecycle Revenue Impacts ($/kWh) $0.000008571
Discounted Participant Payback
(years) 1.64
Summary Cadmus drew the following conclusions from impact and process evaluation interviews, surveys, and
other analyses. A more complete discussion of findings can be found in the Overall Conclusions section
of this report. Condensed findings include the following:
The HES Program experienced freeridership ranging from 34% (standard CFLs) to 53%
(dishwashers). Clothes washers, refrigerators, and dishwashers received a freeridership score in
the high 40% to low 50% range.
The non‐lighting database contained no duplicates; however, measure name and classification
differences in the program administrator database were difficult to reconcile with the filed
annual reports.
Overall, Cadmus supports the program administrator’s methodology for calculating and
minimizing CFL leakage. The process is innovative and considers the relevant factors.
Although the EISA standards took effect in January 2012 with the phase out of 100‐watt
incandescent bulbs, very few telephone surveyed participants recognized the effects of the
legislation when trying to purchase these bulbs. While 100‐watt equivalent bulbs do not make
up a large proportion of HES savings, this information will be particularly useful for when 60‐
and 40‐watt bulbs are regulated under EISA starting in 2014.
While CFLs remain the preferred energy‐efficient lighting option among customers, preference
for LEDs is increasing.
Although the program administrator increased efforts to support program trade allies, the
number of trade allies participating in the HES Program grew in 2012 and there was not enough
field staff to provide the preferred level of contact. Even so, trade allies expressed satisfaction
with the level of support they receive from program staff, and found that their affiliation with
the HES Program has been effective in generating new business for their company.

12
Retailers are driving a significant portion of lighting and non‐lighting program participation. In
addition to driving the program’s lighting participation, retailers are a driver of non‐lighting
participation in both the retailer and contractor‐installed measure categories.
The HES Program experienced instances of rejected customer incentive applications due to
missing information. Customer‐submitted incentive applications with flawed information delay
the incentive processing, requires follow‐up with the customer, and increases program costs.
This was identified as a barrier to program implementation by the program administrator.
Due to Rocky Mountain Power’s efforts to improve its online presence, traffic to the HES
Program website has greatly increased since the 2009‐2010 evaluation. Cadmus reviewed the
HES website and online engagement strategy, and found that the program administrator largely
followed common online energy‐efficiency program marketing best practices.
Program satisfaction continues to run high, with over 90% of customers reporting being satisfied
with various program components.
Recommendations Based on the above conclusions, Cadmus has the following recommendations to improve the program:
Standardize the measure naming conventions across years and states to improve the ability to
replicate and compare program data.
To further enhance the program administrator’s methodology for calculating and minimizing CFL
leakage, review the confidence surrounding geocoded addresses to ensure that store locations
are accurately mapped. Also, consider using Rocky Mountain Power’s actual service area
territory boundary to refine the model (as opposed to identifying the service area territory
boundary by ZIP codes).
Review options for how best to understand and track the impact of EISA for 60‐ and 40‐ watt
bulbs in 2014. Some states have allowed utilities to stagger changing the baseline for bulbs
impacted by EISA. Specific knowledge of bulb stocking practices (or sales) in Rocky Mountain
service territory could help make a case to stagger the 2013 and 2014 baselines impacted by
EISA.
In order to reduce the number of rejected applications, incorporate as many of the best
practices stated in Appendix M into the HES incentive forms as deemed cost‐effective. Cadmus
suggests prioritizing the following:
o Keep the incentive form length to a minimum.
o Encourage trade allies to fill out the paperwork through training or bonuses to decrease
the number of rejected applications.
o Utilize a paperless application process for all incentive applications.

13
Introduction
Program Description In 2009, Rocky Mountain Power launched the HES Program in Wyoming. Portland Energy Conservation,
Inc. (PECI) implements the HES Program, providing prescriptive incentives to residential customers who
purchase qualifying, high‐efficiency appliances, HVAC, and weatherization measures. The following
prescriptive incentives were offered during the evaluation period:
Appliances:
Ceiling fans
Clothes washers
Dishwashers
Electric water heaters
Evaporative cooler
Light fixtures
Freezers
Heat pump water heaters
Refrigerators
Room air conditioning units
Home Electronics:
Desktop computers
Flat screen TVs
Computer monitors
HVAC:
Central air conditioners
Central air conditioner proper sizing
Central air conditioner best practice installations
Duct sealing and insulation
Ductless heat pump
Heat pump upgrade
Heat pump conversion
Heat pump and central air conditioner tune‐ups
Weatherization:
Insulation (attic, floor, and wall)
Windows
14
Rocky Mountain Power also offered HES Program prescriptive incentives for stand‐alone measures in
new homes and for comprehensive measures in certified ENERGY STAR® new homes.
To encourage dealers to promote energy‐efficient equipment incentives and to properly size, install, and
maintain equipment, Rocky Mountain Power offered dealer incentives for qualifying central air
conditioning, duct sealing and insulation, evaporative coolers and heat pumps bought or installed
through the HES Program.
The HES Program included an upstream lighting component, in which incentives were applied to eligible
CFLs at the manufacturer level which provided discounted high‐efficiency lighting options.
Appendix C lists the HES Program measures and customer and dealer incentive amounts.
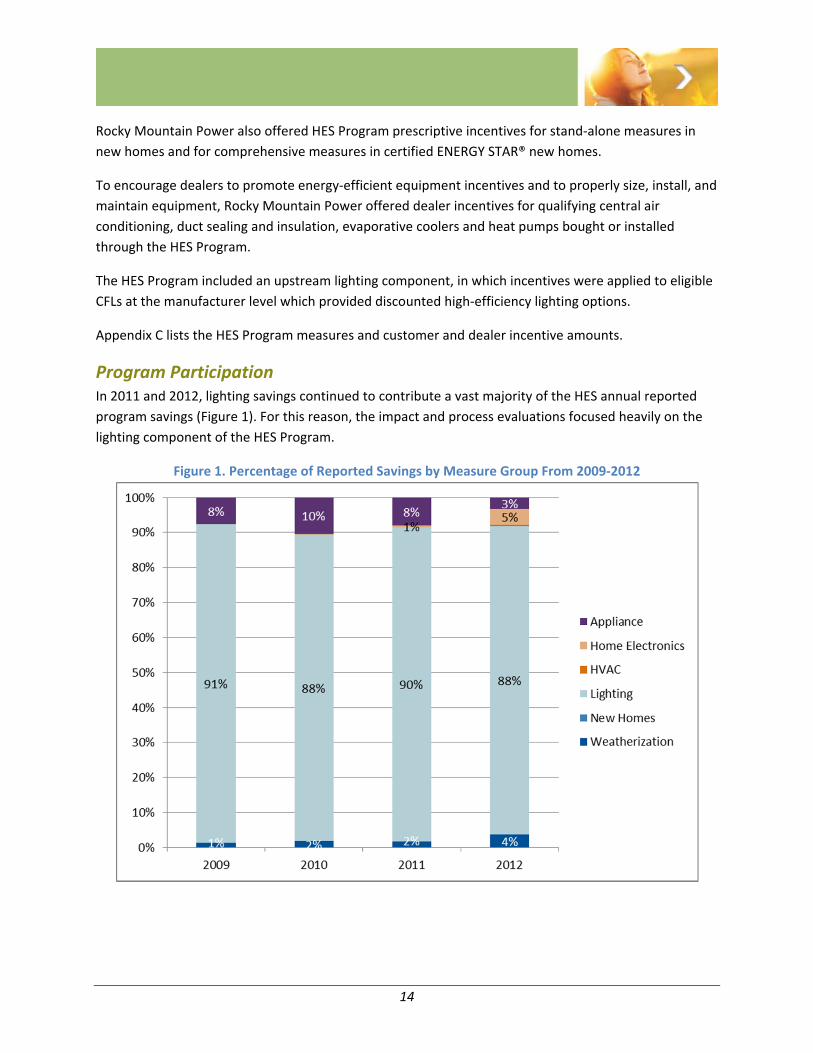
Program Participation In 2011 and 2012, lighting savings continued to contribute a vast majority of the HES annual reported
program savings (Figure 1). For this reason, the impact and process evaluations focused heavily on the
lighting component of the HES Program.
Figure 1. Percentage of Reported Savings by Measure Group From 2009‐2012

15
Between 2009 and 2012, lighting savings increased, while weatherization savings peaked in 2010 and
have decreased since then. Home electronics savings have been also increasing. Further detail regarding
specific changes in savings can be found in the report below.
Data Collection and Evaluation Activities Table 7 summarizes the evaluation activities and goals that supported the impact and process
evaluations.
Table 7. Summary of Evaluation Approach
Action Impact
Process Gross Savings NTG
Stakeholder Interviews (management staff and program
administrator) X
Participant Non‐Lighting Surveys (appliances, HVAC, and
weatherization) X X X
Lighting Customer Surveys X X
Participating Contractor Interviews X
Attic, Wall, and Floor Insulation Billing Analysis X X
Insulation Participant Verification Site Visits X
Engineering Reviews X
Price Response Modeling X
Marketing Review X
Incentive Application Benchmarking and Best Practices Review X
Appendix A provides the survey and data collection instruments.
Sample Design and Data Collection Methods
Cadmus developed samples, seeking to achieve precision of ±10% with 90% statistical confidence for
each surveyed population. Cadmus determined the sample sizes by assuming a coefficient of variation
(CV) of 0.5.1 For small population sizes, Cadmus applied a finite population adjustment factor which
reduced the necessary complete target to achieve precision of ±10% with 90% statistical confidence.
Table 8 shows the final sample disposition for various data collection activities. For nearly all data
collection (except for the administrator and management staff interviews), Cadmus drew samples using
either simple or stratified random sampling.2
1 The CV is the ratio of standard deviation (a measure of the dispersion of data points in a data series) to the
series mean. 2 Simple random samples are drawn from the entire population, whereas stratified random samples are drawn
randomly from subpopulations (strata), and are then weighted to extrapolate to the population.

16
Table 8. Sample Disposition for Various HES Program Data Collection Activities
Data Collection Activity Population
Sampling
Frame
Target
Completes
Achieved
Completes
Program Staff Interview N/A N/A 1 1
Program Administrator Interviews N/A N/A 2 2
Non‐Lighting Participant Telephone Surveys 5,807 5,254 342 343
Attic Insulation Participant Verification Site
Visits 570 570
10 10
Participant Contractor Surveys 49 34 20 7*
Customer Lighting Surveys 111,609** 3,939 250 250
* Due to the small population of participants, Cadmus was unable to attain the target number of completed surveys. All efforts
were made to attain the target without placing undue burden on customers: up to five attempts were made to reach each
participant, and (as described below) surveys were conducted in four rounds to capture feedback close to the time of
participation.
** Lighting population is derived from the residential population for Wyoming as of the end of 2012. Customer data provided
by Rocky Mountain Power.
Non‐Lighting Participant Telephone Surveys
Cadmus surveyed 343 non‐lighting participants over the course of two years, gathering measure‐level
information on installation, freeridership, spillover, program awareness and satisfaction, and
demographics.
Given the time delay between participation and evaluation, Cadmus conducted four waves of biannual
surveys of non‐lighting participants starting in mid‐2011 and continuing until mid‐2013. The goal was to
reach participants within a few months of participation.
Cadmus used the measure mix from the 2009‐2010 program years to estimate which measures would
likely have the highest impacts in 2011 and 2012. During the last wave of surveys in 2012, Cadmus
adjusted the survey targets based on the savings achieved for each measure from the 2011 and 2012
Rocky Mountain Power Annual Reports, which resulted in five measures being removed from the target
list (floor insulation, freezers, windows, light fixtures, and electric water heaters). These measures were
removed from the targeted measure list because they contributed fewer savings to the program than
expected.
Table 9 provides the population of non‐lighting participants, final targets, and the achieved number of
surveys.

17
Table 9. Non‐Lighting Participant Survey Sample
Measure Population Targeted Achieved
Clothes Washer 1,300 66 66
Refrigerator 1,164 64 64
Dishwasher 860 63 63
Attic Insulation 570 61 61
Flat Panel TV 1,593 65 65
Evaporative Cooler 34 23 8*
Floor Insulation 2 0 1
Freezer 99 0 4
Windows 42 0 6
Light Fixtures 64 0 4
Electric Water Heater 79 0 1
Total 5,807 342 343
* Due to the small population of participants, Cadmus was unable to attain the target number of completed
surveys. All efforts were made to attain the target without placing undue burden on customers: up to five
attempts were made to reach each participant, and (as described below) surveys were conducted in four rounds to
capture feedback close to the time of participation.
Cadmus met the survey targets for five of the six targeted measures (and achieved some additional
completed surveys beyond the targets).
Cadmus weighted the results to control for sampling bias between the survey efforts. Please see the
Appliances, Home Electronics, and HVAC Net Savings Approach section for details about the measure‐
level weights.
Attic Insulation Participants Verification Site Visits
For the 2011‐2012 evaluation, Cadmus performed 10 insulation site visits to assess the quality and
quantity of Rocky Mountain Power’s incented measures. Because Cadmus did not find evidence of over‐
or under‐reporting of insulation square footage in the 2009‐2010 evaluation, Cadmus used a smaller
sample for the 2011‐2012 evaluation. Cadmus designed the sample to produce estimates with 80%
confidence and ±20% precision.
Contractor Surveys
Cadmus identified all participating contractors in the non‐lighting database and stratified them by
specialty type: insulation, windows, appliances (including home electronics), or HVAC. Cadmus
developed survey targets based on the total savings each contractor type contributed to the program.
Table 10 shows the total number of contacts, the survey targets, and the completed surveys by
contractor type.

18
Table 10. Participating Contractor Surveys Distribution
Contractor Type Contacts Targets Completes
Insulation 23 8 3
Windows 23 8 2
Appliances* 5 3 2
HVAC 1 1 0
Total 49** 20 7
* As most appliances are sold through retailers instead of contractors, Cadmus limited the sample to only
contractors who sold electric water heaters.
** Contractors sometimes sold multiple measures, so the total list of contacts is less than the sum of the contacts
listed by measure.
Due to a small number of participating trade allies, Cadmus did not achieve the targeted number of
surveys. However, multiple efforts were made to attain the target without placing undue burden on
participating contractors, as up to five attempts were made to reach each participant.
Lighting Surveys
Cadmus drew the lighting survey sample from a random list of 3,939 Wyoming Rocky Mountain Power
residential customers, provided by Rocky Mountain Power. Cadmus screened respondents to identify
recent3 CFL purchasers for the survey and achieved 250 completed responses.
3 Cadmus screened the respondents and only conducted surveys for customers who had purchased CFLs during the
program years 2011 and 2012.

19
Impact Evaluation
This chapter provides impact evaluation findings for the HES Program, based on Cadmus’ data analysis
using the following methods:
Participant surveys,
Billing analysis,
Engineering reviews,
Site visits, and
Secondary research.
As noted, numerous products and measures are available through the HES Program, each of which
required a different evaluation method. To address the complexities and details of each individual
measure group, the impact findings are organized into two sections:
1. Lighting: CFLs
2. Non‐Lighting: appliances, home electronics, HVAC, weatherization and new homes
Methodology This report presents two saving values: evaluated gross savings and evaluated net savings. To determine
evaluated net savings, Cadmus applied the four steps shown in Table 11. Reported gross savings are the
electricity savings (kWh) reported to Cadmus by Rocky Mountain Power.
Table 11. Impact Steps to Determine Evaluated Net Savings
Savings Estimate Step Action
Evaluated Gross Savings
1 Validate accuracy of data in participant database
2 Adjust gross savings with actual installation rate
3 Perform measurement (i.e., billing analysis) to validate saving
calculations
Evaluated Net Savings 4 Apply NTG adjustments
Step one (verify participant database) included a review of the program tracking database to ensure that
participants and reported savings matched 2011 and 2012 annual reports.
Step two (adjust gross savings with the actual installation rate) determined the number of program
measures installed and remaining installed. Cadmus determined this value through telephone surveys.
Step three (perform measurement) included a review of measure saving assumptions, equations, and
inputs. This included a billing analysis of weatherization measures.
Together, the first three steps determined evaluated gross savings. The fourth step (applying net
adjustments) determined evaluated net savings. Cadmus calculated the net saving adjustments with
results from customer self‐reports and price response modeling.

20
Tracking Database Review Cadmus checked the program administrator’s lighting and non‐lighting HES participant databases for
duplicate records. This review also included ensuring that participants were binned in the correct
efficiency tier or category, if applicable.
Lighting
Cadmus reviewed the program administrator’s tracking of 2011 and 2012 upstream lighting measures.
The database collects meaningful information that tracks lighting at a per‐bulb level, including helpful
information such as retailer, electric savings, purchased dates, and stock keeping units (SKUs).4 Cadmus
found no discrepancies in total reported quantities and total savings. Cadmus identified 607 bulbs (0.2%
of total bulb sales) with incorrect reported baseline wattages. These bulbs had baselines that had not
been adjusted to comply with EISA 2007 legislation (specifically, these are bulbs categorized as daylight
and dimmable bulbs with 100 watt equivalence and sold in 2012).5
Non‐Lighting
Cadmus also reviewed the program administrator’s tracking of 2011 and 2012 non‐lighting measures.
Again, the database collects meaningful data that tracks helpful measure‐level information, such as
efficiency standards, quantities of units, purchase dates, and incentive amounts.
Cadmus found that the total quantities and savings matched the 2011 and 2012 annual reports. Slight
measure name differences and classifications between the database and annual report caused some
confusion in comparing reported and evaluated units and savings. This uncertainty was exacerbated for
measures that were broken out into categories, such as tiers and heating types in 2011, as the program
administrator’s database did not designate these categories in the measure names or in other fields.
As reflected in Table 12, clothes washers were broken out by tier (tier one and tier two) in the 2011
annual report; however, the database does not break out these categories. Therefore, Cadmus used the
category definitions that existed during the 2011‐2012 program years to allocate participants to the
categories from the annual report. While Cadmus was not able to replicate the categories exactly, our
reallocation does not affect the overall savings, as Table 12 shows that the adjustments cancel each
other out. The reason that these adjustments cancel each other out is because the unit energy savings
(UES) values were not changed, but instead the measures were just regrouped.
4 The SKU number represents the unique make and model indicator for a specific retailer. 5 The list of general service incandescent lamps on page 3 of the following document are used to determine
which baseline bulbs are impacted by EISA: http://www1.eere.energy.gov/buildings/appliance_standards/residential/pdfs/general_service_incandescent_factsheet.pdf

21
Table 12. Measure‐Level Tracking Database Differences, 2011
Measure Category* Reported Units Database Units Difference
(Units)
Difference
(kWh)
Clothes Washer Tier One (1.72‐1.99 MEF) 65 38 27 3,630
Tier Two (2.0+ MEF) 1,250 1,277 (27) (3,630)
Total 1,315 1,315 0 0
* As the tiers changed slightly throughout the program period, Cadmus identified the category reflected in the
table in order to allocate participants.
22
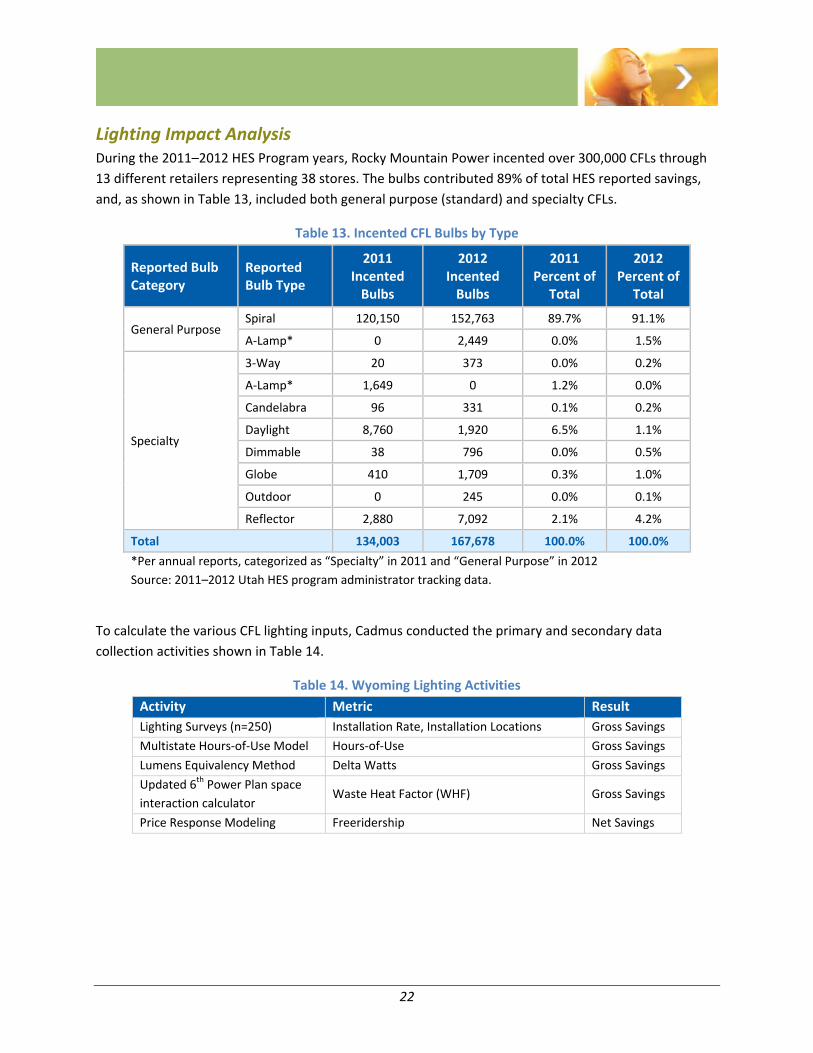
Lighting Impact Analysis During the 2011–2012 HES Program years, Rocky Mountain Power incented over 300,000 CFLs through
13 different retailers representing 38 stores. The bulbs contributed 89% of total HES reported savings,
and, as shown in Table 13, included both general purpose (standard) and specialty CFLs.
Table 13. Incented CFL Bulbs by Type
Reported Bulb Category
Reported Bulb Type
2011 Incented Bulbs
2012 Incented Bulbs
2011 Percent of
Total
2012 Percent of
Total
General Purpose Spiral 120,150 152,763 89.7% 91.1%
A‐Lamp* 0 2,449 0.0% 1.5%
Specialty
3‐Way 20 373 0.0% 0.2%
A‐Lamp* 1,649 0 1.2% 0.0%
Candelabra 96 331 0.1% 0.2%
Daylight 8,760 1,920 6.5% 1.1%
Dimmable 38 796 0.0% 0.5%
Globe 410 1,709 0.3% 1.0%
Outdoor 0 245 0.0% 0.1%
Reflector 2,880 7,092 2.1% 4.2%
Total 134,003 167,678 100.0% 100.0%
*Per annual reports, categorized as “Specialty” in 2011 and “General Purpose” in 2012
Source: 2011–2012 Utah HES program administrator tracking data.
To calculate the various CFL lighting inputs, Cadmus conducted the primary and secondary data
collection activities shown in Table 14.
Table 14. Wyoming Lighting Activities
Activity Metric Result
Lighting Surveys (n=250) Installation Rate, Installation Locations Gross Savings
Multistate Hours‐of‐Use Model Hours‐of‐Use Gross Savings
Lumens Equivalency Method Delta Watts Gross Savings
Updated 6th Power Plan space
interaction calculator Waste Heat Factor (WHF) Gross Savings
Price Response Modeling Freeridership Net Savings
23
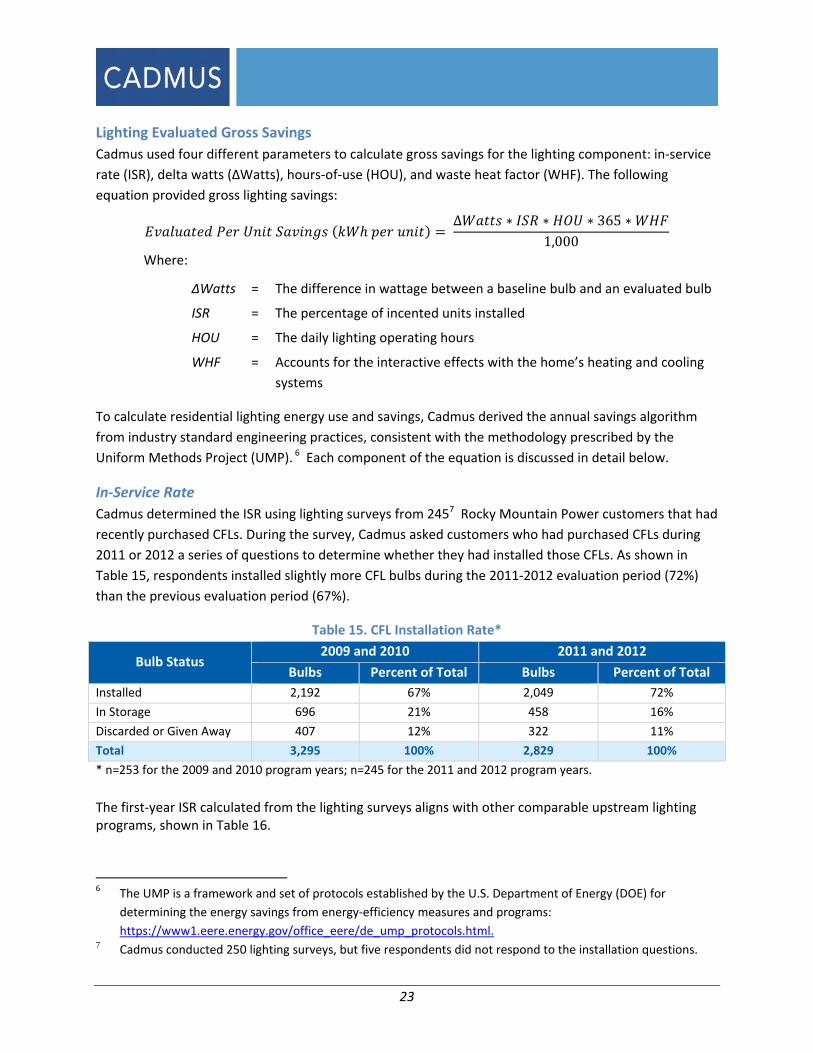
Lighting Evaluated Gross Savings
Cadmus used four different parameters to calculate gross savings for the lighting component: in‐service
rate (ISR), delta watts (ΔWatts), hours‐of‐use (HOU), and waste heat factor (WHF). The following
equation provided gross lighting savings:
∆ ∗ ∗ ∗ 365 ∗
1,000
Where:
ΔWatts = The difference in wattage between a baseline bulb and an evaluated bulb
ISR = The percentage of incented units installed
HOU = The daily lighting operating hours
WHF = Accounts for the interactive effects with the home’s heating and cooling
systems
To calculate residential lighting energy use and savings, Cadmus derived the annual savings algorithm
from industry standard engineering practices, consistent with the methodology prescribed by the
Uniform Methods Project (UMP). 6 Each component of the equation is discussed in detail below.
In‐Service Rate
Cadmus determined the ISR using lighting surveys from 2457 Rocky Mountain Power customers that had
recently purchased CFLs. During the survey, Cadmus asked customers who had purchased CFLs during
2011 or 2012 a series of questions to determine whether they had installed those CFLs. As shown in
Table 15, respondents installed slightly more CFL bulbs during the 2011‐2012 evaluation period (72%)
than the previous evaluation period (67%).
Table 15. CFL Installation Rate*
Bulb Status 2009 and 2010 2011 and 2012
Bulbs Percent of Total Bulbs Percent of Total
Installed 2,192 67% 2,049 72%
In Storage 696 21% 458 16%
Discarded or Given Away 407 12% 322 11%
Total 3,295 100% 2,829 100%
* n=253 for the 2009 and 2010 program years; n=245 for the 2011 and 2012 program years.
The first‐year ISR calculated from the lighting surveys aligns with other comparable upstream lighting programs, shown in Table 16.
6 The UMP is a framework and set of protocols established by the U.S. Department of Energy (DOE) for
determining the energy savings from energy‐efficiency measures and programs:
https://www1.eere.energy.gov/office_eere/de_ump_protocols.html. 7 Cadmus conducted 250 lighting surveys, but five respondents did not respond to the installation questions.

24
Table 16. Comparison of Evaluated ISR Estimates
Source Data Collection Method Reported Year ISR
West Coast Utility Self‐reporting: 3,979 CFL User Survey 2010 67%
Rocky Mountain Power Wyoming 2009‐2010 HES Evaluation
Self‐reporting: 254 in‐territory lighting surveys
2011 67%
Midwest Utility Self‐reporting: 301 customer surveys 2012 68%
Rocky Mountain Power Utah 2009‐2010 HES Evaluation
Self‐reporting: 250 in‐territory lighting surveys
2012 69%
Pacific Power Washington 2009‐2010 HES Evaluation
Self‐reporting: 253 in‐territory lighting surveys
2012 69%
Rocky Mountain Power Wyoming 2011‐2012 HES Evaluation
Self‐reporting: 245 in‐territory lighting surveys
2012 72%
Northeast Utility Self‐Reporting: 200 telephone surveys 2012 73%
Rocky Mountain Power Idaho 2009‐2010 HES Evaluation
Self‐reporting: 250 in‐territory lighting surveys
2012 75%
This evaluation subtracted stored bulbs in the ISR calculation, as these bulbs were not installed during
the 2011–2012 program period and, as such, did not contribute to first‐year program savings. However,
Cadmus calculated the savings impacts of stored bulbs moving to sockets for the 2009‐2010 and 2011‐
2012 program periods. These savings are not included in the program‐evaluated savings for either
program period, and this analysis is for informational purposes only. Please see Appendix D for the
savings generated by bulbs moving from storage to sockets.
Delta Watts
Cadmus used the lumens equivalence method to determine delta watts consistent with the UMP
methodology.
Delta watts represent the wattage difference between a baseline bulb and an equivalent CFL. Cadmus
determined baseline wattages using sales data. Rocky Mountain Power provided Cadmus with 2011–
2012 CFL sales data by SKU number and bulb type for the 301,681 incented CFLs sold through the
program.
Cadmus estimated the baseline wattage for each CFL bulb sold by mapping each bulb to the ENERGY
STAR® bulb database to determine the bulb’s lumens output. Table 17 shows the baseline wattage
grouped by lumen bin for general service bulbs (based on EISA). Table 19 compares these baseline
wattages between evaluated and reported values. Due to EISA legislation, the baseline wattage changed
from 100 watts in 2011 to 72 watts in 2012 for CFLs that output between 1,490 and 2,600 lumens.

25
Table 17. Lumen Bins for Standard Lamps by Baseline Wattage and Estimated CFL Wattage
Lumen Bin Baseline Wattage – Lamp Sold
Before January 1, 2012
Baseline Wattage – Lamp Sold
on or After January 1, 2012
Estimated CFL
Wattage
0‐309 25 25 1‐5
310–749 40 40 6–11
750–1,049 60 60 12–16
1,050–1,489 75 75 17–22
1,490–2,600 100 72 23–38
To determine the estimated CFL wattage bins for each associated lumen bin shown in Table 17, Cadmus
analyzed the list of eligible ENERGY STAR® CFL products (additional detail is included in the ENERGY
STAR® Lamp Analysis section). Because reflector lamps output light differently than standard, general
purpose lamps, the reflector type lamps sold through the HES Program do not follow the lumen bin
classifications described in Table 17. A separate set of lumen bins was necessary to determine the
baseline wattage for reflectors. Reflectors can be described as flood lights that provide a direct path of
light. Cadmus developed the reflector lumen ranges in Table 18 based on U.S. DOE incandescent
efficiency standards and market research of commercially available reflectors.8
Table 18. Reflector Baseline Wattage by Lumens Bin
Lumen Bin Baseline Reflector Wattage
0‐419 30
420‐560 45
561‐837 65
838‐1,203 75
1,204‐1,681 90
1,682‐2,339 120
2,340‐3,075 175
Table 19 represents all eligible 2011–2012 CFL products purchased through the HES Program and their
associated delta watts values. The program administrator provided the delta watts to Cadmus, who
verified their application in the program database.
In almost all cases the evaluated and database delta watts values agree for the general purpose bulbs.
The drop in delta watts between 2011 and 2012 for 23‐ and 26‐watt bulbs is due entirely to the impact
of EISA on 100‐watt equivalent lamps. The delta watts values for reflectors do not agree between the
8 Lumens efficacy standards are provided in the U.S. DOE Energy Efficiency and Renewable Energy data book,
section 7.6: Efficiency Standards for Lighting. It is available online:
http://buildingsdatabook.eere.energy.gov/TableView.aspx?table=7.6.2. These efficacy standards do not
provide discrete wattages for the incandescent bulb in each lumens bin, so Cadmus conducted market
research to determine the discrete wattage of the equivalent baseline bulb in each lumens bin.

26
database and evaluated values because the evaluation team used the method described above and the
database uses the general purpose lumens bins.

27
Table 19. 2011–2012 Database‐Reported and Evaluated Delta Watts
Eligible
2011–2012
Wattage*
2011 Database
Baseline
Wattage
2011 Evaluated
Baseline
Wattage
2012 Database
Baseline
Wattage
2012 Evaluated
Baseline
Wattage
Quantity
9 40 40 40 40 3,987
10 40 40 40 40 15,271
11 N/A N/A 40 40 272
13 60 60 60 60 147,749
14 60 60 60 60 37,732
15 N/A N/A 60 60 626
16 N/A N/A 60 60 390
18 75 75 75 75 748
19 85 75 75 75 3,798
20 75 75 75 75 15,865
23 100 100 72 72 17,191
26 100 100 72 72 31,733
S3 N/A N/A 20 25 9
S7 N/A N/A 40 40 103
S9 40 40 40 40 602
S10 N/A N/A 40 40 92
S11 40 40 50 40 1,478
S13 N/A N/A 50 60 136
S14 60 60 60 60 7,884
S15 60 60 60 40/60 2,458
S18 N/A N/A 75 75 21
S19 N/A N/A 75 75 21
S20 75 75 75 75 989
S23 N/A N/A 100 72 100
S25 78 100 100 100** 372
S26 100 100 100 72 803
S27 100 100 N/A N/A 1,034
R11 N/A N/A 50 65 148
R14 60 75 60 45/60/65/75 1,996
R15 60 65 60 65/75 6,591
R16 60 65 N/A N/A 774
R20 N/A N/A 75 90 52
R23 N/A N/A 100 75/90 110
R26 100 120 100 120 546
* Specialty and Reflector bulbs are denoted by an “S” and “R” respectively before the lamp wattage. In some
cases, there are different reflector baseline wattages from year to year due to reflector models with different
lumen outputs being sold each year.
**Baseline not adjusted because these bulbs are 3‐way bulbs and are exempt from EISA
Note: ”N/A” indicates that no bulbs of this specific wattage were sold during the given time period.

28
Some of the reflectors shown in Table 19 have multiple evaluated baseline wattage values because
different reflector models that share the same wattage can output a wide range of lumen levels. The
equivalent lumens methodology captures this variance and assigns a range of baseline wattage values
accordingly.
Cadmus used the approach outlined above to determine an equivalent baseline for each lumen bin of
each lamp; a method consistent with EISA.
Energy Independence and Security Act Impacts
The Energy Independence and Security Act (EISA)—an energy policy requiring greater efficiency for light
bulbs, with new standards phased in from 2012 through 20149—effectively phases out 100‐, 75‐, 60‐,
and 40‐watt incandescent light bulbs currently in the market. EISA standards will eventually require an
adjustment to the current lighting savings baseline used to measure energy savings in demand‐side
management (DSM) programs.
Effects of EISA on Bulb Availability
Over half of the 250 lighting customers surveyed were aware of the EISA legislation (51%, compared to
64% in 2009‐2010).10 Although the EISA standards took effect beginning in January 2012, with the phase
out of 100‐watt incandescent bulbs, more than one‐third (39%) of the lighting customers who
attempted to purchase 100‐watt incandescent bulbs were able to do so during 2012.
Results from two studies conducted in the Midwest indicated similar bulb availability.11 In these studies,
Cadmus and another consulting firm conducted telephone surveys with lighting retailers to determine
the effects of EISA on incandescent light bulb availability. The first study was conducted with 101
lighting retailers across Indiana. The second was conducted with 53 lighting retailers that participated in
a Midwest utility’s upstream lighting program. Nearly half of the retailers surveyed in both studies
reported having 100‐watt incandescent light bulbs in stock during the first two quarters of 2013 (Table
20).12
9 U.S. Environmental Protection Agency. Energy Independence and Security Act of 2007 (EISA). 2011. Available
online: http://www.energystar.gov/ia/products/lighting/cfls/downloads/EISA_Backgrounder_FINAL_ 4‐11_EPA.pdf
10 P‐value = 0.00; this difference is statistically significant (α=0.1). 11 Dayton Power and Light Company. “The Dayton Power and Light Company’s Combined Notice of Filing
Portfolio Status Report and Application to Adjust Baselines.” Case No. 13‐1140‐EL‐POR and Case No. 12‐2266‐EL‐WVR. May 15, 2013. http://dis.puc.state.oh.us/TiffToPDf/A1001001A13E15B61641D86507.pdf
12 Cadmus determined availability based on whether the retailers had at least 10 100‐watt incandescent bulbs in
stock at the time of the survey.

29
Table 20. Percent of Retailers with 100‐watt Incandescent Bulbs Available in 2013
Q1 2013 Q2 2013 Indiana statewide (n=101) 45% N/A
Midwest utility territory (n=53) 43% 43%
ENERGY STAR Lamp Analysis
The primary reason Cadmus analyzed the ENERGY STAR‐qualified lamps was to estimate the lumen
output of bulbs that could not be matched directly to the qualified list by SKU number. A secondary
reason was to develop the list of estimated CFL wattages associated with each lumen bin given in Table
17.
In order to determine a relationship between CFL wattage and lumen output, Cadmus used the ENERGY
STAR‐qualified CFL bulb product list that was updated on May 13, 2013.13 The database consists of
approximately 6,100 CFL products and their associated wattages and lumens. The lumen output for a
given CFL wattage varied significantly; for example, 314 CFL products that were rated for 20 watts had
lumen outputs ranging from 850 to 2,150. Cadmus addressed these variations by using the median
lumens instead of the mean, creating the relationship shown in Figure 2.
Figure 2. Median Lumens vs. CFL Wattage for ENERGY STAR‐Qualified CFLs
The calculated trend line in Figure 2 shows a strong linear relationship between CFL wattage and lumen
output. Cadmus used this linear relationship (given in the figure as: y = 68.7x ‐ 56.2) to determine the
lumen output for the 22.3% of CFL lamps that did not have a SKU number matching the ENERGY STAR‐
qualified lamp product list.
13 The most recent list of ENERGY STAR‐qualified bulbs can be downloaded from the ENERGY STAR webpage:
http://www.energystar.gov/productfinder/product/certified‐light‐bulbs/results.

30
Hours‐of‐Use
Cadmus calculated an average HOU for Wyoming of 2.18 using analysis of covariance (ANCOVA) model
coefficients, drawn from combined, multistate, multiyear data from five recent CFL HOU metering
studies. This model expresses average HOU as a function of room type, existing CFL saturation, and the
presence or absence of children in the home. Appendix E provides a more detailed explanation of the
impact methodology Cadmus used to estimate CFL HOU. The method and results of this approach are
consistent with those in the 2009‐2010 program year evaluation. A comparison of the HOU results
between evaluations is shown in Table 21.
Table 21. HOU by Evaluation Period
Evaluation Period Evaluated HOU
2009‐2010 2.25
2011‐2012 2.18
The lower HOU value of 2.18 in 2011‐2012 was driven by the change in existing CFL saturation, which
increased from 18% in 2009‐2010 to 30% in the current evaluation. Existing CFL saturation is negatively
associated with HOU.
Cadmus estimated the lighting distribution by room using response data from the participant telephone
surveys, as was shown in Table 22. To estimate CFL saturation, Cadmus used CFL saturations from the
2011 Residential Building Stock Assessment (RBSA).14 Since the RBSA does not provide a saturation value
specific to Wyoming, Cadmus used the average RBSA CFL saturation, consistent with Rocky Mountain
Power’s most recent potential study.15
Table 22. CFL Installation Locations*
Bulb Location Percent of Total
2009‐2010 2011‐2012
Living Space 30% 29%
Bedroom 26% 28%
Kitchen 13% 10%
Bathroom 14% 17%
Outdoor 3% 3%
Basement 5% 6%
Other 8% 8%
Total 100% 100%
* n=214 for the 2009 and 2010 program years; n=199 for the 2011 and 2012 program years.
14 Northwest Energy Efficiency Alliance. 2011 Residential Building Stock Assessment: Single‐Family Characteristics
and Energy Use. September 18, 2012. http://neea.org/docs/reports/residential‐building‐stock‐assessment‐single‐
family‐characteristics‐and‐energy‐use.pdf?sfvrsn=8 15http://www.pacificorp.com/content/dam/pacificorp/doc/Energy_Sources/Demand_Side_Management/DSM_Po
tential_Study/PacifiCorp_DSMPotential_Vol‐II_Mar2013.pdf

31
Waste Heat Factor
The WHF is an adjustment representing the interactive effects of lighting measures on heating and
cooling equipment operation. By installing more efficient lighting, less waste heat is produced, causing
heating equipment to operate more and cooling equipment to operate less.
Cadmus determined the WHF using the space interaction calculator, which was used to develop the
Sixth Regional Power Plan. This space interaction calculator is an updated version of the calculator used
by the RTF.16 Cadmus weighted the calculator results to reflect Wyoming‐specific weather and market
characteristics. To accomplish this, Cadmus used ASHRAE heating and cooling degree days and the 2006
Energy Decisions Survey data to determine the saturation of heating and cooling equipment types
installed in the regional market. Cadmus also weighted the result to reflect both bulbs installed indoors
and outdoors.
Cadmus applied a WHF of 0.906 to the 2011‐2012 evaluated savings.17
Lighting Findings
Reported savings inputs are shown in Table 23. Cadmus determined these reported inputs using
assumptions provided by the program administrator and information from the database.
Table 23. Reported Savings Inputs
Reported Inputs 2011 2012 Source
Quantity 134,003 167,678 Database/Annual Report
Total Savings (kWh) 4,564,390 5,241,772 Database/Annual Report
Unit Energy Savings (kWh) 34.1 31.3 Database/Annual Report
Average Delta Watts 50.7 46.5 Lumens equivalence method
ISR 80.0% 80.0% RTF
HOU 2.30 2.30 RTF
WHF ‐ ‐ N/A
Cadmus used the inputs listed in Table 24 to calculate the evaluated savings. The sources of these inputs
were described in the Lighting Evaluated Gross Savings section above.
16 In a memo dated December 27, 2011, Cadmus and PacifiCorp discussed the underlying assumptions within the
calculator with Tom Eckman and Adam Hadley of the RTF. From those meetings, Cadmus learned the space conditioning interaction calculator had been updated by the Northwest Power and Conservation Council for the development of the 6th Regional Power Plan. Mr. Eckman recommended the use of the 6th Plan calculator, as the newer calculator is based on expansive simulation data, as opposed to the RTF calculator, which relied primarily on professional judgment and other engineering assumptions.
17 For complete calculation, see Appendix L of 2009‐2010 Rocky Mountain Power Home Energy Savings Evaluation Report

32
Table 24. Evaluated Savings Inputs
Evaluated Inputs 2011 2012 Source
Quantity 134,003 167,678 Database
Total Savings (kWh) 3,559,445 4,093,780Calculated
Unit Energy Savings (kWh) 26.5 24.3
Average Delta Watts 50.8 46.7 Lumens equivalence method
ISR 72.4% 72.4% Lighting surveys (n= 245)
HOU 2.18 2.18 Cadmus ANCOVA model
WHF 0.905 0.905 RTF, updated for Wyoming
Figure 3 shows a comparison of the impact of the reported and evaluated inputs on the savings given in
Table 23 and Table 24. Positive percentages indicate that the input caused the evaluated savings to be
higher than the reported savings. For example, the evaluated 2012 ISR variable was 9.5% lower than the
reported value. The HOU and WHF variables had a negative impact on the program savings as well,
causing the overall evaluated savings for 2012 bulbs to be 22.2% lower than the reported savings (a
realization rate of 78% for 2012 bulbs). Figure 3 illustrates that evaluated ISR, HOU and WHF values had
the largest impact on savings.
Figure 3. Impact of Input of Calculation Parameters on Savings
Table 25 provides evaluated CFL quantities, gross savings, and realization rates.

33
Table 25. Evaluated and Reported HES Program CFL Savings for 2011–2012
Program Year
Bulb Category Quantity CFLs
Purchased
Program Savings (kWh) Unit Energy Savings
(kWh) Realization Rate
Reported Evaluated Reported Evaluated
2011 General Purpose 120,150 4,119,307 3,204,810 34.3 26.7 78%
Specialty 13,853 445,082 354,635 32.1 25.6 80%
2012 General Purpose 155,212 4,839,322 3,768,969 31.2 24.3 78%
Specialty 12,466 402,449 324,811 32.3 26.1 81%
Total 301,681 9,806,161 7,653,224 32.5 25.4 78%
Evaluated Net Savings
To estimate HES Program freeridership for CFLs, Cadmus performed price response modeling (an
estimation of demand elasticity) using information from the tracking database provided by the program
administrator. Price response modeling is a robust method for estimating net lighting savings, based on
actual observed sales.
Price‐Response Model
Using a price response model, Cadmus predicted what bulb sales would have been without program
incentives. This was done using an econometric analysis of program tracking data18 which expresses
sales as a function of price (including incentive), seasonality, retail channel, and bulb characteristics. This
model then predicts the likely sales of CFLs at the original retail prices. To complete this analysis, we
used the model coefficients to predict sales as if prices had been at their original retail price and no
promotional events had taken place. The difference in sales (weighted by gross annual kWh savings per
bulb model) between this hypothetical scenario and what actually occurred provides the net sales
attributable to the program, illustrated in Figure 4. The ratio of these sales to the total program sales is
equal to freeridership.
18 Program tracking data were combined from Idaho and Wyoming for the purposes of estimating model
coefficients. Cadmus chose to combine data due to low levels of price variation within each program. However, predictions were done specific to each service territory to adjust for program‐specific characteristics.

34
Figure 4. Net Savings Attributable to Wyoming HES Program by Program Month
Using predictions for both program sales and sales without the program mitigates the effect of any bias
in the prediction errors. We attribute the difference between projected program sales and projected
sales in absence of the program to Rocky Mountain Power Utah’s program. Sales are then multiplied by
gross annual kWh savings per bulb and the number of bulbs per package to get total savings. The
difference in savings between this hypothetical scenario and what actually occurred provides the net
savings attributable to the program, illustrated in Table 26.
Table 26 shows the net savings results. Overall, freerider savings was estimated to be 35% resulting in a
NTG of 65%. Cadmus estimated higher rates of freeridership for specialty bulbs than those seen for
standard bulbs. This was due to lower observed price elasticities of demand for specialty bulbs; that is,
sales did not increase as greatly due to reductions in price. Additionally, incentives for specialties were
lower relative to their original retail price when compared to standard bulbs.

35
Table 26. Program Net of Freeridership
Model Type Freeridership NTG* Lower 90%
Confidence Limit
Upper 90%
Confidence Limit
Standard CFLs 34% 66% 59% 76%
Specialty CFLs 50% 50% 43% 61%
All CFLs 35% 65% 58% 75%
*Spillover was not calculated for this program. Therefore the NTG does not include a spillover adjustment. Spillover is
particularly difficult to measure for upstream programs, as customers are often unaware of their participation in the program
and therefore cannot identify its influence on other purchasing decisions.
Cadmus also separately estimated freeridership by distribution channel, as shown in Table 27. Cadmus
predicted monthly sales (and weighted by kWh savings) for each individual bulb model using the
method described above, and then aggregated the results by retail channel and bulb type. Taking the
difference between predicted savings with the program and in absence of the program allowed Cadmus
to estimate NTG by retail channel and bulb type.
Table 27. Incentives as a Share of Original Price and NTG by Retail Channel and Bulb Type
Retail Channel
Bulb Type
Average Original Retail Cost per
Bulb
Average Incentive per
Bulb
Percent of Original Retail
Percent of Program Savings
NTG
Do‐it‐Yourself*
Standard $3.35 $2.43 72% 25% 75%
Specialty $4.07 $1.33 33% 2% 68%
Other** Standard $2.27 $1.50 66% 69% 63%
Specialty $4.82 $1.81 37% 4% 42%
*Cadmus defined Do‐it‐Yourself stores as retailers primarily selling hardware and/or building supplies, such as Home Depot, or
Ace Hardware.
**Other retailers cover all those not categorized as Do‐it‐Yourself, such as Wal‐Mart, or Walgreens.
Please see Appendix F for a detailed report on the price response modeling methodology and results.
CFL Retailer Allocation Review
Rocky Mountain Power subsidizes the cost of CFLs throughout its service territory. Retail stores sell CFLs
at reduced prices, but no effort is made at the point of sale to verify that shoppers purchasing these
discounted CFLs are Rocky Mountain Power customers. Thus, some individuals who are not Rocky
Mountain Power customers benefit from the program; these discounted bulbs ‘leak’ out of the service
territory. The program administrator developed a screening process to minimize the number of leaked
bulbs. Using their proprietary Retail Sales Allocation Tool19 and Buxton Company’s MicroMarketer20
software, the program administrator only targets stores where 90% or more of CFL purchases can be
attributed to Rocky Mountain Power customers.
19 http://www.peci.org/retail‐sales‐allocation‐tool. 20 Buxton specializes in retailer analysis and customer profiling: http://buxtonco.com/.

36
Cadmus evaluated the program administrator’s process to reduce CFL leakage through a series of
meetings, e‐mail exchanges, and software documentation reviews. This section outlines six key aspects
of the program administrator’s analysis: retail customer drive time calculation, retailer locations, retailer
trade areas, Rocky Mountain Power service territory, customer purchase power, and retail sales
allocation.
Retail Customer Drive Time Calculation
The degree of CFL leakage is largely impacted by the amount of time a customer is willing to drive to
purchase a CFL from a brick‐and‐motor store. Partnering with the Buxton Company, the program
administrator determined that three main factors affect customer drive time: retail class, products sold,
and urban density.
Retail Class
The program administrator’s and Buxton Company’s research showed that store type affects customer
drive time. It is common, for example, to find that people are willing to drive further to a Costco than to
a local hardware store. The program administrator divided their retailer list into six classes (classes A
through F) based on the North American Industry Classification System (NAICS).21 Examples of NAICS
classes are shown in Table 28.
Table 28. NAICS Classification Examples
NAICS Code NAICS Title
44411 Home Centers
44413 Hardware Stores
443141 Household Appliance Stores
Products Sold
The program administrator categorized products sold by retailers into three classes: White Goods, Over
the Counter (Retrofit), and Over the Counter (Plug and Play).22 CFLs are assigned to the Over the Counter
(Plug and Play) category.
21 http://www.census.gov/eos/www/naics/. 22 White Goods includes clothes washers, refrigerators, and freezers. This category is characterized as major
purchases, usually made with a degree of product research and/or assistance from a store sales person. Over
the Counter (Retrofit) includes lighting fixtures (for both CFLs and LED) and lighting controls. This category is
characterized by mid‐range cost ($20‐$200) products, sold as over‐the‐counter home improvement or retrofit
products. Over the Counter (Plug and Play) includes bulbs (both CFLs and LED) and showerheads. This category
is characterized by low‐cost ($1‐$20) products, sold through a variety of store types, which an average
consumer can reasonably install without assistance.

37
Urban Density
The program administrator assigned stores to either an urban or rural designation based on the Buxton
Company’s Urban Density Score (BUDS). BUDS accounts for the population density change when moving
further from an urban center by examining population per square foot.
The program administrator modeled the 30 possible drive time factor combinations with over 500,000
survey responses from seven states to establish the amount of time customers drove for a given product
and store type. Figure 5 reflects the drive time results capturing 80% of product sales for a particular
retail class.
Figure 5. Example of Product Drive Time Calculation
Table 29 summarizes the program administrator’s calculated drive times by retail class and product type
(CFLs are included in the Over the Counter (Plug and Play) category).

38
Table 29. Drive Times Calculated by Program Administrator
Retail Class Product Type Trade Area Drive Time
Urban Rural
Class A
White Goods 12 17
Over the Counter (Retrofit) 9 19
Over the Counter (Plug and Play) 7 14
Class B
White Goods 17 22
Over the Counter (Retrofit) 15 24
Over the Counter (Plug and Play) 13 16
Class C
White Goods 22 27
Over the Counter (Retrofit) 15 23
Over the Counter (Plug and Play) 11 17
Class D
White Goods 24 26
Over the Counter (Retrofit) 20 22
Over the Counter (Plug and Play) 15 16
Class E
White Goods 21 26
Over the Counter (Retrofit) 18 22
Over the Counter (Plug and Play) 13 16
Class F
White Goods 22 29
Over the Counter (Retrofit) 23 34
Over the Counter (Plug and Play) 17 25
Retailer Locations
Retailers and manufacturers provide retailer address information to the program administrator. The
program administrator geocodes23 the addresses using a Coding Accuracy Support System (CASS)
certified24 geocoder housed within the Buxton Company’s MicroMarketer software and loaded into a
geographic information system (GIS). If the geocoder cannot find a match, the program administrator
uses Google Earth to visually geocode a store. Overall, the program administrator reported a 98%
geocoding match rate.
Retailer Trade Areas
The program administrator created drive time polygons representing retailer trade areas using
NAVTEQ’s Guzzler™ utility25 housed within the Buxton Company’s MicroMarketer software. Drive‐time
calculations require a specialized road network dataset that contains roads, indicators for one‐way
roads, locations of turn restrictions (e.g., no left turn intersections), the grade (slope) of roads, and other
23 This process converts a street address to latitude and longitude coordinate points. 24 The United States Postal Service (USPS) developed CASS to evaluate the accuracy of software that provides
mailing‐related services to customers: https://www.usps.com/business/certification‐programs.htm. 25 http://www.navmart.com/drivetime_by_guzzler.php.

39
ancillary attributes that impact drive time. Figure 6 shows an example of concentric zones representing
increasing amounts of travel time from a store.
Figure 6. Example of Drive Time Zones
The program administrator established retailer trade areas for each geocoded store using drive times
capturing 80% of CFL sales (see Figure 7).

40
Figure 7. Example of Retailer Trade Area
Rocky Mountain Power Service Territory
In 2007, the program administrator purchased utility service area data through a DOE contractor for all
utilities in the Northwest and Western parts of the United States. The data lists which utilities serve each
ZIP code. The data also includes a utility’s type (either municipal or other), as well as whether it serves
as the ZIP code’s primary electric provider.
The program administrator contacted utilities to confirm their ZIP code‐based territory and then created
a Rocky Mountain Power GIS data layer using ZIP Code Tabulation Area boundaries.26 The administrator
laid this service area designation over the retailer trade area layer to identify intersecting ZIP codes. In
the example shown in Figure 8, all the ZIP codes intersect with the retailer trade area.
26 These are generalized aerial representations of USPS ZIP code service areas (available online:
http://www.census.gov/geo/reference/zctas.html).

41
Figure 8. Example of ZIP Codes and Retailer Trade Area
Customer Purchase Power
For each retailer trade area, the program administrator determined the likelihood that households
within that area will purchase CFLs. It weighted ZIP code household counts within a retailer’s trade area
based on a GreenAware27 index score and the retailer’s core market segments.
GreenAware Index Score
Experian’s Marketing Mosaic® USA software28 assigns each household29 to one of 71 unique market
segments. According to the GreenAware segmentation system, each market segment receives a score30
on a scale of 0‐200 for each of the four GreenAware categories: Behavioral Greens, Think Greens,
Potential Greens, and True Browns. The program administrator applied weights to GreenAware category
scores based on their propensity to buy energy‐efficiency products. Category names, descriptions, and
weights are shown in Table 30.
27 These categories are outlined online: http://www.fusbp.com/pdf/BeGreenBeAwareBeGreenAware.pdf. 28 This is a household‐based consumer lifestyle segmentation system that classifies all U.S. household and
neighborhoods. More information is available online: http://www.experian.com/assets/marketing‐
services/brochures/mosaic‐brochure.pdf 29 Households are assigned at the block group level. See:
http://www.census.gov/geo/reference/pdfs/geodiagram.pdf. 30 Determined by Experian.

42
Table 30. GreenAware Categories, Descriptions, and Weights
Category Name Description Weight
Behavior Green Think and act green, hold negative attitudes toward products that pollute, and incorporate green practices on a regular basis.
3x
Think Green Think green, but do not necessarily act green. 2x
Potential Green Neither behave nor think along particularly environmentally conscious lines, and remain on the fence about key green issues.
1x (no weighting)
True Brown Not environmentally conscious, and may have negative attitudes about the green movement.
‐1x (negative weighting)
The sum of weighted GreenAware category scores divided by five determined a new weighted
GreenAware score for each market segment. The program administrator considered a market segment
as “Green Aware” if it received a weighted GreenAware score greater than 100.
Core Market Segments
The program administrator applied weights to market segment household counts identified as a
retailer’s core31 market segment. It calculated new weighted household counts using the weights shown
in Table 31.
Table 31. Core Market Segment Weighting
Segment Category Weight
Green Aware and part of the core retail segment 3x
Either Green Aware or part of the core retail segment 2x
Neither Green Aware nor part of the core retail segment 1x (no weighting)
The sum of weighted market segment household counts determined a new weighted population count
for each ZIP code.
Retail Sales Allocation
Using the weighted ZIP code population count and utility service area data, the program administrator
determined a Total Utility Score for each ZIP code corresponding to retailer’s trade area.
The weight ‘w’ of the ′ ′ utility is expressed as:
11
Where:
= 1 if the ′ ′ utility is the primary provider, 0 otherwise.
= 1 if the ′ ′ utility is municipal, 0 otherwise.
31 Determined by Experian.

43
= Total number of utilities.
= Total number of municipalities.
Thus:
Total Utility Score = ∑
Where:
= Total weighted household count of the ‘ ′ ZIP code.
The sum of a retailer’s Total Utility Scores divided by the sum of the weighted ZIP code population
counts determined a store’s retail sales allocation score. The program administrator only approached
stores that could allocate 90% or more of CFL purchases to Rocky Mountain Power customers for
inclusion in the HES Program.
Overall, Cadmus found the program administrator’s method for reducing and controlling for CFL leakage
to be both thorough and innovative. The analysis uses current and relevant data in conjunction with
computer‐aided geospatial analysis techniques to assist the program administrator’s store inclusion
process. Relevant considerations including drive times, customer purchasing behavior, and store
type/locations are appropriately factored into the overall calculation.

44
Appliances, HVAC, and Weatherization Impact Analysis This section addresses the evaluated savings estimates for appliances, HVAC and weatherization.
Cadmus used the methods shown in Table 32 to evaluate these measure groups.
Table 32. Gross Savings Evaluation Methodology, by Measure Group
Measure Group Methodology
Appliances Engineering Review
Home Electronics Engineering Review
HVAC Engineering Review
New Homes Results of the Weatherization Billing Analysis
Weatherization Billing Analysis
The following sections discuss the evaluated savings for each measure group. For a detailed description
of the engineering review methodology and measure‐level results, please see Appendix H. For detailed
descriptions of the insulation billing analysis, please see Appendix G.
Evaluated Gross Savings
To calculate appliance and HVAC gross savings for HES Program measures Cadmus first determined
installation rates and second, conducted an engineering review. Cadmus calculated the insulation
savings estimates billing analyses, described in detail below.
Installation Rate
For each measure group, Cadmus used telephone surveys to ask participants a series of questions to
determine whether they installed incented products. Table 33 shows the installation rates of each
measure surveyed.

45
Table 33. Installation Rate by Measure, 2011‐2012
Measure
Category Measure
Total
Surveyed
Measures
Installed
Measures
Installed
% Weight
Average
Weighted
Installation %
Appliances
Refrigerator 42 42 100% 17%
100%
Clothes Washer 48 48 100% 29%
Dishwasher 44 44 100% 13%
Light Fixture 1 1 100%* 17%
Evaporative
Cooler 8 8 100%* 24%
Home
Electronics Television 61 61 100% N/A 100%
HVAC All HVAC
measures 0 0 N/A N/A 100%**
Weatherization Window 293 294*** 100%* 100% 100%
*Cadmus applied weighted measure group installation rates to these measures due to the low number of
respondents.
**Cadmus applied an installation rate adjustment of 100% to all HVAC measures as no HVAC participants were
surveyed.
*** Six window participants reported installing a total of 294 square feet of windows.
Cadmus used the average savings‐weighted installation rate for light fixtures and evaporative coolers
due to their small sample sizes. An installation rate adjustment of a 100% was used for HVAC measures
because the measure group contributed less than 2% of non‐lighting savings. Cadmus applied an
installation rate of 100% to weatherization and new homes measures as the billing analysis captured
installation rate effects or savings were passed through due to low impact on overall program savings.
Appliances
In 2011‐2012, appliance measures contributed 49% of non‐lighting savings to the HES Program. Clothes
washers and refrigerators contributed the highest percentages of appliance savings (66% and 14%), as
shown in Table 34.

46
Table 34. 2009‐2012 Appliances Measure Mix
Measure % of Appliances Savings
Change (%) 2009‐2010 2011‐2012
Ceiling Fan 0.4% 0.36% ‐18%
Clothes Washer 81.9% 66.28% ‐19%
Dishwasher 4.3% 5.31% 25%
Electric Water Heater 0.4% 1.5% 326%
Evaporative Cooler 0.1% 6.7% 5,672%
Heat Pump Water Heater 0.0% 0.4% N/A
Freezer 0.0% 0.7% N/A
Light Fixture 0.9% 4.6% 390%
Refrigerator 12.0% 13.91% 16%
Room Air Conditioner 0.0% 0.33% N/A
Table 35 shows the comparison of reported savings and units between the two evaluation period, 2009‐
2010 and 2011‐2012.
Table 35. 2009‐2012 Reported Appliances Savings and Units
Measure Reported Savings (kWh) Savings
Change
Reported Units Unit
Change 2009‐2010 2011‐2012 2009‐2010 2011‐2012
Ceiling Fan 3,330 2,191 (1,139) 31 18 (13)
Clothes Washer 614,494 398,316 (216,178) 2,658 1,980 (678)
Dishwasher 31,894 31,909 15 1,109 864 (245)
Electric Water Heater 2,631 8,984 6,353 29 79 50
Evaporative Cooler 876 40,494 39,618 3 63 60
Heat Pump Water Heater ‐ 2,120 2,120 ‐ 1 1
Freezer ‐ 3,960 3,960 ‐ 99 99
Light Fixture 6,992 27,426 20,434 76 343 267
Refrigerator 90,188 83,605 (6,583) 925 1,173 248
Room Air Conditioner ‐ 1,968 1,968 ‐ 48 48
Appliances Evaluated Savings Summary
Cadmus conducted engineering reviews to evaluate gross savings for appliances offered through the
HES Program. As shown in Table 36, realization rates ranged between 25% and 161%.

47
Table 36. 2011‐2012 Appliances Results
Measure Reported Savings
(kWh) Evaluated
Savings (kWh) Realization
Rate Ceiling Fans 2,191 547 25%
Clothes Washer 398,316 342,131 86%
Dishwasher 31,909 19,425 61%
Electric Water Heater 8,984 12,593 140%
Evaporative Coolers 40,494 47,324 117%
Freezers 3,960 4,643 117%
Light Fixture 27,426 20,268 74%
Heat Pump Water Heater 2,120 1,483 70%
Refrigerator 83,605 134,426 161%
Room Air Conditioner 1,968 1,968 100%
Total 600,973 584,807 97%
The key driver that led to the low ceiling fan realization rate was that the actual number of sockets per
fan (determine by looking up each fan’s model number) was much lower than the assumed value.
Refrigerators had a high realization rate because the reported savings used a market baseline (from the
RTF), which was more efficient than minimum code requirements. Cadmus used a federal standard
baseline that increased the evaluated gross savings. Electric water heaters also had a particularly high
realization rate (140%), which was primarily driven by using the capacity and efficiency of the water
heaters tracked in the participant database to determine savings. The tracked electric water heaters
were more efficient than assumed.
Appendix H provides a more detailed analysis of these measures.
Home Electronics
In 2011‐2012, home electronics contributed 24% of non‐lighting reported savings to the HES Program.
Flat screen TVs contributed nearly a 100% of savings in the category, as shown in Table 39. Home
electronics were not offered in 2009‐2010.
Table 37. 2011‐2012 Home Electronics Measure Mix
Measure % of Home
Electronic Savings
Flat Panel Television 99.9%
Computer Monitor 0.0%
Desktop Computer 0.1%

48
Home Electronics Evaluated Savings Summary
Cadmus conducted engineering reviews for home electronic measures. Cadmus did not evaluate the
gross savings for all measures, due to their limited contributions to the program savings. As shown in
Table 38 realization rates ranged between 73% and 100%.
Table 38. 2011‐2012 Home Electronics Measure Mix
Measure Reported Savings
(kWh) Evaluated
Savings (kWh) Realization
Rate Computer Monitor 56 56 100%
Desktop Computer 154 154 100%
Flat Panel Television 297,140 217,128 73%
Total 297,350 217,338 73%
The total home electronic savings are heavily driven by the flat panel TV analysis which realized 73% of
reported savings. This realization rate is driven by differences in assumptions of screen sizes between
the reported and evaluated savings methodologies. The assumed screen sizes were not available;
however the general trend is that TV screen sizes are increasing over time. Appendix H provides more
detailed analyses of the flat screen television analysis.
HVAC
In 2011‐2012, HVAC measures contributed less than 2% of non‐lighting reported savings to the HES
Program. Ductless heat pump contributed 71% of savings in the category, as shown in Table 39.
Table 39. 2009‐2012 HVAC Measure Mix
Measure % of HVAC Savings Change
(%) 2009‐2010 2011‐2012
Central Air Conditioner* 35.1% 19.3% ‐45%
Duct Sealing and Insulation 0.0% 0.0% N/A
Ductless Heat Pump 0.0% 70.8% N/A
Heat Pump Conversion 42.8% 0.0% ‐100%
Heat Pump Upgrade 22.1% 9.9% ‐55%
* This includes equipment; tune‐ups, and best practice installation.
Table 40 shows the comparison of reported savings and units between the two evaluation periods,
2009‐2010 and 2011‐2012. Since total HVAC participation is small in comparison to other measure
groups, small changes in participation cause large swings in the measure mix.
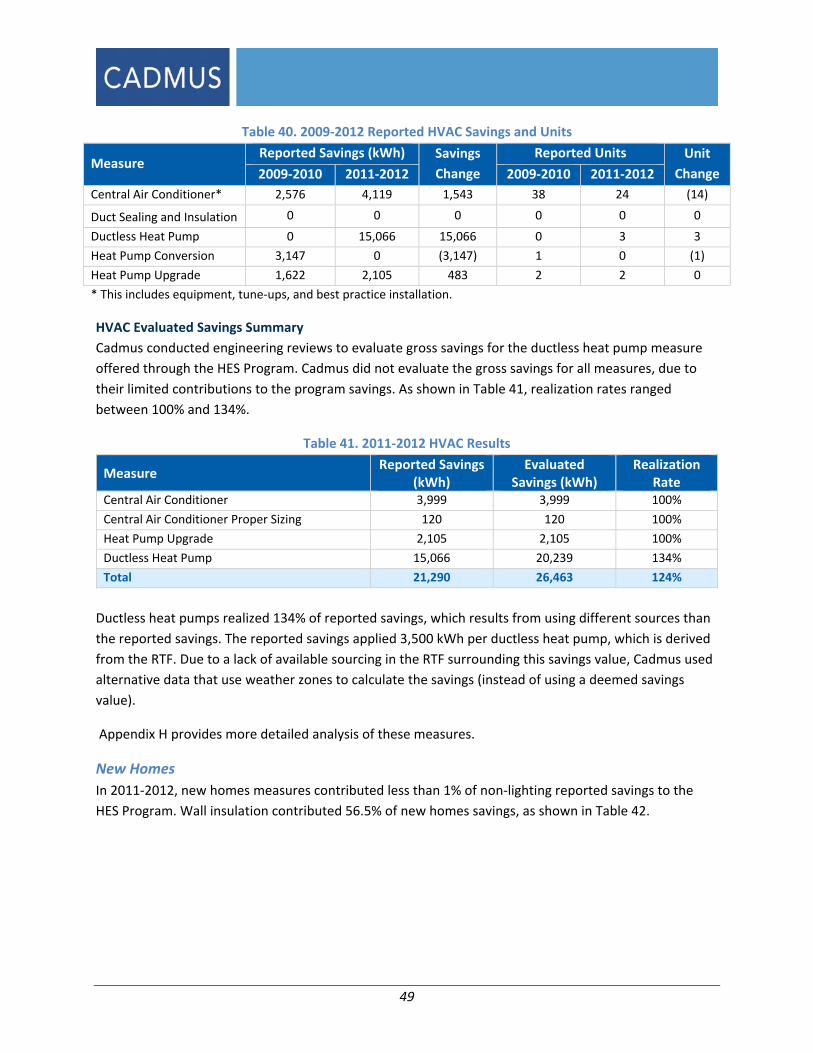
49
Table 40. 2009‐2012 Reported HVAC Savings and Units
Measure Reported Savings (kWh) Savings
Change
Reported Units Unit
Change 2009‐2010 2011‐2012 2009‐2010 2011‐2012
Central Air Conditioner* 2,576 4,119 1,543 38 24 (14)
Duct Sealing and Insulation 0 0 0 0 0 0
Ductless Heat Pump 0 15,066 15,066 0 3 3
Heat Pump Conversion 3,147 0 (3,147) 1 0 (1)
Heat Pump Upgrade 1,622 2,105 483 2 2 0
* This includes equipment, tune‐ups, and best practice installation.
HVAC Evaluated Savings Summary
Cadmus conducted engineering reviews to evaluate gross savings for the ductless heat pump measure
offered through the HES Program. Cadmus did not evaluate the gross savings for all measures, due to
their limited contributions to the program savings. As shown in Table 41, realization rates ranged
between 100% and 134%.
Table 41. 2011‐2012 HVAC Results
Measure Reported Savings
(kWh) Evaluated
Savings (kWh) Realization
Rate Central Air Conditioner 3,999 3,999 100%
Central Air Conditioner Proper Sizing 120 120 100%
Heat Pump Upgrade 2,105 2,105 100%
Ductless Heat Pump 15,066 20,239 134%
Total 21,290 26,463 124%
Ductless heat pumps realized 134% of reported savings, which results from using different sources than
the reported savings. The reported savings applied 3,500 kWh per ductless heat pump, which is derived
from the RTF. Due to a lack of available sourcing in the RTF surrounding this savings value, Cadmus used
alternative data that use weather zones to calculate the savings (instead of using a deemed savings
value).
Appendix H provides more detailed analysis of these measures.
New Homes
In 2011‐2012, new homes measures contributed less than 1% of non‐lighting reported savings to the
HES Program. Wall insulation contributed 56.5% of new homes savings, as shown in Table 42.

50
Table 42. 2011‐2012 New Homes Measure Mix
Measure % of New Homes Savings
Attic Insulation 20.9%
Floor Insulation 22.6%
Wall Insulation 56.5%
New homes measures were not offered in Wyoming in 2009‐2010.
New Homes Evaluated Savings Summary
Cadmus applied the results of the insulation billing analysis to the new homes insulation measures. As
shown in Table 43, Cadmus applied a realization rate of 112% for all new homes measures.
Table 43. 2011‐2012 New Homes Results
Measure Reported Savings
(kWh) Evaluated
Savings (kWh) Realization
Rate Attic Insulation 751 843 112%
Floor Insulation 810 909 112%
Wall Insulation 2,024 2,272 112%
Total 3,585 4,023 112%
Weatherization
In 2011‐2012, weatherization measures contributed 25% of non‐lighting reported savings to the HES
Program. Attic insulation contributed the most savings in this category (84%), as shown in Table 44.
Table 44. 2009‐2012 Weatherization Measure Mix
Measure % of Weatherization Savings Change
(%) 2009‐2010 2011‐2012
Attic Insulation 76.6% 83.4% 9%
Floor Insulation 7.0% 1.6% ‐77%
Wall Insulation 11.2% 11.5% 3%
Windows 5.2% 3.5% ‐33%
Table 45 shows the comparison of reported savings and units between the two evaluation period, 2009‐
2010 and 2011‐2012.

51
Table 45. 2009‐2012 Reported Weatherization Savings and Units
Measure Reported Savings (kWh) Savings
Change
Reported Units Unit
Change 2009‐2010 2011‐2012 2009‐2010 2011‐2012
Attic Insulation 104,382 253,757 149,375 210,468 802,344 591,877
Floor Insulation 9,589 4,851 (4,738) 14,998 2,594 (12,404)
Wall Insulation 15,257 34,979 19,722 11,827 7,080 (4,747)
Windows 7,034 10,578 3,544 7,643 6,172 (1,471)
Attic, Floor, and Wall Insulation Billing Analysis
Cadmus conducted a billing analysis to determine the insulation net savings. This process involved
comparing the pre‐ and post‐installation electricity usage for homes receiving incentives for attic, floor,
or wall insulation. Cadmus determined the net savings estimate using a pooled, conditional savings
regression model, which included the following groups:
Insulation (combined attic, wall, and floor insulation for 2011–2012); and
Nonparticipant homes, serving as the comparison group.
Table 46 presents the net savings estimate for attic, floor, and wall insulation, including the control
group. The billing analysis estimated annual net savings of 540 kWh per premise. Average insulation had
expected savings of 481 kWh, translating to a 112% realization rate for insulation measures. With
average participant pre‐usage of 12,470 kWh, these insulation savings represent a 4% reduction in
participants’ overall energy usage.
Table 46. HES Attic, Floor and Wall Insulation Realization Rates
Group
Billing
Analysis
Participant
(n)
Reported
kWh Savings
per Premise
Evaluated
kWh Savings
per Premise
Realization Rate
(90% Confidence
bounds)
Model Savings (Overall) 243 481 540 112% (67%–158%)
Model Savings (Electric Heat) 31 3,359 2,295 68% (51%‐86%)
Model Savings (Non‐Electric Heat) 212 60 290 481% (110%‐853%)
Table 46 also presents results by space heating fuel: electric and non‐electric. Overall electrically heated
homes achieved insulation savings of 2,295 kWh per home. The average electrically heated expected
insulation savings were 3,395 kWh, translating to a 68% realization rate. With an average electrically
heated participant pre‐usage of 20,431 kWh, savings represented an 11% reduction in energy usage
from insulation measures. Non‐electrically heated homes achieved insulation savings of 290 kWh per
home. The average insulation expected savings were 60 kWh, translating to a 481% realization rate.
With a non‐electrically heated participant pre‐usage of 11,306 kWh, savings represented a 3% reduction
in energy usage from insulation measures.

52
Cadmus used only the overall model results to determine the program level savings.
Appendix G provides methods and results for the billing analysis.
Windows
Windows represented less than 1% of total reported program savings. Due to the small contribution and
limited number of participants, Cadmus assigned window measures a realization rate of 100%.
Weatherization Evaluated Savings Summary
Cadmus derived weatherization savings through a billing analysis of insulation participants. Table 47
outlines the savings results for the 2011‐2012 program period.
Table 47. 2011‐2012 Weatherization Results
Measure Reported Savings
(kWh) Evaluated
Savings (kWh) Realization
Rate Attic Insulation 253,757 284,782 112%
Floor Insulation 4,851 5,444 112%
Wall Insulation 34,979 39,256 112%
Windows 10,578 10,578 100%
Total 304,165 340,059 112%
Attic Insulation On‐Site Inspections
For the 2009‐2010 HES Program evaluation, Cadmus audited 65 homes in Wyoming where participants
received rebates for attic insulation. Cadmus designed the 2009‐2010 sample to produce estimates with
90% confidence and ±10% precision, and Cadmus did not find any statistically significant differences
between the square footage of insulation that was reported by the program administrator and that
verified by Cadmus’ on‐site visits. Cadmus also did not find statistically significant differences between
reported and verified R‐Values for added attic insulation.
For the 2011‐2012 evaluation, Cadmus performed insulation site visits to assess the quality and quantity
of Rocky Mountain Power’s incented measures. Because Cadmus did not find evidence of over‐ or
under‐reporting insulation square footage in the 2009‐2010 evaluation, Cadmus used a smaller sample
for the 2011‐2012 evaluation. Cadmus designed the sample to produce estimates with 80% confidence
and ±20% precision.
ApproachTo verify reported insulation savings, Cadmus visited 10 homes that received attic insulation.
Specifically, Cadmus used the site visits to:
1. Verify that the installed insulation square footage matched that claimed in the program
administrator’s tracking database.

53
2. Ensure that the reported incentive did not exceed the maximum incentive amount.32
3. Confirm that the customer met HES insulation eligibility requirements, including:
a. The home was constructed before 2008.
b. The home uses electric heat (primary system) or has a central air conditioner or heat pump
serving at least 80% of its floor area.
c. The home had pre‐existing attic or floor insulation below R‐20, with post‐program installed
attic insulation of R‐49 or higher.
4. Check the measure insulation install quality, specifically verifying the R‐Values of attic insulation
installed.
To verify installed attic insulation R‐Values, Cadmus first visually identified the type of each insulation
layer (i.e., loose‐fill fiberglass, loose‐fill rock wool, loose‐fill cellulose, fiberglass batt, perlite, or
polystyrene). Then, Cadmus measured the average thickness of each layer, and calculated the
corresponding R‐Value based on each insulation types’ assumed R‐per‐inch.33
Cadmus verified attic insulation at 10 sites (Table 48). Unless otherwise noted, attic insulation results
met 80% confidence and 20% precision levels.
Table 48. Sites Verified by Insulation Type
Insulation Type Population Verified Sample*
Attic Insulation 570 10
ReportedandObservedAtticInsulationSquareFootageCadmus calculated the attic insulation square footage for each insulation type, and compared it to the
reported square footage listed in the program administrator’s database. The 10 attic insulation sites
averaged 1,306.4 claimed square feet; the sites averaged 979.8 verified square feet, or roughly an 326‐
square‐foot (or 25%) difference.
For 70% of the sites visited, the verified square footage differed from the claimed square footage by
over 300 square feet. Cadmus performed a difference of means t‐test to check for a statistically
significant difference between the reported and verified square footage. Table 49 shows t‐test results.
32 The HES Insulation Incentive Application indicates that participants can receive up to $0.50 per square foot of
installed insulation for an electrically heated home and $0.15 for an electrically cooled home only. 33 Cadmus used R‐per‐inch assumptions that are consistent with Rocky Mountain Power’s HES Insulation
Calculator: http://homeenergysavings.net/Downloads/InsulationCalculator.pdf.

54
Table 49. Claimed and Verified Attic Insulation Square Footage Difference of Means T‐Test
n
Average
Claimed
Average
Verified
Average
Difference
Standard
Deviation t stat p‐value
Square Feet of
Attic Insulation 10 1,306.4 979.8 326.6 256.9 4.02 0.00
As this test’s p‐value falls below 0.10, this suggests that verified square footage may be different than
claimed, but a sample of 10 sites is not sufficient to conclusively determine if there is a difference.
However, it does show that the small sample of observed differences may not be attributable to random
error and Cadmus suggests the program administrator review their quality assurance plan to ensure the
program is taking the necessary steps to mitigate these differences.
AtticInsulationQualificationRequirementsTo verify whether participants met program qualification requirements, Cadmus verified heating fuel
types, cooling system types, home construction years, pre‐existing insulation R‐Values, and final
insulation R‐Values. Table 50 summarizes the percentages of eligible and ineligible participants.
Table 50. Attic Insulation Criteria
Criteria Evaluated Percent Precision with 80% CI
Total In‐Eligible 3 42.86% ±23.94%
Gas Heating System and CAC/Heat Pump Serves < 80% of Floor Area or electric primary heating system
1 14.29% ±16.93%
Pre‐existing Insulation greater than R‐20 2 28.57% ±21.86%
Final Insulation below R‐49 0 0.00%
Pre‐existing insulation greater than R‐20 and final insulation below R‐49
0 0.00%
Total Eligible 4 57.14% ±23.94%
Total Verified for Eligibility 7 70.00% Could Not Verify* 3 30.00%
Total Participants 10 100% * Cadmus could not verify the thickness and type of insulation at these three sites because they could not access
the entire attic.
The reported pre‐existing attic insulation R‐Values averaged R‐2.9 less than the verified R‐Values. The
reported added attic insulation R‐Values exceeded the verified R‐Values by R‐1.6; however the test’s p‐
values do not fall below 0.10 and these differences can be attributed to random error. Table 51 shows
the average differences between claimed and verified pre‐existing and added attic insulation R‐Values.

55
Table 51. Average Differences Between Claimed and Verified R‐Values
Type of Attic
Insulation n
Average
Claimed
R‐Value
Average
Verified
R‐Value
Average
Difference
Standard
Deviation t stat
p‐
value
Pre‐Existing 7 14.3 17.2 ‐2.9 9.1 ‐0.85 0.43
Added 10 32.9 34.5 ‐1.6 9.4 ‐0.54 0.60
Appliances, Home Electronics, and HVAC Net Savings Approach
Cadmus determined the HES Program’s NTG during 2011 and 2012. The NTG is comprised of
freeridership and participant spillover. Freeriders—participants who would have purchased the same
measure at the same time without the program’s influence—decrease the amount of savings
attributable to the HES Program. Participant spillover—additional savings from program participants
that invested in additional efficiency measures or activities due to their program participation—increase
the amount of savings attributable to the HES Program, and improve the program cost‐effectiveness.
Cadmus used the following formula to determine the final NTG ratio for each program measure:
Net‐to‐gross ratio = (1 – Freeridership) + Spillover
Freeridership
Cadmus determined the amount of freeridership based on a previously developed approach for Rocky
Mountain Power, in which freeridership is ascertained using patterns of responses to a series of survey
questions. These questions—answered as “yes,” “no,” or “don’t know”—ask whether participants would
have installed the same equipment in the program’s absence, at the same time, of the same amount,
and at the same efficiency. Question response patterns are assigned freerider scores, and the
confidence and precision estimates are calculated based on score distributions.34
Spillover
Cadmus determined participant spillover by estimating the amount of savings from additional measures
installed and whether respondents’ credited Rocky Mountain Power with influencing their decision to
install additional measures. Cadmus included measures that were eligible for program incentives, but for
which the respondent did not request the incentive.
Cadmus then used the freeridership and spillover results to calculate the program NTG ratio.
Appendix I provides a detailed explanation of Cadmus’ NTG methodology, including:
An explanation of the surveys’ design; and
Descriptions of Cadmus’ freeridership and spillover evaluation methodologies.
34 This approach was outlined in: Schiller, Steven et al. “National Action Plan for Energy Efficiency.” Model
Energy Efficiency Program Impact Evaluation Guide. 2007. www.epa.gov/eeactionplan.

56
The appendix also provides:
Full‐text versions of the NTG survey questions administered to participants;
The freeridership scoring matrix, showing all possible combinations of responses to the
freeridership survey questions; and
The scores Cadmus assigned to each combination of responses.
Although Cadmus used this NTG methodology for appliances and home electronic measures, it did not
apply to HVAC, weatherization, or new homes. No HVAC participants were surveyed and a savings
weighted average of the appliances and home electronics freeridership and spillover estimates used for
the NTG estimate for HVAC. For weatherization measures, Cadmus used participant and non‐participant
billing analysis to determine net savings which implicitly includes the effects of freeridership and
spillover. Specifically, Cadmus compared participants’ billing data to nonparticipants’ billing data to
estimate what participants would have done in the program’s absence.
Summary of Results
Table 52 summarizes HES Program freeridership, spillover, and NTG percentages.
Table 52. HES Program Measure Categories’ NTG Ratio
Program Category Responses (n) FR % Spillover % NTG Precision at 90%
Confidence (+/‐)
Appliances 210 45.5%* 5.6%* 60.1% 3.6%
Home Electronics 65 42.7% 0.0% 57.3% 6.9%
HVAC 0 44.5%** 4.0%** 59.5% 3.2%
* Weighted by evaluated savings and survey sampling weights.
** Savings weighted average of appliances and home electronic estimates
Participants who purchased an appliance measure had a NTG of 60%, indicating that 60% of the gross
savings for appliance measures are attributable to the HES Program. Participants who purchased a home
electronics measure had a NTG of 57%, indicating that 57% of the gross savings for the home electronics
measures are attributable to the HES Program. The savings weighted average of the appliance and
home electronic estimates was applied to HVAC measures since no HVAC participants were surveyed.
Freeridership Analysis
After conducting participant surveys, Cadmus converted the responses to the six freeridership questions
into a score for each participant, using the Excel‐based matrix approach described in Appendix I. Cadmus
derived each participant’s freerider score by translating their responses into a matrix value, and using a
rules‐based calculation.
This section presents all the combinations and scores of HES Program survey responses. Participants’
responses were grouped around subsets of common patterns. Cadmus calculated freeridership,

57
confidence intervals, and precision estimates for each measure category, based on the distributions of
scores within the matrix.
Table 53 shows the freeridership results for appliance, home electronics, and HVAC measures.
Table 53. HES Program Freeridership Results for Each Appliance and Home Electronics Measure
Measure n Freeridership Score Precision at 90% Confidence
(+/‐)
Refrigerator 64 48.0% 5.8%
Clothes Washer 66 48.9% 6.7%
Dishwasher 63 52.8% 6.8%
Light Fixture 4 45.5%** N/A
Freezer 4 45.5%** N/A
Evaporative Cooler 8 45.5%** N/A
Electric Water Heater 1 45.5%** N/A
Overall Appliances 210 45.5%* 3.6%
Televisions 65 42.7% 6.9%
Overall Home Electronics 65 42.7% 6.9%
Overall HVAC 0 44.5%*** 3.2%
* Weighted by evaluated savings and survey sampling weights.
** Due to small sample sizes, the overall weighted average freeridership estimate of the appliance measure
category was used.
** Savings weighted average of appliances and home electronic estimates
Light fixture, freezer, evaporative cooler, and electric water heater measures did not achieve 90/10
precision, so Cadmus applied the overall appliances‐weighted freeridership estimate in place of the
estimates calculated from the self‐report survey efforts. The savings weighted average of the appliance
and home electronic estimates was used for the HVAC freeridership estimate since no HVAC participants
were surveyed.
The surveyed appliance participants had five common response patterns to the freeridership questions,
which represent 90% (188 out of 210) of the total appliance participants interviewed:
1. Forty‐six respondents had already purchased the measure before they heard about the program
incentive, and were therefore given a freeridership score of 100%.
2. Ninety‐two respondents planned to purchase the measure(s) before hearing about program
incentives. Their responses indicated they would have purchased a measure of the same
efficiency at the same time without the incentive. However, since they had not purchased the
measure before hearing about the incentive the methodology assumes the incentive had partial
influence and they were given a freeridership score of 50%.
3. Fourteen respondents planned to purchase the measure(s) before hearing about program
incentives. Their responses indicated they would have purchased a measure of the same

58
efficiency, but not until later the same year. Since there is uncertainty about when they would
have actually purchased the measure, they were given a freeridership score of 25%.
4. Sixteen respondents had not already purchased nor were planning to purchase the measure(s)
when they heard about the program incentive. However, they were scored as 25% freeriders, as
they said they would have purchased the same measure at the same time without the incentive,
and it would have been just as energy efficient.
5. Twenty respondents were estimated as 0% freeriders for a variety of reasons. Eleven of these
reported they would not have installed the measure to the same level of efficiency without the
incentive. An additional 4 of the 20 indicated they would not have installed the measure at all
without the incentive. Three of the 20 indicated they would not have purchased or installed the
measure within 1 year without the incentive. One of the 20 respondents indicated they didn’t
know if they would have installed the measure without the incentive. One respondent indicated
they would have installed something without incentive but they didn’t know if they would have
done it to the same level of efficiency, quantity or within 1 year.
The surveyed home electronic participants had five common response patterns to the freeridership
questions, which represent 85% (55 out of 65) of the total appliance participants interviewed:
1. Thirteen respondents had already purchased the measure before they heard about the program
incentive, and were therefore given a freeridership score of 100%.
2. Nineteen respondents planned to purchase the measure(s) before hearing about program
incentives. Their responses indicated they would have purchased a measure of the same
efficiency at the same time without the incentive. Since they had not purchased the measure
before hearing about the incentive, they were given a freeridership score of 50%.
3. Seven respondents planned to purchase the measure(s) before hearing about program
incentives. Their responses indicated they would have purchased a measure of the same
efficiency, but not until later the same year. Since there is uncertainty about when they would
have actually purchased the measure, they were given a freeridership score of 25%.
4. Five respondents had not already purchased nor were planning to purchase the measure(s)
when they heard about the program incentive. However, they were scored as 25% freeriders, as
they said they would have purchased the same measure at the same time without the incentive,
and it would have been just as energy efficient.
5. Eleven respondents were estimated as 0% freeriders for a variety of reasons. Three of these
reported they would not have installed the measure to the same level of efficiency without the
incentive. One of the 11 indicated they would not have installed the measure at all without the
incentive. Six of the 11 indicated they would not have purchased or installed the measure
within 1 year without the incentive. One of the 11 respondents indicated they were not
planning on purchasing the measure before hearing about the HES Program, they would not
have purchased the measure without the incentive and in absence of the HES program they
would not have installed the measure at all.

59
Appliance and home electronic measure freeridership can also be compared based on the distribution
of respondents’ freeridership scores. Figure 9 and Figure 10 show the freeridership score distributions of
appliances and Home Electronic survey respondents, respectively.
Figure 9. Distribution of Appliances Freeridership Scores*
* Total may not sum to 100% due to rounding.
Approximately 10% of respondents who installed an appliance measure had a freeridership score of 0%.
Conversely, the majority (66%) of respondents were assigned a freeridership score of 50% or 100%.

60
Figure 10. Distribution of Home Electronic Freeridership Scores*
* Total may not sum to 100% due to rounding.
Approximately 17% of respondents who installed an appliance measure had a freeridership score of 0%.
Conversely, the majority (51%) of these respondents were as assigned a freeridership score of 50% or
100%.
Please see Appendix J for the full list of freeridership responses.
Spillover Analysis
This section presents a detailed analysis of the additional, energy‐efficient measures customers installed
after participating in the HES Program. While many participants installed additional energy‐efficient
measures after receiving incentives from Rocky Mountain Power, only the additional purchases that had
been significantly influenced by HES Program participation and did not receive a rebate were considered
to be were attributed to program spillover.
Cadmus used evaluated savings values from the deemed savings analysis to estimate spillover measure
savings. Cadmus estimated the spillover percentage for the appliance measures category by dividing the
sum of the additional spillover savings by the total incentivized gross savings achieved by all 210
respondents who purchased a program appliance.
Table 54 shows the spillover analysis results for the HES appliance and home electronic measure
categories.

61
Table 54. Spillover Savings Analysis for Appliance Measure Category
Measure Category Spillover Savings (kWh) Participant Program
Savings (kWh) Spillover %
Appliances 1,509.6 26,747.9 5.64%
Home Electronics 0 8,502.0 0%
Overall, surveyed appliance respondents that were highly influenced by their HES Program participation
installed 5 additional measures that were attributed to the program. Of these 5 measures, duct
insulation accounted for the largest proportion of spillover savings (67%; Table 55). No home
electronics participants that were surveyed attributed additional energy efficiency measure purchases
to their participation in the HES Program.
Table 55. HES Appliance Measure Category Spillover
Spillover Measure Installed Quantity Electric Savings Per Unit (kWh) Total Savings (kWh)
Electric Water Heater 2 159.4 318.8
Central Air Conditioning 1 181.8 181.8
Duct Insulation 2 505.5 1,009.0
Benchmarking NTG
Table 56 below shows the freeridership, spillover, and NTG estimates for appliance rebate programs
reported by other utilities with similar programs and similar measure offerings. As home electronics are
often included within appliance programs, it is appropriate to include the evaluated home electronics
NTG in this comparison.
Table 56. Appliance Program NTG Benchmarking*
Utility / Region Reported Year
Responses (N)
FR % Spillover % NTG
Northwest Utility ‐ A 2012 73 77% 0% 23%
Northeast Utility ‐ A 2012 64 69% 1% 32%
Northwest Utility ‐ A 2011 94 62% 4% 42%
Rocky Mountain Power Wyoming 2011‐2012HES Evaluation: Home Electronics
2013 65 43% 0% 57%
Rocky Mountain Power Wyoming 2011‐2012HES Evaluation: Appliances
2013 210 46% 6% 60%
Northeast Utility ‐ B 2011 99 35% 0% 65%
Rocky Mountain Power Wyoming 2009‐2010HES Evaluation: Appliances
2012 293 46% 14% 68%
* NTG values all derive from self‐response surveys; however, differences in the analysis and scoring methodologies
may vary across evaluations.

62
The majority of the benchmarked programs experienced lower NTG than the 2011‐2012 HES Program
appliance and home electronic measure categories. The main driver of the NTG difference between the
2009‐2010 and 2011‐2012 HES Programs is that participant spillover was 14%35 in 2009‐2010 and in
2011‐2012 it was approximately 6% for appliances and 0% for home electronics. In general, appliance
rebate programs across the country are experiencing upward trends in freeridership, especially
programs that have a lot of refrigerator, clothes washer, and dishwasher participants.
35 In 2009‐2010, 73% of the spillover percent estimate is associated with five insulation spillover respondents.

63
Process Evaluation Findings
This section provides detailed process evaluation findings for the HES Program. Cadmus determined
these findings through data collection activities, including trade ally surveys, program staff interviews,
participant surveys, and secondary research. Cadmus focused on assessing:
Effectiveness of the delivery structure and implementation strategy;
Marketing approaches and materials review;
Customer and trade ally satisfaction; and
Internal and external communications.
Cadmus structured the process evaluation to respond directly to the research questions agreed upon
with Rocky Mountain Power at the start of the evaluation. These research questions are listed in in
Table 57.
Table 57. 2011‐2012 Process Evaluation Researchable Questions and Topics
Research Areas Researchable Questions and Topics Program Implementation and Delivery
Program status Analyze the shift or lack of shift away from lighting savings and the growing non‐lighting savings.
Trade ally support Are the increased support efforts (quarterly meetings, e‐newsletters, coaching on paperwork, and installation requirements) with top (Tier 1) trade allies working?
Do Rocky Mountain Power and the program administrator have better relationships with the trade allies?
Is the HES Program generating more business for the trade allies?
Application processing What are the barriers to submitting an incentive application?
EISA How has the implementation of EISA affected participants?
Marketing
Lighting program sponsorship
Has the percentage of customers that connect the lighting buy‐downs with Rocky Mountain Power improved since the 2009‐2010 evaluation?
Did the program make a substantial effort to improve participant awareness of lighting incentives?
Program website What would drive more traffic to the HES Program website?
What would make the website more useful to participants and trade allies?
Social media Analyze the use of social media.
wattsmart brand differentiation
Are customers differentiating HES Program media awareness from wattsmart (general awareness) advertising?
Methodology Cadmus conducted the following process evaluation research:
Document review;
Marketing materials review;
Utility and administrator staff interviews;

64
Lighting customer surveys;
Non‐lighting participant surveys; and
Trade ally surveys.
Document Review
Cadmus concentrated its review on critical program documents, including past evaluation reports, the
program logic model, and the program’s incentive applications.
To assess program progress and analyze trends across program years, Cadmus considered the
findings and conclusions from the Rocky Mountain Power 2009‐2010 Wyoming Residential
Home Energy Savings Evaluation Report.
Cadmus updated the HES Program logic model to reflect 2011‐2012 program processes (see
Appendix K) based on information gathered through program staff interviews (the interview
guide is included as Appendix A).
Cadmus reviewed Rocky Mountain Power’s residential appliance, HVAC, insulation, and window
incentive applications, and compared them against similar programs’ forms and published best
practices for form design. Our detailed findings are included in Appendix M.
Marketing Materials Review
Cadmus reviewed the marketing and communications materials developed to promote HES Program
participation and educate target audiences in Wyoming. In addition to the materials review, Cadmus
integrated marketing effectiveness findings from stakeholder interviews, analysis of trade ally and
participant survey findings, and an overall synthesis across sources, best practices, and a comparison of
findings from the 2009‐2010 program evaluation.
Cadmus reviewed the following materials provided by Rocky Mountain Power and the program
administrator:
Collateral (e.g., promotional material, advertising, and educational pieces);
HES Program marketing strategy and executional plans;
Corporate and energy‐efficiency brand guidelines;
Presentation decks and metrics tracking; and
Online (website)36 and social media elements.
The findings from our marketing materials review are included in Appendix L.
Utility and Administrator Staff Interviews
Cadmus developed stakeholder interview guides and collected information about key topics from
program management staff. Cadmus conducted three interviews: one with the program manager at
36 The website assessed was: http://www.rockymountainpower.net/hes.

65
Rocky Mountain Power, one with the program manager at PECI (the program administrator) who
oversees the HES Program in five PacifiCorp service territory states, and one with the trade ally
management staff at PECI. The interview issues discussed were:
Program status and delivery processes;
Program design and implementation changes;
Marketing and outreach tactics; and
Barriers and areas for improvement.
Cadmus conducted the interviews by telephone, and then contacted the interviewees via e‐mail with
follow‐up questions or for clarifications.
Participant and Trade Ally Surveys
In addition, Cadmus conducted telephone surveys with participating trade allies and both lighting and
non‐lighting participating customers. Cadmus designed each survey instrument to collect data about the
following topics:
Program process. Details to inform the following performance indicators:
Effectiveness of the program processes;
Participation motivations and barriers;
Customer and trade ally satisfaction; and
Program strengths and/or areas for improvement.
Customer information. Demographic information and household statistics.
Program Implementation and Delivery Drawing on stakeholder interviews and participant survey response data, this section discusses the HES
Program implementation and delivery.
Program Overview
Through the HES Program, Rocky Mountain Power provides cash incentives for customers to install
multiple measures to create customized efficiency portfolios. The program is available to residential
customers who purchase energy‐efficient products, home improvements, and heating and cooling
equipment and services. All Rocky Mountain Power customers, including non‐homeowners, are eligible
to participate in the program.
Rocky Mountain Power offers energy‐efficiency measures in two primary categories: lighting and non‐
lighting. When deemed appropriate, Cadmus further segmented non‐lighting measures by trade ally
type: retailer and contractor‐installed. Non‐lighting retailer measures included energy‐efficient
appliances and products that can be purchased at a retail store and installed with little or no assistance.
Contractor‐installed non‐lighting measures included insulation and HVAC equipment, which require
installation by a qualified contractor.

66
Program Status
According to program administrator staff, the HES Program made great strides in 2012, particularly
regarding processes in the field. The program has made efforts to increase its presence in local
communities and strengthen retailer and trade ally relationships. In addition, Rocky Mountain Power
submitted a tariff change to increase incentives and measure offerings for the evaluated program years.
These changes were implemented towards the end of 2011.
Delivery Structure and Processes
Rocky Mountain Power and the program administrator delivered the 2011‐2012 HES Program through
processes that were similar to those used during the 2009‐2010 program year. For most qualifying
program measures, customers received incentives through a mail‐in process. However, because the HES
Program’s lighting component used an upstream mechanism, the program staff paid incentives directly
to manufacturers of qualifying light bulbs. Local retailers and trade allies supported the program by
directing their customers to higher‐efficiency equipment measures, installing equipment and service
measures, and promoting available incentives.
Retailers and Trade Allies
In 2011 and 2012, the program administrator staff developed a tiered account management system for
trade ally and retailer program delivery. The tiered model allows the program administrators to identify
retailers with the highest increase in sales (Tier 1 stores), and prioritize visits to those locations. Program
administrator staff also visited Tier 3 stores on a more infrequent basis. Program administrator staff
considered Tier 3 stores to be those less engaged in the program with overall lower sales compared to
the Tier 1 and Tier 2 stores.
Similarly, the Program administrator considered Tier 1 trade allies to be those with the highest
performance and participation in the program, and assigned them a local account manager who
provided individualized outreach and assistance.
Support
The program administrator increased trade ally support in the 2011‐2012 program years by adding
dedicated field staff early in 2012, and by issuing a quarterly newsletter. However, this increase in
support was not evident to the five trade allies who participated in the program over the last two
program years, or prior to the program administrator’s increased support efforts.
Although four of the seven interviewed trade allies reported they have never interacted with
administrator staff, two of the three remaining trade allies reported that the program administrator was
helpful at addressing their needs. Further, five of the seven trade allies noted that their affiliation with
the HES Program has been effective in generating new business for their company.
Trade Ally Training
According to the program administrator, all trade allies are expected to attend a webinar‐based
orientation training, which covered the basics of the program, including an overview of the program,

67
paperwork, rebates, and resources. However, none of the surveyed trade allies reported having
attended orientation training. Two stated they did not know training was offered.
In addition, Rocky Mountain Power partners with Casper College to offer discounted industry trainings
to program trade allies through the Green Outreach Project Lecture Series.
Application Process
In 2011, Rocky Mountain Power began offering online applications to facilitate trade ally participation
and promote the HES Program. The online applications cover all purchased products, including
appliances and light fixtures, but do not cover trade ally‐installed measures that require testing and
documentation. Although the applications can be filled out and submitted online, participants are still
required to mail their supporting documentation (e.g., receipts for purchased equipment). Rocky
Mountain Power staff reported they have not yet determined the best way for participants to submit
this information online.
At the end of 2011, the program administrator subcontracted with a company in Minnesota to handle
application processing and incentive fulfillment for the HES Program. The company was also responsible
for following up with customers if any information on their application was missing or incorrect;
however, Rocky Mountain Power reported that the company’s customer service was not up to its
standards. After six months, the program administrator terminated the contract with the application
processing company.
Since then, the program administrator has been using an in‐house incentive application processing
center. Program administrator staff enter all data into a customized system that stores and processes
the application data. Program administrator staff track this data using Salesforce, a client relationship
management software that facilitates data management and report extraction. The program
administrator is also responsible for customer service, handling all customer follow‐ups, and reviewing
applications.
In 2011‐2012, 90% of non‐lighting participants were satisfied with the length of time it took to receive
their incentives, similar to 2009‐2010 evaluation results. The majority of 2011‐2012 non‐lighting
participants (56%) said they received their incentive check within four to six weeks (Figure 11), with 76%
receiving their incentive in six weeks or less. This is similar to the 74% who received their incentive in six
weeks or less in 2009‐2010.

68
Figure 11. Time it Took Non‐Lighting Participants to Receive Incentive*
Source: Rocky Mountain Power Wyoming HES Residential Non‐Lighting Survey Question F6.
* Cadmus removed “don’t know,” “refused” and “have not received the incentive yet” responses from this figure.
Cadmus also analyzed the participant‐reported wait times by measure category. As shown in Figure 12,
more than three‐quarters of participants who submitted applications for appliances (76%) and windows
(80%) reported receiving their incentives within six weeks. Over 40% of insulation participants however,
reported receiving their incentive more than six weeks after submitting their incentive application.

69
Figure 12. Incentive Wait Time by Measure Category*
Source: Rocky Mountain Power Wyoming HES Residential Non‐Lighting Survey Question F6.
* Cadmus removed “don’t know,” “refused” and “have not received the incentive yet” responses from this figure; HVAC customers were not included in this survey for Wyoming.
In addition, Cadmus analyzed application processing data provided by the program administrator.37 As
shown in Table 58, the program administrator’s tracking data indicated 3% of applications took longer
than 45 days to process, compared to 23% of participants who reported waiting more than six weeks to
receive their incentive. According to Rocky Mountain Power, the program administrator is required to
pay all incentives within 45 days of receiving a complete application from a customer; however
respondents may be reporting from the time that they submitted an incomplete application. As
indicated by the data, the number of applications paid after the 45‐day requirement decreased during
the evaluation period to 0% in the latter half of 2012.
37 The application processing data provided by the program administrator did not include information for Q1‐Q3
of 2011, and includes Rocky Mountain Power and PacifiCorp five service territories (Washington, Idaho, Utah, and California).

70
Table 58. Program Administrator Application Payment Tracking
Quarter Total Applications Paid Number of Applications Taking Longer Than 45
Days
Percent of Applications Taking Longer than 45 Days
Q4 2011 636 52 8%
Q1 2012 893 34 4%
Q2 2012 756 22 3%
Q3 2012 467 ‐ 0%
Q4 2012 1,178 ‐ 0%
Evaluated Period (Q4 2011‐2012) 3,930 108 3%
Customer Familiarity with Energy‐Efficient Lighting Options
Figure 13 illustrates familiarity with CFLs reported by surveyed lighting customers. The majority of 2011‐
2012 lighting customers were familiar with CFLs (85%), compared to 86% who reported being familiar
with CFLs in 2009‐2010.
Figure 13. Familiarity with CFLs among Lighting Customers
Source: Rocky Mountain Power Wyoming Residential Lighting Survey Questions C3.
* Cadmus removed “don’t know” and “refused” responses from this figure;
Totals may not sum to 100% due to rounding.
The majority of surveyed customers also reported familiarity with LEDs. Forty‐six percent reported being
“somewhat familiar” and 26% reported being “very familiar.” In 2009‐2010, 52% said they were
generally familiar with LEDs. Rocky Mountain Power staff reported plans to add LEDs to the program in
future program years.

71
In‐territory lighting survey responses indicated lighting customers prefer CFLs to other energy‐efficient
lighting options. When presented with a choice to purchase a more efficient incandescent bulb, a CFL,
an LED, or a halogen bulb, over a third (33%) of lighting customers chose CFLs.
Figure 14 illustrates an increase in customer LED preference, from 7% in 2009‐2010 to 16% in 2011‐
2012.38 CFLs remain the preferred lighting technology for surveyed lighting customers, although CFL
preference has decreased since 2009‐2010 (from 39% to 33% in 2011‐2012).39 Further, customer
preference for incandescent bulbs has decreased from 30% in 2009‐2010 to 18% in 2011‐2012.40
“Other” responses included the best bulb for the room, the most efficient, and the least expensive.
Figure 14. Change in Lighting Preference among Customers*
Rocky Mountain Power Wyoming Residential Lighting Survey Question J4.
* Totals may not sum to 100% due to rounding.
Program Management and Staffing
Both Rocky Mountain Power and the program administrator said the management and administration of
the program is effective overall. Rocky Mountain Power and the program administrator reported
staffing was sufficient in 2011; however, both parties expressed there was a need for additional support
staff during 2012.
38 P‐value = 0.00; this difference is statistically significant (α=0.1). 39 P‐value = 0.09; this difference is statistically significant (α=0.1). 40 P‐value = 0.00; this difference is statistically significant (α=0.1).
72
Communication
Rocky Mountain Power and the program administrator reported that communication occurred almost
daily through phone and e‐mail, as well as standing weekly and monthly meetings. The monthly
meetings involved marketing, business, and retail and contractor channels. In addition, the Rocky
Mountain Power program manager received monthly summary reports from the program administrator
and has access to live data through the Salesforce dashboard.
Program Staff Training
The program administrator provides process protocols and procedures, such as quality control
procedures, invoice reviews, and program‐specific policies, to all employees. Additionally, the program
administrator offers several training sessions. All employees attend the following trainings and
meetings:
A program overview training, which provides background on Rocky Mountain Power and history
and status of the program;
A training covering confidentiality protocols;
A tariff training; and
Any interviews with partner groups relevant to the program (e.g. the engineering group or
outreach group).
Non‐management staff are also required to attend training on the Incentive Processing Center (IPC),
which covers the systems used and the customer experience.
Delivery Challenges
The program experienced two delivery challenges during the 2011 and 2012 program years, decreased
trade ally participation due to geographic constraints and flawed incentive applications.
Geography
The program administrator said barriers to trade ally participation included geographic characteristics
and field staff accessibility. Because of Wyoming’s rural nature and the great distances between
population centers, , maintaining a full‐time field staff able to provide consistent coverage and trade ally
outreach is difficult in this hard‐to‐reach market.
Rejected Incentive Applications
Program administrator staff reported that the instances of rejected customer incentive applications are
the biggest barrier to program delivery. Customer‐submitted incentive applications with incorrect or
missing information delay incentive processing, requires follow‐up with the customer, and increases
program costs. Despite this, four of seven interviewed trade allies reported assisting their customers in
completing the HES incentive application, and all three of these trade allies found the application easy to
fill out. Nearly all non‐lighting participants (96%) were satisfied with the application process.

73
Data provided by the program administrator suggests that incentive applications are rejected as a result of missing information or ineligibility. As shown in Figure 15, the majority of applications from each product type were rejected based on
missing information. Appliance applications have the highest instance of rejection based on ineligibility
(36%) compared to the other product types (each 30% or less).
Figure 15. Application Rejections by Product Type in Wyoming
The following list outlines the most common reasons applications were rejected due to missing
information:
Missing or insufficient supporting documentation: According to data provided by the
program administrator, the primary reason incentive applications were rejected due to
missing information in 2011‐2012 was because of missing or insufficient supporting
documentation, such as an invoice or proof of payment. While the HES Program’s appliance
incentive application requires only one supporting document, other product applications
require up to four attachments to qualify the equipment and show proof of trade ally
payment or installation. Overall, 17% of rejected applications were denied due to missing or
insufficient supporting documentation.
Missing specifications: The second most common reason applications were rejected due to
missing information was missing product or services specifications, such as the product’s
efficiency or model or serial number. Sixteen percent of rejected applications were
considered incomplete because of missing product or service specifications.
Missing customer information or home details: A third reason for form rejection was due to
missing customer information or home details. These fields include customer contact
information and household data, such as heating/cooling sources and demographics (i.e.,

74
income, gender, household size). Fourteen percent of the flawed applications in Wyoming
were rejected due to missing customer information or home details.
Using application rejection data provided by the program administrator, Figure 16 shows the
distribution of reasons incentive applications were rejected due to missing information by measure
category.
Figure 16. Top Reasons for Application Rejection Due to Missing Information in Wyoming*
*Totals may not sum due to rounding.
Table 59 compares the number of supporting documents required for each HES product application and
the associated rejection rate based on missing or insufficient supporting documentation. The rejection
rate for appliance applications, which require only an itemized receipt to show proof of payment, is
much lower than the rejection rates of the other products that require up to four supporting
documents.

75
Table 59. Rejection Rate due to Missing or Insufficient Supporting Documentation by Product Type and Number of Required Documents
Product Type Number of Required Supporting
Documents
Rejection Rate due to Missing/Insufficient Supporting
Documentation* Appliances (N=1,232) 1 19%
HVAC (N=70) Up to 4 26%
Insulation (N=249) Up to 3 51%
Windows (N=43) Up to 4 40%
* Cadmus calculated these rejection rates as the number of applications rejected due to missing/insufficient supporting documentation divided by the number of applications rejected due to missing information.
Cadmus conducted a literature review of utility‐sponsored prescriptive incentive programs’ application
forms from across the country to compare to, and identify best practices for, the Rocky Mountain Power
HES applications. Table 60 compares elements of the HES incentive application to best practice elements
identified as part of our literature review. The findings indicate that the incentive application uses some
of the common incentive application design best practices; however, there is room for improvement in
certain areas.

76
Table 60. HES Incentive Application Use of Best Practices
Application Best Practice Element 2012 HES Incentive Application Keep the incentive form length to a minimum
All product applications are four to five pages, which may be too much for customers or trade allies to fill out.
Distinctly separate important instructions or requirements from terms and conditions and other complicated language
Instructions are in clear language, in boxes separate from the input fields and terms and conditions.
HES applications use a graphic of a utility bill to help customers locate and fill out specific customer and eligibility information.
Measure qualifications are in the same font size or smaller than the rest of the application (though they are often bolded).
Eligibility requirements are located in the terms and conditions, and are not clearly explained in simple language elsewhere.
Keep participation procedures simple: documentation requirements should be reasonable and forms understandable
The appliance application only requires one supporting document; however, the incentive forms for other HES Program measures may require up to four attachments. This may be burdensome for the customer to prepare.
The revised 2012 HES incentive applications clearly state the required documents on the first page, making it easier for the customer to know which documents to save throughout their participation process.
The list of required documents includes vague, potentially confusing instructions explaining that participants must submit any additional required documentation as noted in the form’s incentive section.
Some products’ applications (e.g., HVAC and insulation) require additional technical workbooks; customers may not understand they are responsible for this requirement.
Reduce redundancy between supporting documentation and the form to improve the applications’ ease of use
The appliance application requires that customers fill out the model number, serial number, and quantity. Applications may be rejected if this information is missing, regardless of whether the needed information is included in the itemized invoice or receipt.
Encourage trade allies to fill out the paperwork through training or bonuses to decrease the number of rejected applications
Some of the technical information required for the HVAC and insulation applications seems more appropriate for the contractor to fill out than the customer (e.g., pre‐ and post‐installation R‐Values or contractor certification numbers).
The majority of trade allies reported assisting their customers in completing the HES incentive application.
Utilize a paperless application process The HES online applications cover most qualifying products, including appliances and light fixtures, but do not cover trade ally‐installed measures that require testing and documentation.
Although the appliance applications can be filled out and submitted online, participants are still required to mail their supporting documentation (i.e., receipts for purchased equipment).
Detailed findings from our literature review can be found in Appendix M.

77
Marketing
Approach and Overview
The program administrator staff works collaboratively with Rocky Mountain Power program
management to develop annual and quarterly strategic HES Program marketing plans across Rocky
Mountain Power’s territories.
Rocky Mountain Power and the program administrator focused the 2011 and 2012 HES Program
marketing strategies on engaging trade allies as marketing partners to drive program awareness and
customer participation. They designed the program marketing efforts to educate and encourage both
trade allies and customers to change their behavior and use less energy. In developing the program
marketing strategy and materials, the program administrator collaborated closely with Rocky Mountain
Power program staff to ensure that tactics and messaging were consistent with those employed by
PacifiCorp’s energy‐efficiency campaign, wattsmart, as well as with other DSM program outreach efforts
to increase overall awareness of Rocky Mountain Power’s programs and create positive brand
association for its customer base.
Objectives
While there are no specifically stated marketing goals for the program, the HES program administrator
developed the following objectives to inform the marketing strategies and tactics that were designed
and implemented in the 2011 and 2012 program years:
Leverage partnerships in efforts to increase program participation;
Increase traffic and interaction with online channels through the use of strong calls‐to‐
action to motivate online engagement and action;
Enhance trade ally communication channels in effort to promote increased education and
support;
Partner with PacifiCorp to coordinate efforts with those of the wattsmart campaign and
DSM program marketing to leverage utility brand association; and
Develop local approaches to communications in Rocky Mountain Power territories.
In developing the strategies and tactics outlined below, the program administrator used previously‐
conducted segmentation research and insights to inform messaging to the target audiences in Wyoming.
The program administrator conveyed state‐specific tactics and messages through the quarterly plans.
In 2011 and 2012, the program administrator focused HES Program outreach in Wyoming on reaching
rural customers, acknowledging that geography is a barrier in this Rocky Mountain Power service
territory. The program administrator focused messaging on the value of achieving energy independence.

78
Strategies and Tactics
Rocky Mountain Power executed marketing strategies and tactics through a number of channels by
various partners, as outlined below.
Customer Advertising: HES Program customer‐facing marketing tactics included print, direct
mail, and online advertising, as well as promotion through the program website, the Rocky
Mountain Power wattsmart Facebook page (social media), bill inserts, point‐of‐purchase
materials, and promotional events. The program administrator collaborated with and provided
content to the PacifiCorp Customer and Corporate Communications department to promote the
HES Program via social media; however, this was not the program administrator’s direct
responsibility.
Trade Allies’ Promotion and Support: The program administrator worked directly with retailers
and trade allies to make sure they knew of the program and available incentives and to provide
them with promotional materials. Retailers and trade allies, in turn, promoted the program to
customers to increase sales of high‐efficiency equipment and products. Trade ally support and
promotion included on‐boarding/training, program marketing materials, newsletters, site‐visits,
point‐of‐purchase materials, partnerships with local retailers, and cooperative advertising
opportunities.
Engaging Partnerships: The HES program administrator built partnerships to foster cross‐
promotion with similar programs (such as those offered by gas utilities, as well as Home
Performance with ENERGY STAR® and DSM programs).
Effectiveness
According to the 2011 and 2012 marketing plans, the program administrator measured the effectiveness
and response of the program’s marketing strategies and tactics through a variety of methods, such as
call center reporting, incentive redemptions, Google analytics, campaign URL tracking, event surveys,
advertising impressions, referrals, media pick‐ups, retailer surveys, and retailer site visits.
Customer Awareness
Program administrator staff indicated making significant efforts to improve sponsorship awareness of
the HES lighting incentives. In 2011, the program administrator increased the variety of lighting
materials provided to participating retailers, creating an entire suite of new in‐store bulb materials for
consumers. Examples of the new lighting materials include:
Updated lighting point‐of‐purchase materials (e.g. shelf flaps, shelf strips);
A new retail CFL lighting kiosk for discounted bulbs, updated end cap displays, and
educational/promotional booklets;
A brochure describing the different types of bulbs;
Information about CFL recycling and CFL recycling stations set up in retail stores; and
A list of all store locations offering program discounted bulbs on the HES website.

79
However, similar to the 2009‐2010 HES evaluation, the majority of lighting customers are still unaware
that CFLs are discounted through the HES Program. Of the 250 lighting participants surveyed, only 8%
(20 customers) knew that Rocky Mountain Power discounted CFLs through the HES Program, compared
to 9% in the 2009‐2010 survey. Of those 8%, the majority (11 of 20 customers) learned of the program
through bill inserts.
Retailers continue to drive non‐lighting program participation. Non‐lighting participants’ reported that
their primary source of HES Program awareness was a retailer or store (48%; Figure 17). This is
compared to 52% in 2009‐2010.
Figure 17. How Non‐Lighting Participants Learned About the HES Program*
Source: Rocky Mountain Power Wyoming HES Residential Non‐Lighting Survey Question M1.
* Total may not sum to 100% due to rounding.
According to the program administrator, strategic product placement and in‐store point‐of‐purchase
signage at retailers is the most effective way to drive sales, particularly through aisle end‐cap displays.
To assess whether retailers only promoted products typically sold in retail stores or if they also drove
awareness for contractor‐install measures, Cadmus compared non‐lighting participants’ reported
sources of program awareness by the type of measure they had installed. As evident in Table 61 retailers
were the primary source for generating awareness of the HES Program for retailer measures (53%).
Retailers also generated awareness for contractor‐installed measures (14%), though the main sources of
awareness for contractor‐installed measures were Rocky Mountain Power representatives (16%) and

80
word‐of‐mouth (15%). Contractors generated a significant level of awareness for contractor‐installed
measures (13%) as well.
Table 61. HES Program Awareness by Non‐Lighting Measure Type*
Source Measure Category
Contractor‐Installed (n=77)
Retailer (n=266)
Retailer/Store 14% 53%
Rocky Mountain Power Representative 16% 3%
Family/Friends/Word‐of‐Mouth 15% 5%
Bill Inserts 13% 16%
Contractor 13% ‐
Newspaper/Magazine/Print Media ‐ 6%
TV 9% 4%
Online 5% 6%
Social Media 4% ‐
Radio ‐ 1%
Billboard/Outdoor Ad ‐ 1%
Other 2% 1%
Don’t Remember 9% 6%
Source: Rocky Mountain Power Wyoming HES Residential Non‐Lighting Survey Question MS1. * Totals may not sum to 100% due to rounding.
Four of the seven surveyed trade allies said they market the HES Program to customers, and all seven
said they received marketing materials from Rocky Mountain Power or the program administrator.
Three of the trade allies indicated that they had received program materials, including brochures and
handout. Six of the seven surveyed trade allies said they recommend energy‐efficient equipment
options to their customers.
The program administrator coordinates with Rocky Mountain Power to ensure that program marketing
appropriately leverages the wattsmart general awareness campaign and brand. This allows them to
avoid overlaps in messaging and outreach and avoid customer confusion.
According to Rocky Mountain Power, the wattsmart campaign made extensive use of paid media to
drive broad‐based energy‐efficiency awareness, while the HES Program used more traditional methods
and channels for targeted outreach and program promotion. Additionally, by associating HES Program
marketing with wattsmart’s messaging and branding, Rocky Mountain Power is able to cross‐market
with other programs to increase overall customer awareness.
HES Online Marketing
The 2011‐2012 lighting survey revealed 5% of lighting customers have visited the HES website,
compared to 8% in 2009‐2010. In 2011‐2012, 26% of non‐lighting participants visited the website,

81
compared to 18% in 2009‐2010.41 Of the non‐lighting participants who had visited the website, 94%
found it helpful.
The program administrator provided Cadmus with a Google Analytics ‘Traffic Overview’ report to
analyze HES program website traffic. Table 62 shows the comparison of visits to the HES program
webpage from 2011 to 2012. The Google Analytics traffic data indicates a significant increase (53%) in
traffic to the program webpage from 2011 to 2012.
Table 62. HES Website Traffic
Website Traffic 2011 Visitors 2012 Visitors HES Website* 63,942 97,950
* Traffic data is not state‐specific and includes all visitors driven to the general HES website (http://www.homeenergysavings.net).
The detailed findings from our analysis of the HES Program’s use of website best practices are included
in Appendix L. The findings indicate that the program website largely uses common online energy‐
efficiency program marketing best practices.
Rocky Mountain Power social media channels include Facebook, Twitter, and YouTube. PacifiCorp’s
Customer and Community Communications department conducts all social media efforts, including
developing social media strategy and implementing tactics. The HES program administrator actively
develops and provides program content to PacifiCorp’s Customer and Community Communications
department for inclusion on channels such as Facebook and Twitter. Program‐specific content provided
by the program administrator includes social media posts regarding savings, promotions, marketing
campaigns, and upcoming events.
Cadmus reviewed the extent to which Rocky Mountain Power’s social media strategy supports its
energy‐efficiency programs. As of June 2013, Rocky Mountain Power’s wattsmart Program Facebook
page had 876 ‘likes,’ and featured photos, informational videos, and customer polls, as well as
educational energy‐efficiency tips and links to programs and incentives.
The detailed findings from our analysis of the HES Program’s use of social media best practices are
included in Appendix L.
Trade Ally Awareness
The program administrator said that energy efficiency is hard to sell in Wyoming, particularly due to the
large oil and gas industry. Therefore, few trade allies actively promote and install HES Program
measures. The program administrator said they actively look for more trade allies in the state Most of
the surveyed participating trade allies reported being very or somewhat satisfied with the program, as
shown in Table 63.
41 P‐value = 0.03; this difference is statistically significant (α=0.1).

82
Table 63. Trade Allies’ Reported Satisfaction
Reported Satisfaction Number of Trade Allies
Very satisfied 3
Somewhat satisfied 3
Not too satisfied 1 Source: Rocky Mountain Power Wyoming HES Trade Ally Survey Question F5.
The marketing tactics used by the program administrator to recruit trade allies included calls, in‐person
visits, and measure‐specific marketing collateral. The program administrator found that the most
effective method for recruitment in Wyoming was direct engagement through calls and follow‐up site
visits.
Three of seven surveyed trade allies learned of the HES Program through a customer, and one learned
through HES Program staff. The remaining three reported not remembering how they learned of the
program.
Customer Response
Lighting Purchasing Decisions
Cadmus asked participants of the lighting phone survey what factors motivated them to purchase CFL or
LED bulbs. In 2011‐2012, 42% of customers who purchased CFLs said it was to save energy, and 31% said
the influencing factor was the lifetime of the bulb (Figure 18).

83
Figure 18. Factors Influencing Lighting Customer’s Decision to Purchase CFLs*
Source: Rocky Mountain Power Wyoming HES Residential Lighting Survey Question E8.
* Multiple responses allowed.
Of the 28 customers who purchased LEDs in 2011‐2012, 10 said the influencing factor was the quality of
light, followed by the lifetime of the bulb (6 customers) and energy savings (5 customers). 42
Non‐Lighting Participation Decisions
Of 2011‐2012 non‐lighting participants, 29% said the motivating factor to purchase energy‐efficient
measures was that their old equipment was not working, or was working poorly (compared to 34% in
2009‐2010; Figure 19). Non‐lighting participants also reported saving energy was a motivating factor
(20%, compared to 18% in 2009‐2010). In 2011‐2012, 9% of participants said their motivation was a
recommendation from a contractor, other utility, or retailer, up from 4% in 2009‐2010.43
42 LEDs were not sold through the program in 2011‐2012; however, the lighting survey asked customers about
general LED purchases. 43 P‐value = 0.02; this difference is statistically significant (α=0.1).

84
Figure 19. Factors Motivating Non‐Lighting Participants to Purchase Energy‐Efficient Measures*
Source: Rocky Mountain Power Wyoming HES Residential Non‐Lighting Survey Question M4.
* Cadmus removed “don’t know” and “refused” responses from this figure;
Totals may not sum to 100% due to rounding.
Cadmus compared HES non‐lighting customers’ participation motivations to survey results from recent
evaluations conducted across the country. Figure 20 shows the top four motivating factors compared
across three residential prescriptive programs similar to HES. By comparison, a higher percentage of HES
non‐lighting participants were motivated to purchase energy efficient equipment through a utility‐
sponsored program to save energy than were participants in the compared programs.

85
Figure 20. Benchmarking of Customer Participation Motivations
Satisfaction
Figure 21 shows satisfaction among CFL and LED customers. In 2011‐2012, 91% of CFL customers were
satisfied with their CFLs, compared to 80% in 2009‐2010. Similarly, 89% of 2011‐2012 LED customers
were satisfied with the LEDs installed in their homes, compared to 84% in 2009‐2010.

86
Figure 21. Lighting Participant Satisfaction with CFLs and LEDs
Rocky Mountain Power Wyoming Residential Lighting Survey Questions G1 and M8.
* Cadmus removed “don’t know” and “refused” responses from this figure;
Totals may not sum to 100% due to rounding.
Cadmus compared customer satisfaction with CFLs to survey results from recent lighting program
evaluations conducted across the country. By comparison, HES customers’ CFL satisfaction is high. As
shown in Table 64, only one program achieved a higher satisfaction rating than the HES Program. In
addition, HES customer satisfaction with LEDs (89%) was higher than the satisfaction rate reported in a
2011 evaluation of a Maryland utility’s lighting program, where 84% of lighting customers were satisfied
with LEDs.
Table 64. Benchmarking of CFL Satisfaction
Program Sponsor State Evaluated Year(s) CFL Satisfaction Rate Rocky Mountain Power Wyoming 2011‐2012 91%
Central Northeastern utility Ohio 2011 91%
New England program administrator Maine 2011 81%
South Atlantic utilities Maryland 2011 82%
Central Northwestern utility (1) Missouri 2011 95%
Central Northwestern utility (2) Minnesota 2011 76%
The non‐lighting surveys revealed that customer satisfaction remains high. In 2011‐2012, 95% of
participants were satisfied with the HES Program, compared to 94% in 2009‐2010 (Figure 22).

87
Figure 22. Non‐Lighting Participant Satisfaction with HES Program*
Source: Rocky Mountain Power Wyoming HES Residential Non‐Lighting Survey Question F9.
* Cadmus removed “don’t know” and “refused” responses from this figure;
Totals may not sum to 100% due to rounding.
Quality Assurance The program administrator conducts on‐site quality control (QC) inspections on 5% of all HVAC and
weatherization installations, ensuring “service measure” installations have been conducted to HES
Program standards. The program administrator also performs quality inspections at all participating
retail locations to ensure participating retailers are correctly displaying all provided promotional
materials.
In response to concerns that arose in 2009 regarding “blow and go” insulation contractors, Rocky
Mountain Power made program changes in 2010 to alleviate this concern. In addition, Rocky Mountain
Power adopted more rigid standards for weatherization projects in late 2012, based on Building
Performance Institute protocols. This change required trade allies to attend free weatherization training
to be eligible to complete projects through the program. In effect, all HES Program weatherization
projects must be completed by these trained, participating contractors. To further ensure high quality
work, Rocky Mountain Power put all questionable trade allies on a “watch list” and began conducting
inspections on 100% of their projects submitted through the program
Rocky Mountain Power reported that the more stringent quality assurance protocols have been
effective in mitigating quality concerns and has removed nearly all unreliable contractors from the HES
Program.

88
To provide additional quality assurance for the HES Program, Rocky Mountain Power contracted with
Cadmus to conduct verification site visits for a sample of insulation measures. Findings from these
inspections are included in the Appliances, HVAC, and Weatherization Impact Analysis section of this
report.

89
Overall Conclusions
Based on the above findings, Cadmus has drawn the following conclusions:
Measure Offerings and Standards The HES Program experienced freeridership ranging from 34% (standard CFLs) to 53% (dishwashers).
Clothes washers, refrigerators, and dishwashers received a freeridership score in the high 40% to low
50% range. CFL freeridership was higher for specialty bulbs (50% vs. 34% for standard), which is not
unexpected as specialty style bulbs typically cost more and incentives do not cover as much of the sale
price as say a standard CFL (higher incentives for specialty bulbs are not always warranted because
savings are not necessarily higher).
Data Collection and Reporting The non‐lighting database contained no duplicates; however, measure name and classification
differences in the program administrator database were difficult to reconcile with the filed annual
reports.
Lighting Retailer Allocation Overall, Cadmus supports the program administrator’s methodology for calculating and minimizing CFL
leakage. The process is innovative, and considers the relevant factors. Their approach and due diligence
is above what Cadmus typically observes in other utility services areas.
EISA Although the EISA standards took effect in January 2012 with the phase out of 100‐watt incandescent
bulbs, very few telephone surveyed participants recognized the effects of the legislation when trying to
purchase these bulbs. Furthermore, results from two separate studies conducted in the Midwest
suggest that many retailers retain inventories of incandescent bulbs that are no longer EISA compliant
many months after the effective EISA phase‐out dates. Although other studies have shown that 100‐
watt incandescent bulbs were available through 2012, no direct data in Wyoming or in the Western
portion of the U.S. was available to support this. While 100‐watt bulbs do not make up a large
proportion of HES savings, this information will be particularly useful for when 60‐ and 40‐watt bulbs are
regulated under EISA starting in 2014.
Customer Preference While CFLs remain the preferred energy‐efficient lighting option among customers purchasing efficient
lighting, preference for LEDs is increasing. Plans to add LEDs and continuing to offer specialty CFLs
through the program should help Rocky Mountain Power capture some of the potential savings resulting
from this market transition.

90
According to the United States Environmental Protection Agency,44 lighting programs have new
opportunities to achieve energy savings by shifting from CFL‐only programs to a diverse portfolio
approach that includes specialty CFLs, LED bulbs, as well as continued support for standard CFLs.
Standard CFLs will continue to make up a significant portion of rebated bulbs in the near term, but the
declining cost and growing number of ENERGY STAR‐qualified LED bulbs makes them an increasingly
viable program option.
Lighting Program Sponsorship There continues to be a lack of awareness among lighting customers that the upstream lighting products
they purchased were incented through the Rocky Mountain Power HES Program. Low sponsorship
awareness is a consistent finding among lighting programs across the country. Despite efforts to
increase customer awareness of the HES lighting program, sponsorship awareness has remained
consistent with the 2009‐2010 evaluation. Although most HES Program savings continue to accrue
through the lighting component, very few lighting customers know that Rocky Mountain Power’s HES
Program provides CFL discounts. However, the significant amount of program savings achieved by the
HES lighting component indicates that the program marketing is effective at promoting program bulbs.
Trade Ally Support Trade allies have not yet recognized the program administrator’s increased outreach and support
efforts. Although the program administrator increased efforts to support program trade allies, none of
the trade allies that participated in the program prior to these increased efforts have recognized a
change in the frequency of in‐person communication or level of support provided by administrator staff
yet. Even so, trade allies expressed satisfaction with the level of support they receive from program
staff, and found that their affiliation with the HES Program has been effective in generating new
business for their company.
Although trade allies have not yet recognized the program administrator’s increased support efforts,
this revised system is fairly new and should be allowed to mature.
Drivers of Awareness Retailers are driving a significant portion of lighting and non‐lighting program participation. In addition
to driving the program’s lighting participation, retailers are a driver of non‐lighting participation in both
the retailer and contractor‐installed measure categories.
44 United States Environmental Protection Agency. Next Generation Lighting Programs: Opportunities to Advance
Efficient Lighting for a Cleaner Environment. EPA 430‐R11‐015. October 2011. Available online:
http://www.energystar.gov/ia/partners/manuf_res/downloads/lighting/EPA_Report_on_NGL_Programs_for_
508.pdf.
91
Application Processing The HES Program experienced instances of rejected customer incentive applications due to missing
information. Customer‐submitted incentive applications with flawed information delay the incentive
processing, requires follow‐up with the customer, and increases program costs. This was identified as a
barrier to program implementation by the program administrator.
Missing information on an incentive application is often due to customer or trade ally oversight when
completing the form. Most commonly, this missing data is customer or household information, or a
piece of technical data such as the equipment’s efficiency or a model or serial number. Language
describing the application’s technical data requirements should be kept as simple and concise as
possible. The use of informative graphics that illustrate examples of where technical data may be found
on the purchased equipment (e.g., on the EnergyGuide label) can increase customers’ understanding of
what data is required on the form. To further reduce the number of applications rejected based on
missing information, the program administrator should only reject applications that are lacking critical
information required to verify eligibility or calculate savings.
The rate of rejection increases with the number of supporting documents an application requires. While
the HES Program’s appliance incentive application requires only one supporting document, the
program’s other measure incentives require up to five attachments to qualify the equipment and show
proof of trade ally payment or installation. This may be burdensome for the customer to compile, and
increases the chance for confusion. Reducing redundancy between supporting documentation and the
form may improve the applications’ ease of use.
Program Website Traffic to the HES Program website has increased since the 2009‐2010 evaluation. Customers and
contractors are increasingly seeking program and educational information online. To meet the demands
of these heavy online users, Rocky Mountain Power improved their HES Program online presence by
adding incentive applications and largely using common energy‐efficiency program online marketing
best practices. These enhancements have made the program website increasingly helpful for customers.
wattsmart Brand Differentiation Customers may not be differentiating the wattsmart brand from the HES Program. Rocky Mountain
Power’s wattsmart campaign made extensive use of paid media to drive broad‐based energy‐efficiency
awareness, while the HES Program used more traditional outreach methods. Although the hierarchy
between the overarching, broad‐based energy‐efficiency awareness (wattsmart) campaign and the HES
Program are clearly laid out and distinct, the differences may not be obvious to customers. This
potential confusion may have contributed to a high percentage of customers that reported learning
about the HES Program through mass media outlets, such as TV and print even though the HES program
ran little advertising through this media. However, when customers associate the HES Program
marketing with wattsmart’s messaging and branding, it increases cross‐marketing opportunities, overall
customer awareness, and positive brand affinity with the campaign and associated programs.

92
Customer Response Program satisfaction generally runs high. Similar to the previous evaluation cycle, surveyed customers
expressed high satisfaction levels with the measures installed and their overall program experience.
93
Overall Recommendations
Based on the above conclusions, Cadmus has the following recommendations to improve the program:
Data Collection and Reporting While measure name and classification differences in the program administrator database had no
impact on the overall savings, Cadmus recommends that the program administrator and Rocky
Mountain Power standardize the measure naming conventions to improve the ability to replicate and
compare program data to filed reports.
Lighting Retailer Allocation If the program administrator and Rocky Mountain Power deem it necessary to refine the current lighting
retailer allocation approach, our suggestions for future analysis include:
Review the confidence surrounding geocoded addresses to ensure that store locations are
accurately mapped.45
Consider using Rocky Mountain Powers actual service area territory boundary46 to refine the
model. Estimating utility service areas by ZIP codes aggregates data into larger‐than‐necessary
geographic areas and requires the utility weighting process described above. Experian’s
Marketing Mosaic® USA software provides household counts in census block groups; the
program administrator could maintain this more granular geography throughout the analysis.
EISA Cadmus recommends Rocky Mountain Power monitor light bulb sales for bulbs impacted by EISA. There
is sufficient evidence in studies outside of the Southwest that indicate bulbs impacted by EISA are still
available to customers well after the legislation takes effect. A cost‐effective method for determining
how long store inventories last is to survey retailers about whether certain incandescent bulbs are
available to purchase. This type of survey effort would allow Rocky Mountain Power to determine when
the baseline wattages of bulbs in their program planning should change.
Drivers of Awareness Cadmus recommends prioritizing trade ally recruitment and outreach efforts to retailers. When deemed
cost‐effective and permissible by retail managers, expand program training efforts for retail staff to
ensure new and existing participating retailers are engaged in the HES Program and have a
comprehensive understanding of the current program offering.
45 Cadmus had a phone conversation with a Buxton Company representative who confirmed that this capability
is built into MicroMarketer’s geocoder. 46 GIS data layers can usually be obtained directly from utilities.

94
Application Processing The HES incentive applications utilize some of the common form design and submission best practices;
however, there may be room for improvement in certain areas. In order to reduce the number of
rejected applications, Cadmus recommends incorporating as many of the best practices stated in
Appendix I into the HES incentive forms as deemed cost‐effective. Cadmus suggests prioritizing the
following:
Keep the incentive form length to a minimum.
Encourage trade allies to fill out the paperwork through training or bonuses to decrease the
number of rejected applications.
Utilize a paperless application process for all incentive applications.
95
Cost‐Effectiveness
In assessing HES Program cost‐effectiveness, Cadmus analyzed program costs and benefits from five
different perspectives, using Cadmus’ DSM Portfolio Pro47 model (the same as was used for other recent
evaluations of Rocky Mountain Power’s residential portfolio). Cadmus based the benefit/cost ratios
conducted for these tests on methods described in the California Standard Practice Manual for assessing
DSM programs’ cost‐effectiveness. These five tests were:
1. PacifiCorp’s Total Resource Cost (PTRC) Test: This test examined program benefits and costs
from Rocky Mountain Power’s and Rocky Mountain Power customers’ perspectives, combined.
On the benefit side, it included avoided energy costs, capacity costs, a transmission and
distribution investment deferral benefit, a stochastic risk reduction benefit, the medium CO2 tax
scenario benefit and line losses, plus a 10% adder to reflect non‐quantified benefits. On the cost
side, it included costs incurred by both the utility and participants.
2. Total Resource Cost (TRC) Test: This test also examined program benefits and costs from Rocky
Mountain Power’s and Rocky Mountain Power customers’ perspectives, combined. On the
benefit side, it included avoided energy costs, capacity costs, a transmission and distribution
investment deferral benefit, a stochastic risk reduction benefit, the medium CO2 tax scenario
benefit and line losses. On the cost side, it included costs incurred by both the utility and
participants.
3. Utility Cost Test (UCT): This test examined program benefits and costs from Rocky Mountain
Power’s perspective only. The benefits included avoided energy, capacity costs, a transmission
and distribution investment deferral benefit, a stochastic risk reduction benefit, the medium CO2
tax scenario benefit and line losses. The costs included program administration,
implementation, and incentive costs associated with program funding.
4. Ratepayer Impact Measure (RIM) Test: All ratepayers (participants and nonparticipants) may
experience rate increases designed to recover lost revenues. This test included all Rocky
Mountain Power program costs and lost revenues. The benefits included avoided energy costs,
capacity costs, a transmission and distribution investment deferral benefit, a stochastic risk
reduction benefit, the medium CO2 tax scenario benefit and line losses.
5. Participant Cost Test (PCT): From this perspective, program benefits included bill reductions and
incentives received. Costs included a measure’s incremental cost (compared to the baseline
measures), plus installation costs incurred by the customer.
Table 65 summarizes the five tests’ components.
47 DSM Portfolio Pro has been independently reviewed by various utilities, their consultants, and a number of
regulatory bodies, including the Iowa Utility Board, the Public Service Commission of New York, the Colorado
Public Utilities Commission, and the Nevada Public Utilities Commission.

96
Table 65. Benefits and Costs Included in Various Cost‐Effectiveness Tests
Test Benefits Costs
PTRC Present value of avoided energy and capacity
costs*, with 10% adder for non‐quantified benefits
Program administrative and marketing costs and
costs incurred by participants
TRC Present value of avoided energy and capacity costs* Program administrative and marketing costs and
costs incurred by participants
UCT Present value of avoided energy and capacity costs* Program administrative, marketing, and incentive
costs
RIM Present value of avoided energy and capacity costs* Program administrative, marketing, and incentive
costs, plus the present value of lost revenues
PCT Present value of bill savings and incentives received Incremental measure and installation costs
* The present value of avoided energy and capacity costs includes avoided line losses occurring from reductions in
customer electric use. It also includes a transmission and distribution investment deferral benefit, a stochastic risk
reduction benefit, and the medium CO2 tax scenario benefit.
Table 66 provides selected cost analysis inputs for each year, including the evaluated energy savings,
discount rate, line loss, inflation rate, and total program costs. Rocky Mountain Power provided all of
these values, except for the energy savings, and except the discount rate, which Cadmus derived from
Rocky Mountain Power’s 2011 Integrated Resource Plan.
Table 66. Selected Cost Analysis Inputs
Input Description 2011 2012 Total
Evaluated Energy Savings (kWh/year) 4,044,327 4,781,588 8,825,915
Discount Rate 7.17% 7.17% N/A
Line Loss 7.96% 9.51% N/A
Inflation Rate 1.80% 1.80% N/A
Total Program Costs $1,038,999 $810,231 1,849,230
* The evaluated energy savings reflect impacts at meter.** Line losses were updated in 2012 from the PacifiCorp Electric Operations Loss Study.
For the cost‐effectiveness analysis, Cadmus used this study’s evaluated energy savings and measure
lives from other sources such as the Regional Technical Forum.48 For all analyses, Cadmus used the
avoided costs associated with Rocky Mountain Power’s 2011 IRP Eastside Decrements.49
Cadmus analyzed HES Program cost‐effectiveness for two scenarios. The first assumed no freeridership
or spillover (NTG equaling 100%). The second incorporated the evaluated freeridership and spillover.
48 See Appendix N for detailed cost‐effectiveness inputs and results at the measure group level. 49 The IRP decrements are detailed in Addendum, Chapter 2 of PacifiCorp’s 2011 Integrated Resource Plan:
http://www.pacificorp.com/content/dam/pacificorp/doc/Energy_Sources/Integrated_Resource_Plan/2011IRP
/2011IRP‐Addendum_20110627.pdf.

97
Table 67 presents the 2011‐2012 program cost‐effectiveness analysis results with NTG equaling 100%.
For this scenario, the HES Program was cost‐effective from all perspectives except the RIM test (a 1.0 or
greater benefit/cost ratio is considered cost‐effective).
The RIM test measures the impact of programs on customer rates. Many programs do not pass the RIM
test because a utility’s avoided energy savings are usually less than the lost revenues and operating
costs of the program. The RIM test only passes if rates will go down as a result of the program, and this
happens infrequently when the program targets the highest marginal cost hours (when marginal costs
are greater than rates).
Table 67. HES Program Cost‐Effectiveness Summary for 2011–2012 (NTG = 1.0)
Cost‐Effectiveness Test Levelized
$/kWh Costs Benefits Net Benefits
Benefit/Cost
Ratio
PTRC $0.070 $3,289,707 $4,124,534 $834,827 1.25
TRC $0.070 $3,289,707 $3,749,576 $459,870 1.14
UCT $0.038 $1,795,024 $3,749,576 $1,954,553 2.09
RIM $6,074,818 $3,749,576 ($2,325,242) 0.62
PCT $2,399,496 $5,184,608 $2,785,112 2.16
Lifecycle Revenue Impact
($/kWh) $0.000018112
Discounted Participant
Payback (Years) 2.51
Table 68 presents the 2011‐2012 program cost‐effectiveness analysis results including the evaluated
NTG. For this scenario, the HES Program was cost‐effective from all perspectives except the TRC and RIM
perspectives.
Table 68. HES Program Cost‐Effectiveness Summary for 2011–2012 (Evaluated NTG)
Cost‐Effectiveness Test Levelized
$/kWh Costs Benefits Net Benefits
Benefit/Cost
Ratio
PTRC $0.082 $2,609,548 $2,813,891 $204,343 1.08
TRC $0.082 $2,609,548 $2,558,083 ($51,465) 0.98
UCT $0.056 $1,795,024 $2,558,083 $763,059 1.43
RIM $4,719,684 $2,558,083 ($2,161,601) 0.54
PCT $2,399,496 $5,184,608 $2,785,112 2.16
Lifecycle Revenue Impact
($/kWh) $0.000016837
Discounted Participant
Payback (Years) 2.51
Table 69 presents the 2011 program cost‐effectiveness analysis results including the evaluated NTG. For
this scenario, the HES Program was only cost‐effective from the UCT and PCT perspectives.
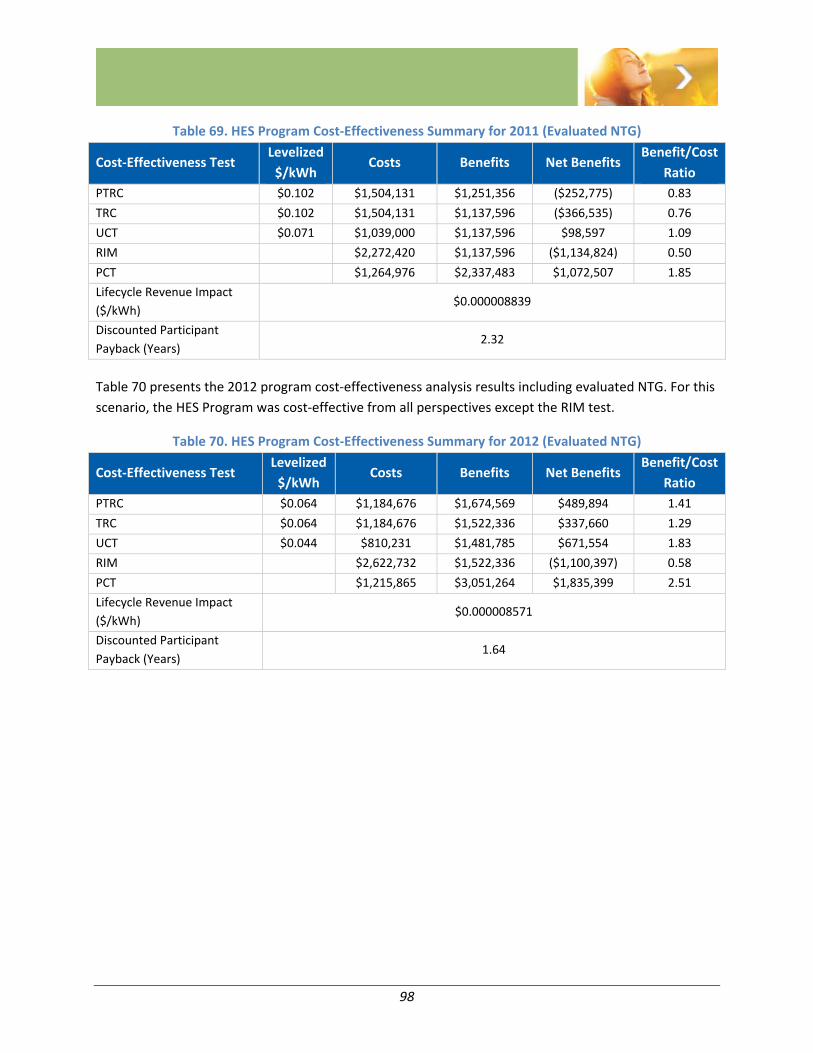
98
Table 69. HES Program Cost‐Effectiveness Summary for 2011 (Evaluated NTG)
Cost‐Effectiveness Test Levelized
$/kWh Costs Benefits Net Benefits
Benefit/Cost
Ratio
PTRC $0.102 $1,504,131 $1,251,356 ($252,775) 0.83
TRC $0.102 $1,504,131 $1,137,596 ($366,535) 0.76
UCT $0.071 $1,039,000 $1,137,596 $98,597 1.09
RIM $2,272,420 $1,137,596 ($1,134,824) 0.50
PCT $1,264,976 $2,337,483 $1,072,507 1.85
Lifecycle Revenue Impact
($/kWh) $0.000008839
Discounted Participant
Payback (Years) 2.32
Table 70 presents the 2012 program cost‐effectiveness analysis results including evaluated NTG. For this
scenario, the HES Program was cost‐effective from all perspectives except the RIM test.
Table 70. HES Program Cost‐Effectiveness Summary for 2012 (Evaluated NTG)
Cost‐Effectiveness Test Levelized
$/kWh Costs Benefits Net Benefits
Benefit/Cost
Ratio
PTRC $0.064 $1,184,676 $1,674,569 $489,894 1.41
TRC $0.064 $1,184,676 $1,522,336 $337,660 1.29
UCT $0.044 $810,231 $1,481,785 $671,554 1.83
RIM $2,622,732 $1,522,336 ($1,100,397) 0.58
PCT $1,215,865 $3,051,264 $1,835,399 2.51
Lifecycle Revenue Impact
($/kWh) $0.000008571
Discounted Participant
Payback (Years) 1.64
99
Appendices
Please find this report’s appendices in a separate file.
Appendix A: Survey and Data Collection Forms
Appendix B: Precision Calculations
Appendix C: Program Incentives
Appendix D: Stored‐to‐Installed CFL Bulbs Savings
Appendix E: Hours‐of‐Use Methodology
Appendix F: Price Response Model
Appendix G: Attic, Floor, and Wall Insulation Billing Analysis
Appendix H: Non‐Lighting Engineering Reviews
Appendix I: Non‐Lighting NTG Evaluation Methodology
Appendix J: Non‐Lighting Freeridership Responses
Appendix K: Logic Model
Appendix L: Marketing Materials Review
Appendix M: Incentive Reward Application Benchmarking and Best Practices
Appendix N: Measure Group Cost‐Effectiveness

Appendix A1
Appendix A. Survey Instruments and Data Collection Tools
Appendix A. Survey Instrustments and Data Collection Tools………………………………………………………………..A1
1. Management Staff and Program Partner Interview Guide…………………………………………………………………A2
2. Participant Telephone Survey (Appliances, HVAC, and Weatherization)……………………………………………A7
3. Participant Contractor Survey………………………………………………………………………………………………………….A31
4. In‐Territory Lighting Survey……………………………………………………………………………………………………………..A44
5. Insulation Participant Site Visit Verification Form…………………………………………………………………………….A61

PacifiCorpHESStaffInterviewGuide
Program/Implementation Staff: Survey Date:
Contact Name: Interviewers:
Contact Phone Number: Contact Title:
[Make it clear to the interviewee, that this process evaluation interview covers the 2011 and 2012
program years, and to the extent possible, we would like to try to attach their responses (events,
activities referenced, transitions, evolution) to the appropriate program year and state.]
RolesandResponsibilities1. To begin, briefly describe your role in the HES program.
ProgramGoals2. Have there been any changes made to goals reported in the 2011 and 2012 annual reports?
a. Why were these changes made?
3. Does the program have any process goals? [e.g., participation of customers (including,
customers in all regions of the service territory; single family and multifamily, etc.), market
transformation, increased awareness, education of trade allies?]
a. Do you use metrics to track progress against these goals?
b. What are they?
4. How did the program perform against its goals in 2011 and 2012?
ProgramStatus5. How has the program progressed over the last two years (2011, 2012)?
a. What successes has the program seen?
6. What barriers or challenges has the program faced?
a. What was done to address them?
Appendix A2

2
7. Have there been any program design changes during the 2011 and/or 2012 program years?
(e.g., targeted customers, measures promoted, delivery process, incentive levels) [try to attach
program year to design changes and probe why they were made]
a. [IF NOT ALREADY MENTIONED] Specifically, has program delivery remained consistent
to that reported in the 2009‐2010 program years?
b. Are any program design changes planned for future program years?
8. Were any program design changes made (including changes to the program’s marketing and
education components) in response to the EISA legislation and/or the phase out of 100‐watt
incandescent bulbs?
9. Do you have suggestions for improving the program?
TradeAllies(RetailersandContractors)10. Are you continuing to actively recruit new trade allies to participate in the program?
11. How [are/were] trade allies targeted?
12. What type of outreach tactics [do/did] you use to recruit trade allies to the program?
a. What [are/were] the most effective recruitment methods?
13. About how many trade allies are participated in the program during 2011 and 2012?
14. What level of interaction do you have with them (e.g., do you provide training)?
15. Are trainings offered to trade allies to expand their technical abilities or understanding of the
program operations and participation requirements?
a. If so, what kind of training?
b. How does it work? What does it cost? What is included?
c. Is the training required to participate in the program?
d. If not, what level of participation have you seen at the trainings?
16. What type of trade allies are most active?
17. Has trade ally performance met your expectations?
a. How do you address issues that arise?
18. Are you aware of any trade ally overlap with NEEA’s ductless heat pump and heat pump water
heater efforts?
a. Are HES trade allies encouraged to participate in these type of statewide/regional
efforts?
19. What benefits or incentives are offered to participating trade allies?
20. What role do trade allies play in marketing the program?
Appendix A3

3
a. Are they incented to promote the program? How? Are these incentives effective?
b. What program materials are provided to trade allies?
ProgramMarketing21. Please describe how the HES marketing initiatives are planned and implemented. [Probe:
Collaborative process between utility and implementer?]
22. Do you have an updated marketing plan for the 2011 and 2012 program years?
a. What are the goals and objectives?
b. Who are the primary audiences?
c. Does the marketing plan identify market barriers? If so, how do marketing materials
mitigate the market barriers for this program?
23. What marketing tactics and channels are used to promote the program? [Probe for details on
channels and tactics, such as the type of media, events, newsletters, social media, etc.]
a. Do all five states utilize the same marketing plans and tactics?
b. How does the messaging differ in the five different states?
c. Is your messaging more focused on general efficiency program marketing or program
specific marketing?
24. What are the most effective methods and messages?
a. Are different marketing methods more effective in some states than in others?
b. How do you measure marketing effectiveness?
c. What types of metrics are being tracked?
25. What do you see as future challenges to marketing the HES program?
26. What are the goals and objectives of the wattsmart general awareness program/campaign?
a. What are the marketing tactics and channels used to promote the program?
b. How do you differentiate the HES and wattsmart messaging?
InternalProgramManagement27. Were the 2011 and 2012 program budgets sufficient to support implementation and
achievement of the program goals?
a. What about staffing?
28. Do you feel management and administration is effective overall?
a. Are there any areas for improvement?
Appendix A4

4
ExternalProgramManagement29. How has the relationship been with [PacifiCorp/PECI]?
30. How have communications been with [PacifiCorp/PECI]?
a. How frequently do you communicate with [PacifiCorp/PECI]?
b. What communication methods are used?
31. Are there any areas of your relationship with [PacifiCorp/PECI] that need to be improved?
CustomerResponse32. Is program participation meeting your expectations?
33. What are the perceived barriers to participation?
a. Do you think the program has succeeded in addressing any of these participation
barriers?
34. Has the program identified any “hard to reach” markets?
a. How effective is the program at connecting with these “hard to reach” markets?
b. Are there any customer groups you feel may be overlooked?
DataManagement35. How are rebate forms processed?
a. Are there any challenges with this process?
b. We are going to be comparing the HES rebate application to similar programs’ rebate
applications across the region, highlighting similarities and differences. Is there anything
specific you would like us to look at? (e.g., data fields, placement of certain fields on the
application)
36. How is program data (e.g., participation, rebates per customers, installations per trade ally, etc.)
tracked?
a. Is it easy to get data extracts and reports?
37. Are you still using a business rules engine to validate program data?
a. Are there any challenges with this process?
b. Are there any specific data fields on the rebate applications that frequently have issues?
FinalThoughts38. Are there any specific questions or issues you would like us to investigate during the evaluation?
39. What information can the evaluation deliver to inform the program’s processes?
Appendix A5

5
40. What do you anticipate for the future of the program?
a. Do you expect the program to expand, scale back (perhaps for specific measures), or
stay about the same level?
Appendix A6

PacifiCorp Home Energy Savings Participant Survey [UTILITY] Washington, and California: Pacific Power Utah, Wyoming, and Idaho: Rocky Mountain Power [MEASURE]
A1. Clothes Washer
A2. Refrigerator A3. Dishwasher A4. Windows
A5. Fixture A6. Heat Pump A7. Duct Sealing and Duct Insulation A8. Evaporative Cooler A9. Energy Efficient Flat Panel TV A10. Attic Insulation A11. Wall Insulation A12. Floor Insulation
Introduction
[TO RESPONDENT] Hello, I’m [INSERT FIRST NAME] I am calling from [INSERT SURVEY FIRM] on behalf of [INSERT UTILITY]. We are exploring the impacts of energy efficiency programs offered in your area. I’m not selling anything; I just want to ask you some questions about your energy use and the impact of promotions that have been run by [INSERT UTILITY]. Responses to Customer Questions [IF NEEDED] (Timing: This survey should take about 15 minutes of your time. Is this a good time for us to speak with you? (Who are you with: I'm with [INSERT SURVEY FIRM], an independent research firm that has been hired by [INSERT UTILITY] to conduct this research. I am calling to learn about your experiences with the [INSERT MEASURE] that you received through [INSERT UTILITY]’s Home Energy Savings program. (Sales concern: I am not selling anything; we would simply like to learn about your experience with the products you bought and received an incentive for through the program. Your responses will be kept confidential. If you would like to talk with someone from the Home Energy Savings Program about this study, feel free to call 1‐800‐942‐0266, or visit their website: http://www.homeenergysavings.net/)
Appendix A7

Quarterly PacifiCorp Home Energy Savings Participant Survey April 2013
2
(Who is doing this study: [INSERT UTILITY], your electric utility, is conducting evaluations of several of its efficiency programs, including the Home Energy Savings program.) (Why you are conducting this study: Studies like this help [INSERT UTILITY] better understand customers’ needs and interests in energy programs and services.)
S1. Our records show that in [INSERT YEAR] your household received an incentive from [INSERT UTILITY] for installing [IF QUANTITY =1; “an”] energy efficient [INSERT MEASURE NAME]. We're talking with customers about their experiences with the incentive program. Are you the best person to talk with about this?
1. Yes 2. No, not available [SCHEDULE CALLBACK] 3. No, no such person [THANK AND TERMINATE] ‐98. DON’T KNOW [TRY TO REACH RIGHT PERSON; OTHERWISE TERMINATE] ‐99. REFUSED [THANK AND TERMINATE]
S2. Were you the primary decision maker when deciding to purchase the [INSERT MEASURE](S)?
1. Yes 2. No
S3. Have you ever been employed in the market research field?
1. Yes [THANK AND TERMINATE] 2. No [CONTINUE] ‐98. DON’T KNOW [THANK AND TERMINATE] ‐99. REFUSED [THANK AND TERMINATE]
S4. Have you, or anyone in your household, ever been employed by or affiliated with [INSERT UTILITY] or any of its affiliates?
1. Yes [THANK AND TERMINATE] 2. No [CONTINUE] ‐98. DON’T KNOW [THANK AND TERMINATE] ‐99. REFUSED [THANK AND TERMINATE]
Measure Verification
Now I have a few questions to verify my records are correct.
Appendix A8

Quarterly PacifiCorp Home Energy Savings Participant Survey April 2013
3
C1. [INSERT UTILITY] records show that you applied for an incentive for [INSERT QUANTITY] [IF MEASURE = WINDOWS OR INSULATION, SAY “square feet of” AFTER QUANTITY] [INSERT MEASURE](S). Is that correct? [DO NOT READ RESPONSES]
1. Yes 2. No, quantity is incorrect 3. No, measure is incorrect 4. No, both quantity and measure are incorrect ‐98. DON’T KNOW ‐99. REFUSED [TERMINATE]
C2. [ASK IF C1 = 2] How many [IF MEASURE = WINDOWS OR INSULATION SAY “square feet of”][INSERT MEASURE](S) did you apply for an incentive? [NUMERIC OPEN ENDED. DOCUMENT AND USE AS QUANTITY FOR REMAINDER OF SURVEY] [IF NEEDED SAY: “We know you may have applied for other incentives, but for this survey, we’d like to focus on just this one type of equipment.”]
1. [RECORD] ‐98. DON’T KNOW ‐99. REFUSED
C3. [ASK IF C1 = 3 OR 4 OR ‐98] Please tell me for what type of equipment you applied for an incentive? [PROBE FOR MEASURE AND QUANTITY THEN SAY: “Thanks for your time, but unfortunately you do not qualify for this survey.” THEN THANK AND TERMINATE]
1. [RECORD VERBATIM] ‐98. DON’T KNOW – THANK AND TERMINATE ‐99. REFUSED – THANK AND TERMINATE
C4. Did you have a chance to install [IF QUANTITY MEASURE = 1 SAY “the [INSERT MEASURE]”, IF QUANTITY MEASURE > 1 SAY “any of the [INSERT QUANTITY] [INSERT MEASURE](S)”, IF MEASURE = WINDOWS OR INSULATION, SAY “any of the [QUANTITY] square feet of the [MEASURE]”] at any point? [IF RESPONDENT SAYS THAT A CONTRACTOR OR SOMEONE ELSE INSTALLED IT, THEN CODE ANSWER AS “YES”] [DO NOT READ RESPONSES]
1. Yes 2. No ‐98. DON’T KNOW [SKIP TO E1] ‐99. REFUSED [SKIP TO E1]
C5. [ASK IF QUANTITY MEASURE > 1] How many [IF MEASURE = WINDOWS OR INSULATION, SAY “square feet”] are installed now?
1. [RECORD # 1‐10,000] 2. None
‐98. DON’T KNOW ‐99. REFUSED
Appendix A9

Quarterly PacifiCorp Home Energy Savings Participant Survey April 2013
4
C6. [ASK IF C4 = 2, OR C5 = 2, OR C5 < QUANTITY MEASURE. IF QUANTITY MEASURE IS > 1 SAY: “Why haven't you had a chance to install all [QUANTITY] of the [INSERT MEASURE]”, IF QUANTITY MEASURE=1 SAY: “Why haven’t you had a chance to install the [INSERT MEASURE]? [MULTIPLE RESPONSE UP TO 3; DO NOT READ]
1. Failed or broken unit 2. Removed because did not like it 3. Have not had time to install it yet 4. In‐storage 5. Back up equipment to install when other equipment fails
6. Have not hired a contractor to install it yet 7. Purchased more than was needed
8. Other [RECORD] ‐98. DON’T KNOW ‐99. REFUSED
Program Awareness & Purchase Decisions
M1. How did you first hear about [INSERT UTILITY]’s Home Energy Savings program? [DO NOT PROMPT. RECORD ONLY THE FIRST WAY HEARD ABOUT THE PROGRAM]
1. Newspaper/Magazine/Print Media 2. Bill Inserts 3. Rocky Mountain Power/Pacific Power website 4. Home Energy Savings website 5. Other website 6. Internet Advertising/Online Ad 7. Family/friends/word‐of‐mouth 8. Rocky Mountain Power/Pacific Power Representative 9. Radio 10. TV 11. Billboard/outdoor ad 12. Retailer/Store 13. Sporting event 14. Home Shows/Trade Shows (Home and Garden Shows) 15. Social Media 15a. Northwest Energy Efficiency Alliance (NEEA) 16. Other [RECORD VERBATIM] ‐98. [DO NOT READ] DON’T KNOW ‐99. [DO NOT READ] REFUSED
Appendix A10

Quarterly PacifiCorp Home Energy Savings Participant Survey April 2013
5
M2. [IF M1 <> 4] Have you been to the [INSERT UTILITY] Home Energy Savings Website? [DO NOT READ RESPONSES]
1. Yes 2. No
M3. [IF M2 = 1, OR M1 = 4] Was the website… [READ]
1. Very helpful 2. Somewhat helpful
3. Somewhat unhelpful 4. Very unhelpful ‐98. [DO NOT READ] DON’T KNOW ‐99. [DO NOT READ] REFUSED
M3a. What would make the website more helpful for you? [DO NOT READ RESPONSES, MARK ALL THAT APPLY]
1. Nothing, it is already very helpful for me. 2. Make the website easier to navigate or more user‐friendly (clear hierarchy) 3. Make program information more clear and concise 4. Incorporate more visual information (charts, graphs, images) and less text 5. Provide easier access to customer service or FAQs 6. Other [RECORD]
M3b. [ASK IF STATE = WA, WY or UT, otherwise skip to M4] Are you familiar with the term [IF STATE = WA, INSERT “bewattsmart”][IF STATE = UT or WA, INSERT“wattsmart”]? [DO NOT READ RESPONSES]
1. Yes 2. No ‐98. [DO NOT READ] DON’T KNOW ‐99. [DO NOT READ] REFUSED
Appendix A11

Quarterly PacifiCorp Home Energy Savings Participant Survey April 2013
6
M3c. [IF M3b=1] How did you first hear about [INSERT UTILITY]’s [IF STATE = WA, INSERT “bewattsmart”][IF STATE = UT or WA, INSERT“wattsmart”]energy efficiency programs? [DO NOT PROMPT. RECORD ONLY THE FIRST WAY HEARD ABOUT THE PROGRAMS]
1. Newspaper/Magazine/Print Media 2. Bill Inserts 3. Rocky Mountain Power/Pacific Power website 4. Home Energy Savings website 5. Other website 6. Internet Advertising/Online Ad 7. Family/friends/word‐of‐mouth 8. Rocky Mountain Power/Pacific Power Representative 9. Radio 10. TV 11. Billboard/outdoor ad 12. Retailer/Store 13. Sporting event 14. Home Shows/Trade Shows (Home and Garden Shows) 15. Social Media 16. Other [RECORD VERBATIM] ‐98. [DO NOT READ] DON’T KNOW ‐99. [DO NOT READ] REFUSED
M4. Please think back to the time when you were deciding to buy the energy saving [INSERT MEASURE](s). What factors motivated you to purchase the [INSERT MEASURE](s)? [DO NOT READ. INDICATE ALL THAT APPLY. ONCE THEY RESPONDENT HAS FINISHED, SAY: “Are there any other factors?”]
1. Old equipment didn’t work 2. Old equipment working poorly 3. The program incentive 4. The program technical assistance 5. Wanted to save energy 6. Wanted to reduce energy costs 7. Environmental concerns 8. Recommendation from other utility [PROBE: “What utility?” RECORD] 9. Recommendation of dealer/retailer [PROBE: “From which store?” RECORD] 10. Recommendation from friend, family member, or colleague 11. Recommendation from a contractor 12. Advertisement in newspaper [PROBE: “For what program?” RECORD] 13. Radio advertisement [PROBE: “For what program?” RECORD] 14. Health or medical reasons 15. Maintain or increase comfort of home 16. Other [RECORD] ‐98. DON’T KNOW ‐99. REFUSED
Appendix A12

Quarterly PacifiCorp Home Energy Savings Participant Survey April 2013
7
Measure Usage
E1.A [IF MEASURE TYPE IS NOT CLOTHES WASHER, OR IF MEASURE TYPE = CLOTHES WASHER AND C4= NO] Do you have a clothes washer in your home?
1. Yes 2. No [SKIP TO E9] ‐98. DON’T KNOW [SKIP TO E9] ‐99. REFUSED [SKIP TO E9]
E1. B Approximately how many loads of clothes does your household wash in a typical week?
1. [RECORD] 2. Don’t have a clothes washer/or uses a Laundromat [SKIP TO E9]
‐98. DON’T KNOW ‐99. REFUSED
E2. [ASK IF MEASURE = CLOTHES WASHER AND C4 = 1] How does the number of wash loads you do now compare to the number that you did with your old clothes washer? [DO NOT READ RESPONSES]
1. Same 2. Different ‐98. DON’T KNOW ‐99. REFUSED
E3. [ASK IF E2 = 2]Do you do more or fewer loads now than you did before? Could you estimate a percentage?
1. More loads now, Record percentage [MUST BE GREATER THAN 100%, EG 125% FOR 25% MORE]
2. Fewer loads now, Record percentage [MUST BE LESS THAN 100%, EG 75% FOR 25% LESS THAN BEFORE]
‐98. DON’T KNOW ‐99. REFUSED
E4. On what percentage of loads do you use a high spin cycle? [READ CATEGORIES IF NEEDED]
1. Never 2. LESS THAN25% 3. 25‐50% 4. 50‐75% 5. 75‐100% ‐98. [DO NOT READ]DON’T KNOW
Appendix A13

Quarterly PacifiCorp Home Energy Savings Participant Survey April 2013
8
‐99. [DO NOT READ]REFUSED
E5. [ASK IF E4 = 1‐5] When you do not use the high spin cycle, what is your reason?
1. Noise/vibration 2. Impact on clothing
3. Always use high spin 4. Other [RECORD] ‐98. [DO NOT READ]DON’T KNOW ‐99. [DO NOT READ]REFUSED
E6. [ASK IF E4 = 1‐5] On what floor of the building is your washing machine located?
1. Basement 2. First floor 3. Second floor or higher ‐99. [DO NOT READ]REFUSED
E7. What percentage of your loads do you dry using a clothes dryer? [READ CATEGORIES IF NEEDED]
1. Never [SKIP TO E9] 2. LESS THAN 25% 3. 25‐50% 4. 50‐75% 5. 75‐100% ‐98. DON’T KNOW [SKIP TO E9] ‐99. REFUSED [SKIP TO E9]
E8. When you dry your clothes do you… [READ]
1. Use a timer to determine drying times. 2. Use the dryer’s moisture sensor to determine when the load is dry.
3. Other [SPECIFY] ‐98. [DO NOT READ] DON’T KNOW ‐99. [DO NOT READ] REFUSED
E9. How many times a week do you use a dishwasher?
1. [RECORD] 2. Don’t have a dishwasher ‐98. DON’T KNOW ‐99. REFUSED
Appendix A14

Quarterly PacifiCorp Home Energy Savings Participant Survey April 2013
9
E10. [ASK IF MEASURE = WINDOWS AND C4 = 1] What type of windows did you have before the new windows were installed? [IF MEASURE <> WINDOWS] What type of windows do you have?
1. Single pane [OLDER WINDOWS] 2. Double Pane [NEWER WINDOWS] 3. Triple Pane [RARE] ‐98. DON’T KNOW ‐99. REFUSED
E11. [ASK IF MEASURE = WINDOWS AND C4= 1] What type of window frames (not window trim, which is almost always wood) did you have before the new windows were installed? [IF MEASURE <> WINDOWS] What type of window frames do you have?
1. Wood 2. Vinyl 3. Metal ‐98. DON’T KNOW ‐99. REFUSED
E12. How many showers per week are taken at your home?
1. [RECORD] ‐98. DON’T KNOW ‐99. REFUSED
E13. How many baths per week are taken at your home?
1. [RECORD] ‐98. DON’T KNOW ‐99. REFUSED
[Ask E14‐E16 if MEASURE = heat pump and C4= 1]
E14. What type of heating system did you have before the new heat pump was installed?
1. Furnace 2. Boiler 3. Air Source Heat Pump 4. Ground Source Heat Pump 5. Stove 6. Baseboard
7. No heating system before [SKIP TO E16] 8. Other [SPECIFY]
‐98. [DO NOT READ] DON’T KNOW ‐99. [DO NOT READ] REFUSED
E15. How many years old was the previous heating system?
1. [RECORD] ‐98. DON’T KNOW
Appendix A15

Quarterly PacifiCorp Home Energy Savings Participant Survey April 2013
10
‐99. REFUSED
E16. What type of fuel does the new heating system use… [READ]
1. Gas 2. Electric 3. Oil 4. Propane 5. Coal 6. Wood
7. Other [SPECIFY] ‐98. [DO NOT READ] DON’T KNOW ‐99. [DO NOT READ] REFUSED
[ASK E17‐E19 IF MEASURE <> HEAT PUMP]
E17. What type of heating system do you have now… [READ]
1. Furnace 2. Boiler 3. Air Source Heat Pump 4. Ground Source Heat Pump 5. Stove 6. Baseboard
7. No heating system [SKIP TO E20] 8. OTHER [SPECIFY] ‐98. [DO NOT READ] DON’T KNOW ‐99. [DO NOT READ] REFUSED
E18. How many years old is the heating system?
1. [RECORD] ‐98. DON’T KNOW ‐99. REFUSED
E19. What type of fuel does the heating system use… [READ]
1. Gas 2. Electric 3. Oil 4. Propane 5. Coal 6. Wood
7. Other [SPECIFY] ‐98. [DO NOT READ] DON’T KNOW ‐99. [DO NOT READ] REFUSED
Appendix A16

Quarterly PacifiCorp Home Energy Savings Participant Survey April 2013
11
[Ask E20‐ E21 if MEASURE = heat pump and C4 = 1]
E20. What type of cooling system did you have before the new heat pump was installed? [READ]
1. Central Air Conditioner 2. Room Air Conditioner 3. Evaporative Cooler 4. Air Source Heat Pump 5. Ground Source Heat Pump 6. Whole house fan
7. No cooling system before [SKIP TO E24] 8. Other [SPECIFY]
‐98. [DO NOT READ] DON’T KNOW ‐99. [DO NOT READ] REFUSED
E21. How many years old was the previous cooling system?
1. [RECORD] ‐98. DON’T KNOW ‐99. REFUSED
[ASK E22‐E23 IF MEASURE <> HEAT PUMP]
E22. What type of cooling system do you have? A… [READ]
1. Central Air Conditioner 2. Room Air Conditioner 3. Evaporative Cooler 4. Air Source Heat Pump 5. Ground Source Heat Pump 6. Whole house fan
7. No cooling system [SKIP TO E24] 8. OTHER [SPECIFY] ‐98. [DO NOT READ] DON’T KNOW ‐99. [DO NOT READ] REFUSED
E23. How many years old is your current cooling system?
1. [RECORD] ‐98. DON’T KNOW ‐99. REFUSED
Appendix A17

Quarterly PacifiCorp Home Energy Savings Participant Survey April 2013
12
E24. [IF MEASURE = LIGHTING FIXTURES AND C4=1] in which room(S) [IS/ARE] the lighting fixture(s) installed? [MULTIPLE RESPONSES ALLOWED]
1. Living/family room 2. Bedroom 3. Unoccupied bedroom 4. Bathroom 5. Kitchen 6. Garage 7. Office 8. Attic 9. Closet/storage 10. Hallway 11. Exterior ‐98. DON’T KNOW ‐99. REFUSED
Satisfaction
F1. Overall, how satisfied are you with your [INSERT MEASURE](S) Would you say you are…? [READ CATEGORIES; RECORD FIRST RESPONSE ONLY]
1. Very Satisfied 2. Somewhat Satisfied 3. Not Very Satisfied 4. Not At All Satisfied ‐98. [DO NOT READ] DON’T KNOW ‐99. [DO NOT READ] REFUSED
F2. [ASK IF MEASURE= WINDOWS, HEAT PUMP, ELECTRIC WATER HEATER, OR INSULATION] Did a contractor install the [INSERT MEASURE](S) for you?
1. Yes 2. No ‐98. DON’T KNOW ‐99. REFUSED
F3. [ASK IF F2=1] How satisfied were you with the contractor that installed the [INSERT MEASURE](S) for you? [READ CATEGORIES; RECORD FIRST RESPONSE ONLY]
1. Very Satisfied 2. Somewhat Satisfied 3. Not Very Satisfied 4. Not At All Satisfied ‐98. [DO NOT READ] DON’T KNOW ‐99. [DO NOT READ] REFUSED
Appendix A18

Quarterly PacifiCorp Home Energy Savings Participant Survey April 2013
13
F4. [IF F3 = 3 or 4] Why were you not satisfied with the contractor that installed the [INSERT MEASURE](S) ?
1. [RECORD] ‐98. DON’T KNOW ‐99. REFUSED
F4a. How easy did you find filling out the Home Energy Savings Program incentive application? [READ CATEGORIES; RECORD FIRST RESPONSE ONLY]
1. Very Easy 2. Somewhat Easy 3. Not Very Easy [PROBE FOR REASON AND RECORD] 4. Not At All Easy [PROBE FOR REASON AND RECORD] ‐98. [DO NOT READ] DON’T KNOW ‐99. [DO NOT READ] REFUSED
F5. How satisfied were you with the amount of the incentive you received for the [INSERT MEASURE](S)?
1. Very Satisfied 2. Somewhat Satisfied 3. Not Very Satisfied [PROBE FOR REASON AND RECORD] 4. Not At All Satisfied [PROBE FOR REASON AND RECORD] ‐98. DON’T KNOW ‐99. REFUSED
F6. After you submitted the incentive application for the [INSERT MEASURE](S), how long did it take to receive the incentive check from [INSERT UTILITY]? Was it… [READ CATEGORIES IF NEEDED, RECORD ONLY FIRST RESPONSE]
1. Less than 4 weeks 2. Between 4 and 6 weeks 3. Between 7 and 8 weeks 4. More than 8 weeks 5. Have not received the incentive yet ‐98. [DO NOT READ] DON’T KNOW [SKIP TO F7] ‐99. [DO NOT READ] REFUSED [SKIP TO F7]
F7. [ASK IF F6<> 5] Were you satisfied with how long it took to receive the incentive?
1. Yes 2. No [PROBE FOR REASON AND RECORD] ‐98. DON’T KNOW ‐99. REFUSED
Appendix A19

Quarterly PacifiCorp Home Energy Savings Participant Survey April 2013
14
F8. How satisfied were you with the application process?
1. Very Satisfied 2. Somewhat Satisfied 3. Not Very Satisfied [PROBE FOR REASON AND RECORD] 4. Not At All Satisfied [PROBE FOR REASON AND RECORD]
F9. Overall, how satisfied are you with the Home Energy Savings incentive program? [READ CATEGORIES; RECORD ONLY FIRST RESPONSE]
1. Very Satisfied [PROBE FOR REASON AND RECORD] 2. Somewhat Satisfied [PROBE FOR REASON AND RECORD] 3. Not Very Satisfied [PROBE FOR REASON AND RECORD] 4. Not At All Satisfied [PROBE FOR REASON AND RECORD] ‐98. [DO NOT READ] DON’T KNOW ‐99. [DO NOT READ] REFUSED
F10. Did your participation in [UTILITY]’s Home Energy Savings Program cause your satisfaction with [UTILITY] to…
1. Increase 2. Stay the same 2. Decrease ‐98. [DO NOT READ] DON’T KNOW ‐99. [DO NOT READ] REFUSED
Prior Equipment [FOR ALL BUT INSULATION]
G1. Was the purchase of your new [INSERT MEASURE](S) intended to replace an old [INSERT INSERT MEASURE TYPE]?
1. Yes 2. No ‐98. DON’T KNOW ‐99. REFUSED
G2. [ASK IF G1 = 1] What did you do with the old [INSERT MEASURE TYPE] after you got your new [INSERT MEASURE](S)? [READ CATEGORIES IF NEEDED]
1. Sold or given away 2. Recycled 3. Installed in another location in the home 4. Still in home but permanently removed [STORED IN GARAGE, ETC.] 5. Thrown away ‐98. [DO NOT READ] DON’T KNOW ‐99. [DO NOT READ] REFUSED
Appendix A20

Quarterly PacifiCorp Home Energy Savings Participant Survey April 2013
15
Impact of Other Programs
H1. Did you receive financial assistance, an incentive or a rebate from a source other than [UTILITY] for purchasing the [INSERT MEASURE](S)?
1. Yes 2. No ‐98. DON’T KNOW ‐99. REFUSED
Appendix A21
Quarterly PacifiCorp Home Energy Savings Participant Survey April 2013
16
H2. [ASK IF H1= 1] Who did you receive it from? [INDICATE ALL THAT APPLY]
1. Dealer 2. Manufacturer 3. Local government 4. State tax credit 5. Federal tax credit 6. Other State rebate/assistance 7. Beartooth Electric Coop 8. Bighorn Rec 9. Bighorn County EC 10. Black Hills Power & Light 11. Bridger Valley EA 12. Carbon Power & Light 13. Cheyenne Light Fuel & Power 14. Fall River REC 15. Garland Light & Power 16. High Plains Power 17. High West Energy 18. Lower Valley Energy 19. Montana‐Dakota Utilities 20. Niobrara Electric 21. Powder River Energy 22. Wheatland REA 23. Wyrulec Company 24. Yampa Valley Electric 25. Energy West 26. Frannie‐Deaver 27. MGTC Inc. 28. Pinedale 29. Questar Gas Co. 30. Source Gas 31. Town of Walden 32. Wyoming Gas Co. 33. Other utility [RECORD] 34. Other [RECORD] ‐98. DON’T KNOW ‐99. REFUSED
H3. [ASK IF H1 = 1] About how much did you receive from [FOR EACH MENTIONED IN H2]?
1. [RECORD. ROUND TO NEAREST WHOLE DOLLAR] 2. I have not received anything back yet ‐98. DON’T KNOW ‐99. REFUSED
Appendix A22

Quarterly PacifiCorp Home Energy Savings Participant Survey April 2013
17
H4. [ASK IF H1 = 1] How influential would you say the [FOR EACH MENTIONED IN H2] incentive was in your decision to purchase the [INSERT MEASURE](S)? Was it… [READ]
1. Very influential 2. Somewhat influential 3. Moderately influential 4. Not at all influential ‐98. [DO NOT READ] DON’T KNOW ‐99. [DO NOT READ] REFUSED
Freeridership
Now I’d like to talk with you a little more about the [INSERT MEASURE](S) you installed.
I1. When you first heard about the incentive from [Utility], had you already been planning to purchase the [Insert MEASURE](S)?
1. Yes 2. No ‐98. DON’T KNOW ‐99. REFUSED
I2. Ok. Had you already purchased or installed the new [INSERT MEASURE](S) before you learned about the incentive from the Home Energy Savings Program?
1. Yes 2. No ‐98. DON’T KNOW ‐99. REFUSED
[IF I1 AND I2 BOTH = 1 SKIP TOI12]
I3. [ASK IF I2 = 2, ‐98, ‐99] Would you have installed the same [INSERT MEASURE](S) without the incentive from the Home Energy Savings program?
1. Yes 2. No ‐98. DON’T KNOW ‐99. REFUSED
[IF I3 = 1 THEN SKIP TO I5]
Appendix A23

Quarterly PacifiCorp Home Energy Savings Participant Survey April 2013
18
I4. [ASK IF I3 = 2, ‐98 OR ‐99] Help me understand, would you have installed something without the Home Energy Savings program incentive? [DO NOT READ RESPONSES]
1. Yes, I would have installed something 2. No, I would not have installed anything ‐98. DON’T KNOW ‐99. REFUSED
[IF I4 = 2 SKIP TO I8. IF I4 = ‐98 OR ‐99 SKIP TO I12]
I5. [ASK IF I3 = 1 OR I4 = 1] Let me make sure I understand. When you say you would have installed [a] [MEASURE](S), would you have installed the same [ONE(S)] that [WAS/WERE] [IF MEASURE = WINDOWS, HEAT PUMP OR INSULATION, SAY “just as energy efficient”; ALL OTHER SAY “ENERGY STAR qualified”] ?
1. Yes 2. No ‐98. DON’T KNOW ‐99. REFUSED
I6. [ASK IF I3 = 1 OR I4 = 1 AND QTY MEASURE>1] And would you have installed the same quantity of [INSERT MEASURE](S)?
1. Yes 2. No ‐98. DON’T KNOW ‐99. REFUSED
I7. [ASK IF I3 = 1 OR 14 = 1] And would you have installed the [INSERT MEASURE](S)… [READ]
1. At the same time 2. Within one year? 3. In more than one year? ‐98. [DO NOT READ] DON’T KNOW ‐99. [DO NOT READ] REFUSED
[Skip to I12]
I8. [ASK IF I3 =2 OR I4=2] To confirm, when you say you would not have installed the same [INSERT MEASURE](S), do you mean you would not have installed the [INSERT MEASURE](S) at all?
1. Yes 2. No ‐98. DON’T KNOW ‐99. REFUSED
[IF 18 = 1 SKIP TO I12]
Appendix A24

Quarterly PacifiCorp Home Energy Savings Participant Survey April 2013
19
I9.[ASK IF I8 = 2, ‐98, ‐99] Again, help me understand. Would you have installed the same type of [INSERT MEASURE](S) but [IT/THEY] would not have been as energy‐ efficient?
1. Yes 2. No ‐98. DON’T KNOW ‐99. REFUSED
I10. [ASK IF I8= 2, ‐98, ‐99 AND QTY MEASURE>1] Would it have been the same [INSERT MEASURE](S) but fewer of them?
1. Yes 2. No ‐98. DON’T KNOW ‐99. REFUSED
I11. [ASK IF I8 = 2, ‐98, ‐99]And, would you have installed the same [INSERT MEASURE](S)… [READ]
1. At the same time 2. Within one years? 3. In more than one year? ‐98. [DO NOT READ] DON’T KNOW ‐99. [DO NOT READ] REFUSED
I12. In your own words, please tell me the influence the Home Energy Saving incentive had on your decision to purchase [INSERT MEASURE](S)?
______ [Record Response]
Spillover
J1. Since participating in the program, have you added any other energy efficient equipment or services in your home that were not incentivized through the Home Energy Savings Program?
1. Yes 2. No ‐98. DON’T KNOW ‐99. REFUSED
Appendix A25

Quarterly PacifiCorp Home Energy Savings Participant Survey April 2013
20
[IF J1 = 2, ‐98 OR ‐99 SKIP TO J6]
J2. Did you purchase any of the following items since [TIMEFRAME], not including the [INSERT MEASURE] that we have been discussing today? [LIST OF OTHER ELIGIBLE APPLIANCES AND MEASURES OTHER THAN THOSE LISTED IN PROGRAM RECORDS. PROMPT IF NEEDED]
1. Clothes Washers 2. Refrigerators 3. Dishwashers 4. Windows 5. Fixtures 6. Heat Pumps 7. Ceiling Fans 8. Electric Water Heater 9. CFLs 10. Insulation 11. Other [RECORD] 12. None ‐98. DON’T KNOW ‐99. REFUSED
[IF J2 = 12, ‐98 OR ‐99 SKIP TO J6. REPEAT J3 THROUGH J5 FOR ALL RESPONSES TO J2]
J3. When did you purchase [INSERT MEASURE TYPE]?
1. 2009 2. 2010 3. 2011
4. 2012 ‐98. DON’T KNOW ‐99. REFUSED
J4. Did you receive an incentive for [INSERT MEASURE TYPE]?
1. Yes [PROBE AND RECORD] 2. No ‐98. DON’T KNOW ‐99. REFUSED
J5. How influential would you say the Home Energy Savings program was in your decision to add the [MEASURE FROM J2] to your home? Was it… [Repeat for each measure listed in J2]
1. Highly Influential 2. Somewhat Influential 3. Not at all influential ‐98. DON’T KNOW ‐99. REFUSED
Appendix A26

Quarterly PacifiCorp Home Energy Savings Participant Survey April 2013
21
J6. Have you participated in and received an incentive from any other [UTILITY] energy efficiency
Program? 1. Yes [PROBE AND RECORD] 2. No ‐98. DON’T KNOW ‐99. REFUSED
J7. [IF J6 = 1] On a scale of 0 to 10, where 0 is not at all influential and 10 is very influential; how influential would you say the [INSERT UTILITY] Home Energy Savings program was in your decision to participate in other [INSERT UTILITY] program[s]?
1. [RECORD] 2. No ‐98. DON’T KNOW ‐99. REFUSED
Demographics
I have just a few more questions about your household. Again, all your answers will be strictly confidential.
D1. Which of the following best describes your house? [READ LIST]:
1. Single‐family home 2. Townhouse or duplex 3. Mobile home or trailer 4. Apartment building with 4 or more units 5. Other [RECORD] ‐98. [DO NOT READ] DON’T KNOW ‐99. [DO NOT READ] REFUSED
D2. Do you rent or own your home?
1. Own 2. Rent 3. Other [RECORD] ‐98. DON’T KNOW ‐99. REFUSED
D3. Including yourself and any children, how many people currently live in your home?
1. [RECORD] ‐98. DON’T KNOW ‐99. REFUSED
Appendix A27
Quarterly PacifiCorp Home Energy Savings Participant Survey April 2013
22
D8. About when was this building first built? [READ LIST IF NEEDED]
1. Before 1970’s 2. 1970’s 3. 1980’s 4. 1990‐94 5. 1995‐99 6. 2000’s 7. OTHER [RECORD] ‐98. [DO NOT READ] DON’T KNOW ‐99. [DO NOT READ] REFUSED
D15. How many floors are in your building?
1. [RECORD] ‐98. DON’T KNOW ‐99. REFUSED
D16. What type of foundation does your home have? [READ LIST IF NEEDED]
1. Full finished basement 2. Unfinished Basement 3. Crawlspace 4. Slab on Grade 5. OTHER [RECORD] ‐98. [DO NOT READ] DON’T KNOW ‐99. [DO NOT READ] REFUSED
D9. Approximately how many square feet is the home in which the [INSERT MEASURE](S) was installed? [READ LIST IF NEEDED]
1. Under 1,000 square feet 2. 1,000 – 1,500 square feet 3. 1,501 – 2,000 square feet 4. 2,001 – 2,500 square feet 5. Over 2,500 square feet ‐98. [DO NOT READ] DON’T KNOW ‐99. [DO NOT READ] REFUSED
D13. [SKIP IF MEASURE = ELECTRIC WATER HEATER] What is the fuel used by your primary water heater?
1. Electric 2. Natural Gas 3. Fuel oil 4. Other [RECORD] ‐98. DON’T KNOW ‐99. REFUSED
Appendix A28

Quarterly PacifiCorp Home Energy Savings Participant Survey April 2013
23
D14. [IF D13 = 1‐4] How old is the primary water heater? [RECORD RESPONSE IN YEARS]
1. [RECORD 1‐100] ‐98. DON’T KNOW ‐99. REFUSED
D4. Can you please tell me in what year you were born?
1. [RECORD] ‐98. DON’T KNOW ‐99. REFUSED
D5. In 2012, was your pre‐tax household income above or below $50,000?
1. Below $50,000 2. Above $50,000 3. Exactly $50,000 ‐98. DON’T KNOW ‐99. REFUSED
[IF D5 = ‐98 OR ‐99 SKIP TO L1]
D6. [ASK IF D5=1] Which of the following categories best represents your household income in 2011? Please stop me when I read your category:
1. Under $10,000 2. $10,000 to under $20,000 3. $20,000 to under $30,000 4. $30,000 to under $40,000 5. $40,000 to under $50,000 ‐98. DON’T KNOW ‐99. REFUSED
D7. [ASK IF D5=2] Which of the following categories best represents your household income in 2011? Please stop me when I read your category:
1. $50,000 to under $60,000 2. $60,000 to under $75,000 3. $75,000 to under $100,000 4. $100,000 to under $150,000 5. $150,000 to under $200,000 6. $200,000 or more ‐98. DON’T KNOW ‐99. REFUSED
Appendix A29

Quarterly PacifiCorp Home Energy Savings Participant Survey April 2013
24
Conclusion
L1. Do you have any additional feedback or comments?
1. Yes [RECORD VERBATIM] 2. No ‐98. DON’T KNOW ‐99. REFUSED
L2. Sex [DO NOT READ]
1. Female 2. Male ‐98. DON’T KNOW
That concludes the survey. Thank you very much for your time and feedback.
Appendix A30

PacifiCorp HES Contractor Survey [UTILITY]
Washington and California: Pacific Power Utah, Wyoming, and Idaho: Rocky Mountain Power
Introduction
[TO RESPONDENT] Hello, I’m [INSERT FIRST NAME], calling from [INSERT SURVEY FIRM], on behalf of [INSERT UTILITY]. We are contacting contractors to learn more about their experience with [INSERT UTILITY]’s Home Energy Savings Program. Can I please speak with someone in your company who is familiar with participating in [INSERT UTILITY]’s Home Energy Savings Program? [IF CONTACT IS PERSON ON THE PHONE]: Our records show that your company is a Home Energy Savings Program trade ally, meaning that your company has sold energy efficiency products that are eligible for customer incentives. Is that correct? [IF YES, continue survey; IF NO, ask “CAN YOU DIRECT ME TO SOMEONE ELSE WHO MIGHT BE FAMILIAR WITH THE PROGRAM?”] [IF TRANSFERRED TO ANOTHER CONTACT ‐ REINTRODUCTION]: Hello, I’m [INSERT FIRST NAME], calling from [INSERT SURVEY FIRM], on behalf of [INSERT UTILITY]. We are contacting contractors to learn more about their experience with [INSERT UTILITY]’s Home Energy Savings Program. Our records show that your company is a Home Energy Savings Program trade ally, meaning that your company has sold energy efficiency products that are eligible for customer incentives. Is that correct? [IF YES, continue survey; IF NO, ask “CAN YOU DIRECT ME TO SOMEONE ELSE WHO MIGHT BE FAMILIAR WITH THE PROGRAM?”] [TERMINATE IF CONTACT DENIES PARTICIPATION] [IF PERSON DOES NOT RECOGINZE THE PROGRAM: As a participating contractor you would install qualifying energy efficient equipment such as insulation, windows or HVAC measures to eligible customers in [INSERT UTILITY]’s service territory. TERMINATE if person does still not recognize the program] Responses to Contractor Questions [IF NEEDED] (Timing: This survey should take about 15 minutes of your time. Is this a good time for us to speak with you?) (Who are you with: I'm with [INSERT SURVEY FIRM], an independent research firm that has been hired by [INSERT UTILITY] to conduct this research. I am calling to learn about your experience with the Home Energy Savings Program.)
Appendix A31

2011 and 2012 PacifiCorp Home Energy Savings Contractor Survey May 2013
2
(Sales concern: I am not selling anything; we would simply like to learn about your experience with the Home Energy Savings Program. Your responses will be kept confidential. If you would like to talk with a representative from the Home Energy Savings program about this study, feel free to call 1‐800‐942‐0266, or visit their website: http://www.homeenergysavings.net/) (Who is doing this study: [INSERT UTILITY] is conducting evaluations of several of its efficiency programs, including the Home Energy Savings program.) (Why you are conducting this study: Studies like this help [INSERT UTILITY] better understand customers’ needs and interest in energy programs and services.)
A. Introduction
Thank you for agreeing to take part in this survey. Your participation is very important to this study. Your answers are confidential and will only be used for research purposes.
A1. What type of services does your company provide to customers through the [INSERT UTILITY] Home Energy Savings program? [DO NOT READ LIST, RECORD MULTIPLE RESPONSES]
1. Water heaters – electric, heat pump water heaters 2. HVAC tune ups – heat pumps and central A/C 3. Duct sealing/duct insulation 4. Windows 5. Insulation 6. HVAC equipment (or central A/C equipment) 7. Evaporative cooler 8. Lighting fixtures 9. Ceiling fans 10. Home Electronics 11. Appliances (including light fixtures, ceiling fans, clothes washers, dishwashers, refrigerators) 12. Other [RECORD] ‐98. [DO NOT READ] DON’T KNOW ‐99. [DO NOT READ] REFUSED
A2. How many employees work for your company?
1. [RECORD NUMBER] ‐98. [DO NOT READ] DON’T KNOW ‐99. [DO NOT READ] REFUSED
A3. How many years has your company participated in the Home Energy Savings Program?
1. [RECORD NUMBER OF YEARS] ‐98. [DO NOT READ] DON’T KNOW ‐99. [DO NOT READ] REFUSED
Appendix A32

2011 and 2012 PacifiCorp Home Energy Savings Contractor Survey May 2013
3
B. ProgramAwareness
For the questions I will be asking you, please focus on the calendar years 2011 and 2012 only.
B1. How did you initially find out about the [INSERT UTILITY] Home Energy Savings program? [DO NOT READ LIST; SELECT ONLY ONE]
1. Home Energy Savings field staff (PECI) called 2. Home Energy Savings field staff (PECI) visited me 3. Home Energy Savings field staff (PECI) emailed me 4. Received a marketing package/materials 5. From another contractor 6. From the utility 7. From a customer 8. At a presentation [RECORD WHICH PRESENTATION]
9. Manufacturer 10. Home Energy Savings Website
11. Other [RECORD] ‐98. [DO NOT READ] DON’T KNOW ‐99. [DO NOT READ] REFUSED
B2. [SKIP IF B1=10] Have you ever visited the Home Energy Savings Website?
1. Yes 2. No [SKIP TO B5] ‐98. [DO NOT READ] DON’T KNOW [SKIP TO B5] ‐99. [DO NOT READ] REFUSED [SKIP TO B5]
B3. Was the Website… [READ]
1. Very helpful 2. Somewhat helpful 3. Somewhat unhelpful 4. Very unhelpful ‐98. [DO NOT READ] DON’T KNOW ‐99. [DO NOT READ] REFUSED
B4. What would make the Website more helpful? [DO NOT READ LIST; RECORD MULTIPLE RESPONSES]
1. Nothing, it is already very helpful to me 2. Make the website easier to navigate or more user‐friendly (clear hierarchy) 3. Make program information more clear and concise 4. Incorporate more visual information (charts, graphs, images) and less text 5. Provide easier access to customer service or FAQs 6. Other [RECORD]
Appendix A33

2011 and 2012 PacifiCorp Home Energy Savings Contractor Survey May 2013
4
‐98. [DO NOT READ] DON’T KNOW ‐99. [DO NOT READ] REFUSED
B5. What is the best way to contact you about [INSERT UTILITY] programs and services? [DO NOT READ LIST; RECORD MULTIPLE RESPONSES]
1. Home Energy Savings field staff call 2. Home Energy Savings field staff visit 3. Mail marketing package/materials 4. Through manufacturer field reps 5. Through corporate office 6. At a presentation/trade show [RECORD]
7. Email 8. Other [RECORD] ‐98. [DO NOT READ] DON’T KNOW ‐99. [DO NOT READ] REFUSED
C. ProgramPromotion
The next few questions focus on how you marketed energy efficiency and the Home Energy Savings program during 2011 and 2012.
Appendix A34

2011 and 2012 PacifiCorp Home Energy Savings Contractor Survey May 2013
5
C1. Do you market the [INSERT UTILITY] Home Energy Savings program to customers?
1. Yes 2. No
‐98. [DO NOT READ] DON’T KNOW ‐99. [DO NOT READ] REFUSED
C2. [SKIP IF B1=4] Did you receive program marketing materials from [INSERT UTILITY] or Portland Energy Conservation, Inc. (PECI) staff?
1. Yes 2. No [SKIP TO C6] ‐98. [DO NOT READ] DON’T KNOW [SKIP TO C6] ‐99. [DO NOT READ] REFUSED [SKIP TO C6]
C3. How would you describe the amount of program marketing materials provided? Would you say there was…[READ LIST]
2. No information/materials provided 3. Some information/materials provided, but not enough 4. A good amount of information/materials 5. Too much information/materials ‐98. [DO NOT READ] DON’T KNOW ‐99. [DO NOT READ] REFUSED
C4. What type of program marketing materials did you receive? [DO NOT READ LIST, RECORD MULTIPLE RESPONSES]
1. Brochures 2. Applications to hand out to customers 3. Leave‐behind booklets 4. Hand outs 8. Other [RECORD] ‐98. [DO NOT READ] DON’T KNOW ‐99. [DO NOT READ] REFUSED
C5. Which of the program marketing materials did you find most useful? [DO NOT READ LIST, RECORD ONLY ONE RESPONSE]
1. Brochures 2. Applications to hand out to customers 3. Leave‐behind booklets 4. Hand outs 5. List of qualified products 6. Other [RECORD] ‐98. [DO NOT READ] DON’T KNOW ‐99. [DO NOT READ] REFUSED
Appendix A35

2011 and 2012 PacifiCorp Home Energy Savings Contractor Survey May 2013
6
C6. How do you typically inform your customers of the [INSERT UTILITY] Home Energy Savings program incentives available for qualifying energy‐efficient products? [DO NOT READ LIST; RECORD MULTIPLE RESPONSES]
1. I do not inform customers of Home Energy Savings incentives [PROBE FOR REASONING AND RECORD]
2. I mention the program when I am working with a customer 3. TV ads 4. Print ads 5. Radio ads 6. HES program marketing materials [SPECIFY WHICH ONES AND RECORD] 7. I only mention if the customer asks about energy efficient equipment 8. Don’t need to inform, customers already know about it 9. I rely on marketing by the program. 10. Other [RECORD] ‐98. [DO NOT READ] DON’T KNOW ‐99. [DO NOT READ] REFUSED
D. ProgramParticipation
D1. What were the main reasons your company decided to participate in the [INSERT UTILITY] Home Energy Savings program? [SELECT ALL THAT APPLY; DO NOT READ LIST]
1. Create additional business opportunities 2. Asked by HES staff 3. Competitive advantage 4. Keeping up with competitors/rival companies 5. Incentives for customers 6. Other [RECORD]
‐98. [DO NOT READ] REFUSED ‐99. [DO NOT READ] DON’T KNOW
Appendix A36

2011 and 2012 PacifiCorp Home Energy Savings Contractor Survey May 2013
7
D2. How often do you recommend energy‐efficient equipment options to customers? Would you say…[READ LIST]
1. Never 2. Rarely 3. Sometimes 4. Often 5. Always ‐98. [DO NOT READ] DON’T KNOW ‐99. [DO NOT READ] REFUSED
D3. What tends to be the “selling point” for high efficiency products? [DO NOT READ LIST, SELECT ONLY ONE]
1. Cost saving on bill 2. Energy savings 3. Incentive amount 4. Environmental benefits 5. Other [RECORD] ‐98. [DO NOT READ] DON’T KNOW ‐99. [DO NOT READ] REFUSED
D4. Why do you think customers choose not to install equipment eligible for [INSERT UTILITY] Home Energy Savings program incentives? [DO NOT READ LIST; MARK ALL THAT APPLY]
1. Measures too expensive 2. Incentive applications are too complex 3. Program is too much of a hassle 4. Customers are unaware of the benefits of energy efficiency
5. High‐efficiency equipment is not readily available 6. Customers unaware of incentive opportunities 7. Other [RECORD]
‐98. [DO NOT READ] DON’T KNOW ‐99. [DO NOT READ] REFUSED
D5. Do you have any suggestions for ways the Home Energy Savings program could be improved to increase customer participation? [SELECT ALL THAT APPLY; DO NOT READ LIST]
1. No suggestions 2. Higher equipment incentives [SPECIFY TYPE AND AMOUNT] 3. Better marketing materials [SPECIFY WHAT CAN BE IMPROVED] 4. More energy efficiency education[SPECIFY WHAT TYPE OF EDUCATION WOULD BE
MORE BENEFICIAL] 5. Greater selection of equipment eligible for incentives 6. Less time commitment 7. Less complicated paperwork 8. Other [RECORD]
‐98. [DO NOT READ] DON’T KNOW
Appendix A37
2011 and 2012 PacifiCorp Home Energy Savings Contractor Survey May 2013
8
‐99. [DO NOT READ] REFUSED
D6. How effective has your affiliation with the Home Energy Savings program been in generating new business for your company? Would you say your affiliation with the program has been…[READ LIST]
1. Very effective in generating business for your company 2. Somewhat effective in generating business for your company 3. Not too effective in generating business for your company 4. Not at all effective in generating business for your company
‐98. [DO NOT READ] DON’T KNOW ‐99. [DO NOT READ] REFUSED
D7. During 2011‐2012, approximately what percentage of your customers applied for an incentive through the [INSERT UTILITY] Home Energy Savings Program?
1. [RECORD %] ‐98. [DO NOT READ] DON’T KNOW ‐99. [DO NOT READ] REFUSED
D8. [SKIP TO D11 IF D7=100%] During 2011‐2012, approximately what percentage of your customers that qualified for program incentives, but did not end up completing or submitting an application?
1. [RECORD %] ‐98. [DO NOT READ] DON’T KNOW ‐99. [DO NOT READ] REFUSED
D9. [ASK IF D8> 0% OTHERWISE SKIP TO D11] What is the most common reason customers do not complete or submit Incentive Applications for eligible products? [DO NOT READ LIST]
1. Customer did not want take the time to fill out Incentive Application 2. Customer did not see value in receiving program incentive 3. Customer forgot to submit Incentive Application 4. Other [SPECIFY]
Appendix A38

2011 and 2012 PacifiCorp Home Energy Savings Contractor Survey May 2013
9
‐98. [DO NOT READ] DON’T KNOW ‐99. [DO NOT READ] REFUSED
D10. Do you have any suggestions that [INSERT UTILITY] can do in helping to reduce the number of applications that do not get completed or submitted by customers? [DO NOT READ LIST, RECORD MULTIPLE RESPONSES]
1. No suggestions 2. Make the applications less confusing 3. Require less information on the application 4. Have program staff assist customers in filling out applications 5. Require contractors to fill out applications 6. Other [SPECIFY] ‐98. [DO NOT READ] DON’T KNOW ‐99. [DO NOT READ] REFUSED
D11. [ASK IF STATE = WA or ID, OTHERWISE SKIP TO E1] Are you affiliated with the Northwest Energy Efficiency Alliance’s (NEEA) ductless heat pumps and/or heat pump water heater efforts? [IF UNSURE: Are you listed on NEEA’s Website as a qualified installer?]
1. Yes 2. No
‐98. [DO NOT READ] DON’T KNOW ‐99. [DO NOT READ] REFUSED
D12. Have you ever participated in a training sponsored by the Northwest Energy Efficiency Alliance (NEEA)?
1. Yes [SPECIFY TYPE OF TRAINING] 2. No
‐98. [DO NOT READ] DON’T KNOW ‐99. [DO NOT READ] REFUSED
E. ProgramSupport/Training
E1. How helpful are the Home Energy Savings program staff at addressing your needs? Would you say they are…[READ LIST]
1. Very helpful 2. Somewhat helpful 3. Not very helpful 4. Not at all helpful 5. I have never interacted with the Home Energy Savings program staff ‐98. [DO NOT READ] DON’T KNOW ‐99. [DO NOT READ] REFUSED
Appendix A39

2011 and 2012 PacifiCorp Home Energy Savings Contractor Survey May 2013
10
E2. [IF E1= 3 OR 4] What could they have done better? [DO NOT READ LIST, MARK ALL THAT APPLY]
1. Nothing 2. Provided more training support 3. Provided more program information 4. Provided more marketing materials 5. Been more responsive to questions/concerns 6. Other [RECORD] ‐98. [DO NOT READ] DON’T KNOW ‐99. [DO NOT READ] REFUSED
E3. [ASK IF A3 > 2 OTHERWISE SKIP TO E5] Do you feel the frequency of in‐person communication with Home Energy Savings program staff in 2011 and 2012 increased, decreased, or stayed the same to the frequency of in‐person communication in previous program years? [DO NOT READ LIST]
1. Increased 2. Decreased 3. Stayed the same
‐98. [DO NOT READ] REFUSED ‐99. [DO NOT READ] DON’T KNOW
E4. Overall, do you feel the level of support provided by Home Energy Savings program staff in 2011 and 2012 increased, decreased, or stayed the same to the level of support provided in previous program years? [DO NOT READ LIST]
1. Increased 2. Decreased 3. Stayed the same
‐98. [DO NOT READ] REFUSED ‐99. [DO NOT READ] DON’T KNOW
E5. Do you read the quarterly Trade Ally Newsletter emailed to you by Home Energy Savings program staff?
1. Yes 2. No [SKIP TO E8] 3. I do not receive the quarterly newsletter [SKIP TO E8]
‐98. [DO NOT READ] REFUSED [SKIP TO E8] ‐99. [DO NOT READ] DON’T KNOW [SKIP TO E8]
E6. How helpful do you find the information provided in the quarterly Trade Ally Newsletter? Do you find it… [READ LIST]
1. Very helpful 2. Somewhat helpful 3. Not very helpful 4. Not at all helpful 5. I have never read the quarterly newsletter [SKIP TO E8] ‐98. [DO NOT READ] DON’T KNOW
Appendix A40

2011 and 2012 PacifiCorp Home Energy Savings Contractor Survey May 2013
11
‐99. [DO NOT READ] REFUSED
E7. [IF E6= 3 OR 4] What type of information would make the quarterly Trade Ally Newsletter more helpful? [DO NOT READ LIST; RECORD MULTIPLE RESPONSES]
1. Provide more program updates 2. Provide effective sales tips 3. Provide information about filling out program paperwork 4. Provide FAQs and responses 5. Other [RECORD]
‐98. [DO NOT READ] REFUSED ‐99. [DO NOT READ] DON’T KNOW
E8. [ASK IF A3< 3, OTHERWISE SKIP TO F1] Did you participate in the orientation training offered through the program by Home Energy Savings program staff in 2011 or 2012?
1. Yes 2. No [SKIP TO E11]
‐98. [DO NOT READ] REFUSED [SKIP TO F1] ‐99. [DO NOT READ] DON’T KNOW [SKIP TO F1]
E9. How effective was the orientation training in helping you understand the program and its requirements? Would you say the training was… [READ LIST]
1. Very effective 2. Somewhat effective 3. Not too effective 4. Not at all effective
‐98. [DO NOT READ] REFUSED ‐99. [DO NOT READ] DON’T KNOW
E10. What aspects of the current training, if any, could be improved for future contractors going through the process? [SELECT ALL THAT APPLY; DO NOT READ]
1. No improvements necessary 2. Staff should be more knowledgeable about the program [SPECIFY AREAS FOR
IMPROVMENT] 3. Provide more hands‐on training in the field [SPECIFY WHAT TYPE OF TRAINING WOULD
BE VALUABLE] 4. Choose a better time of year for the training [SPECIFY BETTER TIME OF YEAR] 5. Provide more online training opportunities 6. Provide more training materials [SPECIFY WHAT TYPE OF TRAINING MATERIALS
WOULD BE USEFUL] 7. Provide more technical training opportunities [SPECIFY TYPE OF TECHNICAL TRAINING] 8. Other [RECORD]
‐98. [DO NOT READ] REFUSED ‐99. [DO NOT READ] DON’T KNOW
Appendix A41
2011 and 2012 PacifiCorp Home Energy Savings Contractor Survey May 2013
12
E11. [IF E8=2] What prevented you from attending the program orientation training? [DO NOT READ LIST; SELECT ONLY ONE RESPONSE]
1. Did not know any training was offered 2. Did not see the value/benefit 3. Did not know it was a program requirement 4. Did not have time 5. Was not offered at a convenient time 6. Other[RECORD]
‐98. [DO NOT READ] REFUSED ‐99. [DO NOT READ] DON’T KNOW
F. ProgramSatisfaction
We’re almost done. I just have a few quick questions about your overall satisfaction with the program.
F1. During 2011‐2012, did you ever assist your customers in completing the [INSERT UTILITY] Home Energy Savings Program Incentive Application?
1. Yes 2. No 3. [DO NOT READ] REFUSED
‐99. [DO NOT READ] DON’T KNOW
Appendix A42

2011 and 2012 PacifiCorp Home Energy Savings Contractor Survey May 2013
13
F2. [IF F1=1 OTHERWISE SKIP TO F4] How easy was it to fill out the Incentive Applications? Would you say it was… [READ RESPONSES]
1. Very easy 2. Somewhat easy 3. Not very easy 4. Not at all easy ‐98. [DO NOT READ] DON’T KNOW ‐99. [DO NOT READ] REFUSED
F3. [IF F2=3 OR 4] What was [RESPONSE FROM F2] about filling out the Incentive Application? [DO NOT READ LIST; RECORD MULTIPLE RESPONSES]
1. Too many details required 2. Takes too much time 3. Difficult to contact Home Energy Savings staff if I have questions 4. Other [RECORD]
‐98. [DO NOT READ] DON’T KNOW ‐99. [DO NOT READ] REFUSED
F4. What is the biggest benefit of being a Home Energy Savings Program trade ally?
1. The incentives for customers 2. Increased business 3. Competitive advantage over other contractors 4. Business listed on [INSERT UTILITY] Website 5. Affiliation with [INSERT UTILITY] 6. Doing something good for the environment 7. Other [RECORD]
‐98. [DO NOT READ] DON’T KNOW ‐99. [DO NOT READ] REFUSED
F5. How satisfied are you with your overall program experience? Would you say you are…[READ LIST]
1. Very satisfied 2. Somewhat satisfied 3. Not too satisfied 4. Not at all satisfied ‐98. [DO NOT READ] DON’T KNOW ‐99. [DO NOT READ] REFUSED
Thank you again for your time.
Appendix A43

PacifiCorp HES Residential Lighting Survey
[UTILITY] Washington and California: Pacific Power Utah, Wyoming, and Idaho: Rocky Mountain Power
Introduction
[TO RESPONDENT] Hello, I’m [INSERT FIRST NAME], calling from [INSERT SURVEY FIRM], on behalf of [INSERT UTILITY]. Can I speak with [INSERT NAME]? Hello, we are conducting a survey about household lighting and home energy use and would like to ask you some questions about your household’s lighting and energy use. We would greatly appreciate your opinions. [IF NOT AVAILABLE, ASK FOR AN ADULT IN THE HOUSEHOLD WHO IS RESPONSIBLE FOR PURCHASING THE LIGHT BULBS. IF NO ONE APPROPRIATE IS AVAILABLE, TRY TO RESCHEDULE AND THEN TERMINATE. IF TRANSFERRED TO ANOTHER PERSON, REPEAT INTRO AND THEN CONTINUE.] Responses to Customer Questions [IF NEEDED] (Timing: This survey should take about 10 minutes of your time. Is this a good time for us to speak with you?) (Who are you with: I'm with [INSERT SURVEY FIRM], an independent research firm that has been hired by [INSERT UTILITY] to conduct this research. I am calling to learn about your household lighting and home energy use) (Sales concern: I am not selling anything; we would simply like to learn about your household lighting and home energy use. Your responses will be kept confidential. If you would like to talk with someone from the Home Energy Savings Program about this study, feel free to call 1‐800‐942‐0266, or visit their website: http://www.homeenergysavings.net/) (Who is doing this study: [INSERT UTILITY], your electric utility, is conducting evaluations of several of its efficiency programs.) (Why are you conducting this study: Studies like this help [INSERT UTILITY] better understand customers’ need and interest in energy programs and services.)
Appendix A44
2011 and 2012 PacifiCorp Home Energy Savings Residential Lighting Survey April 2013
2
S2. This call may be monitored for quality assurance. First, are you the person who usually purchases light bulbs for your household?
1. Yes 2. No, but person who does can come to phone [START OVER AT INTRO SCREEN WITH NEW
RESPONDENT] 3. No, and the person who does is not available [SCHEDULE CALLBACK] ‐98. DON’T KNOW [THANK AND TERMINATE] ‐99. REFUSED [THANK AND TERMINATE]
S3. Have you ever been employed in the market research field?
1. Yes [THANK AND TERMINATE] 2. No [CONTINUE] ‐98. DON’T KNOW [THANK AND TERMINATE] ‐99. REFUSED [THANK AND TERMINATE]
S4. Have you, or anyone in your household, ever been employed by or affiliated with [INSERT UTILITY] or any of its affiliates?
1. Yes [THANK AND TERMINATE] 2. No [CONTINUE] ‐98. DON’T KNOW [THANK AND TERMINATE] ‐99. REFUSED [THANK AND TERMINATE]
Appendix A45

2011 and 2012 PacifiCorp Home Energy Savings Residential Lighting Survey April 2013
3
Familiarity with CFLs
First, I would like to ask you about your familiarity with different types of light bulbs.
C1. Before this call today, had you ever heard of compact fluorescent bulbs, or CFLs?
1. Yes [SKIP TO C3] 2. No
C2. Compact fluorescent light bulbs – also known as CFLs – usually do not look like traditional incandescent light bulbs. The most common type of compact fluorescent bulb is made with a glass tube bent into a spiral, resembling soft‐serve ice cream, and it fits in a regular light bulb socket. Before today, were you familiar with CFLs?
1. Yes 2. No [THANK AND TERMINATE]
C3. How familiar are you with CFLs? Would you say that you are… [READ]
1. Very familiar 2. Somewhat familiar 3. Not too familiar, or 4. Not at all familiar ‐98. [DO NOT READ] DON’T KNOW ‐99. [DO NOT READ] REFUSED
CFL Purchases
Now I have some questions about your lighting purchases during the last two calendar years, 2011 and 2012.
E1. Did you purchase or receive any CFLs in 2011 or 2012?
1. Yes 2. No [THANK AND TERMINATE] ‐98. DON’T KNOW [THANK AND TERMINATE] ‐99. REFUSED [THANK AND TERMINATE]
E2. [ASK IF E1= 1] During 2011 and 2012, how many CFLs did you or your household purchase or acquire? Please try to estimate the total number of individual CFL bulbs, as opposed to packages. [IF “DON’T KNOW,” PROBE: “Is it less than or more than five bulbs?” WORK FROM THERE TO GET AN ESTIMATE]
[NUMERIC OPEN END: RECORD NUMBER OF CFLS, NOT A RANGE.] [IF QUANTITY=0, THANK AND TERMINATE]
1. [RECORD # OF CFLs] ‐98. DON’T KNOW [PROBE FOR ESTIMATES; IF UNABLE TO GET AN ANSWER, THANK AND TERMINATE] ‐99. REFUSED [THANK AND TERMINATE]
Appendix A46

2011 and 2012 PacifiCorp Home Energy Savings Residential Lighting Survey April 2013
4
E3. Of these [INSERT QUANTITY FROM E2] CFLs that you acquired, how many did you buy at a retail store or online as opposed to receiving them for free?
1. [RECORD # OF CFLs] 2. NONE ‐98. DON’T KNOW ‐99. REFUSED
[SKIP TO B1 IF E3 = 2; i.e. “did not buy any bulbs, only received free bulbs”]
E4. [ASK IF E3=1] How many, if any, of the [INSERT QUANTITY FROM E3] CFLs that you bought at a retail store or online were part of a [INSERT UTILTY] sponsored sale?
1. [RECORD # OF CFLs] 2. NONE ‐98. DON’T KNOW ‐99. REFUSED
E5. How many did you receive for free from an individual or organization?
1. [RECORD # OF CFLs] 2. NONE ‐98. DON’T KNOW ‐99. REFUSED
E6. [ASK IF E3+ E5< QUANTITY FROM 0] Thanks, that accounts for [E3+E5] of the total quantity that you bought or acquired during 2011 and 2012. Can you tell me where you got the [INSERT QUANTITY OF 0 MINUS (E3+E5)] other bulbs from?
1. [RECORD VERBATIM] OR ADJUST E3 AND E5 ACCORDINGLY ‐98. DON’T KNOW ‐99. REFUSED
E7. [ASK IF E4.1 > 0] You mentioned that you bought [INSERT QUANTITY FROM E4.1] bulbs that were part of a [INSERT UTILTY] sponsored sale. Did the utility discount influence your decision to purchase CFLs over another type of bulb?
1. Yes 2. No ‐98. DON’T KNOW ‐99. REFUSED
Appendix A47

2011 and 2012 PacifiCorp Home Energy Savings Residential Lighting Survey April 2013
5
E8. What [IF E7=01 IS ASKED SAY “other”] factors influenced your decision to buy CFLs over other types of bulbs? [DO NOT READ] [MULTIPLE RESPONSES ALLOWED]
1. Energy savings 2. Cost savings on electricity bill 3. Price of bulb 4. Environmental concerns 5. Quality of light 6. Lifetime of bulb 7. Other [RECORD] ‐98. DON’T KNOW ‐99. REFUSED
E9. Where did you buy the majority of your CFL bulbs purchased in 2011 and 2012? [MULTIPLE RESPONSES ALLOWED. DO NOT READ]
1. Ace Hardware [RECORD CITY AND STATE] 2. Albertsons [RECORD CITY AND STATE] 3. Bed Bath and Beyond [RECORD CITY AND STATE] 4. Best Buy [RECORD CITY AND STATE] 5. CVS [RECORD CITY AND STATE] 6. Decker’s Food Center [RECORD CITY AND STATE]
7. Discount Grocery [RECORD CITY AND STATE] 8. Do it Best Hardware [RECORD CITY AND STATE] 9. Dollar Tree [RECORD CITY AND STATE] 10. Family Dollar [RECORD CITY AND STATE]
11. Home Depot [RECORD CITY AND STATE] 12. Kennedy Hardware Inc. [RECORD CITY AND STATE] 13. Kmart [RECORD CITY AND STATE] 14. Lighting One [RECORD CITY AND STATE] 15. Loaf’N Jug [RECORD CITY AND STATE] 16. Lowe’s [RECORD CITY AND STATE] 17. Office Depot [RECORD CITY AND STATE] 18. Red Eagle Food Store [RECORD CITY AND STATE] 19. Rite Aid [RECORD CITY AND STATE]
20. Ridley’s Family Market [RECORD CITY AND STATE] 21. Safeway [RECORD CITY AND STATE] 22. Sam’s Club [RECORD CITY AND STATE] 23. Staples [RECORD CITY AND STATE] 24. The Home Depot [RECORD CITY AND STATE] 25. True Value Hardware [RECORD CITY AND STATE] 26. Walgreens [RECORD CITY AND STATE] 27. Walmart [RECORD CITY AND STATE] 28. Whole Foods [RECORD CITY AND STATE] 29. Online [RECORD WEBSITE] 30. Other [RECORD VERBATIM] [RECORD CITY AND STATE] ‐98. DON’T KNOW
Appendix A48

2011 and 2012 PacifiCorp Home Energy Savings Residential Lighting Survey April 2013
6
‐99. REFUSED
E9a. [SKIP IF E9 = 29] Did you buy any CFL bulbs online in 2011‐2012?
1. Yes [RECORD WEBSITE(S)] 2. No ‐98. DON’T KNOW
Now I’d like to ask you a few questions about where the [READ IN QUANTITY FROM [INSERT E2] CFLs you acquired in 2011 and 2012are now.
E10. How many are currently installed in your home?
1. [RECORD # OF CFLs] [IF THIS QUANTITY = E2 QUANTITY, SKIP TO E14, IE “ALL BULBS ARE INSTALLED IN HOME”]
2. NONE ‐98. DON’T KNOW [SKIP TO B1] ‐99. REFUSED [SKIP TO B1]
E11. How many are in storage for later use?
1. [RECORD # OF CFLs] 2. NONE ‐98. DON’T KNOW ‐99. REFUSED
E12. How many were discarded, broken, or given away?
1. [RECORD # OF CFLs] 2. NONE ‐98. DON’T KNOW ‐99. REFUSED
E13. [ASK IF E10+ E11+E12<> QUANTITY FROM 0] Thanks, that accounts for [E10+ E11+E12] of the total quantity that you bought during 2011 and 2012. Can you tell me where the [INSERT QUANTITY OF 0 MINUS (E10+ E11+ E12)] other bulbs are now?
1. [RECORD VERBATIM] ‐98. REFUSED ‐99. DON’T KNOW
Appendix A49

2011 and 2012 PacifiCorp Home Energy Savings Residential Lighting Survey April 2013
7
E14. [Skip if E10 = 2] Of the [INSERT QUANTITY E10] bulbs that are currently installed in your home that were purchased during 2011 and 2012, can you tell me how many CLFs are installed in each room in your house?
1. Bedroom [RECORD] 2. Bedroom (unoccupied) [RECORD] 3. Basement [RECORD] 4. Bathroom [RECORD] 5. Closet [RECORD] 6. Dining [RECORD] 7. Foyer [RECORD] 8. Garage [RECORD] 9. Hallway [RECORD] 10. Kitchen [RECORD] 11. Office/Den [RECORD] 12. Living Space [RECORD] 13. Storage [RECORD] 14. Outdoor [RECORD] 15. Utility [RECORD] 16. Other [RECORD VERBATIM] ‐98. DON’T KNOW ‐99. REFUSED
E15. [ASK IF TOTAL BULBS IN E14 <QUANTITY FROM E10 (IF TOTAL NUMBER OF BULBS LISTED IN EACH ROOM DOES NOT MATCH THE NUMBER OF BULBS INSTALLED STATED IN E10] Thanks, that accounts for [TOTAL BULBS IN E14] of the total quantity that are currently installed in your home. Can you tell me where the [QUANTITY OF E10 MINUS TOTAL BULBS IN E14] other bulbs are installed?
1. [RECORD VERBATIM] ‐98. DON’T KNOW ‐99. REFUSED
Appendix A50

2011 and 2012 PacifiCorp Home Energy Savings Residential Lighting Survey April 2013
8
Program Awareness
B1. [INSERT UTILITY] offers discounts on CFLs at participating retailers in your area through a program called Home Energy Savings. Before today, were you aware of this program?
1. Yes 2. No [SKIP TO B3]
B2. How did you first hear about [INSERT UTILITY]’s Home Energy Savings program? [DO NOT READ LIST. RECORD FIRST RESPONSE. ONE ANSWER ONLY]
1. Newspaper/Magazine/Print Media 2. Bill Inserts 3. Rocky Mountain Power/Pacific Power website 4. Home Energy Savings website 5. Other website 6. Internet Advertising/Online Ad 7. Family/friends/word‐of‐mouth 8. Rocky Mountain Power/Pacific Power Representative 9. Radio 10. TV 11. Billboard/outdoor ad 12. Retailer/Store 13. Sporting event 14. Home Shows/Trade Shows (Home and Garden Shows) 15. Social Media 16. Other [RECORD VERBATIM] ‐98. [DO NOT READ] DON’T KNOW ‐99. [DO NOT READ] REFUSED
B3. [ASK IF B2<>4] Have you ever visited the Home Energy Savings Website?
1. Yes 2. No
B4. [ASK IF B3 = 1 OR B2=4] Was the Website… [READ]
1. Very helpful 2. Somewhat helpful
3. Somewhat unhelpful 4. Very unhelpful ‐98. [DO NOT READ] DON’T KNOW ‐99. [DO NOT READ] REFUSED
Appendix A51

2011 and 2012 PacifiCorp Home Energy Savings Residential Lighting Survey April 2013
9
B5. What would make the Website more helpful for you? [DO NOT READ RESPONSES, MARK ALL THAT APPLY]
1. Nothing, it is already very helpful for me. 2. Make the website easier to navigate or more user‐friendly (clear hierarchy) 3. Make program information more clear and concise 4. Incorporate more visual information (charts, graphs, images) and less text 5. Provide easier access to customer service or FAQs 6. Other [RECORD] ‐98. [DO NOT READ] DON’T KNOW ‐99. [DO NOT READ] REFUSED
B6. [ASK IF B3=1 OR B2 = 4] Have you ever viewed the list of participating retailers on [INSERT UTILITY]’s Home Energy Savings Website?
1. Yes 2. No ‐98. DON’T KNOW ‐99. REFUSED
B7. [ASK IF STATE = WA, WY or UT; otherwise skip to G1] Are you familiar of the term [IF STATE = WA, INSERT “bewattsmart”][IF STATE = UT or WY, INSERT“wattsmart”]? [DO NOT READ RESPONSES]
1. Yes 2. No ‐98. [DO NOT READ] DON’T KNOW ‐99. [DO NOT READ] REFUSED
Appendix A52

2011 and 2012 PacifiCorp Home Energy Savings Residential Lighting Survey April 2013
10
B8. [ASK IF B7= 1] How did you first hear about [INSERT UTILITY]’s [IF STATE = WA, INSERT “bewattsmart”][IF STATE = UT or WY, INSERT“wattsmart”] energy efficiency programs? [DO NOT PROMPT. RECORD ONLY THE FIRST WAY HEARD ABOUT THE PROGRAMS]
1. Newspaper/Magazine/Print Media 2. Bill Inserts 3. Rocky Mountain Power/Pacific Power website 4. Home Energy Savings website 5. Other website 6. Internet Advertising/Online Ad 7. Family/friends/word‐of‐mouth 8. Rocky Mountain Power/Pacific Power Representative 9. Radio 10. TV 11. Billboard/outdoor ad 12. Retailer/Store 13. Sporting event 14. Home Shows/Trade Shows (Home and Garden Shows) 15. Social Media 16. Other [RECORD VERBATIM] ‐98. [DO NOT READ] DON’T KNOW ‐99. [DO NOT READ] REFUSED
CFL Satisfaction
[ASK CFL SATISFACTION SECTION ONLY IF E10.1 > 0 (CURRENTLY HAS CFLS INSTALLED)]
G1. How satisfied are you with the compact fluorescent light bulb(s) currently in your home? Would you say you are… [READ]
1. Very Satisfied 2. Somewhat Satisfied 3. Not Very Satisfied 4. Not At All Satisfied ‐98. [DO NOT READ] DON’T KNOW ‐99. [DO NOT READ] REFUSED
G2. [IF G1 = 3 OR 4] And why do you say that?
1. [RECORD VERBATUM] ‐98. DON’T KNOW ‐99. REFUSED
Appendix A53

2011 and 2012 PacifiCorp Home Energy Savings Residential Lighting Survey April 2013
11
EISA Awareness
J1. Starting in January 2012, the Energy Independence and Security Act of 2007 began to phase in new federal efficiency standards for lighting. These standards require that traditional incandescent light bulbs improve their efficiency over time by about 25% over current levels. Most traditional incandescent light bulbs do not meet the efficiency standard and may no longer be sold in stores or will be phased out by 2014. Before this call today, had you ever heard of this new federal standard for lighting?
1. Yes 2. No
J2. During 2012, did you have any difficulty finding 100‐watt incandescent light bulbs to purchase?
1. Yes 2. No 3. Did not attempt to purchase100‐watt incandescent light bulbs [SKIP TO J4] ‐98. [DO NOT READ] DON’T KNOW ‐99. [DO NOT READ] REFUSED
J3. Did you purchase any 100‐watt incandescent bulbs in 2012?
1. Yes 2. No ‐98. [DO NOT READ] Don’t Know ‐99. [DO NOT READ] REFUSED
J4. Manufacturers are developing more efficient incandescent bulbs that will meet the new federal standards. Given the choice of purchasing a more efficient incandescent bulb or a CFL, LED or halogen bulb, which do you think you would purchase?
1. Incandescent bulb 2. CFL 3. LED 4. Halogen 5. Other [RECORD] ‐98. DON’T KNOW ‐99. REFUSED
Appendix A54

2011 and 2012 PacifiCorp Home Energy Savings Residential Lighting Survey April 2013
12
LED Usage
Now I would like to ask you about your experience with LED bulbs.
M1. LEDs or light emitting diodes are bulbs that are comprised of many smaller nodular shaped lights that are very bright. Common uses for LEDs include car brake lights and flashlights. We are interested in the LEDs that have been developed to replace traditional household lighting. How familiar are you with LEDs? Would you say that you are… [READ]
1. Very Familiar 2. Somewhat familiar 3. Not too familiar, or 4. Not at all familiar ‐98. DON’T KNOW [DO NOT READ] ‐99 REFUSED [DO NOT READ]
M2. Did you or someone in your household purchase any LED bulbs for standard lighting sockets in 2011 and 2012to be installed in your home?
1. Yes 2. No ‐98. DON’T KNOW [DO NOT READ] ‐99 REFUSED [DO NOT READ]
[IF M2 = 2, ‐98 OR ‐99 SKIP TO D1]
M3. How many did you purchase during 2011 and 2012?
1. [RECORD NUMBER] ‐98. DON’T KNOW ‐99. REFUSED
M4. [SKIP to M6 IF M3 = ‐98 or ‐99 or if state is CA or WY] How many, if any, of the [INSERT QUANTITY FROM M3.1] LEDs that you bought were part of a [INSERT UTILTY] sponsored sale?
1. [RECORD # OF LEDs] 2. NONE ‐98. DON’T KNOW ‐99. REFUSED
M5. [ASK IF M4 = 1] Did the utility discount influence your decision to purchase LEDs over another type of bulb?
1. Yes 2. No ‐98. DON’T KNOW ‐99. REFUSED
Appendix A55

2011 and 2012 PacifiCorp Home Energy Savings Residential Lighting Survey April 2013
13
M6. What [IF M5 IS ASKED SAY “other”] factors influenced your decision to buy LEDs over other types of bulbs? [DO NOT READ] [MULTIPLE RESPONSES ALLOWED]
1. Energy savings 2. Cost savings on electricity bill 3. Price of bulb 4. Environmental concerns 5. Quality of light 6. Lifetime of bulb 7. Other [RECORD] ‐98. DON’T KNOW ‐99. REFUSED
M7. [SKIP IF M3 = ‐98 or ‐99] Where did you install the [INSERT RESPONSE FROM M3.1] LED bulbs that you purchased?
1. Bedroom [RECORD #] 2. Bedroom (unoccupied) [RECORD #] 3. Basement [RECORD #] 4. Bathroom [RECORD #] 5. Closet [RECORD #] 6. Dining [RECORD #] 7. Foyer [RECORD #] 8. Garage [RECORD #] 9. Hallway [RECORD #] 10. Kitchen [RECORD #] 11. Office/Den [RECORD #] 12. Living Space [RECORD #] 13. Storage [RECORD #] 14. Outdoor [RECORD #] 15. Utility [RECORD #] 16. Other [RECORD VERBATIM AND #] ‐98. DON’T KNOW ‐99. REFUSED
M8. How satisfied are you with the LED bulbs currently in your home? Would you say you are… [READ]
1. Very Satisfied 2. Somewhat Satisfied 3. Not Very Satisfied 4. Not At All Satisfied ‐98. [DO NOT READ] DON’T KNOW ‐99. [DO NOT READ] REFUSED
Appendix A56

2011 and 2012 PacifiCorp Home Energy Savings Residential Lighting Survey April 2013
14
M9. [IF M8 = 3 OR 4] And why do you say that?
1. [RECORD VERBATIM] ‐98. DON’T KNOW ‐99. REFUSED
Demographics
I have just a few more questions about your household. Again, all your answers will be strictly confidential.
D1. Which of the following best describes your house? [READ LIST]:
1. Single‐family home 2. Townhouse or duplex 3. Mobile home or trailer 4. Apartment building with 4 or more units 5. Other [RECORD] ‐98. [DO NOT READ] DON’T KNOW ‐99. [DO NOT READ] REFUSED
D2. Do you rent or own your home?
1. Own 2. Rent 3. Other [RECORD] ‐98. DON’T KNOW ‐99. REFUSED
D3. About when was this building first built? [READ LIST IF NEEDED]
1. Before 1970’s 2. 1970’s 3. 1980’s 4. 1990‐94 5. 1995‐99 6. 2000’s 7. OTHER [RECORD] ‐98. [DO NOT READ] DON’T KNOW ‐99. [DO NOT READ] REFUSED
D4. Approximately how many square feet is your home? [READ LIST IF NEEDED]
1. Under 1,000 square feet 2. 1,000 – 1,500 square feet 3. 1,501 – 2,000 square feet 4. 2,001 – 2,500 square feet 5. Over 2,500 square feet ‐98. [DO NOT READ] DON’T KNOW ‐99. [DO NOT READ] REFUSED
Appendix A57

2011 and 2012 PacifiCorp Home Energy Savings Residential Lighting Survey April 2013
15
D5. What is the primary heating source for your home? [READ LIST IF NEEDED]
1. Forced air natural gas furnace 2. Forced air propane furnace 3. Air Source Heat Pump 4. Ground Source Heat Pump 5. Electric baseboard heat 6. Gas fired boiler/radiant heat 7. Oil fired boiler/radiant heat 8. Passive Solar 9. Pellet stove 10. Wood stove 11. Other [RECORD] ‐98. DON’T KNOW ‐99. REFUSED
D6. [IF D5 = 1‐11] How old is the primary heating system? [RECORD RESPONSE IN YEARS]
1. [RECORD 1‐100] ‐98. DON’T KNOW ‐99. REFUSED
D7. What type of air conditioning system, if any, do you use in your home? [INDICATE ALL THAT APPLY]
1. Central Air Conditioner 2. Room Air Conditioner 3. Evaporative Cooler 4. Air Source Heat Pump 5. Ground Source Heat Pump 6. Whole house fan
7. No cooling system before 8. Other [SPECIFY]
‐98. [DO NOT READ] DON’T KNOW ‐99. [DO NOT READ] REFUSED
D8. [SKIP IF D7 = 7] How many years old is your primary cooling system? [RECORD RESPONSE IN YEARS]
1. [RECORD] ‐98. DON’T KNOW ‐99. REFUSED
D9. Including yourself and any children, how many people currently live in your home?
1. [RECORD] ‐98. DON’T KNOW ‐99. REFUSED
Appendix A58

2011 and 2012 PacifiCorp Home Energy Savings Residential Lighting Survey April 2013
16
D10. [IF D11 > 1] Are any of the people living in your home dependent children under the age of 18?
1. Yes 2. No ‐98. DON’T KNOW ‐99. REFUSED
D11. Can you please tell me in what year you were born?
1. [RECORD] ‐98. DON’T KNOW ‐99. REFUSED
D12. In 2012, was your pre‐tax household income above or below $50,000?
1. Below $50,000 2. Above $50,000 3. Exactly $50,000 ‐98. DON’T KNOW ‐99. REFUSED
[IF D12 = ‐98 OR ‐99 SKIP TO L1]
D13. [ASK IF D12=1] Which of the following categories best represents your household income in 2012? Please stop me when I read your category:
1. Under $10,000 2. $10,000 to under $20,000 3. $20,000 to under $30,000 4. $30,000 to under $40,000 5. $40,000 to under $50,000 ‐98. DON’T KNOW ‐99. REFUSED
D14. [ASK IF D12=2] Which of the following categories best represents your household income in 2012? Please stop me when I read your category:
1. $50,000 to under $60,000 2. $60,000 to under $75,000 3. $75,000 to under $100,000 4. $100,000 to under $150,000 5. $150,000 to under $200,000 6. $200,000 or more ‐98. DON’T KNOW ‐99. REFUSED
Appendix A59

2011 and 2012 PacifiCorp Home Energy Savings Residential Lighting Survey April 2013
17
Conclusion
L1. Do you have any additional feedback or comments?
1. Yes [RECORD VERBATIM] 2. No ‐98. DON’T KNOW ‐99. REFUSED
L2. Sex [INTERVIEWER: DO NOT READ]
1. Female 2. Male ‐98. DON’T KNOW
That concludes the survey. Thank you very much for your time and feedback.
Appendix A60

Site Verification Form - Insulation HIM
Inspection Date Cadmus ID
Inspection Start Time Program IOU
Inspection End Time Account / Site Number
Inspector Name / Initials
Primary Contact Name Original Site Visit Date
Phone 1 Original Site Visit Time
Phone 2
Phone 3 New Confirmed Date
email New Confirmed Time
Alternate Contact Name
Phone 1 Incentive Paid
Phone 2 Initials or Signature
Phone 3 Notes
Address 1
Address 2
City
State
Zip Code
Appendix A61

Home and HVAC Onsite NotesEstimated Home Size (Sq. Ft. Cond. Space)Number of Occupants
Type of BasementFull finished basement/Unfinished Basement/
Crawlspace/ Slab on Grade/ OTHER
Year home was built
Weather Conditions
Outdoor Temperature
Indoor Temperature
Air Cond in use
Cooling System Type
Yr Cooling Syst Installed
Cooling Set Points (Sum)Cooling Set Back (Sum) When AwayCooling Set Back (Sum) When at WorkMethod of Determination Cust SR / Insp / Other
Primary Heating Fuel Type Electric / Gas / Propane/ Oil/ Coal/ WoodOther
Primary Heating System TypeFurnace/ Boiler/ Air Source Heat Pump/Ground
Source Heat Pump/ Stove/Baseboard
Yr Heating Syst Installed
Heating Set Point (Wint)Heating Set Back (Wint) When AwayHeating Set Back (Wint) When at WorkMethod of Determination Cust SR / Insp / Other
Secondary Heating Fuel Type Electric / Gas / Propane/ Oil/ Coal/ WoodOther
Secondary Heating System TypeFurnace/ Boiler/ Air Source Heat Pump/Ground
Source Heat Pump/ Stove/Baseboard
What percentage of the heating season is the secondary heating system used?Yr Heating Syst Installed
Heating System Type
Yr Heating Syst Installed Camera 2 Notes
Heating Set Point (Wint)
Method of Determination Cust SR / Insp / Other
Serial Number
Appendix A62

Attic Insulation Database Onsite Notes
Incentive Received Correct / incorrect
Incentive Date Correct / incorrect
Unit Quantity (Sq feet) #VALUE!Sq feet installed over conditoned living area
Required
Method of determination Cust SR / Insp Estimate / Other Required
Location(s) rebated
New Insulation material
Fiberglass batts/ Blown in Fiberglass/ Blown in Cellulose/Rockwool/Spray
Foam/Foam boards/ Other Required
Method of determinationCust SR / Insp / Invoice / Printed on Insul /
OtherRequired
R-Value Information on Existing Attic InsulationTotal Thickness of Insulation Required Note: Full depth between Studs
Minimum Total Thickness Required
Maximum Total ThIckness Required If different layers of material, describe individual layer material and thicknesses of individual layers.
Required
Method of determinationCust SR / Measurement / Invoice / Printed
/ OtherRequired
Total R-value present Required
Method of determinationCust SR / Calculation / Invoice / Printed /
OtherRequired
Old Attic InsulationWas old attic insulation still present?
Yes / No Required
Old attic insulation material
Fiberglass batts/ Blown in Fiberglass/ Blown in Cellulose/Rockwool/Spray
Foam/Foam boards/ Other
Square footage of old attic insulation materialThickness of Old Attic Insulation
Method of determinationCust SR / Measurement / Invoice / Printed
/ OtherPre-Existing R-Value
Method of determinationCust SR / Calculation / Invoice / Printed /
Other
Access Panel Insulated Not Relevant if Attic Doorway… Yes / No / NARequired, Note N/As
Appendix A63

Floor Plan Sketch. Note Measurements
Appendix A64

From Building Performance Institute Technical Standards
Default Values for Insulation
When manufacturer’s rated R‐values for insulation are not available, use the chart below to estimate the R‐value per inch for the installed product
Typical Insulation R-valuesInsulation Type R-value per inch Typical ApplicationsCellulose, loose fill 3.7 Attic Floor
Cellulose, high density 3.2 Walls, Enclosed Cavities, FramingTransitions
Fiberglass, batts 3.0* Basement Ceiling, Open Stud Walls, AtticFloor*
Fiberglass, loose fill 2.8 Attic Floor, Walls (existing)
Fiberglass, loose fill, fluffedbelow manufacturer’s standards
uncertain Do not install, or correct by blowing overwith higher density
Rockwool 3.0 Attic Floor, Walls, Basement Ceiling (maybe loose or batts)
Vermiculite 2.7 Attic Floor
Poly-isocyanurate, rigid board 7.0 Foundation Walls, Attic Access Doors
Polystyrene, expanded rigid board
4.0 Foundation Walls, Sill Plate
Polystyrene, extruded rigid board
5.0 Foundation Walls, Sub-Slab, Sill Plate
Low Density Urethane, sprayed foam
3.7 Attics, Walls (new construction); Sill Plate, Band Joist, Framing Transitions
Urethane, sprayed foam 6.0 Attics, Walls (new construction); Sill Plate,Band Joist, Framing Transitions
Urea Formaldehyde Foam 4.0 Attics, Walls (existing)
Appendix A65

Wyoming HES 2011‐2012 Evaluation Appendix B1
Appendix B. Precision Calculations
To determine the level of uncertainty in the evaluation results, Cadmus considered the effect of
sampling error on all estimates presented in the report. Sampling error refers to the uncertainty
introduced by using sampled data to infer characteristics of the overall population. These data include
survey results, meter data, and information from secondary sources. Cadmus used sampled data to
estimate parameters for per‐unit savings calculations (such as installation rates) and to estimate the
consumption of specific equipment types (such as in billing analysis).
The confidence intervals around the estimates reflect sampling error. Unless otherwise noted, Cadmus
estimated intervals at 90% confidence; meaning that with 90% confidence, the true population value lies
within the given interval. Cadmus determined confidence intervals for means, proportion, regression
estimates, and any calculated values using sample estimates as an input. Cadmus calculated all
confidence intervals using the standard formula to estimate uncertainty for proportions and means. For
mean values, we used the following formula:
1.645 ∗
Where s2 equals the sample variance, and 1.645 equals the z‐score for a 90% confidence interval.
In some cases, the uncertainty of estimates came from several sources. For example, in cases of
summed estimates, such as those for total program savings, we calculated the root of the sum of the
squared standard errors to estimate the confidence interval:1
1.645 ∗
In some cases, Cadmus multiplied uncertainty estimates. For instance, net savings calculations involved
combining gross estimates with an in‐service rate and/or NTG ratio estimated from participant surveys.
For these final estimates, Cadmus calculated combined standard errors. In cases where the relationship
was multiplicative, Cadmus used the following formula:2
∗ ∗ 1.645 ∗
1 This approach to aggregating errors follows the methods outlined in Appendix D from: Schiller, Steven et al.
National Action Plan for Energy Efficiency. Model Energy Efficiency Program Impact Evaluation Guide. 2007.
Available online: www.epa.gov/eeactionplan.
2 Derived from: Goodman, Leo. "The Variance of the Product of K Random Variables," Journal of the American
Statistical Association. 1962.

Wyoming HES 2011‐2012 Evaluation Appendix B2
In some cases, a ratio of two estimates was needed, such as in estimating the spillover ratio, which was
expressed as the ratio of spillover savings to program savings. For this calculation, Cadmus used the
following formula:3
/ 1.645 ∗
To ensure transparency of the error aggregation process, Cadmus reported precision for both individual
and combined estimates, where relevant.
3 Derived from: Stuart, A. and J. Ord. Kendall’s Advanced Theory of Statistics (6th Edition). Edward Arnold. 1998.

Wyoming HES 2011‐2012 Evaluation Appendix C1
Appendix C. Program Incentives
Table C1 shows the measures and incentives for customers and dealers over the 2011‐2012 program
period.
Table C1. HES Program Incentives by Measure
Measure Energy‐Efficient
Standards Unit
2011 Pre‐Tariff
Incentive Levels*
2011 Post‐ Tariff
Incentive Levels**
2012 Incentive Levels
Dealer Incentive
Clothes Washer
MEF 1.72‐1.99 Units $50
MEF 2.0+ Units $75
MEF 2.46+ Units $50 $50
Dishwasher ENERGY STAR Units $20
CEE Tier 2 qualified Units $20 $20
Electric Water Heater
40+ gallons (EF 0.93+) Units $50
Qualified models $75 $75
Evaporative Cooler
Qualified models Units $100
Portable 2,000+ CFM Units $75 $75
Permanently Installed (3,500+CFM)
Units $150 $150 $100
Refrigerator ENERGY STAR Units $20 $20 $20
Freezer ENERGY STAR Units $20 $20
Room AC ENERGY STAR Units $25 $25
Ceiling Fans ENERGY STAR Units $20 $20 $20
Ceiling Fan Light Kits
ENERGY STAR Units $20 $20
Fixtures ENERGY STAR Units $20 $20 $20
Flat Screen TV ENERGY STAR Units $50 $50
Desktop Computer ENERGY STAR
Units $10 $10
Monitor ENERGY STAR Units $5 $5
Insulation
Attic (R‐19 +) Square Feet
$0.35
Floor (R‐19 +) Square Feet
$0.35
Wall (R‐11+ or fill cavity)
Square Feet
$0.35
Attic (Existing R‐20 or less, add R‐30+, final depth R‐49+)
Square Feet
$0.50/ 0.15**
$0.50/ 0.15**
Wall (Existing R‐10 or less, final depth R‐13 or fully fill cavity)
Square Feet
$0.60/ 0.30**
$0.60/ 0.30**
Electrically Heated Square $0.50 $0.65

Wyoming HES 2011‐2012 Evaluation Appendix C2
Measure Energy‐Efficient
Standards Unit
2011 Pre‐Tariff
Incentive Levels*
2011 Post‐ Tariff
Incentive Levels**
2012 Incentive Levels
Dealer Incentive
Homes: Floor (Existing R‐18 or less, final depth R‐30+)
Feet
Bonus: Two qualifying areas
Projects $200 $200
Windows
U‐Factor of 0.35 or less and 0.33 or less SHGC
Square Feet
$1.00
U‐Factor of 0.30 of lower
Square Feet
$1.00 $1.00
Central Air Conditioner
Tune up++ Projects $20 $25
CAC (15+ SEER &TXV) Units $250 $250+ $25
CAC (13+ SEER & TXV) and Best Practices Install++
Projects $50 $50 $75
CAC (13+ SEER & TXV) and Sizing
Projects $50 $50+ $25
CAC Tune‐Up + (350 CFM/ton/min air flow)
Projects $100 $20 $25
Duct Sealing & Insulation
Duct Sealing++ Projects $150 $50
Electric Heating: Duct Sealing and Insulation
Projects $375 $375 $75
Electric Cooling: Duct Sealing and Insulation
Projects $275 $275 $75
Heat Pumps
Heat Pump Conversion (8.2+ HSPF & TXV)
Projects $350 $400 $400+ $25/
$100+++
Heat Pump Upgrade (8.2+ HSPF & TXV)
Projects $250 $300 $300+ $25/
$100+++
Hybrid‐heat pump Water Heater
Units $150 $150 $100
Single‐head ductless heat pump (9+HSPF and 16+ SEER)++
Units $500 $500 $100/ $50+++
Heat pump water heater++
Units $150 $100
Tune‐Up++ Projects $100 $100 $25
Best Practices Install and Proper Sizing++
Projects $100 $100 $100
New Homes
Electrically Heated Homes: Attic Insulation (final level R‐60+)
Square Feet
$0.15 $0.15
Electrically Heated Square $0.35 $0.35

Wyoming HES 2011‐2012 Evaluation Appendix C3
Measure Energy‐Efficient
Standards Unit
2011 Pre‐Tariff
Incentive Levels*
2011 Post‐ Tariff
Incentive Levels**
2012 Incentive Levels
Dealer Incentive
Homes: Floor Insulation (final level R‐30+)
Feet
Electrically Heated Homes: Wall Insulation (final level R‐26+)
Square Feet
$0.35 $0.35
Heat Pump with Best Practices Install and Sizing++ (9.5+ HSPF; 14.5+ SEER with TXV; and 5 tons or less)
Projects $450 $450 $150
Multi‐head ductless heat pump (9.0 HSPF, 16 SEET)
Units $500 $500 $100
Windows, dishwasher, refrigerator, and evaporative cooler
Units Same as
listed above Same as
listed above
CFLs Standard and specialty Lamps Varied Varied
* Effective for all purchases, installations, or services performed prior to October 1, 2011 ** Effective for all purchases, installations, or services performed after October 1, 2011 *** Electrically heated/cooled homes ++ Program qualified contractor required +++ 2011 Pre‐Tariff/2011 Post Tariff and 2012

Wyoming HES 2011‐2012 Evaluation Appendix D1
Appendix D. Stored‐to‐Installed CFL Bulbs Savings
For the 2011‐2012 lighting evaluation, Cadmus calculated first‐year savings from installed bulbs, and did
not credit savings for any bulb that was either discarded or stored. Several studies, however, have
shown that up to 99% of stored bulbs are moved into sockets within a few years, causing savings to
occur several years after the initial purchase. As an informational example of the savings generated by
stored bulbs being moved into sockets in the second and third year of ownership, Cadmus calculated the
gross savings impacts for the 2009‐2010 and 2011‐2012 program periods in Wyoming, shown in Table
D1.
Table D1. 2009‐2012 Savings
Year Bulb Was
Purchased
Second Year
Savings (kWh)
Third Year
Savings (kWh)
2009 321,583 321,583
2010 461,422 461,422
2011 396,238 396,238
2012 495,813 495,813
Cadmus used the Uniform Methods Project (UMP)1 recommended method to calculate the savings from
bulbs initially stored and later installed. The UMP explains that most bulbs placed into storage (99%) are
subsequently installed within two years, and recommends calculating the installation rate for the two
years after the bulb purchase as follows:
99%2
Where:
ISR = In‐service rate
Y1 = Year 1, the year the bulb was purchased
Y2, Y3 = Years 2 and 3, the two years following the year the bulb was purchased
99% = The percentage of program bulbs installed within three years, including
the program year
1 The UMP is a framework and set of protocols established by the U.S. Department of Energy for determining
the energy savings from energy‐efficiency measures and programs. More details are available online:
https://www1.eere.energy.gov/office_eere/de_ump_protocols.html.

Wyoming HES 2011‐2012 Evaluation Appendix D2
Since Cadmus’ phone surveys captured details about bulbs that were not only placed into storage but
also discarded or given away, we calculated the second and third year savings using the following
adjusted algorithm:
1 99%2
Where:
Discard = The percentage of bulbs discarded or given away
Table D2 shows how many bulbs were sold through the program each year and the estimated second
and third year ISR values that apply to those quantities.
Table D2. Bulbs installed in Y2 and Y3
Year Bulb Was
Purchased Quantity ISR % Discarded %
Second Year
ISR Third Year ISR
2009 88,040 67% 12% 10% 10%
2010 126,324 67% 12% 10% 10%
2011 134,003 72% 11% 8% 8%
2012 167,678 72% 11% 8% 8%
Cadmus then applied the second and third year ISR values to the unit energy savings (UES) calculated in
the 2011‐2012 evaluation, as shown in Table D3.
Table D3. Gross UES Used to Calculate Second and Third Year Savings
2011‐2012 Evaluated Values
Gross UES 25.3
Y1 ISR 72%
Gross UES without ISR 35.1
Table D4 illustrates the years in which first‐, second‐, and third‐year savings occur. The first‐year savings
have already been claimed in the evaluation reports, however the second‐ and third‐ year savings have
never been claimed or reported by Rocky Mountain Power.
Table D4. Application of Y2 and Y3 Savings
Year Savings Occurring
2009 2010 2011 2012 2013 2014
2009 Bulbs First Year Second Year Third Year
2010 Bulbs First Year Second Year Third Year
2011 Bulbs First Year Second Year Third Year
2012 Bulbs First Year Second Year Third Year
Wyoming HES 2011‐2012 Evaluation Appendix E1
Appendix E. Hours‐of‐Use Methodology
Cadmus estimated CFL hours‐of‐use (HOU) using a multistate modeling approach, built on light logger
data collected from five states: Maryland, Michigan, Missouri, Maine, and Ohio.
Metering Protocol Following whole‐house lighting audits, Cadmus installed up to eight loggers in each participant home.
The metering period varied by utility, ranging from three months to one year. For homes with five or
fewer CFL fixture groups identified, Cadmus installed light loggers on every CFL fixture. For homes with
more than eight CFL fixture groups, we randomly selected eight fixtures to meter using systematic
sampling, which involved installing a logger on every nth CFL fixture (the nth number being based on the
total number of possible CFL fixtures and generated randomly).
During the logger removal process, Cadmus collected additional data for evaluating the data quality and
determining if loggers had failed, been tampered with, or removed. Moreover, prior to removing each
logger, we noted whether the logger was correctly installed, and where its sensor was oriented.
Model Specification To estimate HOU, Cadmus determined the total time each individual light logger was “on” per day, using
the following guidelines:
If a light logger did not record any light for an entire day, the day’s HOU was set to zero.
If a light logger registered that a light turned on at 8:30 p.m. on Monday, and turned off at 1:30
a.m. on Tuesday morning, 3.5 hours were added to Monday’s HOU and 1.5 hours were added to
Tuesday’s HOU.
Cadmus then modeled both weekday and weekend daily HOU as a function of room type, the presence
of children in the home, and CFL saturations in the home. We accomplished this using two analysis of
covariance (ANCOVA) models, one for each day type.
ANCOVA models are regression‐based and model continuous variables as a function of single continuous
explanatory variable (in this case, CFL saturation) and a set of binary variables. This way, an ANCOVA
model simply serves as an analysis of variance (ANOVA) model with a continuous explanatory variable
added. Cadmus chose this specification because of its simplicity, which makes it suitable for a wide
variety of contexts. Though the model may lack the specificity of other more complex methods, its
estimates are not nearly as sensitive to small differences in explanatory variables. Therefore, these
models can produce consistent estimates of the average daily HOU for a given region using the specific
distribution of bulbs by room and household type, and the existing CFL saturation.

Wyoming HES 2011‐2012 Evaluation Appendix E2
Cadmus specified the final models as cross‐sectional, ANCOVA regressions for day type1 (j) and bulb type
(i), as:
,
Where:
CFL Saturation = The proportion of bulbs in the home that are CFLs;
Kids = A dummy variable2 equal to one if the household has children under
18 and zero otherwise;
Kitchen = A dummy variable equal to one if the bulb is in the kitchen and zero
otherwise;
Basement = A dummy variable equal to one if the bulb is in the basement and
zero otherwise;
Outdoor = A dummy variable equal to one if the bulb is in the outdoor and zero
otherwise;
Bedroom = A dummy variable equal to one if the bulb is in the bedroom and
zero otherwise;
Bathroom = A dummy variable equal to one if the bulb is in the bathroom and
zero otherwise; and
Other = A dummy variable equal to one if the bulb is in a low‐use room
(such as a utility room, laundry room, or closet) and zero otherwise.
Cadmus tested the potential influences of other demographic and regional variables in model
specification, such as latitude, income, education, and home characteristics. However, we did not end
up including these variables because their estimated coefficients did not differ significantly from zero or
produced signs inconsistent with expectations.
Final Estimates and Extrapolation As shown in Table E1, not all estimated coefficients of the two models differed significantly from zero for
both day types, most likely due to differences in schedules between days. Nevertheless, we included the
same independent variables in each model for better cross comparability.
1 The two day types for this analysis were weekend and weekday, with weekend defined as Saturday and
Sunday, as well as the following federal holidays: Christmas, Thanksgiving, Labor Day, Memorial Day, New
Year’s Day, Fourth of July, Presidents’ Day, and Veterans’ Day.
2 Dummy variables are binary, which means they take only values of zero or one. Coefficients for these variables
can be interpreted as the difference in mean values between the two mutually exclusive groups.

Wyoming HES 2011‐2012 Evaluation Appendix E3
Table E1. HOU Model ANCOVA Estimates
Coefficient Weekday Weekend
Parameter Estimate p‐value* Parameter Estimate p‐value*
Intercept** 2.38 <.0001 2.17 <.0001
CFL Saturation ‐0.82 0.459 ‐0.34 0.595
Kids 0.94 0.335 1.28 0.777
Kitchen 1.26 0.001 0.75 0.174
Basement 0.33 0.776 ‐1.29 0.004
Outdoor 1.27 0.118 ‐0.02 0.979
Bedroom ‐1.06 0.000 ‐1.57 0.000
Bathroom ‐0.85 0.057 0.92 0.625
Other ‐1.36 0.009 ‐1.91 <.0001
* P‐values indicate the degree of confidence that the given coefficient equals zero. In other words, it is the
probability the effect of a given variable on HOU is random. Therefore, a lower p‐value indicates a higher degree of
confidence in the estimated effect.
** The models’ intercept is the average HOU in the main living space (defined as the dining room, hallways, living
rooms, and office/den areas) when existing CFL saturations are zero and no children live in the home.
Cadmus used these model parameters to predict average daily use by summing the product of each
coefficient shown in Table E1 and its corresponding average independent variable. Table E2 shows the
independent variables we used for the HES Program. Except for CFL saturation, Cadmus estimated
independent variables using 2011–2012 participant survey data. 3 Cadmus used the CFL saturation from
Rocky Mountain Power’s most recent potential study. Absent a recent primary data source, Cadmus felt
that this number was the best estimate of current CFL saturation. Given the relatively low weight the
model gives to saturation, this assumption does not have a large bearing on the final result.4
Table E2. HOU Estimation Input Values
Variable Value
CFL Saturation 30%
Kids 43%
Kitchen 10%
Basement 6%
Outdoor 3%
Bedroom 28%
Bathroom 17%
Other 8%
3http://www.pacificorp.com/content/dam/pacificorp/doc/Energy_Sources/Demand_Side_Management/DSM_Potential_Study
/PacifiCorp_DSMPotential_Vol‐II_Mar2013.pdf 4 For instance, even if CFL saturation were zero, average HOU would only increase 0.2 hours.

Wyoming HES 2011‐2012 Evaluation Appendix E4
Using these values, Cadmus used the following equation to calculate a 2.18 average weekday HOU: 5
2.38 0.82 ∗ 0.30 0.94 ∗ 0.43 1.26 ∗ 0.10 0.33 ∗ 0.06 1.27 ∗ 0.031.06 ∗ 0.28 0.85 ∗ 0.17 1.36 ∗ 0.08 2.18
Using the same method, Cadmus calculated weekend HOU using parameter estimates from the
weekend model. The weighted average of these two values then provides the average annual HOU
(shown in Table E3):
Table E3. HOU by Day Type
Day HOU Weight
Weekday 2.18 69%
Weekend 2.19 31%
Overall 2.18
The precision calculations for model estimates accounted for sampling errors in model estimates and
sample inputs, which largely arose from participant surveys. The precision of individual HOU estimates
can be impacted by the precision of logger data model estimates and by the accuracy of model inputs
used for extrapolation. Cadmus estimated the final relative precision for CFL HOU in the HES Program to
be ±3.8% with 90% confidence.
Benchmarking The HOU estimate for the 2011‐2012 HES Program is in line with estimates we’ve seen in metering
studies across the country. Table E4 compares recent metering study results from around the country
(as well as the 2009‐2010 Rocky Mountain Power evaluation) to the findings of this study. While the
HOU declined slightly from the previous evaluation, the new value is still in the middle range of
estimates found nationwide.
5 The equation does not calculate to 2.18 exactly due to rounding of the inputs.

Wyoming HES 2011‐2012 Evaluation Appendix E5
Table E4. Comparison of Evaluated HOU Estimates
Utility Data Source Report Year
HOU
California Statewide Primary: Metering of 1,200 homes 2010 1.90
RTF Recommended “Final Evaluation Report: Upstream Lighting Program.” KEMA, Inc. (California statewide value)
2010 1.90
Midwest Utility Primary: Metering of 51 homes 2012 1.97
Northeast utility Primary: Metering of 41 homes 2012 2.04
Rocky Mountain Power: WY
Secondary research: Meter data collected in 5 states 2013 2.18
Rocky Mountain Power: WY
Secondary research: Meter data collected in 4 states 2012 2.25
Western Utility Secondary research: RLW Analytics, California Lighting and Appliance Efficiency Saturation Study (CLASS), 2005.
2009 2.30
Midwest Utility Primary: Metering of 101 homes 2012 2.60
New England Utilities Primary: Metering of 157 homes 2009 2.80
Midwest Utility Primary: Metering of 44 homes 2011 2.91
Mid‐Atlantic Utilities Primary: Metering of 59 homes 2011 2.98
Mid‐Atlantic Utilities Primary: Metering of 131 homes 2012 3.15

Wyoming HES 2011‐2012 Evaluation Appendix F1
Appendix F. Price Response Modeling
Price Response Modeling To estimate HES Program freeridership for CFLs, Cadmus performed price response modeling (an
estimation of demand elasticity) using information from the tracking database provided by the program
administrator. This approach involves using point‐of‐sale data collected by the administrator to
econometrically estimate the effect of price changes on the number of bulbs sold. Price response
modeling uses variations in bulb prices over time due to contract adjustments to recover the price
elasticity of customer demand, or the change in quantity demand due to a change in price. Using these
estimated price elasticities, one can predict what sales would have been in absence of the program,
when bulbs would have been sold at their original retail prices.
Methodology
For each unique combination of retailer, model number, and incentive level, the input dataset contained
the following fields relevant to our analysis:
Original retail price
Incentive provided by Rocky Mountain Power
Target retail price
Number of bulbs per package
Rated wattage
Rated lifetime in hours
Model designation (e.g., specialty, LED, fixture, standard)
Program month in which the product was sold
Initially, Cadmus planned to use complete sales records from both 2011 and 2012. The program
administrator had provided Cadmus with a sample dataset in July of 2012 that contained all of the
relevant data fields (listed above). However, the program administrator changed their data tracking
system mid‐way through 2012. When the final data arrived in July 2013 from the new data system, the
format had changed and some of the required fields were no longer contained in the database. Cadmus
worked extensively with the administrator to obtain the missing data, but the previous data system did
not link to the new system.
Instead, Cadmus relied on the data from the prior data tracking system, which covered 18 months of the
program period and did not contain sales data from June 2012 through December 2012. The program
administrator did not reveal any systematic differences between the first 18 months of the program
period and the final six months of the program period. We compared the mix of products with respect
to retailer and bulb characteristics to determine if the sample was generally representative. Given that
incentive levels are set based on the criteria, pricing and incentives were also relatively consistent.

Wyoming HES 2011‐2012 Evaluation Appendix F2
Because of the relatively small size of the programs in Rocky Mountain Power’s Idaho and Wyoming
service territories, Cadmus combined the two states when estimating the price elasticity model. This
increased the number of observations with which to estimate price elasticities and the
representativeness of the mix of bulbs and retailers with observed price variation.
Cadmus modeled the data as a panel, with a cross‐section of program package quantities modeled over
time. Of total bulb sales, 40% incurred price variations over the program period. This means the
program administrator altered incentive levels over time, which is necessary to estimate price
elasticities for a variety of program bulbs.
The bulbs that incurred price variations were representative of the program as a whole. Cadmus
modeled a variety of bulb types: spiral, globe, flood, and reflector bulbs, as well as single and multi‐
packs. Also, the retailers where the price variations occurred accounted for 80% of the Wyoming
program bulb sales.
It is important to consider the overall level of price variation and the representativeness of the bulbs
with observed variations in price over the program period. Because not all bulbs experienced changes in
price levels within the program period, it is important to be confident in the assumption that the
elasticities estimated for bulbs that do experience price changes are reasonable approximations of those
that do not. Given the overall level of price variation, the representativeness of bulb types, retail
channels, and the similarities in Rocky Mountain Power’s service territories in Wyoming and Idaho, this
assumption is reasonable.
Because the program administrator provided the prices with and without program incentives for all
bulbs, Cadmus used price and demand variations within the program period as the basis for the demand
modeling, which allowed for estimating the market response to the program discounts. Figure F1 below
shows an example graph of average price and bulb sales at a participating retailer. Price and bulb sales
have an inverse relationship; when the price decreases, bulb sales increase.

Wyoming HES 2011‐2012 Evaluation Appendix F3
Figure F1. Average Price and Sales at a Participating Retailer
Cadmus modeled product sales over time as a function of price, incentive, and other relevant variables
described below. We tested a variety of specifications to ascertain the impact of price – the main
variable affected by the program – on the demand for bulbs.1 This model assumes that bulb sales are a
function of bulb characteristics, seasonal trends, and price.
Discreet promotional events were not available and were therefore not included in the model. Other
important factors that increase bulb sales, such as product placement and general promotion, were also
unavailable and therefore held constant by the model and not accounted for in the freeridership
calculations. This data could be incorporated into the model if specific promotions and advertising
placements were tracked at the retail level. This would allow program effects other than price to be
captured in the model and attributed to the program.
It is important to note the limitations of the available data. Cadmus performed a preliminary analysis of
the data and found some discrepancies in the reported sale price per bulb. The calculated sale price
should equal:
1 Cadmus focused these diagnostics on ensuring that all explanatory variables were included, minimizing bias, and maximizing predictive accuracy.

Wyoming HES 2011‐2012 Evaluation Appendix F4
Cadmus followed up with the program administrator and gave examples of this discrepancy. The
administrator was primarily responsible for tracking individual bulb sales and incentives at the bulb level
and therefore is was possible that there were some data entry errors in recording the original sale price,
as tracking original package prices was not a program requirement. The administrator also indicated
that some of the additional manufacturer incentives were not tracked reliably in their program
database; again this happened because it was not a program requirement to track program savings or
expenditures.
Accurate prices are important for this analysis, since the freerider sales are estimated based on the price
elasticity and the original price that the consumer would have paid in absence of the program. Since the
discrepancies were data entry errors, and there was likely no systematic bias in the errors, Cadmus
decided to proceed with the analysis. However, it should be noted that although the analysis was based
on the best available data, some data were unavailable (promotional and product placement
information) and there were identified errors in the price data fields. The program administrator
indicated that they began tracking additional price data on product placements and promotions details
in 2013.
The basic equation for the price response model was estimated as follows (for bulb model i, in period t):
ln ∗ ln ∗ ln ∗ ln
Where:
ln = Natural log
Q = Quantity of packages sold during the month
DIY dum = A dummy variable equaling 1 if the retailer is a do‐it‐yourself
store; 0 otherwise
P = Average retail price (after markdown) in that month
Other dum = A dummy variable equaling 1 if the retailer, i, is not a do‐it‐
yourself store; 0 otherwise
Multi dum = A dummy variable equaling 1 if the pack size of bulb, i, is greater
than one; 0 otherwise
model dum = A dummy variable equaling 1 for each unique retailer and model
number; 0 otherwise
month dum = A dummy variable equaling 1 in a given month; 0 otherwise
The β1 through β3 coefficients each represent a specific price elasticity of demand. β1 represents the
price elasticity of demand for single‐pack bulbs at do‐it‐yourself retailers, while the β2 coefficient
represents the incremental change in price elasticity of demand for single‐pack bulbs not sold at do‐it‐
yourself stores. These include club stores, mass market retailers, and local grocery chains. The β3

Wyoming HES 2011‐2012 Evaluation Appendix F5
coefficient represents the incremental change in price elasticity for multi‐pack bulbs. Using these
estimates, Cadmus predicted sales with and without the program. The difference in sales scenarios
yields the sales lift attributable to the program. Cadmus then calculated the total savings in each
scenario using per‐unit savings at the bulb level. Savings without the program divided by total program
savings then equals the freeridership ratio:
Model Results
Cadmus assessed the model accuracy based on generalized estimating equations statistics, the
individual parameter estimates, and the overall accuracy of the predictions compared to actual program
sales by month. Figure F2 shows the predicted sales and actual sales by month.
Cadmus focused model diagnostics on how well the model predicted the actual, observed program
sales. As seen in Figure F2, the model predicted sales reasonably well. Though there were discrepancies
in some months between the predictions and actual sales, there was no systematic trend in over‐ or
under‐predicting.
Figure F2. Predicted and Actual Sales by Month
Using a price response model, Cadmus predicted what bulb sales would have been without program
incentives. To complete this analysis, we used the model coefficients to predict sales both at the
incented prices (program scenario) and as if prices had been at their original retail price (hypothetical
scenario). Using predictions for both program sales and sales without the program mitigates the effect
of any bias in the prediction errors. We attribute the difference between projected program sales and
projected sales in absence of the program to Rocky Mountain Power Wyoming’s program.

Wyoming HES 2011‐2012 Evaluation Appendix F6
Sales are then multiplied by gross annual kWh savings per bulb and the number of bulbs per package to
get total savings. The difference in savings between this hypothetical scenario and what actually
occurred provides the net savings attributable to the program, illustrated in Figure F3. The ratio of these
savings to the total program savings is equal to freeridership.
Figure F3 shows the estimated net and freerider savings by month. There is a notable decline in
freeridership in the winter months. This could be attributable to two factors. First, there are likely
seasonal trends in lighting sales where bulb sales are greater in winter months due to fewer daylight
hours and ENERGY STAR’s “Change a Light, Change the World” campaign which typically peaks in
October. Second, there could be promotional activities unobserved in the data available for this analysis.
Figure F3. Net Savings Attributable to Wyoming HES Program by Program Month
Table F1 shows the net savings results. Overall, freerider savings was estimated to be 35% resulting in a NTG of 65%.
Table F1. Program Net of Freeridership
Model Type Freeridership NTG*
Lower 90%
Confidence
Limit
Upper 90%
Confidence
Limit
Standard CFLs 34% 66% 59% 76%
Specialty CFLs 50% 50% 43% 61%
All CFLs 35% 65% 58% 75%
*Spillover was not calculated for this program. Therefore NTG is savings does not include a spillover adjustment.

Wyoming HES 2011‐2012 Evaluation Appendix F7
Cadmus also separately estimated freeridership by distribution channel, as shown in Table F2. Cadmus
predicted monthly sales and corresponding kWh savings for each individual bulb model using the
method as described above, then aggregated the results by retail channel and bulb type. Taking the
difference between predicted savings with the program and in absence of the program allowed us to
estimate NTG by retail channel and bulb type.
Table F2. Incentives as a Share of Original Price and NTG by Retail Channel and Bulb Type
Retail Channel Average
Original Retail Cost per Bulb
Average Incentive per
Bulb
Percent of Original Retail
Percent of Program Savings
Net of Freeridership
Do‐it‐Yourself* $2.72 $1.74 64% 27% 74%
Other** $2.18 $1.29 59% 73% 62%
*Cadmus defined Do‐it‐Yourself stores as retailers primarily selling hardware and/or building supplies, such as Home Depot, or
Ace Hardware.
**Other retailers cover all those not categorized as Do‐it‐Yourself, such as Wal‐Mart, or Walgreens.
NTG Benchmarking Upstream lighting NTG values can be difficult to compare between programs, as both program delivery
characteristics and evaluation estimation techniques vary widely. In addition, most programs focus on
standard bulbs and have a limited number of incented specialty, LED, or fixture models.
Cadmus performed this same methodology for the Efficiency Maine 2010‐2011 program, for a Mid‐
Atlantic utility, and for several Midwestern utilities. Table F3 compares the net of freeridership results
with the average incentives paid for evaluated bulb types among the programs. The primary reason for
the high freeridership for specialty bulbs in the Efficiency Maine program is that incentives as a share of
purchase price are lower than for both Rocky Mountain Power and the Midwestern utilities and the
specialty bulbs made up a small fraction of the program overall. The incentive must be high enough to
encourage purchasers beyond those who would have bought without the incentive.

Wyoming HES 2011‐2012 Evaluation Appendix F8
Table F3. Incentive as a Share of Retail Price by Bulb Type
Upstream CFL
Program
Bulb
Type
Average Original
Retail Cost per Bulb
Average Incentive
per Bulb
Percent of
Original Retail
Net of
FR*
Rocky Mountain
Power Wyoming
Standard $2.58 $1.76 68% 66%
Specialty $4.71 $1.74 37% 50%
Efficiency Maine
2010‐2011
Standard $3.65 $1.02 28% 68%
Specialty $6.77 $1.33 20% 8%
Midwest Utility 1
2012
LED $36.99 $13.94 38% 83%
Specialty $5.20 $1.90 37% 65%
Mid‐Atlantic
Utility 2013
Standard $5.23 $1.73 33% 33%
Specialty $2.03 $1.23 61% 59%
Midwest Utility 2
2012
Standard $2.11 $1.00 47% 51%
Specialty $5.01 $1.56 31% 24%
*In order to compare across evaluations, the results in this table are presented net of freeridership rather than
NTG, which sometimes includes spillover.

Wyoming HES 2011‐2012 Evaluation Appendix G1
Appendix G. Attic, Floor and Wall Insulation Billing Analysis
Cadmus conducted billing analysis to assess the actual net energy savings associated with insulation
measure installations.1 Cadmus determined the savings estimate from a pooled, conditional savings
analysis (CSA) regression model, which included the following groups:
Insulation (combined attic, wall, and floor insulation for 2011–2012); and
Nonparticipant homes, serving as the comparison group.
The billing analysis resulted in a net realization rate of 112% for insulation measures.
Program Data and Billing Analysis Methodology Cadmus used the following sources to create the final database for billing analysis:
Program data, collected and provided by the program implementer (including account
numbers, measure types, installation dates, square footage of insulation installed, heat source,
and expected savings for the entire participant population).
Control group data, which Cadmus collected from a random sample of approximately 13,000
nonparticipating customers in the Wyoming territory who had complete billing data from
January 2010 through April 2013. We matched the energy use for the control group to quartiles
of the participants’ pre‐participation energy use to ensure comparability of the two groups. To
ensure adequate coverage of the nonparticipating population, Cadmus included four times
more nonparticipants than participants.
Billing data, provided by Rocky Mountain Power, included data from 332 Wyoming HES
accounts for participant that installed insulation measures, and from a random sample of 13,127
Wyoming nonparticipating customers. These data included meter‐read dates and kWh
consumption from January 2010 through April 2013. The final sample we used in the billing
analysis consisted of 243 participants and 972 control customers.
Wyoming weather data, including daily average temperatures from January 2010 to April 2013
for seven weather stations, corresponding with the locations of HES participants.
Cadmus matched program data with billing data, and mapped daily heating and cooling degree days to
respective monthly read date periods, using ZIP codes.
Cadmus defined the pre‐period for the billing analysis as 2010, before any measure installations
occurred. We defined the post‐period as May 2012 through April 2013.2
1 We only performed billing analysis for insulation measures. The energy savings achieved through installing
other measures were not large enough, relative to total energy consumption of participating households, to
allow for reliable billing analysis results.

Wyoming HES 2011‐2012 Evaluation Appendix G2
Data Screening
Table G1 shows the participant and nonparticipant screening criteria we used in the billing analysis. To
ensure that the final model used complete pre‐ and post‐participation billing data, Cadmus selected
accounts with a minimum of 300 days in each of the pre‐ and post‐periods (i.e., before the earliest
installation, and after the latest reported installation in 2012). Additionally, Cadmus removed outlier
accounts with less than 1,500 kWh per year3 or more than 41,000 kWh per year. Moreover, we removed
accounts showing a change in consumption of more than 50% to ensure a better match between
participants and the control group. Finally, we examined the individual monthly billing data for
vacancies, outliers, and seasonal usage, and dropped accounts with inconsistent usage patterns
between the pre and post periods.
Table G1. Screen for Inclusion in Billing Analysis
Screen Attrition Remaining
Nonparticipant Participant Nonparticipant Participant
Original measures database and random
nonparticipant sample 13,127 570
Matched billing data sample (keeping only
nonparticipant residential accounts in
participant ZIP codes, and participant
accounts that could be matched to the
billing data addresses)
4,592 238 8,535 332
Less than 300 days in pre‐ or post‐period 42 28 8,493 304
Less than 1,500 kWh in pre‐ or post‐period 44 ‐ 8,449 304
More than 41,000 kWh in pre‐ or post‐
period 9 ‐ 8,440 304
Changed consumption by more than 50%
from pre‐ to post‐period 496 11 7,944 293
Expected savings over 70% of pre
consumption* ‐ 2 7,944 291
Billing data outliers, vacancies, and
seasonal usage 24 48 7,920 243
Nonparticipant sample selection 6,948 ‐ 972 243
Final Sample 972 243
* If the expected engineering estimates of savings exceeded 70% of pre‐consumption, either a mismatch occurred
between the participant measure installation data and the billing data account or address, or the participant had a
vacancy during the pre‐period. Cadmus removed these records from the billing analysis.
2 For participants who installed measures after May 2012, the post‐period only included months after the
measures were installed. Participants who installed measures in mid to late 2012 had less than 10 months of
post‐period data, so we removed them from the analysis. 3 The minimum participant usage was 3,030 kWh per year. This screen removed very low usage nonparticipants.
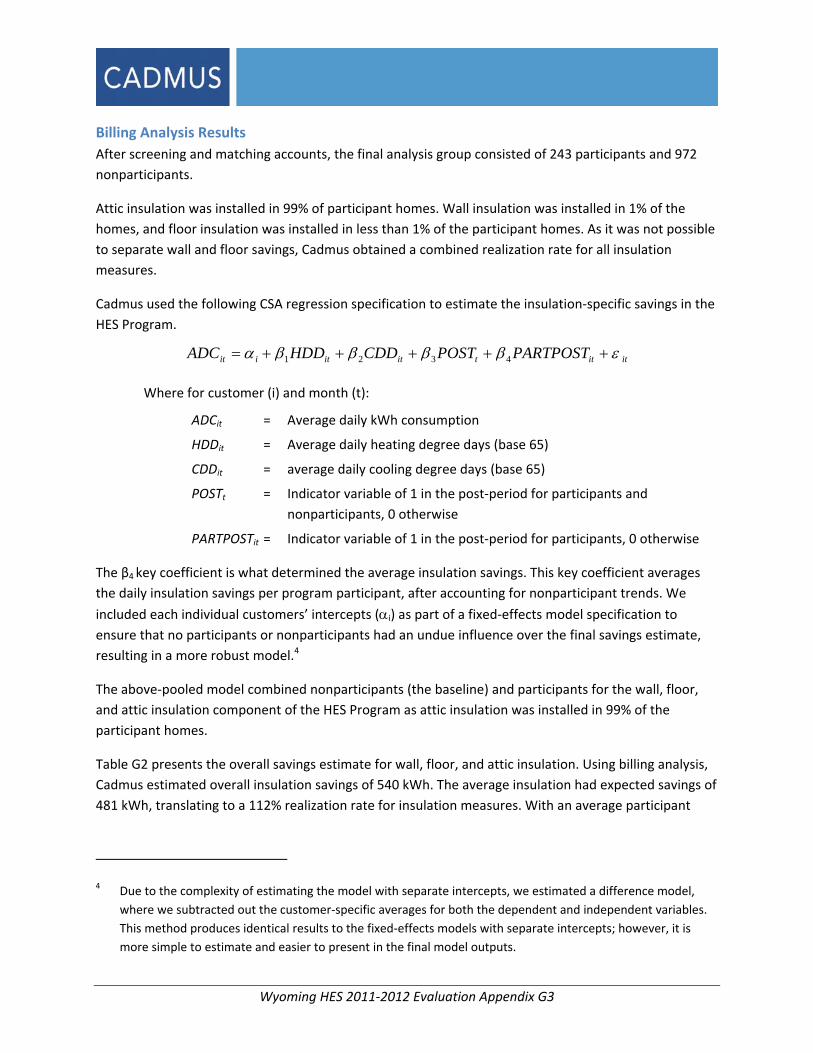
Wyoming HES 2011‐2012 Evaluation Appendix G3
Billing Analysis Results
After screening and matching accounts, the final analysis group consisted of 243 participants and 972
nonparticipants.
Attic insulation was installed in 99% of participant homes. Wall insulation was installed in 1% of the
homes, and floor insulation was installed in less than 1% of the participant homes. As it was not possible
to separate wall and floor savings, Cadmus obtained a combined realization rate for all insulation
measures.
Cadmus used the following CSA regression specification to estimate the insulation‐specific savings in the
HES Program.
itittititiit PARTPOSTPOSTCDDHDDADC 4321
Where for customer (i) and month (t):
ADCit = Average daily kWh consumption
HDDit = Average daily heating degree days (base 65)
CDDit = average daily cooling degree days (base 65)
POSTt = Indicator variable of 1 in the post‐period for participants and
nonparticipants, 0 otherwise
PARTPOSTit = Indicator variable of 1 in the post‐period for participants, 0 otherwise
The β4 key coefficient is what determined the average insulation savings. This key coefficient averages
the daily insulation savings per program participant, after accounting for nonparticipant trends. We
included each individual customers’ intercepts (i) as part of a fixed‐effects model specification to
ensure that no participants or nonparticipants had an undue influence over the final savings estimate,
resulting in a more robust model.4
The above‐pooled model combined nonparticipants (the baseline) and participants for the wall, floor,
and attic insulation component of the HES Program as attic insulation was installed in 99% of the
participant homes.
Table G2 presents the overall savings estimate for wall, floor, and attic insulation. Using billing analysis,
Cadmus estimated overall insulation savings of 540 kWh. The average insulation had expected savings of
481 kWh, translating to a 112% realization rate for insulation measures. With an average participant
4 Due to the complexity of estimating the model with separate intercepts, we estimated a difference model,
where we subtracted out the customer‐specific averages for both the dependent and independent variables.
This method produces identical results to the fixed‐effects models with separate intercepts; however, it is
more simple to estimate and easier to present in the final model outputs.

Wyoming HES 2011‐2012 Evaluation Appendix G4
pre‐usage of 12,470 kWh, these insulation savings represented a 4% reduction in energy usage from
insulation measures.
Table G2 also presents results by space heating fuel: electric and non‐electric. Overall electrically heated
homes achieved insulation savings of 2,295 kWh per home. The average electrically heated expected
insulation savings were 3,395 kWh, translating to a 68% realization rate. With an average electrically
heated participant pre‐usage of 20,431 kWh, savings represented an 11% reduction in energy usage
from insulation measures. Non‐electrically heated homes achieved insulation savings of 290 kWh per
home. The average insulation expected savings were 60 kWh, translating to a 481% realization rate.
With a non‐electrically heated participant pre‐usage of 11,306 kWh, savings represented a 3% reduction
in energy usage from insulation measures.
Cadmus used only the overall model results to determine the program level savings.
Table G2. HES Attic, Floor, and Wall Insulation Realization Rate
Group
Billing
Analysis
Participant
(n)
Reported
kWh Savings
per Premise
Evaluated Net
kWh Savings
per Premise
Net Realization Rate
(90% Confidence
bounds)
Model Savings (Overall) 243 481 540 112% (67%–158%)
Model Savings (Electric Heat) 31 3,359 2,295 68% (51%‐86%)
Model Savings (Non‐Electric Heat) 212 60 290 481% (110%‐853%)
Billing Analysis Regression Models Table G3‐G5 summarize the outputs for the regression models we used to determine the realization
rates.

Wyoming HES 2011‐2012 Evaluation Appendix G5
Table G3. Regression Model for Wyoming (Overall)
Source
Analysis of Variance
DF Sum of
Squares
Mean
Square F Value Pr > F
Model 4 822,034 205,508 1,349.68 <.0001
Error 28,975 4,411,866 152.26457
Corrected Total 28,979 5,233,900
Root MSE 12.33955 R‐Square 0.1571
Dependent Mean ‐1.85E‐16 Adj. R‐Square 0.1569
Coefficient of Variation ‐6.68E+18
Source
Parameter Estimates
DF Parameter
Estimates
Standard
Error t value Prob. t
Post 1 ‐1.77961 0.16383 ‐10.86 <.0001
PartPost 1 ‐1.47895 0.36385 ‐4.06 <.0001
AvgHdd 1 0.4476 0.00618 72.45 <.0001
AvgCdd 1 2.03149 0.03802 53.43 <.0001

Wyoming HES 2011‐2012 Evaluation Appendix G6
Table G4. Regression Model for Wyoming (Electric Heat)
Source
Analysis of Variance
DF Sum of
Squares
Mean
Square F Value Pr > F
Model 4 869,590 217,398 1,324.96 <.0001
Error 23,963 3,931,827 164.07909
Corrected Total 23,967 4,801,417
Root MSE 12.80934 R‐Square 0.1811
Dependent Mean ‐1.0836E‐16 Adj. R‐Square 0.181
Coefficient of Variation ‐1.18212E+19
Source
Parameter Estimates
DF Parameter
Estimates
Standard
Error t value Prob. t
Post 1 ‐1.68943 0.17033 ‐9.92 <.0001
PartPost 1 ‐6.28812 0.96387 ‐6.52 <.0001
AvgHdd 1 0.51417 0.00711 72.28 <.0001
AvgCdd 1 2.02926 0.04229 47.98 <.0001
Table G5. Regression Model for Wyoming (Non‐Electric Heat)
Source
Analysis of Variance
DF Sum of
Squares
Mean
Square F Value Pr > F
Model 4 738,112 184,528 1,293.06 <.0001
Error 28,246 4,030,889 142.70655
Corrected Total 28,250 4,769,001
Root MSE 11.94598 R‐Square 0.1548
Dependent Mean ‐1.8726E‐16 Adj. R‐Square 0.1547
Coefficient of Variation ‐6.37948E+18
Source
Parameter Estimates
DF Parameter
Estimates
Standard
Error t value Prob. t
Post 1 ‐1.81074 0.15866 ‐11.41 <.0001
PartPost 1 ‐0.79318 0.37223 ‐2.13 0.0331
AvgHdd 1 0.4274 0.00605 70.63 <.0001
AvgCdd 1 2.03703 0.03732 54.58 <.0001

Wyoming HES 2011‐2012 Evaluation Appendix H1
Appendix H. Non‐Lighting Engineering Reviews
This appendix contains the engineering reviews and evaluated unit energy savings (UES) for these
measure groups: appliances, home electronics, HVAC, and new homes.
Appliances Cadmus used participant phone survey data and secondary data to evaluate gross savings for appliance
measures. The resulting gross evaluated savings and realization rates are shown in Table H1.
Table H1. Engineering Review Summary Table, 2009‐2012, Appliances
Measure
Average Gross
2011‐2012
Reported Savings
(kWh/unit)
Average Gross
2011‐2012
Evaluated Savings
(kWh/unit)
2011‐2012
UES
Realization
Rate
Gross 2009‐2010
Evaluated Savings
(kWh/unit)
Clothes Washer 201 173 86% 303 / 437
Refrigerator 71 115 161% 54
Freezer 40 47 117% N/A
Dishwasher 37 22 61% 29
Ceiling Fan 122 30 25% 17
Light Fixture 80 59 74% 64
Water Heater 114 159 140% 110
Heat Pump Water Heater 2,120 1,483 70% N/A
Room AC 41 41 100% N/A
Portable Evaporative Cooler 110 305 277% N/A
Whole‐House Evaporative
Cooler 781 867 111% 1,372
Clothes Washers
Cadmus calculated clothes washer savings based on its 20091 study, in which more than 100 clothes
washers in California homes were metered for three weeks. This was the largest in situ metering study
on residential clothes washers and dryers conducted in the last decade, and the results revealed higher
consumption and savings values than those often estimated. (The majority of energy consumption and
savings resulted from dryers, as high‐efficiency washing machines removed more moisture from clothes,
resulting in shorter drying times.)
1 The Cadmus Group, Inc. Do the Savings Come Out in the Wash? A Large Scale Study of In‐Situ Residential
Laundry Systems. 2010. Available online: http://www.cadmusgroup.com/wp‐
content/uploads/2013/02/Home‐Energy‐Magazine‐January‐2012‐Mattison‐Korn‐article.pdf.

Wyoming HES 2011‐2012 Evaluation Appendix H2
Table H2 shows the key assumptions Cadmus used to evaluate savings values, the values shows are
based on phone surveys of programs participants and information recorded in the program tracking
database.
Table H2. Clothes Washer Key Inputs, 2011–2012
Input 2011‐2012 Evaluation
Value Source
Cycles per year 289 Participant Surveys
Percentage of Washer Loads Dried in a Dryer 82% Participant Surveys
Water Heater Fuel Electric 31.75% Participant Data
Gas 68.25% Participant Data
Dryer Fuel Electric 95.86% Participant Data
Gas 4.14% Participant Data
Table H3 shows the evaluated unit energy savings by tariff, tier, and system configuration.
Table H3. Clothes Washer Savings by Configuration, 2011–2012
Tariff/Tier Configuration Gross Unit Savings (kWh/year)
Pre‐Tariff Tier 1
Electric DHW & Electric Dryer 118.8
Electric DHW & Gas Dryer 15.0
Gas DHW & Electric Dryer 103.8
Pre‐Tariff Tier 2
Electric DHW & Electric Dryer 232.1
Electric DHW & Gas Dryer 60.7
Gas DHW & Electric Dryer 171.4
Post‐Tariff
Electric DHW & Electric Dryer 192.1
Electric DHW & Gas Dryer 65.1
Gas DHW & Electric Dryer 127.0
2011 ‐ Tier 1 Weighted Average Gross
Evaluated Savings 105.4
2011 ‐ Tier 2 Weighted Average Gross
Evaluated Savings 183.7
2012 ‐ All Washers Weighted Average
Gross Evaluated Savings 155.7
2011 & 2012 ‐ Weighted Average Gross
Evaluated Savings 172.8
The reduction in savings from the previous evaluation cycle is due to both an update in the analysis of
Cadmus’ clothes washer metering results and a reduction in the cycles per year reported by surveyed
participants.

Wyoming HES 2011‐2012 Evaluation Appendix H3
Refrigerators
To determine the 2011‐2012 refrigerator savings, Cadmus updated the methodology shown in the July
2011 analysis of the Northwest Power and Conservation Council’s Regional Technical Forum.2 Cadmus
removed the market baseline assumption embedded in the workbook and then updated the
assumptions for average refrigerator size and distribution of configurations, based on recent market
data from the Department of Energy.
Table H4 shows the evaluated unit energy savings for this program cycle, for evaluated savings for the
previous program cycle, and the difference between the two amounts. The change in energy savings is
due to three factors: the removal of the market baseline assumption, an increase in the assumed
average size of refrigerators, and the change in assumed refrigerator configurations being purchased.
Table H4. Refrigerator Gross Unit Savings, 2009–2012 (kWh/year)
2009‐2010 Evaluated Savings 2011‐2012 Evaluated Savings Difference
54.0 114.6 60.6
Freezers
In calculating ENERGY STAR® freezer savings, Cadmus used both the 2001 federal standard for the
baseline and the assumption that ENERGY STAR units are 10% more efficient than baseline units.3 Table
H5 shows the key assumptions used and the calculated savings. (The values have been rounded to the
nearest integer.)
Table H5. Key Freezer Assumptions
Product Class Market
Share
Freezer
Volume
(ft3)
2001
Federal
Standard
(kWh)
ENERGY
STAR
(kWh)
Savings
(kWh)
Upright Freezers with Manual Defrost 13.93% 29.14 444 400 44
Upright Freezers with Automatic Defrost 26.07% 29.14 639 575 64
Chest Freezers (Any Defrost) 60.00% 29.14 401 361 40
Overall 100% 29.14 469 422 47
The increase in savings—as compared to the tracked estimate of 40 kWh—are attributed to two factors:
the removal of the market baseline assumed in the RTF spreadsheet (EStarResFreezersFY09v1_0.xls)
used to develop the tracked savings estimate and the updated information regarding the market share
of the three classes of freezers.
2 Available online: http://www.nwcouncil.org/energy/rtf/measures/measure.asp?id=122. 3 ENERGY STAR Specifications: http://www.energystar.gov/index.cfm?c=refrig.pr_crit_refrigerators

Wyoming HES 2011‐2012 Evaluation Appendix H4
Dishwashers
To determine the 2011‐2012 dishwasher savings, Cadmus updated the methodology shown in the NPCC
RTF September 2010 analysis.4 Cadmus updated the baseline dishwasher information to have a 0.62
energy factor (EF) machine and updated the cycles‐per‐year based on participant survey responses.
Cadmus also modified the analysis to include a water heating consumption factor based on the ENERGY
STAR calculator for dishwashers.5
Table H6 shows the key assumptions Cadmus used for the evaluated savings values in this cycle, and
these are based on the both results of phone surveys with programs participants and the information
recorded in the program tracking database.
Table H6. Dishwasher Calculations, 2011–2012
Input 2011‐2012 Evaluation Value
Cycles per year 191
Standby Energy kWh/year 8.4
Percent of Energy Consumed for Water Heating 56%
Energy Factor Minimum Requirement for Participation 0.68/0.75 (Post 2011 Tariff)
To calculate the weighted evaluated energy savings for each program year and the program cycle,
Cadmus used the assumptions in Table H6 and information on the domestic water heating fuel from the
program participation database. Table H7 shows the results of this analysis.
Table H7. Dishwasher Gross Unit Savings, 2011–2012 (kWh/year)
Year 2011‐2012 Evaluated Savings (kWh)
2011 17.7
2012 32.2
Program Cycle 22.5
Ceiling Fans
In 2011 and 2012, Rocky Mountain Power offered ENERGY STAR ceiling fans through the HES Program.
The program administrator calculated the reported ceiling fan saving values as the sum of motor savings
(from the 2010 ENERGY STAR savings calculator) and lighting savings (from the Bonneville Power
Administration’s PTR).6 To calculate the savings for the assumed number of bulbs per ceiling fan, the
program administrator multiplied the PTR‐based CFL savings for the average room type by three.
4 Available online: http://rtf.nwcouncil.org/measures/measure.asp?id=119. 5 Available online:
http://www.energystar.gov/index.cfm?fuseaction=find_a_product.showProductGroup&pgw_code=DW. 6 Available online: http://www.ptr.nwcouncil.org

Wyoming HES 2011‐2012 Evaluation Appendix H5
To determine evaluated savings, Cadmus used the motor savings value listed in the 2013 ENERGY STAR
calculator and then calculated lighting savings via a methodology similar to that for CFL lamps. The
following equation reflects the ceiling fan savings methodology.
ΔkWh = MotorkWh + ((ΔWatts)/1,000) * (HOU * 365) * WHF * Number of Bulbs)
ΔWatts = Wbase ‐ Weff
Where:
MotorkWh = Motor savings per ceiling fixture (kWh)
1,000 = Constant (conversion from watts to kilowatts)
HOU = Hours‐of‐use per day
365 = Constant (days per year)
WHF = Waste heat factor for energy to account for HVAC interaction affects
(heating and cooling)
Number of Bulbs = Number of bulbs per fixture
Wbase = Wattage of baseline fixture
Weff = Wattage of efficient ENERGY STAR CFL
Table H8 lists the input assumptions.
Table H8. 2011‐2012 Ceiling Fan Input Assumptions
Ceiling Fan Input
Variable
2011
Input
2012
Input Source
MotorkWh 11.169 11.169 2013 ENERGY STAR Calculator*
HOU 2.21 2.21 Cadmus’ CFL HOU model
WHF 0.905 0.905 Based on Cadmus’ CFL lamp analysis (with the assumption that all fans
are indoor)
Number of Bulbs 0.36 2.00 Model data; this is the average number of bulbs based on 2011–2012
participant product data
Wbase 46.9 44.2 Comparable incandescent wattage, based on Cadmus’ CFL lamp
analysis
Weff 13.0 13.0 Weighted average ceiling fan lamp wattage based on Cadmus’ online
research and the ENERGY STAR Qualified Product List**
* The ENERGY STAR ceiling fan calculator is available online:
http://www.energystar.gov/ia/business/bulk_purchasing/bpsavings_calc/light_fixture_ceiling_fan_calculator.xlsx.
** Specifically, Cadmus used the ENERGY STAR Certified Ceiling Fans Product List, which is available online:
http://www.energystar.gov/productfinder/product/certified‐ceiling‐fans/results.
Cadmus derived the ceiling fan HOU from its room location assumptions. This differed from the CFL HOU
analysis for calculating overall daily HOUs, for which all room locations were included. The ceiling fan
rooms consisted of main living spaces, kitchens, and bedrooms.

Wyoming HES 2011‐2012 Evaluation Appendix H6
In 2011‐2012, the program had 8 participants and paid 187 ceiling fan incentives. In the documentation
for Rocky Mountain Power’s savings analysis, the assumption was that all ceiling fans included a three‐
bulb lighting fixture; however, the HES 2011–2012 participant data only specified models and brands,
not the number of bulbs.
Using the reported model numbers, Cadmus conducted web searches and referred to ENERGY STAR
product lists to verify the number of bulbs per fixture. As shown in Table H9 and Table H10, of the 18
ceiling fans sold in 2011 and 2012, there were 5 with lighting fixtures. Through research, Cadmus
determined that the fixtures averaged 0.71 bulbs over both program years.
Table H9. 2011 Ceiling Fan Lighting Kits
Ceiling Fan Unique Products Products Sold Lamps
No Light Kit 2 9 0
Light Kit 1 2 4
Model Not Sampled 2 2
Blank Model Number 0 0
Total 5 13
Table H10. 2012 Ceiling Fan Lighting Kits
Ceiling Fan Unique Products Products Sold Lamps
No Light Kit 0 0 0
Light Kit 1 3 6
Model Not Sampled 2 2
Blank Model Number 0 0
Total 3 5
Table H11 and Table H12 show the reported and evaluated ceiling fan per‐unit savings.
Table H11. 2011 Ceiling Fan Per‐Unit Savings
Ceiling Fan Measure Unit Reported Evaluated
Motor Per‐Unit Savings (kWh) 11.2
CFL Per‐Bulb Savings (kWh) 24.8
CFL Per‐Fan Savings (kWh) 9.0
Total Ceiling Fan Savings (kWh) 107.4 20.2
7 Cadmus obtained this number of units sold from the participant database.

Wyoming HES 2011‐2012 Evaluation Appendix H7
Table H12. 2012 Ceiling Fan Per‐Unit Savings
Ceiling Fan Measure Unit Reported Evaluated
Motor Per‐Unit Savings (kWh) 11.2
CFL Per‐Bulb Savings (kWh) 22.9
CFL Per‐Fan Savings (kWh) 45.7
Total Ceiling Fan Savings (kWh) 159.0 56.9
The largest per‐unit savings variance resulted from the assumed number of bulbs per fixture. For Rocky
Mountain Power’s HES Program, ENERGY STAR ceiling fans with or without light fixtures were eligible
equipment; however, for the savings analysis, the program administrator assumed the installation of
ceiling fans with light fixtures exclusively.
Table H13 and Table H14 show the 2011 and 2012 evaluated savings (which total 546 kWh) for the 18
incented ENERGY STAR ceiling fans.
Table H13. Evaluated and Reported Ceiling Fan Savings for 2011
Measure Unit Participants Number of
Units
Reported
Gross Savings
(kWh)
Evaluated
Gross Savings
(kWh)
Realization
Rate
Ceiling Fan 5 13 1,396 262 19%
Table H14. Evaluated and Reported Ceiling Fan Savings for 2012
Measure Unit Participants Number of
Units
Reported
Gross Savings
(kWh)
Evaluated
Gross Savings
(kWh)
Realization
Rate
Ceiling Fan 3 5 795 284 36%
Table H15 shows the average evaluated gross savings for this measure across the two program years.
Table H15. Average Evaluated Ceiling Fan Savings for 2011‐2012
Measure Unit Total Evaluated Gross
Savings (kWh) Number of Units
Average Evaluated
Gross Savings (kWh)
Ceiling Fan 284 18 30.4

Wyoming HES 2011‐2012 Evaluation Appendix H8
ENERGY STAR Light Fixtures
Rocky Mountain Power offered ENERGY STAR fixtures in the 2011‐2012 HES Program. For these fixtures,
the program administrator based the reported saving values on the PTR.
Cadmus based the evaluated lighting savings on a similar methodology to that used for the CFL lamp
analysis. Applying the ENERGY STAR fixtures calculation and input assumptions shown in Table H16,
Cadmus used the following equation to estimate the provided savings:
ΔkWh = (ΔWatts/1,000) * ISR * (HOU * 365) * WHF * Number of Bulbs
ΔWatts = Wbase ‐ Weff
Table H16. 2011‐2012 ENERGY STAR Fixture Input Assumptions
Light Fixture
Input Variable
2011
Input
2012
Input Source
ISR 1 1 Assumption that all fixtures were installed
HOU 2.18 2.18 Cadmus’ CFL HOU model
WHF 0.905 0.905 Based on Cadmus’ CFL lamp analysis
Number of Bulbs 2.15 1.06 Model data; this is the average number of bulbs based on 2011–2012
participant product data
Wbase 158.7 57.9 Comparable incandescent wattage based on Cadmus’ CFL lamp
analysis
Weff 33.6 13.6 Weighted average fixture lamp wattage based on Cadmus’ online
research and the ENERGY STAR Qualified Product List*
* Specifically, Cadmus used the ENERGY STAR Residential Light Fixtures Product List, which is available online:
http://www.energystar.gov/productfinder/product/certified‐light‐fixtures/results.
Cadmus based the ENERGY STAR‐fixture HOU on the results of its CFL HOU analysis, which included all
room locations. As described in the CFL analysis, Cadmus used an HOU model and data collected from
the HES residential surveys that detailed lighting information by room type.
In 2011‐2012, the HES Program had 64 participants and incented 343 ENERGY STAR fixtures. Rocky
Mountain Power’s 2011–2012 participant data specified the model and brand, but not the number of
bulbs per fixture.
As the HES participant data did not include wattages, Cadmus based the efficient CFL wattage (Weff) on a
sample of the rebated model numbers for which the lamp technology, average wattage, and number of
lamps per fixture were determined through online research. Based on these findings, four fixture types
were rebated as ENERGY STAR fixtures: CFLs, LEDs, circular fluorescents, and linear fluorescents. The
distribution of lamp technologies is shown in Table H17 and Table H18.

Wyoming HES 2011‐2012 Evaluation Appendix H9
Table H17. 2011 ENERGY STAR Fixture Distribution
Light Fixture Unique Products Products Sold Lamps
CFL 0 0 0
LED 0 0 0
Circular Fluorescent 2 2 2
Linear Fluorescent 6 11 26
Model Not Sampled 19 41
Blank Model Number 0 0
Total 27 54
Table H18. 2012 ENERGY STAR Fixture Distribution
Light Fixture Unique Products Products Sold Lamps
CFL 3 24 25
LED 4 229 229
Circular Fluorescent 1 1 1
Linear Fluorescent 5 16 32
Model Not Sampled 12 19
Blank Model Number 0 0
Total 25 289
To verify the number of bulbs per fixture, Cadmus relied on reported model numbers, web research, and ENERGY STAR product lists. This resulted in a 2011‐2012 average of 1.11 bulbs per fixture. Table H19 and Table H20 show the reported and evaluated per‐unit ENERGY STAR fixture savings.
Table H19. 2011 ENERGY STAR Fixture Per‐Unit Savings
ENERGY STAR Fixture Measure Unit Reported Evaluated
Number of Bulbs per Fixture 2.15
Per‐Bulb Savings (kWh) 90.0
Total Fixture Savings (kWh) 89.9 193.9
Table H20. 2012 ENERGY STAR Fixture Per‐Unit Savings
ENERGY STAR Fixture Measure Unit Reported Evaluated
Number of Bulbs per Fixture 1.06
Per‐Bulb Savings (kWh) 31.9
Total Fixture Savings (kWh) 78.1 33.9
The 2011 evaluated total savings reflect only circular and linear fluorescent fixtures, which have greater
savings per fixture than CFLs. Circular fluorescents saved 85 kWh per fixture, and linear fluorescents
saved 214 kWh per fixture. The different savings by technology type and distribution caused the 2011
evaluated savings per fixture to be more than double the reported savings.

Wyoming HES 2011‐2012 Evaluation Appendix H10
For 2012, the evaluated total savings was heavily weighted by the number of LEDs and CFLs. The savings
attributed to CFLs and LEDs in 2012 was 25 kWh per fixture. The differences between the evaluated
savings and reported savings per fixture are due primarily to the light fixture distribution differences by
program year and their associated savings per fixture. The number of lamps was also a factor in the
difference.
As shown in Table H21 and Table H22, the 2011 and 2012 HES Program’s evaluated savings for ENERGY
STAR fixtures is 20,273 kWh for 343 incented products.
Table H21. Evaluated and Reported ENERGY STAR Fixture Savings for 2011
Measure Unit Participants Number
of Units
Reported Gross
Savings (kWh)
Evaluated Gross
Savings (kWh) Realization Rate
ENERGY STAR
Fixtures 23 54 4,856 10,471 215.6%
Table H22. Evaluated and Reported ENERGY STAR Fixture Savings for 2012
Measure Unit Participants Number
of Units
Reported Gross
Savings (kWh)
Evaluated Gross
Savings (kWh) Realization Rate
ENERGY STAR
Fixtures 41 289 22,570 9,797 43.4%
Table H23 shows the average evaluated gross savings for this measure across the two program years.
Table H23. Average Evaluated ENERGY STAR Fixture Savings for 2011‐2012
Measure Unit Total Evaluated
Gross Savings (kWh) Number of Units
Average Evaluated
Gross Savings (kWh)
ENERGY STAR Fixtures 20,267 343 59.1
Water Heaters and Heat Pump Water Heaters
Cadmus used the Water Heater Analysis Model8 method to calculate savings for the different sizes of
standard storage tank water heaters. Using the federal standard9 for base‐case energy factor (EF),
Cadmus calculated the annual savings by tank size.
One of the 80 water heaters rebated through the program was a heat pump water heater (HPWH), and
this equipment is significantly more efficient than a standard tank water heater. Cadmus used an RTF
model that is a weighted average of HPWH locations given in the RTF model to estimate the energy
savings.
8 http://www1.eere.energy.gov/buildings/appliance_standards/residential/pdfs/d‐2.pdf. 9 http://www1.eere.energy.gov/buildings/appliance_standards/residential/pdfs/water_heater_fr.pdf.

Wyoming HES 2011‐2012 Evaluation Appendix H11
Table H24. 2011‐2012 Water Heat Types Rebated
Water Heater Type Number of Units Rebated Average Gross Evaluated Savings
(kWh/unit)
Standard Tank 79 159.4
HPWH 1 1,483.4
Overall 80
Table H24 shows the number of both types of water heater rebated and the evaluated savings.
Room Air Conditioners
Cadmus did not evaluate the savings for room air conditioners, due to this equipment type’s limited
contribution to program savings.
Portable Evaporative Coolers
Portable evaporative coolers are designed to replace traditional window air conditioner (AC) units, so
the savings are calculated by comparing the energy used by each of these types of cooling units.
Cadmus researched the implementer’s assumption that portable evaporative coolers consume only 25%
of the energy used by ENERGY STAR window AC units. This assumption is confirmed by ENERGY STAR
claims and by a comparison of savings calculated in the billing analysis completed for a Cool Cash
program operated by Rocky Mountain Power in Utah.
For the window AC unit used in the analysis, Cadmus updated the energy usage amount to 406 kWh.
This usage reflects a unit operating in Casper, Wyoming, as that is where 9 of the 25 units were sold.10
Savings were then calculated as 75% of 406 kWh, which resulted in 305 kWh of gross unit savings.
Table H25 lists the reported and evaluated savings for both portable evaporative coolers and whole‐
house evaporative coolers (described in the next section). The increase in savings for the portable units
is due a mathematical error in the calculation of the tracked savings estimate.
Whole‐House Evaporative Coolers
The savings for permanent evaporative coolers were calculated based on the billing analysis performed
for Utah’s Cool Cash program, as that analysis included this equipment type.11 Through the billing
analysis, it was estimated that: air conditioning consumed 1.3155 kWh per cooling degree day, while
evaporative cooling equipment consumed 0.2461 kWh per cooling degree day. Cadmus applied this
consumption value to 811 cooling degree days to calculate the savings value for Wyoming.12 The savings
of 867 kWh were calculated as follows:
10 ENERGY STAR Window AC unit energy usage of 406 kWh based on ENERGY STAR calculator, location of Casper, WY: http://www.energystar.gov/ia/business/bulk_purchasing/bpsavings_calc/CalculatorConsumerRoomAC.xls 11 2011‐2012 Cool Cash Program Impact Evaluation Report, October 25, 2013, Rocky Mountain Power. 12 Number of cooling degree days for Casper, WY based on TMY3 data.

Wyoming HES 2011‐2012 Evaluation Appendix H12
(1.3155kWh/CDD – 0.2461 kWh/CDD)*811 = 867 kWh.
Table H25 shows the reported and evaluated savings for this measure. Overall, there is reasonable
agreement between the average savings reported and the results of this evaluation.
Table H25. Evaluated Savings, 2011‐2012, Evaporative Coolers
Measure
Average Gross
Reported Savings
(kWh/unit)
Average Gross
Evaluated Savings
(kWh/unit)
Realization
Rate
Portable Evaporative Cooler 110.0 304.5 277%
Whole‐House Evaporative Cooler 781.3 867.3 111%
Home Electronics Table H26 shows the results of Cadmus’ evaluation of home electronics measures.
Table H26. Engineering Review Summary Table, 2009‐2012, Home Electronics
Measure
Average Gross
Reported Savings
(kWh/unit)
Average Gross
Evaluated Savings
(kWh/unit)
Realization
Rate
Gross 2009‐2010
Evaluated Savings
(kWh/unit)
Desktop Computer 77 77 100% N/A
Computer Monitor 14 14 100% N/A
Flat Screen TV 179 131 73% N/A
Desktop Computer
Cadmus did not evaluate the desktop computer measures, due to their limited contributions to program
savings.
Computer Monitor
Cadmus did not evaluate the computer monitor measures, due to their limited contributions to program
savings.
Flat Screen Television
Cadmus used the ENERGY STAR television (TV) efficiency criteria that were in effect during 2011 and
2012 to calculate measure consumption. Both ENERGY STAR model and conventional television model
operating‐mode consumption are calculated using screen sizes in three categories. The consumption of
each TV was then weighted according to the distribution of TV sizes found in the 2012 PSE RASS data.
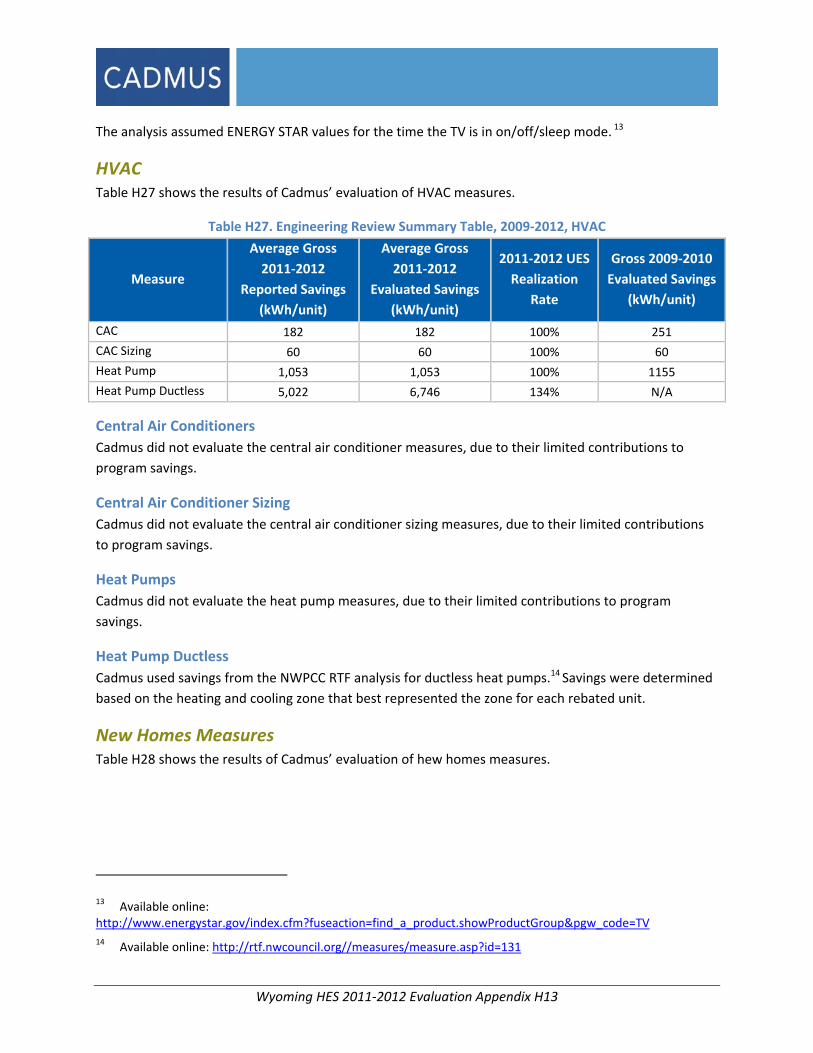
Wyoming HES 2011‐2012 Evaluation Appendix H13
The analysis assumed ENERGY STAR values for the time the TV is in on/off/sleep mode. 13
HVAC Table H27 shows the results of Cadmus’ evaluation of HVAC measures.
Table H27. Engineering Review Summary Table, 2009‐2012, HVAC
Measure
Average Gross
2011‐2012
Reported Savings
(kWh/unit)
Average Gross
2011‐2012
Evaluated Savings
(kWh/unit)
2011‐2012 UES
Realization
Rate
Gross 2009‐2010
Evaluated Savings
(kWh/unit)
CAC 182 182 100% 251
CAC Sizing 60 60 100% 60
Heat Pump 1,053 1,053 100% 1155
Heat Pump Ductless 5,022 6,746 134% N/A
Central Air Conditioners
Cadmus did not evaluate the central air conditioner measures, due to their limited contributions to
program savings.
Central Air Conditioner Sizing
Cadmus did not evaluate the central air conditioner sizing measures, due to their limited contributions
to program savings.
Heat Pumps
Cadmus did not evaluate the heat pump measures, due to their limited contributions to program
savings.
Heat Pump Ductless
Cadmus used savings from the NWPCC RTF analysis for ductless heat pumps.14 Savings were determined
based on the heating and cooling zone that best represented the zone for each rebated unit.
New Homes Measures Table H28 shows the results of Cadmus’ evaluation of hew homes measures.
13 Available online: http://www.energystar.gov/index.cfm?fuseaction=find_a_product.showProductGroup&pgw_code=TV
14 Available online: http://rtf.nwcouncil.org//measures/measure.asp?id=131

Wyoming HES 2011‐2012 Evaluation Appendix H14
Table H28. Engineering Review Summary Table, 2009‐2012, New Homes
Measure
Average Gross 2011‐
2012 Reported
Savings (kWh/unit)
Average Gross
2011‐2012
Evaluated Savings
(kWh/unit)
2011‐2012 UES
Realization
Rate
Gross 2009‐
2010 Evaluated
Savings
(kWh/unit)
NH Attic Insulation 0.2 0.2 112% N/A
NH Floor Insulation 0.6 0.7 112% N/A
NH Wall Insulation 0.3 0.4 112% N/A
New Homes Attic, Floor, and Wall Insulation
Cadmus completed a billing analysis to determine the 2011‐2012 HES insulation savings (Appendix G).
For these new‐home insulation measures, it was assumed that the billing analysis results indicate the
insulation energy savings achieved by the program, as compared to the savings estimated through the
simulation models. Therefore, Cadmus used the same realization rate (112%) as determined by the
larger HES billing analysis. See Appendix G for a detailed discussion of the analysis.

Wyoming HES 2011‐2012 Evaluation Appendix I1
Appendix I. Non‐Lighting Net‐to‐Gross Evaluation Methodology
Net‐to‐gross (NTG) estimates are a critical part of demand‐side management (DSM) program impact
evaluations, because they allow utilities to determine portions of gross energy savings that were
influenced by and are attributable to their DSM programs, free from other influences. Freeridership and
participant spillover are the two NTG components calculated in this evaluation. True freeriders are
customers who would have purchased a measure without any program influence. Participant spillover is
the amount of additional savings obtained by customers investing in additional energy‐efficient
measures or activities due to their program participation. Various methods can be used to estimate
program freeridership and spillover; for this evaluation, Cadmus used self‐reports from survey
participants.
Program Categorization Following the program’s review, Cadmus aggregated the HES Program measures into six distinct
categories:
1. Appliances
2. Home Electronics
3. HVAC
4. Lighting
5. New Homes
6. Weatherization
Creating these program categories required striking a balance between each measure’s unique
characteristics (which require NTG influences to be measured differently) and retaining a sufficiently
large participant population to obtain a statistically significant and reliable sample.
Cadmus could not use the methodology described below to evaluate NTG for lighting, weatherization or
new homes. As Rocky Mountain Power incents CFLs at the retailer level for the HES Program,
participants often do not know they participated in a program or purchased an incented CFL. Therefore,
calculating freeridership and spillover by surveying upstream measure participants did not prove viable.
Instead, Cadmus conducted a price response model analysis to evaluate the net effects of lighting
(Appendix F). The weatherization billing analysis results included freeridership and participant spillover
effects due to the methodology’s nature, and therefore, it would be inappropriate to also include net
effects from the survey responses. The results from the billing analysis were used to inform the
evaluated new homes savings, as all completed new homes projects were weatherization projects, and
again, net effects from the survey responses were not included. The billing analysis used for insulation
and window net savings is described in detail in Appendix G.

Wyoming HES 2011‐2012 Evaluation Appendix I2
Survey Design Direct questions (such as: “Would you have installed measure X without the program incentive?”) tend
to result in exaggerated “yes” responses. Participants tend to provide answers they believe surveyors
seek; so a question becomes the equivalent of asking: “Would you have done the right thing on your
own?” An effective solution, and an industry standard, for avoiding such bias involve asking a question in
several different ways, then checking for consistent responses.
Cadmus used industry tested survey questions to determine why customers installed a given measure,
and what influence the program had on their decisions. We used the survey to establish what decision
makers might have done in the program’s absence, via five core freeridership questions:
1. Would participants have installed measures without the program?
2. Had participants ordered or installed the measures before learning about the program?
3. Would participants have installed the measures at the same efficiency levels without the
program incentive?
4. Would participants have installed the same quantity of measures without the program?
5. In the program’s absence, when would respondents have installed the measures?
Cadmus sought to answer three primary questions with our participant spillover survey design:
1. Since participating in the program evaluated, did participants install additional energy‐efficient
equipment or services incented through a utility program?
2. How influential was the evaluated program on the participants’ decisions to install additional
energy‐efficient equipment in their homes?
3. Did customers receive incentives for additional measures installed?
Freeridership Survey Questions
The residential survey’s freeridership portion included 11 questions, addressing the five core
freeridership questions. The survey’s design included several skip patterns, allowing interviewers to
confirm answers previously provided by respondents by asking the same question in a different format.
The freeridership questions (as asked in the survey format) included:
1. When you first heard about the incentive from Rocky Mountain Power, had you already been
planning to purchase the measure?
2. Had you already purchased or installed the new measure before you learned about the
incentive from the Home Energy Savings Program?
3. [Ask if question 2 is No or Don’t Know] Would you have installed the same measure without the
incentive from the Home Energy Savings Program?
4. [Ask if question 3 is No or Don’t Know] Help me understand, would you have installed something
without the Home Energy Savings Program incentive?

Wyoming HES 2011‐2012 Evaluation Appendix I3
5. [Ask if question 3 or question 4 is Yes] Let me make sure I understand. When you say you would
have installed the measure, would you have installed the same one, that was just as energy
efficient?
6. [Ask if question 3 or question 4 is Yes AND measure quantity > 1] Would you have installed the
same quantity?
7. [Ask if question 3 or question 4 is Yes] Would you have installed the measure at the same time?
8. [Ask if question 3 or question 4 is No] To confirm, when you say you would not have installed the
same measure, do you mean you would not have installed the measure at all?
9. [Ask if question 8 is No or Don’t Know] Again, help me understand. Would you have installed the
same type of measure, but it would not have been as energy‐efficient?
10. [Ask if question 8 is No or Don’t Know AND measure quantity > 1] Would you have installed the
same measures, but fewer of them?
11. [Ask if question 8 is No or Don’t Know] Would you have installed the same measure at the same
time?
Participant Spillover Survey Questions
As noted, Cadmus used the results of the spillover questions to determine whether program participants
installed additional energy‐saving measures since participating in the program. Savings that participants
received from additional measures were spillover if the program significantly influenced their decisions
to purchase additional measures, and if they did not receive additional incentives for those measures.
With the surveys, we specifically asked residential participants whether they installed the following
measures:
Clothes washers
Refrigerators
Dishwashers
Windows
Fixtures
Heat pumps
Ceiling fans
Electric water heaters
CFLs
Insulation
If the participant installed one or more of these measures, we asked additional questions about what
year they purchased the measure, if they received an incentive for the measure, and how influential
(highly influential, somewhat influential, not at all influential) the HES Program was on their purchasing
decisions.

Wyoming HES 2011‐2012 Evaluation Appendix I4
Cadmus combined the freeridership and spillover questions in the same survey, asked over the
telephone with randomly selected program participants. Prior to beginning the survey effort, Cadmus
pre‐tested the survey to ensure that all appropriate prompts and skip patterns were correct. Cadmus
also monitored the survey company’s initial phone calls to verify that:
Survey respondents understood the questions; and
Adjustments were not required.
Freeridership Methodology Cadmus developed a transparent, straightforward matrix for assigning freeridership scores to
participants, based on their responses to targeted survey questions. We assigned a freeridership score
to each question response pattern, and calculated confidence and precision estimates based on the
distribution of these scores (a specific approach cited in the National Action Plan for Energy Efficiency’s
Handbook on DSM Evaluation, 2007 edition, page 5‐1).
Cadmus left the response patterns and scoring weights explicit so that they could be discussed and
changed. We used a rules based approach to assign scoring weights to each response from each
freeridership question. This allows for sensitivity analysis to be performed instantaneously and test the
stability of the response patterns and scoring weights. Scoring weights can be changed for a given
response option to a given question. This also provided other important features, including:
Derivation of a partial freeridership score, based on the likelihood of a respondent taking similar
actions in absence of the incentive.
Use of a rules‐based approach for consistency among multiple respondents.
Use of open‐ended questions to ensure quantitative scores matched respondents’ more
detailed explanations regarding program attribution.
The ability to change weightings in a “what if” exercise, testing the stability of the response
patterns and scoring weights.
This method offered a key advantage by including partial freeridership. Our experience has shown that
program participants do not fall neatly into freerider and non‐freerider categories. We assigned partial
freeridership scores to participants who had plans to install the measure before hearing about the
program, but for whom the program exerted some influence over their decisions. Further, by including
partial freeridership, we could use “don’t know” and “refused” responses rather than removing those
respondents entirely from the analysis.

Wyoming HES 2011‐2012 Evaluation Appendix I5
Cadmus assessed freeridership at three levels:
1. We converted each participant survey response into freeridership matrix terminology.
2. We gave each participant’s response combination a score from the matrix.
3. We aggregated all participants into an average freeridership score for the entire program
category.
Convert Responses to Matrix Terminology
Cadmus evaluated and converted each survey question’s response into one of the following values,
based on assessing participants’ freeridership levels for each question:
Yes (100% freerider)
No (0% freerider)
Partial (50% freerider)
Table I1 lists the 11 freeridership survey questions, their corresponding response options, and the values
they converted to (in parentheses). “Don’t know” and “refused” responses converted to “partial” for all
but the first three questions. For those questions, if a participant was unsure whether they had already
purchased or were planning to purchase the measure before learning about the incentive, we
considered them as an unlikely freerider.
Table I1. Assignments of HES Survey Response Options into Matrix Terminology*
Alread
y planning to
purchase?
Alread
y purchased or
installed?
Installed sam
e
measure without
incentive?
Installed something
without incentive?
Installed sam
e
efficiency?
Installed sam
e
quan
tity?
Installed at the sam
e
time?
Would not have
installed m
easure?
Installed lower
efficiency?
Installed lower
quan
tity?
Installed at the sam
e
time?
Yes
(Yes)
Yes
(Yes)
Yes
(Yes)
Yes
(Yes)
Yes
(Yes)
Yes
(Yes)
Same
time
(Yes)
Yes
(Yes)
Yes
(Yes)
Yes
(Yes)
Same
time
(Yes)
No (No) No (No) No (No) No (No) No (No) No (No)
Within
one
year (P)
No (No) No (No) No (No)
Within
one
year (P)
DK (No) DK (No) DK (No) DK (P) DK (P) DK (P)
Over
one
year
(No)
DK (P) DK (P) DK (P)
Over
one
year
(No)
RF (No) RF (No) RF (No) RF (P) RF (P) RF (P) DK (P) RF (P) RF (P) RF (P) DK (P)
RF (P) RF (P)
* In this table, (P) = partial, RF = refused, and DK = don’t know.
Wyoming HES 2011‐2012 Evaluation Appendix I6
Participant Freeridership Scoring
After converting survey responses into matrix terminology, Cadmus created a freeridership matrix,
assigning a freeridership score to each participant’s combined responses. We considered all
combinations of survey question responses when creating the matrix, and assigned each combination a
freeridership score of 0% to 100%. Using this matrix, we then scored every participant combination of
responses.
Program Category Freeridership Scoring
After assigning a freeridership score to every survey respondent, Cadmus calculated a savings‐weighted
average freerider score for the program category. We individually weighted each respondent’s freerider
scores by the estimated savings from the equipment they installed, using the following calculation:
∑ ∗ ∑
The Cadmus Freeridership Scoring Model
Cadmus developed an Excel‐based model to use for calculating freeridership, and to improve the
consistency and quality of our results. The model translated raw survey responses into matrix
terminology, then assigned a matrix score to each participant’s response pattern. Cadmus then
aggregated the program participants into program categories to calculate average freeridership scores.
The model incorporated the following inputs:
Raw survey responses from each participant, along with the program categories for their
incented measures, and their energy savings from those measures, if applicable;
Values converting raw survey responses into matrix terminologies for each program category;
and
Custom freeridership scoring matrices for each unique survey type.
The model displayed each participant’s combination of responses and corresponding freeridership
score, then produced a summary table with the average score and precision estimates for the program
category. The model used the sample size and a two‐tailed test target at the 90% confidence interval to
determine the average score’s precision.
Participant Spillover Methodology For the HES Program, Cadmus measured participant spillover by asking a sample of participants about
their purchases and whether they received an incentive for a particular measure (if they installed
another efficient measure or undertook another energy‐efficiency activity because of their program
participation). We also asked these respondents to rate the HES Program’s (and incentive’s) relative
influence (highly, somewhat, or not at all) on their decisions to pursue additional energy‐efficient
activities.

Wyoming HES 2011‐2012 Evaluation Appendix I7
Participant Spillover Analysis
Cadmus used a top‐down approach to calculate spillover savings. We began our analysis with a subset of
data containing only survey respondents who indicated they installed additional energy‐savings
measures after participating in the HES Program. From this subset, we removed participants who said
the program had little influence on their decisions to purchase additional measures, thus retaining only
participants who rating the program as highly influential. We also removed participants who applied for
an HES incentive for the additional measures they installed.
For the remaining participants with spillover savings, we estimated the energy savings from additional
measures installed. Cadmus calculated savings values, which we matched to the additional measures
installed by survey participants.
Cadmus calculated the spillover percentage by dividing the sum of additional spillover savings by the
total incentivized gross savings achieved by all respondents in the program category:
% ∑ ∑

Wyoming HES 2011‐2012 Evaluation Appendix J1
Appendix J. Non‐Lighting Freeridership Responses
Table J1 shows the unique freeridership response combinations for appliance participants, along with
the freeridership scores Cadmus assigned to each combination, and the numbers of responses for each
combination.
Table J1. Frequency of Freeridership Scoring Combinations—Appliance Measures
Alread
y planning to purchase?
Alread
y purchased or
installed?
Installed sam
e m
easure
without incentive?
Installed something without
incentive?
Installed sam
e efficiency?
Installed sam
e quan
tity?
Installed at the sam
e tim
e?
Would not have installed
measure?
Installed lower efficiency?
Installed lower quan
tity?
Installed at the sam
e tim
e?
Freeridership Score
Response Frequency
Yes Yes x x x x x x x x x 100% 37
No Yes x x x x x x x x x 100% 9
Yes No Yes x Yes Partial Yes x x x x 50% 92
Yes No Yes x Yes Partial Partial x x x x 25% 14
Yes No Yes x Yes Partial No x x x x 0% 1
Yes No Yes x Partial Yes Yes x x x x 25% 1
Yes No Yes x Partial Partial Yes x x x x 25% 3
Yes No No Yes Yes Partial Yes x x x x 50% 1
Yes No No Yes Partial Partial Partial x x x x 12.5% 1
Yes No No Yes No Partial Yes x x x x 0% 5
Yes No No No x x x x x x x 0% 2
Yes No No No x x x No x x x 0% 1
Yes No No No x x x Yes Yes Partial Yes 25% 1
Yes No No No x x x Yes No Partial Yes 0% 1
Yes No No No x x x Yes No Partial Partial 0% 1
No No Yes x Yes Partial Yes x x x x 25% 16
No No Yes x Yes Partial Partial x x x x 12.5% 9
No No Yes x Yes Partial No x x x x 0% 1
No No Yes x Partial Partial Yes x x x x 12.5% 1
No No Yes x Partial Partial Partial x x x x 0% 1
No No No Yes Yes Partial Yes x x x x 25% 2
No No No Yes Yes Partial Partial x x x x 12.5% 3
No No No Yes No Partial Yes x x x x 0% 1
No No No Yes No Partial Partial x x x x 0% 1
No No No No x x x x x x x 0% 1
No No No No x x x No x x x 0% 2

Wyoming HES 2011‐2012 Evaluation Appendix J2
Alread
y planning to purchase?
Alread
y purchased or
installed?
Installed sam
e m
easure
without incentive?
Installed something without
incentive?
Installed sam
e efficiency?
Installed sam
e quan
tity?
Installed at the sam
e tim
e?
Would not have installed
measure?
Installed lower efficiency?
Installed lower quan
tity?
Installed at the sam
e tim
e?
Freeridership Score
Response Frequency
No No No No x x x Yes No Partial Partial 0% 1
No No No No x x x Yes No Partial No 0% 1

Wyoming HES 2011‐2012 Evaluation Appendix J3
Table J2 shows the unique freeridership response combinations for home electronics participants,
along with the freeridership scores Cadmus assigned to each combination, and the numbers of
responses for each combination.
Table J2. Frequency of Freeridership Scoring Combinations—Home Electronics Measures
Alread
y planning to purchase?
Alread
y purchased or
installed?
Installed sam
e m
easure
without incentive?
Installed something without
incentive?
Installed sam
e efficiency?
Installed sam
e quan
tity?
Installed at the sam
e tim
e?
Would not have installed
measure?
Installed lower efficiency?
Installed lower quan
tity?
Installed at the sam
e tim
e?
Freeridership Score
Response Frequency
Yes Yes x x x x x x x x x 100% 9
No Yes x x x x x x x x x 100% 4
Yes No Yes x Yes Partial Yes x x x x 50% 19
Yes No Yes x Yes Partial Partial x x x x 25% 7
Yes No Yes x Yes Partial No x x x x 0% 2
Yes No Yes x Partial Partial Yes x x x x 25% 1
Yes No Yes x Partial Partial Partial x x x x 12.5% 1
Yes No No Yes Yes Partial Yes x x x x 50% 1
Yes No No Yes Yes Partial No x x x x 0% 1
Yes No No Yes Partial Partial Yes x x x x 25% 2
Yes No No Yes No Partial Yes x x x x 0% 1
Yes No No No x x x x x x x 0% 1
Yes No No No x x x No x x x 0% 1
Yes No No No x x x Yes Yes Partial Yes 25% 1
No No Yes x Yes Partial Yes x x x x 25% 5
No No Yes x Yes Partial Partial x x x x 12.5% 2
No No Yes x Yes Partial No x x x x 0% 1
No No Yes x No Partial No x x x x 0% 1
No No No Yes Yes Partial Yes x x x x 25% 1
No No No Yes Partial Partial Yes x x x x 12.5% 1
No No No Yes No Partial Partial x x x x 0% 1
No No No No x x x x x x x 0% 1
No No No No x x x Partial Yes Partial No 0% 1

Wyoming HES 2011‐2012 Evaluation Appendix K1
Appendix K. Logic Model
Table K1 below shows the program theory and indicators of the HES logic model. The link column of the
table correlates to numbers in the logic model shown after the table.
Figure K1. Linkage Tables
Link Program Theory Indicators
1‐5
The HES Program design leads to Rocky
Mountain Power training third‐party
contractors and implementation staff,
marketing and outreach activities, and
contracts with manufacturers
Program design
Number of training sessions
Number of contractors attending sessions
Marketing plan established
Number of outreach events scheduled
6
Trained third‐party contractors facilitate
customer participation through a
comprehensive understanding of the program
requirements
Installation paperwork completion
Number of trained third‐party contractors
7 Contracts executed with lighting
manufacturers
Number of manufacturers contracted
Number of bulbs incented
8
Outreach to retailers and dealers results in
stock to support the sales of high‐efficiency
lighting and products
Number and distribution of retailers carrying
discounted bulbs and high‐efficiency products
Number of efficient products stocked
9 Marketing and outreach promotes incentives
for HES measures
Number of marketing campaigns/pieces produced
Number of outreach event participants
Target markets identified
Number of marketing collateral pieces developed
Response rate to targeted marketing
10 Program website updated
Current incentives and information updated on
website
Hit rates for unique visitors
11 Trained implementation staff process program
applications
Number of applications received
Number of applications reviewed and processed
12 Program administrator invoices Rocky
Mountain Power for incentive payment
Number or invoices
Amount of invoices
13 Manufacturers provide CFL and LED bulbs to
retailers at a discount
Number of discounted bulbs
Amount of discount
14 Website serves as portal for program
applications Number of program forms downloaded
15‐16 Applications verified by quality control process
Number of inspections completed
Inspection accuracy rate Amount of energy savings represented by
applications

Wyoming HES 2011‐2012 Evaluation Appendix K2
Link Program Theory Indicators
17 The processing of applications enrolls
participants in the program
Number of applications approved
Number of participants enrolled in the program
18 Trained contractors promote the program to
customers
Number of marketing collateral pieces developed for
contractors
Number of contractor enrollment referrals
19 Retailers with efficient product stock promote
HES measures
Number of discounted CFLs and LEDs sold by retailer
Number of high‐efficiency products sold
20 Marketing and point‐of‐purchase materials
increase retailer promotions of HES measures
Number of marketing materials produced
Number of retailers promoting HES measures
21 Marketing efforts result in increased program
awareness
Number of participants who report remembering
program ads and marketing efforts
Number of nonparticipants who report knowledge of
the program
22 Website information and promotion of
website increases program awareness
Number of program aware consumers that credit
website as source of awareness
23 Enrolled participants receive incentives for
participating in the program
Number of incentives paid
Number of days to process incentive payment
Dollar value of incentives paid
23 Increased program awareness leads to
increased program participation
Number of participants
Number of survey respondents indicating they are
aware of the program
24 Increased program awareness leads to
increased energy conservation awareness
Number of survey respondents indicating they are
aware of the program and energy conservation
25 Retailer promotions generate program
awareness
Number of program‐aware survey respondents
indicating they learned about the program through a
retailer
26 Contractor promotions generate program
awareness
Number of program‐aware survey respondents
indicating they learned about the program through a
contractor
27 Increased energy conservation awareness
leads to increased program participation
Number of participants
Number of survey respondents indicating they are
aware of the program and energy conservation
28 HES measure purchases are installed in homes Number of purchases not installed (CFL or LED bulbs
in storage)
29 Increased program awareness leads to
purchase of HES measures
Number of program aware survey respondents that
purchased HES measures
30 Increased program awareness leads to more
sales of high‐efficiency lighting and products
Sales volume of CFLs, LEDs, and high‐efficiency
products compared to benchmark
31 Installed measures generate demand savings Percentage of reduction target (kW) met
32 Participants recognize energy‐savings benefits
and create positive word‐of‐mouth for the
Number of participants that recognize energy savings
Number of participants that have told others about

Wyoming HES 2011‐2012 Evaluation Appendix K3
Link Program Theory Indicators
program program
33, 37
Higher sales volume of high‐efficiency lighting
and products results in manufacturers
producing fewer less‐efficient products
Production decline of less‐efficient products
34, 42 Energy‐savings goals attributed to program
represent long‐term demand savings
Percentage of reduction targets (kW) met in
successive years
35 Increased energy conservation awareness
leads to increased demand for HES measures
Number of survey respondents that added additional
HES measures to their homes
36 Participants’ positive promotion of the
program increases demand for HES measures
Number of participants that heard about the
program through word‐of‐mouth
38,
40, 41
Higher CFL, LED, and high‐efficiency product
sales volume and increased demand for
efficient products make existing homes more
efficient
Decreased energy usage by participants as shown by billing analysis results
39 Long‐term demand savings reduces the need
for larger fuel contracts and new power plants
Investments in fuel contracts and power plants
reduced or delayed

Inputs: Funds, Experienced Staff, Allies, Market Knowledge, Synergistic Program Management
Rocky Mountain Power Home Energy Savings (HES) Program Logic Model
Sh
ort
-Te
rm a
nd
Imm
ed
iate
Ou
tco
me
s
Ou
tpu
tsA
cti
vit
ies
Lo
ng
-Te
rm O
utc
om
es
Program Implementer
Trains Internal Staff
Recruit and Train
Contractors
Retailers Promote High-Efficiency Lighting and Products
Long-Term
Demand Savings
Increased
Conservation
Awareness
Consumer Demand for HES
Measures Increases
Participants Recognize
Benefits and Create Positive
Word-of-Mouth
Conduct Outreach to
Dealers and Retailers
More CFLs, LEDs, and High-
Efficiency Products Sold
Direct Energy Demand Savings
Contractors Trained
on Program
Requirements
Contactors Promote HES
Measures to Customers
13 14
40
Execute Contracts with Lighting
Manufacturers
36
Conduct Marketing and
Education to Consumers
7 8 9
Manufacturers
Provide CFLs and
LEDs to Retailers at
Discount
Dealers/ Retailers Stock
High-Efficiency Lighting
and Products
Program
Implementer
Advertises and
Markets
Materials
10
Program
Implementer
Updates
Website
11 12
Program
Implementer
Processes
Applications
Utility
Pays
Incentives
17
Program
Participants
are Enrolled
24
Contractors Retrofit Homes with HES
Measures
Increased Program Awareness
37Manufacturers Produce
Fewer Non-Efficient Products
Reduced Need for Fuel and
Capital Investments
Existing Homes More Efficient41
32
35
39
42
38
33 34
3029
31
18
26 27
25
2321 2219
6
1 2 3 4
Program Design
5
20
Program
Implementer
Conducts
Quality
Control
15 16
Consumers Purchase
HES Measures
28
Wyoming HES 2011‐2012 Evaluation Appendix L1
Appendix L. Marketing Materials Review
Cadmus reviewed program marketing plans and materials for HES overall and specifically for the State of
Wyoming, resulting in the high‐level findings documented below.
Corporate Brand and Graphic Guidelines Prior to conducting the full marketing materials review, Cadmus carefully reviewed the brand guidelines
provided by Rocky Mountain Power, which included PacifiCorp’s 2010 Corporate Brand Guidelines
(including the wattsmart campaign) and the 2011 PacifiCorp Graphic Standards Guidelines. By reviewing
these brand guidelines, Cadmus was able to gain a clear understanding of PacifiCorp’s visual identity as
presented by its Customer and Community Communications department. The 2011 PacifiCorp Graphic
Standards Guidelines addresses the corporate logo usage and brand‐appropriate fonts and colors, while
the 2010 Corporate Brand Guidelines more specifically outlines creative elements and collateral‐specific
treatments pertaining to customer awareness and the wattsmart campaigns.
HES Program Marketing Strategy and Planning The program administrator develops an annual marketing plan for each program year. This plan includes
marketing strategies, segments and key messaging, and measurement and reporting. Further, the
program administrator develops an extremely detailed comprehensive outline of the tactics developed
and implemented for each quarter within each state. The program administrator lists the tactics in a
user‐friendly spreadsheet format, and displays them in careful detail to convey each of the channels,
tactics, messaging, and purpose. Each of the tactics is laid out on a monthly and weekly schedule so the
administrator and Rocky Mountain Power’s marketing team can see each tactic from strategy, to
planning, development, execution and metrics, and close‐out. These quarterly tactical plans are easy‐to‐
use and provide detailed insight into the marketing planning and implementation process.
As part of these planning efforts, the HES program administrator continued to leverage the target
audiences, messages, and values identified in their 2010 segmentation study. Due to the unique
geographic nature of Rocky Mountain Power’s Wyoming service territory, the program administrator
focused messaging in this state on energy independence in addition to cost savings.
HES Program Marketing Materials Cadmus reviewed the Rocky Mountain Power energy efficiency and HES Program materials, all of which
align with the brand guidelines and present a consistent look and feel. In addition to standard program
marketing (bill inserts, direct mail, etc.), the seasonal cooling campaign creative for Wyoming features
unique and engaging imagery that speaks directly to the customers in these territories, connecting the
customers to the program offerings.
Upon review, Cadmus found that Rocky Mountain Power had implemented many of the
recommendations and best practices we proposed in the 2009‐2010 program evaluation. These
recommendations included website enhancements and increased access to program information, as

Wyoming HES 2011‐2012 Evaluation Appendix L2
well as increased marketing and campaign metrics tracking. In addition, we found that Rocky Mountain
Power had continued its use of marketing best practices, and continued to provide ongoing trade ally
support and outreach.
HES Website and Online Engagement For this evaluation, Cadmus reviewed the HES Program website.1 Table L1 compares elements in the
current HES marketing plan to best practice elements in energy‐efficiency program marketing as a point
of comparison to the 2009 and 2010 evaluation. The findings indicate that the program website largely
uses common online energy‐efficiency program marketing best practices.
Table L1. HES Program Use of Website Best Practices
Website Best Practice Element 2009‐2010 Website 2011‐2012 Website
Program is highlighted on homepage with many
access points Yes Yes
Number of clicks from Rocky Mountain Power
homepage 2 or 3
2 to HES page; 3 to state‐
specific page
Description leads with participant benefits wattsmart programs and
incentives or to save energy
wattsmart incentives for
Wyoming
Message consistency from Rocky Mountain
Power homepage to subpage Yes Yes
Clear call‐to‐action Strong and active Yes
Contact capture No No; not within HES page
Description of each individual program offered Yes Yes
Participant eligibility requirements Yes Yes
Contractor participation and eligibility
requirements Available via phone inquiry Accessible via call or e‐mail
Contractor listing Yes Yes
Contractor search engine No No
Online contractor application process No Accessible via call or e‐mail
Downloadable incentive forms Yes Yes
Online incentive application process No Yes
Self‐help area, including tips and videos N/A* Yes
HES social media elements included (i.e.,
Facebook) No Yes
Customer feedback mechanism N/A* Yes; poll for how customers
heard about program
Bilingual materials (if applicable) N/A* N/A
Customer testimonials N/A* No
* Cadmus did not assess this best practice during the 2009‐2010 evaluation.
1 http://www.rockymountainpower.net/hes

Wyoming HES 2011‐2012 Evaluation Appendix L3
Cadmus determined that Rocky Mountain Power is exhibiting best website practices in the following
areas:
The website features a state‐specific selection function that allows customers to easily navigate
to programs and incentive applications within their territory.
Many of the applications are now available for online submission, and there is a submission
tracking mechanism.
Tips, videos, and tools are readily available from the residential ‘Save Energy – wattsmart
Incentives’ webpage to promote customer education.
Each product page within the state‐specific section features a clear and strong call‐to‐action and
provides customers with an application (available in both English and Spanish), program
information, and eligibility requirements.
Social Media Support PacifiCorp’s Customer and Community Communications department conducts all social media efforts,
including developing social media strategy and implementing tactics. When requested, the HES program
administrator provides content to this department to support campaign deliverables and other efforts
specific to the Wyoming HES Program.
Cadmus reviewed Rocky Mountain Power’s social media outlets and the support of its energy‐efficiency
programs. As of June 2013, Rocky Mountain Power’s wattsmart Program Facebook page had 876 ‘likes,’
and featured photos, informational videos, and customer polls, as well as educational energy‐efficiency
tips and links to programs and incentives.
Table L2 compares Rocky Mountain Power’s current social media strategy to industry standard best
practices for social media currently used by utilities and energy‐efficiency programs nationwide.

Wyoming HES 2011‐2012 Evaluation Appendix L4
Table L2. HES Program Use of Social Media Best Practices*
Social Media Best Practice Element HES* Notes
Program marketing includes established outreach/content calendar in support of overall social media goals and strategy.
P
Program administrator provides program content and updates to PacifiCorp for inclusion in social media channels.
Engages in mutually‐beneficial partnerships with program affiliates such as trade allies, retailers and manufacturers’ social media channels.
N This does not appear to happen at the program level at this point in time.
Daily, weekly, monthly, quarterly and/or yearly tracking of social media analytics and monitoring to allow for optimization and improvement of strategy based on target audience. Use of information gathered to find the right balance of frequency of content to build customer relationships, but not oversaturate the channel.
P
Program administrator provided Facebook posting insights and metrics following event and campaign‐specific social media outreach.
Social media channels encourage and promote customer feedback, participation and engagement.
Y Posts and comments were positive and invited customer engagement.
Timely and respectful respond to user comments, messages and posts. Y
Posts and comments appear to be addressed in an appropriate and timely manner.
Integration of photos and videos to promote customer engagement and education.
Y Use of photos, videos and integration with YouTube channel.
Sharing of customer testimonials and experiences regarding program participation and feedback. Y
Encouraged customer feedback and sharing of customer testimonials and connection through contests, etc.
Leverages fan base building sharing tactics such as promotions, contests, rewards programs and deal tips. This includes incentivizing fans to share promotions through social channels.
P Contests appear to be run through PacifiCorp or Rocky Mountain Power; not specific to HES program.
Use of Facebook user/customer engagement functions such as polling, sharing, highlighting/pinning posts, and “liking.” P
Program administrator provides program posts/content to PacifiCorp for inclusion.
Inclusion of announcements or event pages to promote upcoming events, local retail promotions, etc.
Y HES program utilizes social media for promotion of events, etc.
Social media icons are featured on all program marketing materials and web pages.
P Included on some pages and program materials
Require ‘Like Gating’ or ‘Follow Gating’ when using online apps.This is an effective strategy for building successful Facebook and Twitter fan building promotions.
N Not currently utilized at the program level but may present a strong opportunity for building fan base.
* Social media practices are constantly evolving; these best practices represent the 2013 program marketing year
and are subject to change as the channels evolve.
** Table key: best practice in use (Y), best practice not in use (N), best practice partially in use (P).
wattsmart Brand Association and Differentiation The program administrator coordinates with Rocky Mountain Power to ensure that program marketing
appropriately leverages the wattsmart general awareness campaign and brand. This allows them to
avoid overlaps in messaging and outreach and avoid customer confusion.

Wyoming HES 2011‐2012 Evaluation Appendix L5
According to Rocky Mountain Power, the wattsmart campaign made more extensive use of paid media
to drive broad‐based energy‐efficiency awareness, while the HES Program uses more traditional
outreach methods and channels for targeted outreach and program promotion. Additionally, by
associating the HES Program marketing with wattsmart’s messaging and branding, the HES Program
gains the opportunity to cross‐market between and with other programs to increase overall customer
awareness.
Nearly half of lighting (40%) and non‐lighting (45%) participants indicated that they were familiar with
the term wattsmart. Of those participants, the majority learned of the term through bill inserts (33% of
lighting and 21% of non‐lighting) and TV advertisements (22% lighting and 23% non‐lighting).

Wyoming HES 2011‐2012 Evaluation Appendix M1
Appendix M. Incentive Reward Application Benchmarking and Best Practices
Rocky Mountain Power and program administrator staff reported that the largest barrier to non‐lighting
program delivery is the instances of rejected customer incentive applications. Customer‐submitted
incentive applications with missing or incorrect information delay the incentive processing, requires
follow‐up with the customer, and increases program costs.
This appendix outlines the detailed findings from Cadmus’ benchmarking and best practices literature
review conducted to inform Rocky Mountain Power how to reduce the number of flawed HES Program
applications submitted to the program. Overall, the HES incentive applications utilize some of the
common form design and submission best practices; however, there may be room for improvement in
certain areas.
Approach Cadmus analyzed data provided by the program administrator indicating reasons incentive applications
were rejected during the 2011 and 2012 program years. In addition, Cadmus conducted a benchmarking
review of utility‐sponsored residential, prescriptive incentive programs’ application forms from across
the country to compare to, and identify best practices for, the Rocky Mountain Power HES applications.
Cadmus reviewed Rocky Mountain Power’s residential appliance, HVAC, insulation, and window
incentive applications. We compared the design and content of forms from similar programs and
reviewed literature regarding best practices for form design and submission.
Findings
Form Attribute Comparisons
Cadmus compared incentive forms across a variety of criteria. Table M1 shows the forms and attributes
selected for comparison.

Wyoming HES 2011‐2012 Evaluation Appendix M2
Table M1. Incentive Form Attributes Selected for Comparison
Utility Measure(s) #
Pages
# of Input
Fields
(min‐max)
# of Required
Supporting
Documents
(max)
Fillable
PDF?
Online
Option?
Avista Corp. (Idaho) Appliances 4 17‐46 1 + 1 per measure Yes No
Efficiency Vermont Appliances
(Refrigerator) 2 23 1 per measure Yes Yes
Flathead Electric
Coop. (Montana)
Appliances 1 12 1 per measure No No
Insulation 2 18 1 No No
Idaho Power Appliances 1 14‐20 1 per measure Yes Yes
Montana‐Dakota
Utilities
Lighting 2 11‐19 1 Yes No
HVAC 2 21‐32 1 Yes No
NorthWestern
Energy (Montana) Lighting 4 14 1 per bulb No No
Rocky Mountain
Power (Wyoming)
Appliances 4 19‐55 1 per measure Yes Yes
HVAC (Air Conditioner) 6 25‐33 4 No No
Insulation 5 21‐30 3 No No
Windows 5 23‐27 4 No No
Vectren Ohio HVAC 2 18‐48 1 per measure No No
Factors Impacting Incentive Form Rejections
According to data provided by the program administrator, HES incentive applications were rejected
because of either missing information or ineligibility.
Missing Information
According to data provided by the program administrator, the most common reason for HES Program
form rejection was missing information. Figure M1 shows that the majority of 2011‐2012 HES incentive
applications in each measure category were rejected because of missing information.

Wyoming HES 2011‐2012 Evaluation Appendix M3
Figure M1. Percent of HES Applications Rejected by Reason in Wyoming
Using application rejection data provided by the program administrator, Figure M2 shows the
distribution of reasons incentive applications were rejected due to missing information. The most
common reasons applications were rejected due to missing information include (1) missing customer
information or home details, (2) missing or insufficient supporting documentation, and (3) missing
specifications.

Wyoming HES 2011‐2012 Evaluation Appendix M4
Figure M2. Top Reasons for Application Rejection Due to Missing Information in Wyoming*
* Totals may not sum to 100% due to rounding.
Missing Customer Information
According to data provided by the program administrator, the primary reason incentive applications
were rejected in 2011‐2012 was due to missing customer information or home details. These fields
include customer contact information and household data, such as heating/cooling sources and
demographics (i.e., income, gender, household size).
Best Practice 1: Keep the Incentive Form Length to a Minimum.
The HES program administrator reported the common occurrence of applications being rejected based
on missing information may be due to the incentive forms’ length. The program administrator explained
a four page application may be too much for customers or contractors to fill out. Often, applications are
rejected because a customer forgets to fill out one or two data fields on the form.
Trade allies agreed with the program administrator. Although nearly all non‐lighting participants (96%)
were satisfied with the application process, one trade ally suggested having program staff assist
customers in filling out the applications in order to improve the likelihood that customers will submit
complete and accurate applications.
All but two of the compared programs collect a sufficient amount of data to determine program
eligibility and achieved savings using an incentive application that is one to two pages. Cadmus’
marketing experts note that best practices for incentive form layout indicate collection of customer

Wyoming HES 2011‐2012 Evaluation Appendix M5
information on the front of the form and terms and conditions on the back. Rocky Mountain Power’s
incentive applications are four or five pages but they do have the terms and conditions on the last page.
Best Practice 2: Distinctly Separate Important Instructions or Requirements from Terms and
Conditions and Other Complicated Language
The instructions on Rocky Mountain Power’s incentive applications are presented using clear language,
in boxes separate from the input fields and terms and conditions which help draw the participant’s
attention to them. However, the measure qualifications are more difficult to differentiate because they
are in the same font size or smaller than the fonts on the rest of the application (though they are often
bolded). In addition, the eligibility requirements are located within the terms and conditions, and are
not presented in concise language anywhere else on the form.
To ensure customers focus on the data fields required for application submission, any important
instructions or requirements should be distinctly separate from any complicated terms and language.
Application instructions and eligibility requirements should be presented in a clear, concise, user‐
friendly format. The best way to avoid a high rate of rejected applications is to establish a simple
submission method (Parago 2012). Ways to achieve this include highlighting instructions; adding a brief
submittal checklist at the top of the form, which breaks instructions into clear steps (such as with a
number format: 1, 2, 3); and highlighting the mailing address and submission instructions. This will put
all the submission information in one centralized location.
Two of the incentive application forms we compared provide good examples of separating requirements
from complicated language (i.e., terms and conditions). Efficiency Vermont’s refrigerator incentive form,
included below as Figure M3 uses white space to differentiate between requirements and other
sections, and the requirement language is very simple. The terms and conditions are concise, contained
in one small box, and are reiterated in simpler language in other sections of the form.
Vectren Ohio’s 2012 gas heating appliance incentive form, shown in Figure M4, is a good example of a
simplified way to collect technical information from customers. It is only two pages, uses simple
language, and has all the information the customer must enter in one area. The terms and conditions
are a small section at the end of the form, and the requirements are in clear language at the top of the
form.

Wyoming HES 2011‐2012 Evaluation Appendix M6
Figure M3. Efficiency Vermont Appliance Incentive Form

Wyoming HES 2011‐2012 Evaluation Appendix M7
Figure M4. Vectren Ohio HVAC Incentive Form

Wyoming HES 2011‐2012 Evaluation Appendix M8
Informative graphics and pictures that show the customer where to find required data can draw the
customer’s attention to specific required data fields that may otherwise be difficult to find. This is also a
useful way to separate the application instructions and eligibility requirements from the technical
sections of the form. Rocky Mountain Power added an example of this to their 2012 incentive
applications. The forms use a graphic illustrating a Rocky Mountain Power utility bill to indicate to
customers where to locate their account number and confirm their eligibility by identifying whether
their service is on qualifying rate schedule (Figure M5).
Figure M5. Informative Graphic from 2012 HES Incentive Application
Missing or Insufficient Supporting Documentation
Another common reason HES applications were rejected is because of missing or insufficient supporting
documentation, such as an invoice or proof of payment. While the HES Program’s appliance incentive
application requires only one supporting document, other product applications require up to five
attachments to qualify the equipment and show proof of trade ally payment or installation.
Best Practice 3: Keep Participation Procedures Simple
Documentation requirements should be reasonable and forms understandable (Pacific Gas and Electric
Company 2013). While Rocky Mountain Power’s appliance incentive only requires one attachment—a
clear positive for that form—the incentive forms for other HES Program measures may require up to
four attachments in order to qualify the equipment and show proof of trade ally payment or installation.
This can be burdensome for the customer to track, and has a high probability of not being submitted
completely.
Table M2 compares the number of supporting documents required for each HES product application and
the associated rejection rate based on missing or insufficient supporting documentation. The rejection
rate for appliance applications, which require only an itemized receipt to show proof of payment, is

Wyoming HES 2011‐2012 Evaluation Appendix M9
much lower than the rejection rates of the other products that require up to four supporting
documents.
Table M2. Rejection Rate due to Missing or Insufficient Supporting Documentation by Product Type and Number of Required Documents
Product Type Number of Required Supporting
Documents
Rejection Rate due to
Missing/Insufficient Supporting
Documentation*
Appliances (N=1,232) 1 19%
HVAC (N=70) Up to 4 26%
Insulation (N=249) Up to 3 51%
Windows (N=43) Up to 4 40%
*Rejection rate was calculated based on number of applications rejected due to missing/insufficient supporting
documentation by the number of applications rejected due to missing information.
To further reduce potential confusion, the supporting documentation requirements should be as simple
and clear as possible for customers to understand. Clearly stating the required documents in large,
bolded text may help customers remember to provide them. Rocky Mountain Power’s 2011 and early
2012 applications presented the list of required documents on the third page of the application,
however Rocky Mountain Power’s 2012 incentive applications meet this best practice by clearly stating
the required documents on the first page making it easier for the customer to know which documents to
save through their participation process. However, there are vague instructions included in this list of
required documents that notes the participant must submit any additional required documentation
noted in the form’s incentive section. Breaking up the list of requirements and providing the information
in two separate sections of the form may confuse customers. Further, some of the additional
documentation requirements noted on select products’ applications (e.g., HVAC and insulation) include
savings calculation workbooks and best practice installation worksheets. It is not stated on the form that
the installation contractor must fill these documents out so the customer may be confused by who is
responsible for this requirement or where to find these documents.
Best Practice 4: Reduce Redundancy between Supporting Documentation and the Form to Improve
the Applications’ Ease of Use
Ensure each required supporting document is not something the program administrator can find using
other provided information (i.e., determining equipment efficiencies or AHRI ratings from a model
number). Determining which data fields may provide redundant information may help Rocky Mountain
Power discover ways to reduce the number of supporting documents the customer is required to attach.
Likewise, applications should not be rejected if required information is missing from the incentive form
but can be found on the required itemized invoice or receipt. For example, Rocky Mountain Power’s
appliance application requires that customers fill out the model number, serial number, and quantity of
the measure purchased. If this information can be determined from the provided supporting
documents, the application should move forward with processing.

Wyoming HES 2011‐2012 Evaluation Appendix M10
Missing Specifications:
A third reason for form rejection is due to missing product or services specifications.
Best Practice 5: Encourage Trade Allies to Fill Out Required Paperwork
Nearly all HES non‐lighting participants (94%) reported hiring a contractor to install their program
measures, indicating many customers have significant contact with their service professional. It is more
important to simplify forms and language for residential customers than it is for trade allies. The forms
that trade allies fill out for customers can be more complex. Some of the technical information required
for the HVAC and insulation applications seems more appropriate for the contractor to fill out than the
customer (e.g., pre‐ and post‐installation R‐values or contractor certification numbers), however it is not
stated that these data fields are the contractor’s responsibility.
Focus on Energy’s established trade ally network provides a good example of contractors understanding
the importance of assisting customers with required program paperwork. In a recent evaluation
conducted by Cadmus for Focus on Energy in Wisconsin, interviewed trade allies reported filling out
paperwork for their customers because their customers struggled with the paperwork, were unable to
get the paperwork in within the deadline, or submitted the paperwork without the proper
documentation. One trade ally specified they used filling out the paperwork as a selling point for their
customers.
Most of the interviewed trade allies (57%) reported assisting their customers in completing the HES
incentive application, and all of these trade allies found the application easy to fill out. Continuing to
encourage trade allies to fill out the paperwork through training or bonuses may help decrease the
percentage of rejected applications and increase customer satisfaction.
Ineligible
The high rate of rejected applications is also due to customers submitting applications for products or
services that do not meet HES Program requirements. As shown in Figure M1, this is most common
among appliance applications.
Best Practice 6: Utilize a Paperless Application Process
Energy efficiency programs should use an electronic application process where online forms are readily
accessible to customers, subcontractors, trade allies and program administration staff (Pacific Gas and
Electric Company 2013). A paperless application process streamlines the customer submission, data
validation, and fulfillment processes (Reynolds 2007).
In 2011, Rocky Mountain Power met this best practice for their appliance rebates by offering online
applications to facilitate trade ally participation and promote the HES Program. The online applications
cover most qualifying products, including appliances and light fixtures, but do not cover trade ally‐
installed measures that require testing and documentation. Although the appliance applications can be
filled out and submitted online, participants are still required to mail their supporting documentation
(i.e., receipts for purchased equipment).

Wyoming HES 2011‐2012 Evaluation Appendix M11
An increasing standard practice across programs is to use portable document format (PDF) forms that
are fillable and savable by the end user. This helps avoid repetitive entry for return customers, and can
help reduce errors since the form fields can be set to restrict inputs.
Error messages can be programmed into online forms if incorrect inputs are entered. Many utilities use
programming and error messages to reduce the number of applications submitted for ineligible
products. If a model number is entered into the online form, an error message will inform the customer
the product does not qualify for an incentive. Online applications may also reduce the number of
applications submitted because a customer forgot to fill in one or two data fields. Customer input fields
can be marked as required so that the customer cannot finish and submit the application until all the
information is included.
Program administrator staff, as noted above, should continue to encourage trade allies to assist
customers in filling out the HES incentive applications. Contractors are slowly entering the computer
age. For those who are already there, there is a need for simpler ways to fill out forms, rather than
requiring repetitive writing on printed out forms (Heinemeier 2012). At a minimum, forms should be
PDF forms rather than flat documents, similar to the HES appliance application. Half of the programs’
incentive forms we compared (four of seven) use fillable PDFs. To increase the application’s ease of use,
customers should be able to save their applications in case they need to fill them out in multiple
sessions.
References Arizona Public Service Company. “APS Home Performance with ENERGY STAR.” Last modified March 12,
2013. Accessed April 16, 2013.
http://www.azhomeperformance.com/documents/1207021HomePerfRebateForm‐2‐12_r3.pdf.
Avista Utilities. “Idaho Home Improvement Rebates.” Last modified February, 2013. Accessed June 26,
2013.
https://www.avistautilities.com/savings/rebates/Documents/Avista_HomeImprovementRebate
s‐ID‐0213%20editable.pdf.
Efficiency Vermont. “Refrigerator Rebate.” Last modified June 3, 2013. Accessed June 20, 2013.
http://www.efficiencyvermont.com/docs/for_my_home/rebate_forms/Refrigerator_Rebate_Eff
iciencyVermont.pdf.
Flathead Electric. “ENERGY STAR Appliance Incentive Program.” Last modified April 1, 2011. Accessed
April 16, 2013. http://www.flatheadelectric.com/energy/PDF/ESApplianceForm.pdf.
Flathead Electric. “Energy Fix Insulation & Window Rebate Application.” Last modified April 1, 2013.
Accessed April 16, 2013. http://www.flatheadelectric.com/energy/PDF/RebateApp.pdf.

Wyoming HES 2011‐2012 Evaluation Appendix M12
Focus on Energy. “Focus On Energy Calendar Year 2012 Evaluation Report Volume II.” Last modified
August 28, 2013. Accessed September 3, 2013.
http://www.focusonenergy.com/sites/default/files/CY2012_VolII_082813_0.pdf.
Heinemeier, Kristin. “Contractors Walk on the Wild Side: Why?” In Proceedings of the 2012 ACEEE
Summer Study on Energy Efficiency in Buildings. Washington, DC: American Council for an
Energy‐Efficient Economy. Available online: http://wcec.ucdavis.edu/wp‐
content/uploads/2012/05/Kristin‐Heinemeier‐ACEEE‐2012.pdf.
Idaho Power. “Idaho Power Home Products Program Incentive Application.” Last modified March, 2013.
Accessed April 16, 2013.
https://www.idahopower.com/pdfs/EnergyEfficiency/HomeProducts/IncentiveApplication_curr
ent.pdf.
Montana‐Dakota Utilities Co. “Montana Residential Electric Cooling Rebate Application.” Last modified
August, 2012. Accessed April 16, 2013. http://www.montana‐dakota.com/docs/default‐
source/rebate‐offerings/2012_mdu_mt_rescooling.pdf?sfvrsn=0
Montana‐Dakota Utilities Co. “Montana Residential Electric Compact Fluorescent Light Bulbs Rebate
Application.” Last modified August, 2012. Accessed April 16, 2013. http://www.montana‐
dakota.com/docs/default‐source/rebate‐offerings/2012_mdu_mt_rescfl.pdf?sfvrsn=0
Northwestern Energy. “Home Lighting Rebate.” Last modified April, 2013. Accessed April 16, 2013.
http://www.northwesternenergy.com/docs/default‐source/documents/E‐
Programs/3445Brochure.pdf?sfvrsn=2.
Pacific Gas and Electric Company. “Best Practices Benchmarking for Energy Efficiency Programs.”
Accessed September 2013. Available online: http://eebestpractices.com/index.asp.
Parago. Rebate Best Practices Version 1.0 2012. 2012. Available online:
http://www.parago.com/marketing/pdfs/RebateBestPractices2012.pdf.
Reynolds, Mike. “Rebate Processing Best Practices.” Presentation at the Federal Trade Commission
Conference, San Francisco, California, April 27, 2007. Available online:
http://www.ftc.gov/bcp/workshops/rebatedebate/presentations/Reynolds.pdf.
Vectren Ohio. “Application for Residential Appliance/Product Rebates.” Last modified October 25, 2012.
Accessed May 22, 2013.
https://www.vectren.com/cms/assets/pdfs/rebates/oh_res_rebate_2012.pdf.

Wyoming HES 2011‐2012 Evaluation Appendix N1
Appendix N. Wyoming Measure Group Cost‐Effectiveness
Cost‐effectiveness was completed at the measure group level, and reported for both evaluated gross
savings, and evaluated net savings. Cost‐effectiveness inputs for both gross and net results are shown in
Table N1. Gross results use a net‐to‐gross (NTG) value of 1, while net results apply the evaluated NTG to
the evaluated gross savings.

Wyoming HES 2011‐2012 Evaluation Appendix N2
Table N1. Wyoming Measure Group Cost‐Effectiveness Inputs
Input Description 2011 2012 Total
Average Measure Life*
Appliance 15 15 15
Home Electronics 6 6 6
HVAC 16 19 19
Lighting 5 5 5
New Homes 30 N/A 30
Weatherization 31 30 30
Evaluated Energy Savings (kWh/year)**
Appliance 364,273 220,534 584,807
Home Electronics 18,926 198,412 217,338
HVAC 1,586 24,877 26,463
Lighting 3,559,445 4,093,780 7,653,224
New Homes 4,023 ‐ 4,023
Weatherization 96,074 243,985 340,059
Total Utility Costs (including incentives)***
Appliance $170,771 $79,110 $249,881
Home Electronics $10,001 $92,575 $102,576
HVAC $2,921 $7,141 $10,061
Lighting $642,133 $537,561 $1,179,694
New Homes $2,157 $0 $2,157
Weatherization $211,017 $93,844 $304,861
Incentives
Appliance $127,135 $67,029 $194,164
Home Electronics $7,215 $75,825 $83,040
HVAC $2,750 $5,925 $8,675
Lighting $150,538 $214,157 $364,695
New Homes $1,770 $0 $1,770
Weatherization $201,734 $80,395 $282,130
Retail Rate 0.091 0.1002 N/A
* Weighted average measure category lives are based on individual measure lifetimes, and weighted by savings and frequency of installations. ** Evaluated Savings reflect impacts at the customer meter. *** Program costs and incentives are provided by Rocky Mountain Power in annual report data. Rocky Mountain Power allocates program cost by weighted savings.
Appliances Cost‐effectiveness results for net savings are shown in Table N2 to Table N4. The appliances measure
group was cost‐effective only from the UCT and PCT perspectives (Table N2).
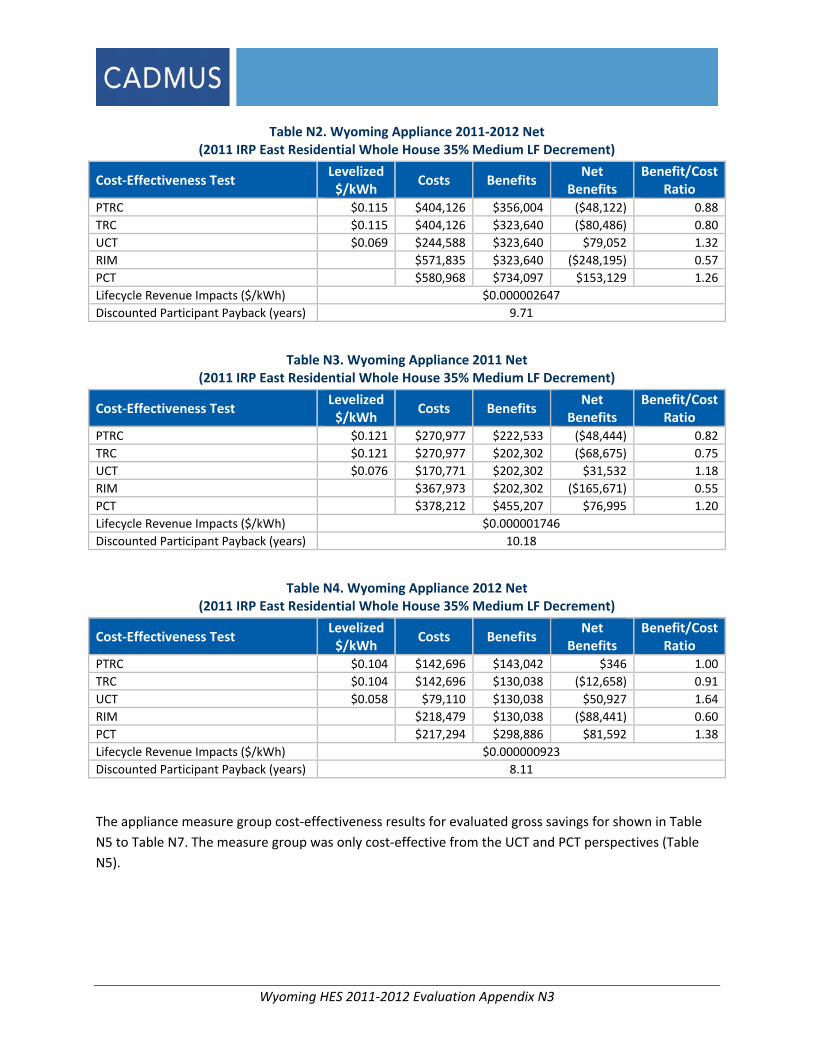
Wyoming HES 2011‐2012 Evaluation Appendix N3
Table N2. Wyoming Appliance 2011‐2012 Net (2011 IRP East Residential Whole House 35% Medium LF Decrement)
Cost‐Effectiveness Test Levelized $/kWh
Costs Benefits Net
Benefits Benefit/Cost
Ratio PTRC $0.115 $404,126 $356,004 ($48,122) 0.88
TRC $0.115 $404,126 $323,640 ($80,486) 0.80
UCT $0.069 $244,588 $323,640 $79,052 1.32
RIM $571,835 $323,640 ($248,195) 0.57
PCT $580,968 $734,097 $153,129 1.26
Lifecycle Revenue Impacts ($/kWh) $0.000002647
Discounted Participant Payback (years) 9.71
Table N3. Wyoming Appliance 2011 Net (2011 IRP East Residential Whole House 35% Medium LF Decrement)
Cost‐Effectiveness Test Levelized $/kWh
Costs Benefits Net
Benefits Benefit/Cost
Ratio PTRC $0.121 $270,977 $222,533 ($48,444) 0.82
TRC $0.121 $270,977 $202,302 ($68,675) 0.75
UCT $0.076 $170,771 $202,302 $31,532 1.18
RIM $367,973 $202,302 ($165,671) 0.55
PCT $378,212 $455,207 $76,995 1.20
Lifecycle Revenue Impacts ($/kWh) $0.000001746
Discounted Participant Payback (years) 10.18
Table N4. Wyoming Appliance 2012 Net (2011 IRP East Residential Whole House 35% Medium LF Decrement)
Cost‐Effectiveness Test Levelized $/kWh
Costs Benefits Net
Benefits Benefit/Cost
Ratio PTRC $0.104 $142,696 $143,042 $346 1.00
TRC $0.104 $142,696 $130,038 ($12,658) 0.91
UCT $0.058 $79,110 $130,038 $50,927 1.64
RIM $218,479 $130,038 ($88,441) 0.60
PCT $217,294 $298,886 $81,592 1.38
Lifecycle Revenue Impacts ($/kWh) $0.000000923
Discounted Participant Payback (years) 8.11
The appliance measure group cost‐effectiveness results for evaluated gross savings for shown in Table
N5 to Table N7. The measure group was only cost‐effective from the UCT and PCT perspectives (Table
N5).

Wyoming HES 2011‐2012 Evaluation Appendix N4
Table N5. Wyoming Appliance 2011‐2012 Gross (2011 IRP East Residential Whole House 35% Medium LF Decrement)
Cost‐Effectiveness Test Levelized $/kWh
Costs Benefits Net
Benefits Benefit/Cost
Ratio PTRC $0.109 $635,878 $592,261 ($43,617) 0.93
TRC $0.109 $635,878 $538,419 ($97,459) 0.85
UCT $0.042 $244,588 $538,419 $293,830 2.20
RIM $789,007 $538,419 ($250,588) 0.68
PCT $580,968 $734,097 $153,129 1.26
Lifecycle Revenue Impacts ($/kWh) $0.000002672
Discounted Participant Payback (years) 9.71
Table N6. Wyoming Appliance 2011 Gross (2011 IRP East Residential Whole House 35% Medium LF Decrement)
Cost‐Effectiveness Test Levelized $/kWh
Costs Benefits Net
Benefits Benefit/Cost
Ratio PTRC $0.113 $421,848 $370,213 ($51,635) 0.88
TRC $0.113 $421,848 $336,557 ($85,291) 0.80
UCT $0.046 $170,771 $336,557 $165,786 1.97
RIM $498,843 $336,557 ($162,287) 0.67
PCT $378,212 $455,207 $76,995 1.20
Lifecycle Revenue Impacts ($/kWh) $0.000001710
Discounted Participant Payback (years) 10.18
Table N7. Wyoming Appliance 2012 Gross (2011 IRP East Residential Whole House 35% Medium LF Decrement)
Cost‐Effectiveness Test Levelized $/kWh
Costs Benefits Net
Benefits Benefit/Cost
Ratio PTRC $0.101 $229,376 $237,969 $8,593 1.04
TRC $0.101 $229,376 $216,335 ($13,040) 0.94
UCT $0.035 $79,110 $216,335 $137,225 2.73
RIM $310,968 $216,335 ($94,633) 0.70
PCT $217,294 $298,886 $81,592 1.38
Lifecycle Revenue Impacts ($/kWh) $0.000000987
Discounted Participant Payback (years) 8.11

Wyoming HES 2011‐2012 Evaluation Appendix N5
Home Electronics Cost‐effectiveness results for net savings are shown in Table N8 to Table N10. The home electronics
measure group was not cost‐effective from any perspective (Table N8).
Table N8. Wyoming Home Electronics 2011‐2012 Net (2011 IRP East Residential Whole House 35% Medium LF Decrement)
Cost‐Effectiveness Test Levelized $/kWh
Costs Benefits Net
Benefits Benefit/Cost
Ratio PTRC $0.304 $197,370 $57,114 ($140,256) 0.29
TRC $0.304 $197,370 $51,922 ($145,448) 0.26
UCT $0.148 $96,382 $51,922 ($44,460) 0.54
RIM $157,578 $51,922 ($105,655) 0.33
PCT $312,270 $184,750 ($127,519) 0.59
Lifecycle Revenue Impacts ($/kWh) $0.000003489
Discounted Participant Payback (years) N/A
Table N9. Wyoming Home Electronics 2011 Net (2011 IRP East Residential Whole House 35% Medium LF Decrement)
Cost‐Effectiveness Test PTRC $0.327 $19,438 $4,974 ($14,465) 0.26
TRC $0.327 $19,438 $4,521 ($14,917) 0.23
UCT $0.168 $10,001 $4,521 ($5,480) 0.45
RIM $14,895 $4,521 ($10,374) 0.30
PCT $29,058 $15,755 ($13,303) 0.54
Lifecycle Revenue Impacts ($/kWh) $0.000000347
Discounted Participant Payback (years) N/A
Table N10. Wyoming Home Electronics 2012 Net (2011 IRP East Residential Whole House 35% Medium LF Decrement)
Cost‐Effectiveness Test Levelized $/kWh
Costs Benefits Net
Benefits Benefit/Cost
Ratio PTRC $0.301 $190,689 $55,879 ($134,810) 0.29
TRC $0.301 $190,689 $50,799 ($139,890) 0.27
UCT $0.146 $92,575 $50,799 ($41,776) 0.55
RIM $152,912 $50,799 ($102,113) 0.33
PCT $303,518 $181,112 ($122,406) 0.60
Lifecycle Revenue Impacts ($/kWh) $0.000002801
Discounted Participant Payback (years) N/A
The Home Electronics measure group cost‐effectiveness results for evaluated gross savings for shown in
Table N11 to Table N13. The measure group was not cost‐effective from any perspective (Table N11).
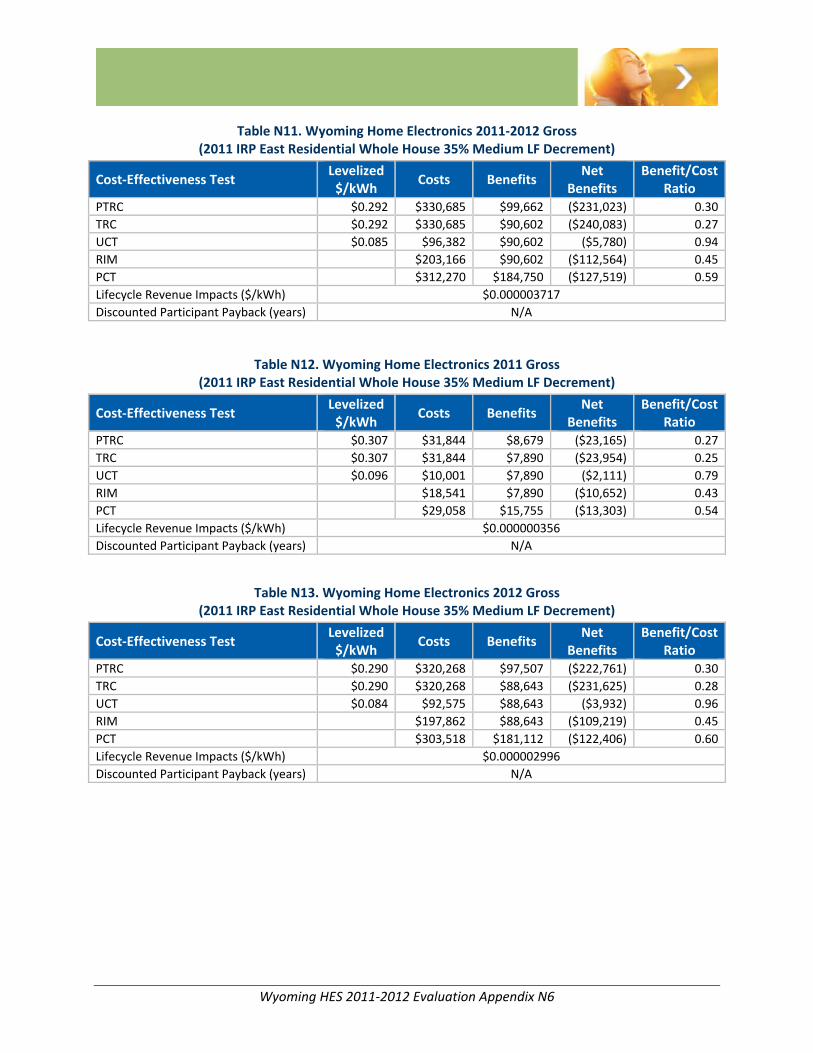
Wyoming HES 2011‐2012 Evaluation Appendix N6
Table N11. Wyoming Home Electronics 2011‐2012 Gross (2011 IRP East Residential Whole House 35% Medium LF Decrement)
Cost‐Effectiveness Test Levelized $/kWh
Costs Benefits Net
Benefits Benefit/Cost
Ratio PTRC $0.292 $330,685 $99,662 ($231,023) 0.30
TRC $0.292 $330,685 $90,602 ($240,083) 0.27
UCT $0.085 $96,382 $90,602 ($5,780) 0.94
RIM $203,166 $90,602 ($112,564) 0.45
PCT $312,270 $184,750 ($127,519) 0.59
Lifecycle Revenue Impacts ($/kWh) $0.000003717
Discounted Participant Payback (years) N/A
Table N12. Wyoming Home Electronics 2011 Gross (2011 IRP East Residential Whole House 35% Medium LF Decrement)
Cost‐Effectiveness Test Levelized $/kWh
Costs Benefits Net
Benefits Benefit/Cost
Ratio PTRC $0.307 $31,844 $8,679 ($23,165) 0.27
TRC $0.307 $31,844 $7,890 ($23,954) 0.25
UCT $0.096 $10,001 $7,890 ($2,111) 0.79
RIM $18,541 $7,890 ($10,652) 0.43
PCT $29,058 $15,755 ($13,303) 0.54
Lifecycle Revenue Impacts ($/kWh) $0.000000356
Discounted Participant Payback (years) N/A
Table N13. Wyoming Home Electronics 2012 Gross (2011 IRP East Residential Whole House 35% Medium LF Decrement)
Cost‐Effectiveness Test Levelized $/kWh
Costs Benefits Net
Benefits Benefit/Cost
Ratio PTRC $0.290 $320,268 $97,507 ($222,761) 0.30
TRC $0.290 $320,268 $88,643 ($231,625) 0.28
UCT $0.084 $92,575 $88,643 ($3,932) 0.96
RIM $197,862 $88,643 ($109,219) 0.45
PCT $303,518 $181,112 ($122,406) 0.60
Lifecycle Revenue Impacts ($/kWh) $0.000002996
Discounted Participant Payback (years) N/A

Wyoming HES 2011‐2012 Evaluation Appendix N7
HVAC HVAC measure group cost‐effectiveness results for net evaluated savings are shown in Table N14 to
Table N16. The HVAC measure group was cost‐effective from the UCT and PCT perspective (Table N14).
Table N14. Wyoming HVAC 2011‐2012 Net (2011 IRP East Residential Whole House 35% Medium LF Decrement)
Cost‐Effectiveness Test Levelized $/kWh
Costs Benefits Net
Benefits Benefit/Cost
Ratio PTRC $0.117 $20,484 $17,364 ($3,119) 0.85
TRC $0.117 $20,484 $15,786 ($4,698) 0.77
UCT $0.055 $9,584 $15,786 $6,202 1.65
RIM $27,707 $15,786 ($11,921) 0.57
PCT $32,220 $38,725 $6,505 1.20
Lifecycle Revenue Impacts ($/kWh) $0.000000127
Discounted Participant Payback (years) 13.95
Table N15. Wyoming HVAC 2011 Net (2011 IRP East Residential Whole House 35% Medium LF Decrement)
Cost‐Effectiveness Test Levelized $/kWh
Costs Benefits Net
Benefits Benefit/Cost
Ratio PTRC $0.686 $6,976 $970 ($6,006) 0.14
TRC $0.686 $6,976 $882 ($6,094) 0.13
UCT $0.287 $2,921 $882 ($2,039) 0.30
RIM $3,820 $882 ($2,938) 0.23
PCT $11,433 $4,260 ($7,173) 0.37
Lifecycle Revenue Impacts ($/kWh) $0.000000034
Discounted Participant Payback (years) N/A
Table N16. Wyoming HVAC 2012 Net (2011 IRP East Residential Whole House 35% Medium LF Decrement)
Cost‐Effectiveness Test Levelized $/kWh
Costs Benefits Net
Benefits Benefit/Cost
Ratio PTRC $0.082 $14,476 $17,570 $3,094 1.21
TRC $0.082 $14,476 $15,973 $1,497 1.10
UCT $0.040 $7,141 $15,973 $8,832 2.24
RIM $25,599 $15,973 ($9,627) 0.62
PCT $22,277 $36,935 $14,658 1.66
Lifecycle Revenue Impacts ($/kWh) $0.000000100
Discounted Participant Payback (years) 7.76
HVAC measure group cost‐effectiveness results for evaluated gross savings shown in Table N17 to Table
N19. The measure group was cost‐effective from the UCT and PCT perspective (Table N17).

Wyoming HES 2011‐2012 Evaluation Appendix N8
Table N17. Wyoming HVAC 2011‐2012 Gross (2011 IRP East Residential Whole House 35% Medium LF Decrement)
Cost‐Effectiveness Test Levelized $/kWh
Costs Benefits Net
Benefits Benefit/Cost
Ratio PTRC $0.114 $33,525 $29,404 ($4,121) 0.88
TRC $0.114 $33,525 $26,731 ($6,794) 0.80
UCT $0.033 $9,584 $26,731 $17,147 2.79
RIM $40,030 $26,731 ($13,299) 0.67
PCT $32,220 $38,725 $6,505 1.20
Lifecycle Revenue Impacts ($/kWh) $0.000000142
Discounted Participant Payback (years) 13.95
Table N18. Wyoming HVAC 2011 Gross (2011 IRP East Residential Whole House 35% Medium LF Decrement)
Cost‐Effectiveness Test Levelized $/kWh
Costs Benefits Net
Benefits Benefit/Cost
Ratio PTRC $0.679 $11,604 $1,861 ($9,743) 0.16
TRC $0.679 $11,604 $1,692 ($9,912) 0.15
UCT $0.171 $2,921 $1,692 ($1,229) 0.58
RIM $4,431 $1,692 ($2,739) 0.38
PCT $11,433 $4,260 ($7,173) 0.37
Lifecycle Revenue Impacts ($/kWh) $0.000000032
Discounted Participant Payback (years) N/A
Table N19. Wyoming HVAC 2012 Gross (2011 IRP East Residential Whole House 35% Medium LF Decrement)
Cost‐Effectiveness Test Levelized $/kWh
Costs Benefits Net
Benefits Benefit/Cost
Ratio PTRC $0.079 $23,493 $29,518 $6,025 1.26
TRC $0.079 $23,493 $26,834 $3,341 1.14
UCT $0.024 $7,141 $26,834 $19,693 3.76
RIM $38,151 $26,834 ($11,317) 0.70
PCT $22,277 $36,935 $14,658 1.66
Lifecycle Revenue Impacts ($/kWh) $0.000000118
Discounted Participant Payback (years) 7.76
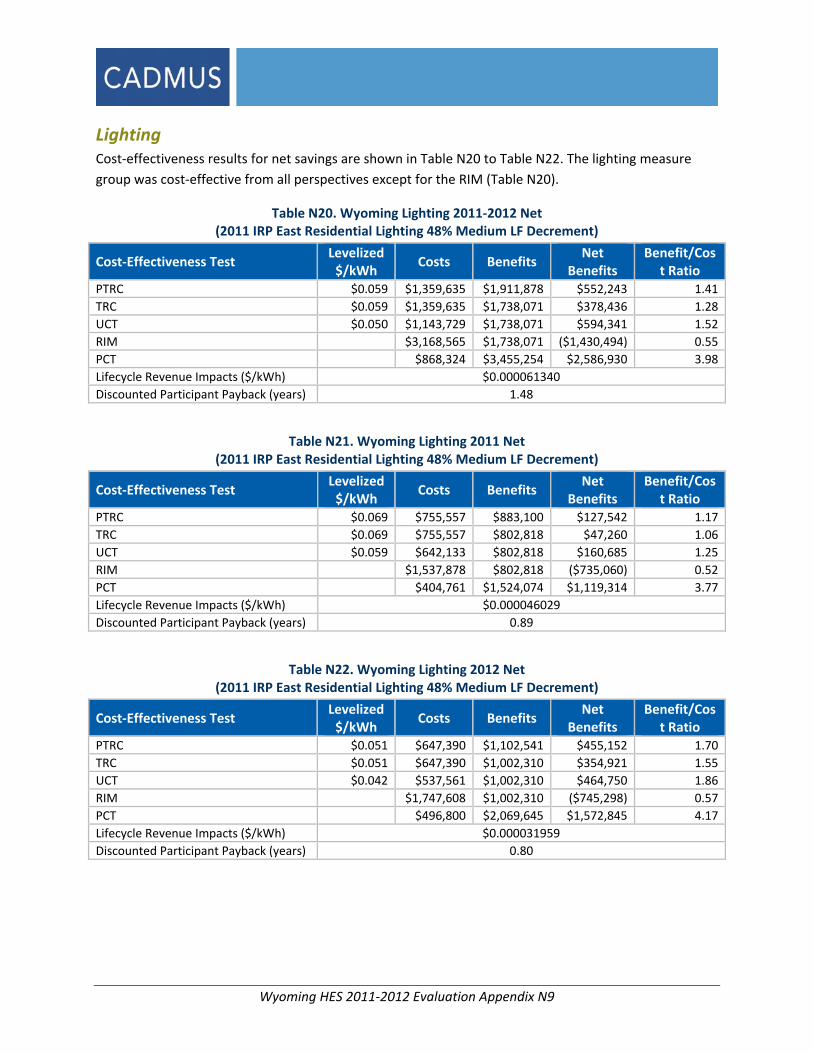
Wyoming HES 2011‐2012 Evaluation Appendix N9
Lighting Cost‐effectiveness results for net savings are shown in Table N20 to Table N22. The lighting measure
group was cost‐effective from all perspectives except for the RIM (Table N20).
Table N20. Wyoming Lighting 2011‐2012 Net (2011 IRP East Residential Lighting 48% Medium LF Decrement)
Cost‐Effectiveness Test Levelized $/kWh
Costs Benefits Net
Benefits Benefit/Cos
t Ratio PTRC $0.059 $1,359,635 $1,911,878 $552,243 1.41
TRC $0.059 $1,359,635 $1,738,071 $378,436 1.28
UCT $0.050 $1,143,729 $1,738,071 $594,341 1.52
RIM $3,168,565 $1,738,071 ($1,430,494) 0.55
PCT $868,324 $3,455,254 $2,586,930 3.98
Lifecycle Revenue Impacts ($/kWh) $0.000061340
Discounted Participant Payback (years) 1.48
Table N21. Wyoming Lighting 2011 Net (2011 IRP East Residential Lighting 48% Medium LF Decrement)
Cost‐Effectiveness Test Levelized $/kWh
Costs Benefits Net
Benefits Benefit/Cos
t Ratio PTRC $0.069 $755,557 $883,100 $127,542 1.17
TRC $0.069 $755,557 $802,818 $47,260 1.06
UCT $0.059 $642,133 $802,818 $160,685 1.25
RIM $1,537,878 $802,818 ($735,060) 0.52
PCT $404,761 $1,524,074 $1,119,314 3.77
Lifecycle Revenue Impacts ($/kWh) $0.000046029
Discounted Participant Payback (years) 0.89
Table N22. Wyoming Lighting 2012 Net (2011 IRP East Residential Lighting 48% Medium LF Decrement)
Cost‐Effectiveness Test Levelized $/kWh
Costs Benefits Net
Benefits Benefit/Cos
t Ratio PTRC $0.051 $647,390 $1,102,541 $455,152 1.70
TRC $0.051 $647,390 $1,002,310 $354,921 1.55
UCT $0.042 $537,561 $1,002,310 $464,750 1.86
RIM $1,747,608 $1,002,310 ($745,298) 0.57
PCT $496,800 $2,069,645 $1,572,845 4.17
Lifecycle Revenue Impacts ($/kWh) $0.000031959
Discounted Participant Payback (years) 0.80

Wyoming HES 2011‐2012 Evaluation Appendix N10
The lighting measure group cost‐effectiveness results for evaluated gross savings shown in Table N23
and Table N25. The measure group was cost‐effective from all test perspectives except for the RIM
(Table N23).
Table N23. Wyoming Lighting 2011‐2012 Gross (2011 IRP East Residential Lighting 48% Medium LF Decrement)
Cost‐Effectiveness Test Levelized $/kWh
Costs Benefits Net
Benefits Benefit/Cos
t Ratio PTRC $0.047 $1,661,686 $2,931,677 $1,269,991 1.76
TRC $0.047 $1,661,686 $2,665,161 $1,003,475 1.60
UCT $0.033 $1,143,729 $2,665,161 $1,521,432 2.33
RIM $4,248,616 $2,665,161 ($1,583,456) 0.63
PCT $868,324 $3,455,254 $2,586,930 3.98
Lifecycle Revenue Impacts ($/kWh) $0.000067899
Discounted Participant Payback (years) 1.48
Table N24. Wyoming Lighting 2011 Gross
(2011 IRP East Residential Lighting 48% Medium LF Decrement)
Cost‐Effectiveness Test Levelized $/kWh
Costs Benefits Net
Benefits Benefit/Cos
t Ratio PTRC $0.053 $896,356 $1,354,147 $457,791 1.51
TRC $0.053 $896,356 $1,231,042 $334,687 1.37
UCT $0.038 $642,133 $1,231,042 $588,909 1.92
RIM $2,015,669 $1,231,042 ($784,627) 0.61
PCT $404,761 $1,524,074 $1,119,314 3.77
Lifecycle Revenue Impacts ($/kWh) $0.000049132
Discounted Participant Payback (years) 0.89
Table N25. Wyoming Lighting 2012 Gross (2011 IRP East Residential Lighting 48% Medium LF Decrement)
Cost‐Effectiveness Test Levelized $/kWh
Costs Benefits Net
Benefits Benefit/Cos
t Ratio PTRC $0.042 $820,204 $1,690,639 $870,435 2.06
TRC $0.042 $820,204 $1,536,945 $716,740 1.87
UCT $0.027 $537,561 $1,536,945 $999,384 2.86
RIM $2,393,049 $1,536,945 ($856,105) 0.64
PCT $496,800 $2,069,645 $1,572,845 4.17
Lifecycle Revenue Impacts ($/kWh) $0.000036710
Discounted Participant Payback (years) 0.80

Wyoming HES 2011‐2012 Evaluation Appendix N11
New Homes Cost‐effectiveness results for net savings are shown in Table N26. The new homes measure group was
cost‐effective from the UCT and PCT perspectives (Table N26). Cadmus applied the insulation billing
analysis realization results to new homes measures, hence there is no NTG adjustment; therefore gross
results are not provided.
Table N26. Wyoming New Homes 2011 Net (2011 IRP East Residential Whole House 35% Medium LF Decrement)
Cost‐Effectiveness Test Levelized $/kWh
Costs Benefits Net
Benefits Benefit/Cost
Ratio PTRC $0.122 $6,949 $5,584 ($1,365) 0.80
TRC $0.122 $6,949 $5,076 ($1,873) 0.73
UCT $0.038 $2,156 $5,076 $2,920 2.35
RIM $7,541 $5,076 ($2,464) 0.67
PCT $6,563 $7,155 $592 1.09
Lifecycle Revenue Impacts ($/kWh) $0.000000021
Discounted Participant Payback (years) 23.41

Wyoming HES 2011‐2012 Evaluation Appendix N12
Weatherization Weatherization measure group cost‐effectiveness results for net evaluated savings are shown in Table
N27 to Table N29. The weatherization measure group was only cost‐effective from the UCT and PCT
perspectives (Table N27). The weatherization measure billing analysis estimated net savings, hence
there is no NTG adjustment; therefore gross results are not provided.
Table N27. Wyoming Weatherization 2011‐2012 Net (2011 IRP East Residential Whole House 35% Medium LF Decrement)
Cost‐Effectiveness Test Levelized $/kWh
Costs Benefits Net
Benefits Benefit/Cost
Ratio PTRC $0.134 $620,984 $465,946 ($155,038) 0.75
TRC $0.134 $620,984 $423,588 ($197,396) 0.68
UCT $0.065 $298,583 $423,588 $125,004 1.42
RIM $786,459 $423,588 ($362,871) 0.54
PCT $599,152 $764,627 $165,475 1.28
Lifecycle Revenue Impacts ($/kWh) $0.000002826
Discounted Participant Payback (years) 14.98
Table N28. Wyoming Weatherization 2011 Net (2011 IRP East Residential Whole House 35% Medium LF Decrement)
Cost‐Effectiveness Test Levelized $/kWh
Costs Benefits Net
Benefits Benefit/Cost
Ratio PTRC $0.326 $444,232 $134,196 ($310,036) 0.30
TRC $0.326 $444,232 $121,996 ($322,236) 0.27
UCT $0.155 $211,017 $121,996 ($89,021) 0.58
RIM $340,314 $121,996 ($218,317) 0.36
PCT $434,949 $331,031 ($103,919) 0.76
Lifecycle Revenue Impacts ($/kWh) $0.000001700
Discounted Participant Payback (years) N/A
Table N29. Wyoming Weatherization 2012 Net (2011 IRP East Residential Whole House 35% Medium LF Decrement)
Cost‐Effectiveness Test Levelized $/kWh
Costs Benefits Net
Benefits Benefit/Cost
Ratio PTRC $0.054 $189,425 $355,537 $166,112 1.88
TRC $0.054 $189,425 $323,215 $133,790 1.71
UCT $0.027 $93,844 $323,215 $229,371 3.44
RIM $478,134 $323,215 ($154,919) 0.68
PCT $175,976 $464,685 $288,709 2.64
Lifecycle Revenue Impacts ($/kWh) $0.000001207
Discounted Participant Payback (years) 4.25